
 Open Access Article
 This Open Access Article is licensed under a
 Creative Commons Attribution 3.0 Unported Licence
Hydrothermal microwave synthesis of water soluble NIR-II emitting Ag2S quantum dots†
Omar El-Dahshan ab,
Aurelien Deniauda,
Wai Li Lingc,
K. David Wegnerd,
Olivier Prouxe,
Giulia Veronesia and
Peter Reiss*b
ab,
Aurelien Deniauda,
Wai Li Lingc,
K. David Wegnerd,
Olivier Prouxe,
Giulia Veronesia and
Peter Reiss*b
aUniv. Grenoble Alpes, CNRS, CEA Grenoble, IRIG, CBM, 17 Rue des Martyrs, Grenoble 38000, France
bUniv. Grenoble Alpes, CEA Grenoble, CNRS, Grenoble INP, IRIG, SyMMES, STEP, 17 Rue des Martyrs, Grenoble 38000, France. E-mail: peter.reiss@cea.fr
cUniv. Grenoble Alpes, CEA Grenoble, CNRS, IBS, 71 Rue des Martyrs, Grenoble 38000, France
dDivision Biophotonics, Federal Institute of Materials Research and Testing (BAM), Berlin, 12489, Germany
eUniv. Grenoble Alpes, CNRS, IRD, INRAE, Météo France, OSUG, UAR 832, Grenoble 38000, France
First published on 6th May 2025
Abstract
Hydrothermal-based synthetic methods of quantum dots allow for the exploration of reaction parameters normally inaccessible to typical aqueous-based batch reactions, such as elevated reaction temperatures (>100 °C) and reaction pressures above atmospheric pressure. Coupled with microwave heating, new instantaneously bio-compatible quantum dots (QDs) with enhanced opitcal properties can be yielded. As of today, aqueous-based synthetic methods often lag behind their organic analogues in terms of the photophysical properties of the QDs obtained and the ease of modulation of both the emission wavelength and crystallite size. Using a novel microwave-assisted hydrothermal approach, the synthesis of silver sulphide (Ag2S) QDs exhibiting NIR emission spanning the biological transparency windows via modulation of the reaction parameters has been developed. The intrinsic link between their optical and structural properties is explored via laboratory and synchrotron-based structural analysis techniques. Their toxicity towards a hepatic cell line was assessed, and related back to their structure and size. Overall this work aims to not only further develop the repertoire of synthetic methods for the synthesis of Ag2S QDs, but also paves the way for the development of safer QDs suitable for future clinical applications.
1. Introduction
Since their initial discovery in the early 1980s,1,2 quantum dots (QDs) have become a rapidly expanding ‘hot’ research topic, gaining vast attention across a broad range of sciences, culminating in the award of the Nobel Prize in Chemistry in 2023.3Their unique optical and electronic properties including size-tuneable light emission, simultaneous excitation of multiple fluorescence colours, high signal-brightness and long term-photo stability4,5 make them ideal as candidates for use in a wide range of applications including optoelectronic devices,6 photo-catalysis,7 solar cells,8 biomedical,9–11 biosensing12,13 and bioimaging.14–16 Specifically within the field of bioimaging, their outstanding optical properties and potential for surface functionalisation with bio-molecules (such as proteins,17 antibodies,18 drug molecules19 or DNA20) make QDs prime candidates for theranostic agents, combining targeted diagnosis and therapy on a single nanoplatform. Additionally, manipulation of their size and shape can be controlled, allowing for modulation of the biodistribution and pharmacokinetics.21 As part of ongoing research into their potential application as theranostic agents, a large emphasis has been placed on QDs with strong emission specifically in the near infrared (NIR) spectral region in order to design attractive bio-imaging probes for diagnosis or targeted monitoring of biological functions or diseases from the organ to the molecular level.22,23
Defined by IUPAC as spanning from 780 to 3000 nm,24 the NIR spectral region offers significant advantages over the ultraviolet (UV) or visible range, for in vivo imaging at higher penetration depths. This region can be segmented further into three windows: the NIR-I, which stretches from 700–950 nm, the NIR-II, from 1000–1350, and the NIR-III, from 1550–1870 nm, referred to as the three biological windows, with each window exhibiting increased transparency towards biological matter, due to the decreasing attenuation coefficient of blood, skin and fatty tissue.25 Additionally, NIR emission is spectrally different from auto-fluorescence,26 with the NIR regions above 1000 nm exhibiting minimal auto-fluorescence, reducing background noise, considerably increasing the detection sensitivity and optical contrast as well as higher spatial and temporal resolution.27 Compared to UV or visible light, the lower energy NIR is less damaging towards cells25 and also exhibits lower levels of light scattering by tissue and water.28 Therefore, within the biomedical field, the long-term application of QDs relies on the development of safe, non-toxic, biocompatible QDs.
Consequently, recent work has focused on the development of safer and greener QD compositions. Silver sulphide (Ag2S) QDs have recently emerged as a promising alternative to traditional toxic binary heavy metal-containing QDs for biomedical applications due to their reportedly low cytotoxicity.27,29–31 Bulk Ag2S is intrinsically non-toxic, exhibits an ultralow solubility product constant (Ksp) (Ag2S = 6.3 × 10−50),32 minimising the release of Ag+ ions in solution and potentially in biological media and cells. Owing to its narrow band gap Ag2S QDs (Ag2S 0.9–1.1 eV)33 possess tuneable emission ranging from the Vis-Red spectral region to the NIR-II biological window.
Ag2S QDs were first synthesised in 1999 by Brelle et al.,34 with subsequent research in the 2000s demonstrating their capabilities as a bio-imaging agent.35 Research has rapidly expanded in the last ten years with a concentrated effort on the synthesis of QDs via diverse synthetic approaches, focused on precisely tuning their optical properties and size distribution,36–38 often in conjunction with toxicology studies39 and in vivo/in vitro bio-sensing,39 bio-imaging40 or theranostic studies.41
Traditionally, the synthesis of Ag2S QDs has been conducted in organic media.42 However, due to the toxic chemicals and harsh conditions exploited in organic synthesis, there has been a focus on shifting towards greener, aqueous synthetic methods allowing for the synthesis of instantly biocompatible QDs at lower temperatures without the need for phase transfer and the associated diminution of their fluorescence intensity.43 Yet as of today, the bio-applications of Ag2S QDs synthesised via aqueous approaches are limited by their poor optical properties, with observed photoluminescence quantum yields (PLQY) of less than 2%27,44 compared to their analogues synthesised in organic solvents, exhibiting PLQYs up to 20%.45 Additionally, in order to reach larger particle sizes and thus NIR emission above 1000 nm, large bulky and expensive aptamers46 or proteins,47 are frequently used, compared to the cheaper more readily available organic ligands.
More recently, the development of microwave-assisted synthesis as an alternative heating source provides a rapid and often facile synthetic approach, opening new possibilities for synthesising nano-structured materials. Compared to conventional convection heating, microwave radiation provides faster, more uniform heating rates at a lower energy cost with highly reproducible results. Yet as of today, examples of Ag2S QDs synthesised via microwave-assisted synthetic approaches fail to exhibit tuneable emission in the NIR-II window,48–50 limiting their application in bio-imaging applications.
From here on in, a novel microwave-assisted hydrothermal synthetic approach that yields a panel of directly water-soluble Ag2S QDs with tuneable emission in the NIR-II window is presented. Utilising the low-cost reagent L-glutathione (GSH) as both a capping agent and as a sulphur source, yields directly water-soluble quantum dots without the need for phase transfer or the use of bulky and expensive aptamers. Their structure, photoluminescence (PL) and the intrinsic link between both are probed, in addition to toxicity assays in order to analyse their biocompatibility.
2. Materials and methods
2.1. Chemicals
All chemicals were used as received without further purifications. L-Glutathione reduced (GSH, 97%), sodium sulphide nonahydrate (Na2S·9H2O, ACS, ≥98%) and silver nitrate (ACS, ≥99%, metal basis) were purchased from Thermo Scientific. Ammonium hydroxide (NH4OH, 28% NH3 basis) and propan-2-ol (HPLC iscoratic grade) were purchased from Carlo Erba. Milli-Q ultrapure water (18.2 MΩ cm) was used in all experimental procedures and analyses.2.2. Synthesis of GSH-capped Ag2S QDs
0.5 mmol of AgNO3 and either 1 mmol or 2 mmol of GSH were dissolved in 20 mL of de-ionised water under magnetic stirring, resulting in the formation of a white precipitate, suspended in solution under stirring. The pH of the solution was raised to pH 8 using 2.5 M NH4OH, resulting in the dissolution of the precipitate (at approximately pH 5) and the formation of a colourless solution. The solution was then transferred to a 40 mL microwave vessel, which was subsequently sealed and heated to 140 °C under microwave irradiation (CEM Discover 2.0) and magnetic stirring for a pre-determined time (ranging from 1 to 20 minutes). The resulting colloidally stable solutions ranged in colour from light brown to black. The temperature of the reaction solution under microwave irradiation was monitored via an in-built IR probe, and a constant temperature was maintained by the automated regulation of the microwave power supplied. Ag2S QDs were purified via the addition of propan-2-ol to the QD dispersion in a ratio of 3/1 (propan-2-ol/QD dispersion), followed by centrifugation at 8500 rpm for 10 minutes. The supernatant was disposed and the precipitate redispersed in de-ionised water.2.3. Synthesis of bulk Ag2S
0.25 mmol of AgNO3 and 1 mmol of Na2S were independently dissolved in 2.5 mL of deionised water to create two stock solutions. The stock solutions were mixed in the dark, resulting in the immediate formation of a black precipitate. The precipitate was collected via filtration, washed and dried in vacuo at 40 °C overnight before being stored in an amber glass vial. The X-ray diffractogram of the as-synthesised bulk Ag2S can be found in the ESI (Fig. S1†).2.4. Photophysical characterization
For all optical spectroscopy unless stated, the aqueous colloidal solutions were placed in 4 × 10 mm quartz cuvettes. Absorption spectra were recorded using a Jasco V-770 Visible/NIR spectrometer with a range of 400 to 1400 nm. PL spectra were recorded using a Flurolog FL1057 spectrophotometer equipped with a 450 W Xe lamp and a Hamamatsu R5509-73 photomultiplier tube NIR detector. An excitation wavelength of 400 nm was used if not stated otherwise, and the emission spectrum was recorded in the range of 800–1500 nm. Relative measurements of the PLQY (Φf,x) were performed using the reference dye IR125 dissolved in ethanol (Φf,st = 0.13). The relative PLQY was calculated according to the formula of Demas and Crosby, see the equation below.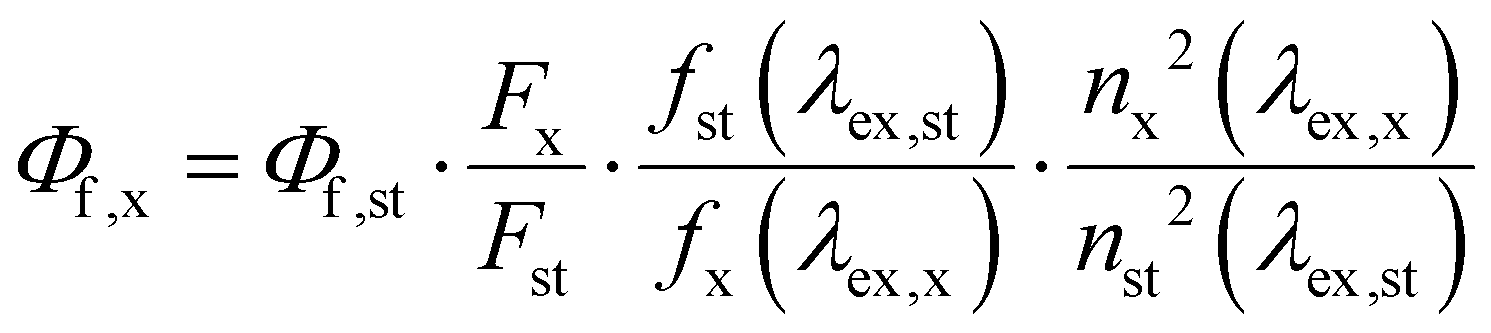
The subscripts x, st and ex denote the sample, standard and excitation, respectively. f(λex)is the absorption factor, F is the integrated spectral fluorescence photon flux and n is the refractive index of the solvents used (Ethanol for IR125; water for Ag2S QDs). An excitation wavelength of 700 nm was used for PLQY measurements. Time-resolved measurements were performed in the wavelength region of 940 ± 10 nm using a FLS 920 (Edinburgh Instruments, Edinburgh, United Kingdom) lifetime spectrofluorometer equipped with an EPL-405 (Edinburgh Instruments, Edinburgh, United Kingdom) picosecond pulsed diode laser (excitation wavelength of 405 ± 10 nm; power of 5 mW) and a fast PMT R2658P from Hamamatsu, respectively. For lifetime and PLQY measurements 10 × 10 mm quartz cuvettes were used.
2.5. Transmission electron microscopy (TEM)
Morphological characterisation was achieved via transmission electron microscopy (TEM) analysis, using a FEI Tecnai F20 Microscope and an accelerating voltage of 200 kV. TEM grids were prepared by drop-casting dilute nanocrystal suspensions onto a 400-mesh copper TEM grid covered with an ultra-thin carbon film which was subsequently dried under an ambient atmosphere. The average diameter and size distribution (the standard deviation) of the QDs were calculated based on the measurement of at least 100 nanoparticles selected by eye and ImageJ processing software.2.6. Powder X-ray diffraction (XRD)
Powder X-ray diffraction (XRD) patterns were recorded using a Bruker D8 powder diffractometer equipped with a copper anode (Kα1 = 1.5406 A, Kα2 = 1.5444 A) and an X′ celebrator 1D detector. XRD samples were prepared by drop-casting concentrated Ag2S dispersed in de-ionised water onto a clean silicon substrate (disorientated Si). The substrates supporting the samples for XRD were dried under an ambient atmosphere.2.7. X-ray absorption spectroscopy (XAS) sample preparation
Purified QD solutions were deposited on the sample holder and frozen in liquid N2 (LN2). Reference solutions for XAS analysis of Ag–GSH at a ratio of 1/2 or 1/4 of Ag![[thin space (1/6-em)]](https://www.rsc.org/images/entities/char_2009.gif) :GSH at pH 8 were prepared by mixing 0.25 mmol of AgNO3 and either 0.5 mmol or 1 mmol of GSH in 10 mL of de-ionised water and adjusting the pH to 8 using 1.25 M NH4OH. A reference compound of bulk Ag2S powder (synthesised as above) was prepared as a pellet diluted with cellulose. All liquid samples were deposited in the 3-position sample holders, equipped with Kapton windows, immediately frozen and stored in LN2 until the experiment. The size of the frozen droplets was approximately 5 mm in diameter and 2 mm thick.
:GSH at pH 8 were prepared by mixing 0.25 mmol of AgNO3 and either 0.5 mmol or 1 mmol of GSH in 10 mL of de-ionised water and adjusting the pH to 8 using 1.25 M NH4OH. A reference compound of bulk Ag2S powder (synthesised as above) was prepared as a pellet diluted with cellulose. All liquid samples were deposited in the 3-position sample holders, equipped with Kapton windows, immediately frozen and stored in LN2 until the experiment. The size of the frozen droplets was approximately 5 mm in diameter and 2 mm thick.
2.8. X-ray absorption spectroscopy (XAS) data acquisition and analysis
Ag K-Edge XAS acquisitions were conducted in cryogenic conditions at the CRG-FAME-UHD (BM16)51 beamline at the European Synchrotron Radiation Facility (ESRF, France). The samples were transferred into the liquid He cryostat and measured at 10 K. Ag K absorption edge was continuously scanned in the energy range 25.3–26.5 keV with a nitrogen-cooled Si(220) double-crystal monochromator.52 Beamsize on the sample was 240 × 750 μm2 (HxV, Full-Width Half Maximum values). The incoming photon energy was calibrated with an Ag metallic foil, by defining the first inflection point of its XAS spectrum at 25.514 keV. Spectra were recorded in fluorescence mode with a 16-element Ge solid state detector (Mirion, Lingolsheim, France). The Ag2S reference pellet was measured in transmission mode. The I0 and I1 signals are measured using Si diodes collecting a fraction of the transmitted beams scattered by 7 μm Kapton foils. The data were normalised using a linear function for the pre-edge and a 4th-order polynomial function for the after-edge and analysed as linear combinations fitting (LCF) of reference compounds by using the Larix application provided with the Larch package (version 0.9.81).532.9. MTT cell toxicity assays
Cytotoxicity was evaluated using the 3-(4,5-dimethyl2-thiazolyl)-2,5-diphenyltetrazolium bromide (MTT) assay. HepG2/C3A cells were provided by the ATCC. 7 × 10⁴ HepG2/C3A cells per well were seeded in a transparent flat-bottom 96-well plate and were incubated for 24 hours at 37 °C with 5% CO2 before the addition of QDs. To determine the LD50 of the QDs, a concentration series between 0 and 300 μg mL−1 of QDs was used. Five batches of Ag2S QDs were added to the medium: GSH-coated Ag2S QDs, synthesised from an AgNO3:GSH precursor ratio of 1/4 at pH 8 for either 1, 5, 10 or 15 minutes and GSH-coated Ag2S QDs, synthesised from an AgNO3:GSH precursor ratio of 1/2 at pH 8 for either 15 or 20 minutes. In all experiments, each condition was performed in triplicate on the plate. Each experiment was conducted three times independently. After 24 hours of incubation in the presence of the QDs, the medium was discarded, the cells rinsed with PBS and 100 μL of medium containing 0.5 mg mL−1 of MTT was added to each well. After 1 hour of incubation at 37 °C, the MTT solution was discarded and formazan crystals formed were dissolved in 150 μL of 4 mM HCl, 0.1% NP40 in isopropanol. The absorbance in the wells was read in a microplate reader (BioTek Synergy H1) at 570 nm.
3. Results and discussion
Reported aqueous synthetic methods for Ag2S QDs emitting in the second biological window typically use Na2S as the sulphur source and mercaptopropionic acid or human/bovine serum albumin (HSA/BSA) as stabilising ligands.30,45,46,54,55 The utilisation of bulkier ligands, such as HSA or BSA, allowed for the regulation of the fast reaction kinetics, albeit relatively large size distributions were obtained. Following the experience gained in the aqueous synthesis of highly luminescent AgInS2 QDs,56 we utilised L-glutathione (GSH) in the present study. Brelle et al. initially used GSH in combination with Na2S, yielding Ag2S NCs of approximately 9 nm, however, with no mention of any photoluminescent properties.34 Preliminary experiments showed Na2S was too reactive of a sulphur source to allow for good size control, and it was found raising the temperature to 140 °C in hydrothermal conditions enabled the use of GSH as both the surface ligand and sulphur source. As in the reported works, the Ag/S precursor ratio is of prime importance for governing the size range of the yielded QDs.3.1. Photophysical properties
Two panels of Ag2S QDs were synthesised from differing Ag/S precursor ratios of 1/2 and 1/4, at varying reaction times of 15 to 20 minutes and 1 to 15 minutes, respectively. From here on, individual samples will be referred to as Ag2S-X-Y, where X is the Ag/S precursor ratio and Y is the reaction time, for example, the sample Ag2S-14-1 corresponds to the sample synthesised from the Ag/S precursor ratio of 1/4 after a reaction time of 1 minute. Fig. 1 exhibits the absorption and emission spectra of the QDs yielded from an Ag/S precursor ratio of 1/2 and 1/4, respectively, at differing reaction times. As commonly seen for Ag2S QDs, all absorption spectra are characterised by broad bands void of any marked features, which has previously been associated with the presence of sub-bandgap transitions involving defect states, where lattice defects have good spatial overlap with the delocalised valence or conduction band wave functions increasing the transition probability involving the valence/conduction band and a localised defect state.45 For QDs synthesised with a reaction time between 15 and 18 minutes, from an Ag/GSH ratio of 1/2, the absorbance profiles are similar with no red-shift exhibited, however, the PL peak at 930 nm shows a continued decrease in intensity with reaction time (Fig. 1(b)). A red shift in the absorbance onset can be observed using a reaction time between 18, 19 and 20 minutes, accompanied by the loss of all emission after 19 minutes, followed by the re-emergence of a PL band at 1220 nm after a reaction time of 20 minutes. After 20 minutes, the PL band remained at 1220 nm and exhibited a significant decrease in intensity; therefore, the reaction was not explored at longer reaction times. Consequently, due to the absence of a clear red shift in the emission wavelength with reaction time, it can be postulated that the change in the emission wavelength is not a result of quantum confinement but a change in the origin of the emission. | ||
| Fig. 1 Optical properties of Ag2S QDs obtained via the microwave-assisted hydrothermal approach. (a)–(c) concern the optical properties of the Ag2S QDs synthesised from an Ag/GSH precursor ratio of 1/2. (d)–(f) Concern the optical properties of the QDs synthesised from an Ag/GSH precursor ratio of 1/4. (a) and (d) Absorbance spectra of Ag2S QDs synthesised from an Ag/GSH precursor ratio of 1/2 and 1/4 respectively at differing reaction times, with an inset of a zoom of the absorbance on-set; (b) and (e) absorption-corrected PL spectra of Ag2S QDs of QDs synthesised from an Ag/GSH precursor ratio of 1/2 and 1/4 respectively obtained after different reaction times; (c) and (f) [0–1] Normalised PL spectra of Ag2S QDs of QDs synthesised from an Ag/GSH precursor ratio of 1/2 and 1/4 respectively obtained after different reaction times, where (f) highlights the effects of absorption due to water (red dotted line) on the shape and FWHM of the PL emission peaks in the NIR domain. | ||
Fig. 1(d–f) exhibits the absorbance and PL spectra of QDs synthesised from the 1/4 precursor ratio using reaction times between 1 and 15 minutes. In contrast to QDs synthesised from the 1/2 Ag/S precursor ratio, those synthesised from a 1/4 precursor ratio exhibit a red shift in absorbance on-set with increasing reaction time. Interestingly, between 2 and 4 minutes, the absorbance profiles (Fig. 1(d)) exhibit a minute redshift, far smaller than that exhibited between other reaction times, specifically between identical time intervals of 1 to 2 minutes and 4 to 5 minutes. This potentially may be a result of limited growth in this time domain. Fig. 1(f) exhibits a redshift of the PL maxima with increasing reaction time from approximately 950–1220 nm, spanning the entire NIR-II spectral region. However, the absorption of NIR light by water in this spectral region (indicated by the red dotted line in Fig. 1(f)) corresponding to the bending and stretching vibrations of the hydroxyl group (–OH),57 results in the deformation of the ‘true’ shape of the emission peak. Therefore, it is difficult to determine the exact peak positions (and hence the precise value of the redshift) along with the full-width half maxima (FWHM) of the individual emission peaks. Unexpectedly, as opposed to what is commonly seen in the literature, the emission intensity does not decrease uniformly with reaction time (typically a result of an increased number of surface traps with increasing crystallite size). However, instead the emission intensity initially decreases before increasing significantly between 3 to 5 minutes before subsequently decreasing once again (Fig. 1(e)). Despite the PL spectra for the QDs synthesised at 3, 4 and 5 minutes appearing to have a similar peak position and shape, specifically in the region of 1050–1200 nm, the difference in the area of the emission peak below 1000 nm (in the spectral region containing an absorption feature of water) indicates the true nature of the emission peaks between 3 and 5 minutes vary significantly. This is further corroborated by the samples’ absorbance spectra, which indicate a clear red shift, a feature that would be expected to be repeated in the PL plot. The photoluminescence quantum yield (PLQY) values of chosen samples (Table S1†) were obtained via the comparative method utilising the NIR dye IR125. For all samples tested, the PLQY was recorded as <1%, likely due to their poorly passivated surfaces, potentially arising from using GSH as both a capping ligand and sulphur source resulting in a high concentration of non-radiative surface traps.
The luminescence lifetime reflects the possible recombination paths involved in the emission of the QDs. The resulting decay signal can be fitted by a sum of exponential functions, each corresponding to a distinct recombination path. Time-resolved photoluminescence (TRPL) spectroscopy was conducted for the QD formulations with the highest PLQY for each precursor ratio, Ag2S-12-15 and Ag2S-14-1 synthesised from the 1/2 and 1/4 Ag/GSH precursor ratios, respectively. Commonly, the decay behaviour of Ag2S QDs can be fitted with a two-exponential function. However, it remains important to note that due to the presence of many different de-excitation pathways resulting from differing surface trap combinations between different Ag2S QDs formulations, a bi-exponential fit does not indicate the presence of only two relaxation pathways.58 For TRPL spectra recorded for Ag2S-14-1 and Ag2S-12-15 (λEm: 940 ± 10 nm, Fig. S2†), a three-exponential function was found to best fit the experimental data. Both the intensity weighted and amplitude weighted average lifetimes, along with the individual lifetimes and relative weightings of the three decay components, are presented in Table 1. The short decay rate for both QD formulations has been previously exhibited for less efficient QDs,59 where the τ1 is commonly associated with decay due to non-radiative relaxation via the trapping of the exciton in surface quenching pathways. Despite exhibiting similar intensity weighted average lifetimes, the decrease in the weighting of τ1 for Ag2S-14-1 (53%) in comparison to Ag2S-12-15 (84%) can be attributed to a decrease in the concentration of surface trap states, presumably due to higher ligand coverage and better surface passivation resulting from the higher Ag/GSH precursor ratio. Consequently, the increased passivation of non-radiative surface traps is also reflected in the higher PLQY of Ag2S-14-1 (0.62%) in comparison to Ag2S-12-15 (0.34%). Additionally, the shorter reaction time implies less GSH has decomposed, which also contributes to a higher ligand coverage. From thermogravimetric analysis (TGA), it can be shown for QDs of a similar average size of approximately 5 nm, namely Ag2S-12-15 and Ag2S-14-5, that QDs synthesised from the 1/4 Ag/GSH precursor ratio posses a higher percentage (by mass) of organics (25% and 50%, respectively), confirming the increased ligand density on the surface.
| QD formulation | τ1 (ns), A1 | τ2 (ns), A2 | τ3 (ns), A3 | τint (ns) | τamp (ns) |
|---|---|---|---|---|---|
| Ag2S-12-15 | 5.2, 84% | 22.6, 6% | 79.6, 10% | 50.3 | 13.6 |
| Ag2S-14-1 | 8.4, 53% | 33.4, 40% | 116.1, 7% | 55.0 | 25.9 |
3.2. Structural properties
In order to determine the average particle size of selected QDs synthesised, TEM and the relevant image analysis were performed. The TEM images and size distribution histograms of Ag2S-14-5, Ag2S-14-10 and Ag2S-14-15 are shown in Fig. 2; the TEM images and size distributions of Ag2S-14-1, Ag2S-12-15 and Ag2S-12-20 can be found in the ESI (Fig. S3 and S4†). The particle diameters and their standard deviations are reported in Table 2. An increase in reaction time regardless of the precursor ratio is accompanied by an increase in the average particle size. Despite the QDs synthesised from the 1/4 Ag/GSH precursor ratio exhibiting a shift in the PL emission wavelength with reaction time consistent with that expected due to quantum confinement, the corresponding average particle sizes fall outside the quantum confinement regime. Due to its small Bohr radius of approximately 1 nm, it has been previously reported that the strong quantum confinement regime exists for Ag2S QDs up to approximately 4 nm in diameter.33,37 Therefore, in this case, from the currently available literature, the shift in emission results from alternative origins. | ||
| Fig. 2 Transmission electron microscopy (TEM) images of Ag2S-14-5 (a), Ag2S-14-10 (b) and Ag2S-14-15 (c). Histograms of particle size overlayed with the distribution curve (black) yielded from manual particle counting image analysis (n > 100) for Ag2S-14-5 (d), Ag2S-14-10 (e) and Ag2S-14-15 (f). | ||
| QD formulation | Diameter (nm) | LD50 (μg mL−1) |
|---|---|---|
| Ag2S-12-15 | 4.6 ± 1.4 | 29 ± 8 |
| Ag2S-12-20 | 9.4 ± 1.4 | >300 |
| Ag2S-14-1 | 3.9 ± 0.65 | 9 ± 1 |
| Ag2S-14-5 | 5.3 ± 0.65 | 11 ± 3 |
| Ag2S-14-10 | 12.5 ± 1.5 | 130 ± 42 |
| Ag2S-14-15 | 16.9 ± 2.0 | >300 |
X-ray diffraction patterns were collected to probe the relationship between the structure and the PL. Fig. 3(a) exhibits the diffractograms of QDs synthesised from the 1/2 Ag/S precursor ratio. In the case of the QDs synthesised after 15, 16, 17, 18 and 19 minutes a wide diffuse feature in the 2θ of 25–50° is observed. Diffuse blurring is characteristic of the low-order Ag2S monoclinic lattice, commonly seen for smaller Ag2S crystallite sizes or materials with high structural disorder and defect concentrations. Contrastingly, the XRD diffractogram of the QDs after 20 minutes exhibits a clearer more structured diffraction pattern with distinctive narrower peaks which correspond to the Ag2S monoclinic lattice. The sudden formation of crystalline Ag2S after 20 minutes from a highly amorphous, low crystallinity material (after 19 minutes), results in a decrease in vacancies present in the lattice and hence trap-state energy levels potentially revealing an intrinsic link between the origin of the emission and the structure of the QDs. X-ray diffractograms (Fig. 3(b)) of the QDs synthesised from an Ag/S precursor ratio of 1/4 at shorter reaction times exhibit a wide diffuse feature in the 2θ range of 25–50°. Contrastingly, the diffractogram of the QDs synthesised after 10 minutes begins to exhibit diffraction peaks which can be assigned to the characteristic peaks of monoclinic Ag2S. Despite this, many of the peaks at higher and lower angles compared to the two prominent peaks remain convoluted. Finally, the QDs synthesised after 15 minutes exhibit a clearer, more structured diffraction pattern with distinctive and narrower peaks which distinctly correspond to the Ag2S monoclinic lattice. The increased definition of the peaks between the diffractograms of the QDs synthesised after 10 and 15 minutes, respectively, is likely a result of the increase in size from 12 to 16.9 nm and an increase in crystallinity of the core. In summary, XRD analysis indicates that a rapid crystallisation occurs for the samples synthesised with 1/2 Ag/GSH ratio between 19 and 20 min, while the 1/4 sample exhibits a slower crystallisation taking place between 10 and 15 min of reaction. The sharp transition in crystallinity observed for QDs synthesised with a 1/2 Ag/GSH ratio is reflected in the pronounced shift in the emission wavelength from 970 nm to 1220 nm at 20 minutes. In contrast, QDs synthesised with a 1/4 Ag/GSH ratio exhibit a more gradual increase in crystallinity, hence, this vast change in the emission wavelength is not observed. In both cases, the increase in reaction time leads to an increase of the particle size, yielding spherical nanocrystals of around 10 nm (1/2) and 17 nm (1/4) for the longest reaction time investigated.
 | ||
| Fig. 3 X-ray diffractograms of Ag2S QDs synthesised from an Ag/GSH precursor ratio of 1/2 (a) and 1/4 (b) at differing reaction times. The reference pattern of bulk monoclinic Ag2S is given for comparison (JCPDS 01-080-5476). | ||
3.3. X-Ray absorption near edge structure
The experimental X-ray Absorption Near-Edge Structure (XANES) spectra, normalised to an edge jump of 1, are reported in Fig. 4: the reference compounds are represented as dashed black lines and the QDs as symbols. The reference compounds were chosen to represent the different stages of the synthesis: from the precursor Ag–GSH solutions in 1/2 and 1/4 ratio, respectively, to the crystalline Ag2S structure. Additionally, the spectrum of a silver foil was used as a reference for Ag(0) species, which could arise from the reduction of some metal centres during the reaction.60 In order to quantify the composition of the internal structure of the QDs, a Linear Combination Fitting (LCF) analysis was performed; normalised XANES spectra were fitted with a least-squares minimisation algorithm as linear combinations of the reference compounds, in the energy range [25.450; 25.630] keV. It is important to notice that the main spectral difference between crystalline Ag2S and Ag–GSH solutions, is a shift to higher energy of the second post-edge oscillation, that extends till 25.600 keV (Fig. 4). Therefore, in order to discriminate between crystalline and amorphous Ag–S complexes, it is crucial to include this oscillation in the XANES LCF range. Each experimental spectrum was fitted with all possible combinations of three standard compounds (Ag(0), bulk Ag2S, and the Ag–GSH complex with stoichiometry corresponding to the QD feed ratio), where the free parameters are the weights of all the components. The results are reported in Table 3, where weights of the LCF indicate the fraction of the Ag sites in the QD structure that show a local coordination equal to the corresponding reference compound; the best-fitting curves are represented in Fig. 4 as solid red lines overlapped with the corresponding experimental curve. The fits are based on the combination of the Ag–GSH complex, with the corresponding ratio of Ag/GSH to the feed ratio for the QD, bulk Ag2S and Ag(0) provide excellent agreement with the experimental data. For all QDs, the presence of Ag(0) reported as a fraction of the core structure falls close to or below the detection limit of the technique (5%). Furthermore, performing an LCF of the XANES region as a combination of only the corresponding Ag–GSH complex and bulk Ag2S yielded fits with marginally inferior Rfit values, exhibiting an increase on the order of 10−6. From this, the presence of Ag(0) in the QDs can be excluded and the composition of the QDs considered as a combination of bulk Ag2S and the corresponding Ag–GSH complex. For all QDs, regardless of the precursor ratio, the fraction of Bulk Ag2S in the core structure increases with reaction time, from 25% to 53% for Ag2S-12-15 and Ag2S-12-20 and from 8% to 97% for Ag2S-14-1 and Ag2S-14-15, respectively. This is a reflection of not only the crystallisation of the particles from amorphous AgxSy-based clusters to QDs with a bulk Ag2S crystal structure (Fig. 3), but is also a reflection of the decreasing surface-to-volume ratio with increased particle size. For instance, core Ag atoms are more likely to occupy a bulk Ag2S-like structure than surface atoms, which probably bind also the thiolate moieties of the ligand shell in an Ag–GSH-like coordination environment. For the QDs synthesised from an Ag/GSH precursor ratio of 1/2, however, the transformation of the core structure occurs over a far shorter period than that of the QDs synthesised from a 1/4 Ag/GSH precursor ratio. Furthermore, despite both Ag2S-14-15 and Ag2S-12-20 exhibiting optical properties consistent with the bulk band gap, the proportion of the QD core structure attributed to bulk Ag2S for Ag2S-14-15 is nearly twice that for Ag2S-12-20 (97% versus 53%). This data is simultaneously reflected in the respective XRD of the two QDs, where the diffractogram of Ag2S-14-15 exhibits more defined diffraction peaks than seen for Ag2S-12-20. Furthermore, despite their differing optical properties, the LCF fit of the QDs Ag2S-14-10 and Ag2S-12-20 yield a similar fraction, within error, of the core corresponding to bulk Ag2S and the initial Ag–GSH complex (53% and 41–43%, respectively), again in line with their similar X-ray diffractograms. | ||
| Fig. 4 Ag K-edge XANES spectra of the reference compounds (Ag(0), bulk Ag2S, and the Ag–GSH complexes synthesised from a 1/2 and 1/4 Ag/GSH ratio) and the best-fitting curves (red) obtained as linear combinations of the reference spectra, overlapped to the experimental spectra (dots) of six different Ag2S QD formulations. | ||
| QD formulation | Bulk Ag2S fraction (%) | Ag–GSH fraction (%) | Ag(0) fraction (%) | RFit (10−5) | χReduced2 (10−6) |
|---|---|---|---|---|---|
| Ag2S-12-15 | 25(2) | 70(2) | 5(1) | 1.0 | 6.4 |
| Ag2S-12-20 | 53(3) | 41(3) | 6(1) | 3.1 | 19.2 |
| Ag2S-14-1 | 8(2) | 91(2) | 2(1) | 1.8 | 11.2 |
| Ag2S-14-5 | 29(3) | 69(3) | 2(1) | 3.4 | 20.9 |
| Ag2S-14-10 | 53(3) | 44(3) | 4(1) | 2.5 | 15.3 |
| Ag2S-14-15 | 97(2) | 3(2) | — | 1.5 | 9.9 |
3.4. Toxicity assays
To further assess the feasibility of using these novel NIR-II emissive QDs as bioimaging probes, their cytotoxicity was evaluated. The viability of HepG2/C3A cells was quantified after exposure to different formulations of Ag2S QDs for 24 hours in the concentration range of 0–300 μg mL−1 using a MTT assay. For the following cytotoxicity assays, the samples Ag2S-14-1, Ag2S-14-5, Ag2S-14-10, Ag2S-14-15, Ag2S-12-15 and Ag2S-12-20 were selected. Conventionally, the toxicology of a species towards cells is quantified by the median lethal dose (LD50), also commonly referred to as the median lethal concentration – LC50, defined as the dose (or concentration) of a substance required to kill 50% of the members of a population after incubation. The plots yielded from the cell viability assay are presented in the ESI (Fig. S5†).Interestingly, the aforementioned QDs exhibit a clear correlation between the crystallite size, crystallinity and their cytotoxicity with larger more crystalline QDs synthesised from the same precursor ratio exhibiting lower or no cytotoxicity (Table 2). For the series of QDs synthesised from the Ag/S precursor ratio of 1/4, Ag2S-14-1 and Ag2S-14-5 exhibited a high cytotoxicity with LD50 values of less than 15 μg mL−1. Contrastingly, the Ag2S-14-10 exhibits an LD50 of 130 ± 42, whereas Ag-14-15 exhibits no cytotoxicity within the concentration range tested. QDs synthesised from the 1/2 Ag/S precursor ratio, show a similar pattern, where the smaller, less crystalline Ag2S-12-15 QDs display cytotoxicity, with an LD50 of 29 ± 8 μg mL−1, whereas the larger, more crystalline Ag-12-20 QDs exhibit no cytotoxicity in the concentration range tested. Despite Ag2S-12-20 and Ag2S-14-10, exhibiting both a similar crystallite size and crystallinity (Fig. 3) only Ag2S-14-10 exhibits cytotoxic effects within the concentration range tested. However, as previously reported the cytotoxicity of QDs can rarely be associated with a single factor61,62 and can arise from a variety of origins including their surface structure, environmental factors, ligand coverage or leakage of ions from the core.63
4. Conclusions
A novel synthesis via a hydrothermal-based microwave-assisted synthetic method has been presented, yielding NIR emitting QDs. Via modulation of the Ag/GSH precursor ratio in addition to the reaction time, the emission can be tuned across the NIR-I and NIR-II domains and biological transparency windows. Contrary to previous work in the literature, TEM analysis revealed that the particles (ranging from 4–17 nm) fall outside of the strong confinement regime despite the modulation of the emission wavelength. From XRD studies, it was determined that the PL maxima were strongly dependent on the structure, with a shift, where crystallisation of the particles resulted in a change in the origin of the emission. Despite the low PLQY of the QDs synthesised, the adaptation of shelling or doping approaches with Se,64 Zn36 or Mn,65 currently utilised for the organic phase reactions, for aqueous phase synthetic approaches, may permit the enhancement of the QDs presented, especially those that emit at longer wavelengths. Analysis of the XANES via LCF of the synthesised QDs reported an increase in the structural fraction of the core corresponding to the bulk crystalline Ag2S with increasing reaction time for all precursor ratios examined, corresponding to the X-ray diffractograms yielded for each sample. Finally, MTT assays were utilised to assess the biocompatibility of the QDs in HepG2/C3A cells, where an increase in crystallite size and crystallinity of the QDs was found to correspond to a decrease in toxicity. The presented results highlight, to the best of our knowledge, the first example of Ag2S QDs synthesised via a microwave approach whose emission can be modulated to span the entire NIR-II window, paving the way for the development of new instantly water-soluble NIR emitting QDs for further bio-applications. Furthermore, more generally, the results from the toxicity assays contribute to the understanding of the size-related toxicity of these materials and lay the basis for the development of safe bio-compatible nano-probes for clinical applications.Author contributions
Omar El-Dahshan – Investigation, writing – original draft, writing – review & editing; Aurélien Deniaud – Investigation, writing – review & editing; Wai Li Ling – Investigation; Karl David Wegner – Investigation; writing – review & editing; Olivier Proux – Methodology, resources; Giulia Veronesi – Supervision, writing – review & editing; Peter Reiss – Supervision, writing – review & editing.Data availability
The data supporting this article have been included as part of the ESI.† The dataset acquired during the synchrotron measurements has been deposited as follows: Deniaud, A., El-Dahshan, O., and Veronesi, G. (2027). Structure and in-cellulo stability of NIRemitting Ag2S-based quantum dots [Dataset]. European Synchrotron Radiation Facility. https://dx.doi.org/10.15151/ESRF-ES-1931737108.Conflicts of interest
There are no conflicts of interest to declare.Acknowledgements
The authors thank the Labex ARCANE (ANR-11-LABX-0003-01) for the PhD funding of O. E. D and ANR for financial support (grant ANR-24-CE09-0786-01 PIQUANT). Stéphanie Pouget is thanked for assistance with powder X-ray diffraction. This work used the platforms of the Grenoble Instruct-ERIC centre (ISBG; UAR 3518 CNRS-CEA-UGA-EMBL) within the Grenoble Partnership for Structural Biology (PSB), supported by FRISBI (ANR-10-INBS-0005-02) and GRAL, financed within the University Grenoble Alpes graduate school (Ecoles Universitaires de Recherche) CBH-EUR-GS (ANR-17-EURE-0003). The IBS Electron Microscope facility is supported by the Auvergne Rhône-Alpes Region, the Fonds Feder, the Fondation pour la Recherche Médicale and GIS-IBiSA. The FAME-UHD project is financially supported by the French “grand emprunt” EquipEx (MAGNIFIX, ANR-21-ESRE-0011), the French “Programmes et équipements prioritaires de recherche” (DIADEM ESRF – ANR-22-PEXD-0011), the CEA-CNRS CRG consortium and the INSU CNRS institute. The authors would like to acknowledge SOLEIL-CRG program committee for the beamtime allocation (proposal 20240636/A16-1-839). Finally, the authors would like to acknowledge Isabelle Maurin for her help during the beamtime at FAME-UHD (BM16).References
- R. Rossetti, S. Nakahara and L. E. Brus, J. Chem. Phys., 1983, 79, 1086–1088 CrossRef CAS.
- A. I. Ekimov, Al. L. Efros and A. A. Onushchenko, Solid State Commun., 1985, 56, 921–924 CrossRef CAS.
- K. D. Wegner and U. Resch-Genger, Anal. Bioanal. Chem., 2024, 416, 3283–3293 CrossRef CAS PubMed.
- Q. Yuan, T. Wang, P. Yu, H. Zhang, H. Zhang and W. Ji, Org. Electron., 2021, 90, 106086 CrossRef CAS.
- H. Moon, C. Lee, W. Lee, J. Kim and H. Chae, Adv. Mater., 2019, 31, 1804294 CrossRef PubMed.
- A. P. Litvin, I. V. Martynenko, F. Purcell-Milton, A. V. Baranov, A. V. Fedorov and Y. K. Gun'ko, J. Mater. Chem. A, 2017, 5, 13252–13275 RSC.
- M. Jouyandeh, S. S. M. Khadem, S. Habibzadeh, A. Esmaeili, O. Abida, V. Vatanpour, N. Rabiee, M. Bagherzadeh, S. Iravani, M. R. Saeb and R. S. Varma, Green Chem., 2021, 23, 4931–4954 RSC.
- G. H. Carey, A. L. Abdelhady, Z. Ning, S. M. Thon, O. M. Bakr and E. H. Sargent, Chem. Rev., 2015, 115, 12732–12763 CrossRef CAS PubMed.
- A. A. H. Abdellatif, M. A. Younis, M. Alsharidah, O. Al Rugaie and H. M. Tawfeek, Int. J. Nanomed., 2022, 17, 1951–1970 CrossRef PubMed.
- A. Mukherjee and N. Sarkar, Application of Quantum Dots in Biology and Medicine: Recent Advances, Springer Nature, Singapore, 2022, pp. 103–123 Search PubMed.
- S. Kargozar, S. J. Hoseini, P. B. Milan, S. Hooshmand, H.-W. Kim and M. Mozafari, Biotechnol. J., 2020, 15, 2000117 CrossRef CAS PubMed.
- M. Cardoso Dos Santos, W. R. Algar, I. L. Medintz and N. Hildebrandt, TrAC, Trends Anal. Chem., 2020, 125, 115819 CrossRef CAS.
- N. Hildebrandt, C. M. Spillmann, W. R. Algar, T. Pons, M. H. Stewart, E. Oh, K. Susumu, S. A. Díaz, J. B. Delehanty and I. L. Medintz, Chem. Rev., 2017, 117, 536–711 CrossRef CAS PubMed.
- Y. Wang, R. Hu, G. Lin, I. Roy and K.-T. Yong, ACS Appl. Mater. Interfaces, 2013, 5, 2786–2799 CrossRef CAS PubMed.
- K. D. Wegner and N. Hildebrandt, Chem. Soc. Rev., 2015, 44, 4792–4834 RSC.
- W. R. Algar, M. Massey, K. Rees, R. Higgins, K. D. Krause, G. H. Darwish, W. J. Peveler, Z. Xiao, H.-Y. Tsai, R. Gupta, K. Lix, M. V. Tran and H. Kim, Chem. Rev., 2021, 121, 9243–9358 CrossRef CAS PubMed.
- W. Liu, M. Howarth, A. B. Greytak, Y. Zheng, D. G. Nocera, A. Y. Ting and M. G. Bawendi, J. Am. Chem. Soc., 2008, 130, 1274–1284 CrossRef CAS PubMed.
- S. Pathak, M. C. Davidson and G. A. Silva, Nano Lett., 2007, 7, 1839–1845 CrossRef CAS PubMed.
- C. T. Matea, T. Mocan, F. Tabaran, T. Pop, O. Mosteanu, C. Puia, C. Iancu and L. Mocan, Int. J. Nanomed., 2017, 12, 5421–5431 CrossRef CAS.
- D. Sun and O. Gang, Langmuir, 2013, 29, 7038–7046 CrossRef CAS PubMed.
- A. M. Smith, M. C. Mancini and S. Nie, Nat. Nanotechnol., 2009, 4, 710–711 CrossRef CAS PubMed.
- J. Zhao, D. Zhong and S. Zhou, J. Mater. Chem. B, 2018, 6, 349–365 RSC.
- G. Hong, A. L. Antaris and H. Dai, Nat. Biomed. Eng., 2017, 1, 1–22 CrossRef.
- T. I. U. o. P. a. A. Chemistry (IUPAC), IUPAC - infrared (IT07399), https://goldbook.iupac.org/terms/view/IT07399.
- E. Hemmer, A. Benayas, F. Légaré and F. Vetrone, Nanoscale Horiz., 2016, 1, 168–184 RSC.
- A. Croce and G. Bottiroli, Eur. J. Histochem., 2014, 58, 2461 CAS.
- C. Ding, Y. Huang, Z. Shen and X. Chen, Adv. Mater., 2021, 33, 2007768 CrossRef CAS PubMed.
- A. N. Bashkatov, E. A. Genina, V. I. Kochubey and V. V. Tuchin, J. Phys. D: Appl. Phys., 2005, 38, 2543–2555 CrossRef CAS.
- B. Purushothaman and J. M. Song, Biomater. Sci., 2021, 9, 51–69 RSC.
- K. D. Wegner and N. Hildebrandt, TrAC, Trends Anal. Chem., 2024, 180, 117922 CrossRef CAS.
- Z. Zhang, H. Yang, M. Wang, Y. Zhang, J. Jiang and Q. Wang, Nano Res., 2024, 17, 10620–10643 CrossRef CAS.
- R. Gui, H. Jin, Z. Wang and L. Tan, Coord. Chem. Rev., 2015, 296, 91–124 CrossRef CAS.
- S. Lin, Y. Feng, X. Wen, P. Zhang, S. Woo, S. Shrestha, G. Conibeer and S. Huang, J. Phys. Chem. C, 2015, 119, 867–872 CrossRef CAS.
- M. C. Brelle, J. Z. Zhang, L. Nguyen and R. K. Mehra, J. Phys. Chem. A, 1999, 103, 10194–10201 CrossRef CAS.
- R. D. Robinson, B. Sadtler, D. O. Demchenko, C. K. Erdonmez, L.-W. Wang and A. P. Alivisatos, Science, 2007, 317, 355–358 CrossRef CAS PubMed.
- Z. Tang, H. Yang, Z. Sun, Y. Zhang, G. Chen and Q. Wang, Nano Res., 2023, 16, 12315–12322 CrossRef CAS.
- Y. Zhang, Y. Liu, C. Li, X. Chen and Q. Wang, J. Phys. Chem. C, 2014, 118, 4918–4923 CrossRef CAS.
- H. Yang, R. Li, Z. Sun, Y. Zhang, H. Zhan, X. Chen and Q. Wang, J. Chem. Phys., 2023, 159, 014709 CrossRef CAS PubMed.
- P. Jiang, S. Li, M. Han, Y. Liu and Z. Chen, Analyst, 2019, 144, 2604–2610 RSC.
- P. Jiang, C.-N. Zhu, Z.-L. Zhang, Z.-Q. Tian and D.-W. Pang, Biomaterials, 2012, 33, 5130–5135 CrossRef CAS PubMed.
- P. T. Buz, F. D. Duman, M. Erkisa, G. Demirci, F. Ari, E. Ulukaya and H. Y. Acar, Nanomedicine, 2019, 14, 969–987 CrossRef CAS PubMed.
- P. Wang, R. Morales-Márquez, G. Cervás, A. H. Medel, M. P. Ogayar, D. J. de Aberasturi, A. I. de Isidro-Gomez, A. Torres-Pardo, F. J. Palomares, S. Garcia-Orrit, C. T. Sousa, A. Espinosa, H. H. Telle, D. H. Ortgies, V. Vega-Mayoral, J. Cabanillas-González, E. M. Rodríguez, U. Resch-Genger, K. D. Wegner and B. H. Juárez, Mater. Horiz., 2024, 11, 6158–6168 RSC.
- G. Rotko, J. Cichos, E. Wysokińska, M. Karbowiak and W. Kałas, Colloids Surf., B, 2019, 181, 119–124 CrossRef CAS PubMed.
- M. Jiao, A. S. Portniagin, X. Luo, L. Jing, B. Han and A. L. Rogach, Adv. Opt. Mater., 2022, 10, 2200226 CrossRef CAS.
- W. J. Mir, A. Swarnkar, R. Sharma, A. Katti, K. V. Adarsh and A. Nag, J. Phys. Chem. Lett., 2015, 6, 3915–3922 CrossRef CAS PubMed.
- J. Gao, C. Wu, D. Deng, P. Wu and C. Cai, Adv. Healthcare Mater., 2016, 5, 2437–2449 CrossRef CAS PubMed.
- H.-Y. Yang, Y.-W. Zhao, Z.-Y. Zhang, H.-M. Xiong and S.-N. Yu, Nanotechnology, 2013, 24, 055706 CrossRef PubMed.
- W. Bao, L. Ga, R. Zhao and J. Ai, Biosens. Bioelectron.: X, 2022, 10, 100112 CAS.
- D. Magalhães Sousa, W. Chiappim, J. P. Leitão, J. C. Lima and I. Ferreira, ACS Omega, 2020, 5, 12877–12881 CrossRef PubMed.
- Q. Ren, Y. Ma, S. Zhang, L. Ga and J. Ai, ACS Omega, 2021, 6, 6361–6367 CrossRef CAS PubMed.
- O. Proux, X. Biquard, E. Lahera, J.-J. Menthonnex, A. Prat, O. Ulrich, Y. Soldo, P. Trévisson, G. Kapoujyan, G. Perroux, P. Taunier, D. Grand, P. Jeantet, M. Deleglise, J.-P. Roux and J.-L. Hazemann, Phys. Scr., 2005, 2005, 970 CrossRef.
- O. Proux, V. Nassif, A. Prat, O. Ulrich, E. Lahera, X. Biquard, J.-J. Menthonnex and J.-L. Hazemann, J. Synchrotron Radiat., 2006, 13, 59–68 CrossRef CAS PubMed.
- M. Newville, J. Phys.: Conf. Ser., 2013, 430, 012007 CrossRef CAS.
- P. Jiang, Z.-Q. Tian, C.-N. Zhu, Z.-L. Zhang and D.-W. Pang, Chem. Mater., 2012, 24, 3–5 CrossRef CAS.
- T. Yang, Y. Tang, L. Liu, X. Lv, Q. Wang, H. Ke, Y. Deng, H. Yang, X. Yang, G. Liu, Y. Zhao and H. Chen, ACS Nano, 2017, 11, 1848–1857 CrossRef CAS PubMed.
- C. Rivaux, T. Akdas, R. Yadav, O. El-Dahshan, D. Moodelly, W. L. Ling, D. Aldakov and P. Reiss, J. Phys. Chem. C, 2022, 126, 20524–20534 CrossRef CAS.
- V. S. Langford, A. J. McKinley and T. I. Quickenden, J. Phys. Chem. A, 2001, 105, 8916–8921 CrossRef CAS.
- J. W. de Wit, I. Zabala-Gutierrez, R. Marin, A. Zhakeyev, S. Melle, O. G. Calderon, J. Marques-Hueso, D. Jaque, J. Rubio-Retama and A. Meijerink, J. Phys. Chem. Lett., 2024, 15, 8420–8426 CrossRef CAS PubMed.
- H. D. A. Santos, I. Zabala Gutiérrez, Y. Shen, J. Lifante, E. Ximendes, M. Laurenti, D. Méndez-González, S. Melle, O. G. Calderón, E. López Cabarcos, N. Fernández, I. Chaves-Coira, D. Lucena-Agell, L. Monge, M. D. Mackenzie, J. Marqués-Hueso, C. M. S. Jones, C. Jacinto, B. del Rosal, A. K. Kar, J. Rubio-Retama and D. Jaque, Nat. Commun., 2020, 11, 2933 CrossRef CAS PubMed.
- A. Ortega-Rodríguez, Y. Shen, I. Zabala Gutierrez, H. D. A. Santos, V. Torres Vera, E. Ximendes, G. Villaverde, J. Lifante, C. Gerke, N. Fernández, O. G. Calderón, S. Melle, J. Marques-Hueso, D. Mendez-Gonzalez, M. Laurenti, C. M. S. Jones, J. M. López-Romero, R. Contreras-Cáceres, D. Jaque and J. Rubio-Retama, ACS Appl. Mater. Interfaces, 2020, 12, 12500–12509 CrossRef PubMed.
- A. Sukhanova, S. Bozrova, E. Gerasimovich, M. Baryshnikova, Z. Sokolova, P. Samokhvalov, C. Guhrenz, N. Gaponik, A. Karaulov and I. Nabiev, Nanomaterials, 2022, 12, 2734 CrossRef CAS PubMed.
- A. Nagy, A. Steinbrück, J. Gao, N. Doggett, J. A. Hollingsworth and R. Iyer, ACS Nano, 2012, 6, 4748–4762 CrossRef CAS PubMed.
- R. Hardman, Environ. Health Perspect., 2006, 114, 165–172 CrossRef PubMed.
- D. Ruiz, M. Mizrahi, H. D. A. Santos, D. Jaque, C. M. S. Jones, J. Marqués-Hueso, C. Jacinto, F. G. Requejo, A. Torres-Pardo, J. M. González-Calbet and B. H. Juárez, Nanoscale, 2019, 11, 9194–9200 RSC.
- W. Ge, S. Huang, X. Huang, B. Gao, Z. Shen, X. Zhuang and F. Wang, ACS Nano, 2025, 19, 6601–6612 CrossRef CAS PubMed.
Footnote |
| † Electronic supplementary information (ESI) available. See DOI: https://doi.org/10.1039/d5nr00052a |
| This journal is © The Royal Society of Chemistry 2025 |