 Open Access Article
Controlling the solid-state and particle properties of a fixed-dose combination co-amorphous system by spray drying†
Alice
Parkes
 a,
Ahmad
Ziaee
b and
Emmet
O'Reilly
 *a
*a
aDepartment of Chemical Sciences, SSPC, Bernal Institute, University of Limerick, Limerick, Ireland. E-mail: Emmet.OReilly@ul.ie
bCook Medical, Castletroy, Limerick, Ireland
First published on 20th November 2024
Abstract
Controlling the solid-state stability of co-amorphous drug delivery systems has been an ongoing challenge in the pharmaceutical field to date. The main route to stabilise co-amorphous systems is to increase excipient load either in the co-amorphous formulation or via an additional excipient, creating a ternary amorphous system. Increasing excipient load in a formulation can have disadvantages such as producing large oral dosage forms. In this work, the impact of spray drying process parameters on the formation and short-term stability of a drug–drug co-amorphous mixture in the absence of any excipients is investigated. A 9-point design of experiments (DoE) was conducted to assess the impact of atomising gas flowrate and feed flowrate on the co-amorphous formation and stability. It was found that when the outlet temperature was fixed at 50 °C, the atomising gas flowrate had a more significant effect on the physical stability of the co-amorphous mixture than the feed flowrate. Monitoring the stability of formulations at accelerated stability conditions (40 °C per 75% relative humidity) showed that the co-amorphous systems produced at higher atomising gas flowrates, with smaller droplet sizes and subsequent particle sizes, exhibited a higher stability than those produced at lower atomising gas flowrates. Co-amorphous systems produced at the higher atomising gas flowrates remained stable for the 3-month stability testing period demonstrating that the co-amorphous physical stability can be controlled by optimising the spray drying process. The results presented in this study have significant implications for producing co-amorphous drug delivery systems with a high physical stability without the addition of excipients by spray drying.
Introduction
Controlling the stability of a metastable solid-state form of an active pharmaceutical ingredient (API) is a recurring challenge in the development of pharmaceuticals. Continuous manufacturing methods such as spray drying, provide new challenges and opportunities to create more stable pharmaceutical products.1,2 Undesired solid-state transformations over time, have led to well documented pharmacological and intellectual property issues, Ritonavir is a well-known example of this.3,4 These challenges can arise when producing products which include an API in a metastable form. Metastable forms can include metastable crystalline polymorphic forms or metastable amorphous forms. Metastable forms of an API are generally regarded as having higher energy and are thermodynamically unstable.5,6 Some of these forms are attractive as they offer enhanced dissolution properties and solubility.7,8 In general, newly emerging pharmaceuticals exhibit poor solubility properties9 due to their complex structures and large molecular weights,10 therefore, identifying and isolating their metastable polymorphs or amorphous forms is beneficial.1,11Routes to stabilise amorphous forms include formulating an amorphous solid dispersion (ASD),12 a co-amorphous system,13 or formulating with mesoporous silica.14 ASDs include a matrix-forming excipient which prevents the recrystallisation of the API. This occurs due to the polymer excipient having a high viscosity below its glass transition temperature (Tg) or through the polymer interacting with the API.15 ASDs however are limited by having a low drug load and the polymers having potential hygroscopicity which can lead to increased mobility of the API molecules enabling recrystallisation.15,16 Moreover, as many APIs have limited solubility in polymer carriers, large quantities of polymer can be required resulting in high polymer to drug ratios and large final dosage form tablet sizes.13 Mesoporous silica, on the other hand, contains nano pores in which an API can be incorporated and stabilised in its amorphous form.17 Mesoporous silica systems are limited, however, as only the monomolecular API layer in contact with the silanol groups (Si–O–H) of the silica is fully stabilised, and additional API within the pores or beyond the monomolecular layer are likely to recrystallise.15
A co-amorphous system is another route to stabilising the amorphous nature of a product which, in addition, can reduce the excipient load required and provide a route to combination therapies,18e.g. fixed-dose combinations. A co-amorphous system is a homogenous amorphous mixture made up of one or more APIs and/or low-molecular weight excipients.8,19 In a co-amorphous consisting of two APIs, as Dengale et al. describes, both drugs essentially ‘act as an active component and stabilising excipient’ simultaneously.20 Ternary co-amorphous systems include a third component to stabilise the amorphous form of the API. The amorphous form is stabilised by interacting with the coformer API/excipient through intermolecular bonding or by molecular mixing.15 A lower excipient loading has benefits for both the route of processing by reducing batch sizes and the end-user alike by producing smaller tablets without an excess of excipients.
Spray drying is commonly used to produce amorphous products in the pharmaceutical industry. Previous studies have investigated controlling the stability of both amorphous and co-amorphous formulations using spray drying. Craye et al. investigated a route to produce a co-amorphous mixture of simvastatin–lysine (SVS–LYS) by spray drying. To prolong the stability of the co-amorphous mixture in this study, a surfactant, sodium lauryl sulfate (SLS), was added to the formulation. It was found that physically mixing SLS with the already amorphous SVS–LYS produced by milling did not have the same stabilising affect in comparison to spray drying SLS with SVS and LYS.21 The atomising gas flowrate parameter, however, was not altered in this work to investigate its effect on the stability of the co-amorphous mixture. A study by Mishra et al. investigated spray drying indomethacin-amino acid formulations using different solvents and ratios of solvents. The study found that each indomethacin-amino acid combination could be spray dried to form a co-amorphous mixture with an enhanced dissolution rate whereas ball milling could only form one co-amorphous mixture from the three formulations. It was demonstrated that the spray dried co-amorphous mixture could also remain stable for several months at room temperature and 5.4% RH. This study, however, did not investigate the effect of spray drying parameters on the stability of the co-amorphous system.22 A study by Beyer et al. investigated the effects of spray drying parameters on a drug–drug co-amorphous system, naproxen-indomethacin. The parameters varied were inlet temperature and feed flowrate. From the spray dried samples, 2 out of 5 were initially co-amorphous and recrystalised after 28 days.23 Each of the reviewed studies highlight the challenges of prolonging the stability of co-amorphous formulations. Moreover, each study overlooked investigating the effect of the atomising gas flowrate on the stability of the co-amorphous mixture.
In this study, the impact of spray drying parameters on the stability of a drug–drug fixed-dose combination of carbamazepine (CBZ) and chlorothiazide (CTZ) is investigated. A CBZ–CTZ fixed-dose combination is used as a model combination in this work and aims to provide a platform for preparing similar co-amorphous compounds with clinical applications using spray drying. CBZ is an anti-convulsant polymorphic API and has five discovered polymorphs. Form III is the most stable and only commercially available form of CBZ.24,25 CTZ is a diuretic and an antihypertensive.26,27 It is a BCS class IV API and has a low solubility in water and many organic solvents.28 There are currently three known polymorphs of CTZ,29 including CTZ form III which was discovered recently.30 A 2![[thin space (1/6-em)]](https://www.rsc.org/images/entities/char_2009.gif) :
:![[thin space (1/6-em)]](https://www.rsc.org/images/entities/char_2009.gif) 1 CBZ–CTZ cocrystal was identified by Aljohani et al.31 which exhibits improved thermal stability and solubility over carbamazepine and chlorothiazide, consecutively.31,32 Both spray drying of CBZ and CTZ in combination or in a co-amorphous mixture of the two APIs has not been reported previously. In this study CBZ and CTZ are spray dried as a model fixed-dose combination to produce a co-amorphous system. Additionally, the impact of two spray dryer process parameters, namely feed flowrate and atomising gas flowrate are studied. These parameters were chosen as they can control the droplet sizes produced in the spray dryer which have a directly affect the confinement space and drying time. These factors can subsequently influence the solid-state and particle size of the product.1,33 This study aims to demonstrate the direct impact that these spray drying parameters can have on the solid-state and particle properties of a co-amorphous system and determine suitable parameters to stabilise the co-amorphous mixture without the use of excipients.
1 CBZ–CTZ cocrystal was identified by Aljohani et al.31 which exhibits improved thermal stability and solubility over carbamazepine and chlorothiazide, consecutively.31,32 Both spray drying of CBZ and CTZ in combination or in a co-amorphous mixture of the two APIs has not been reported previously. In this study CBZ and CTZ are spray dried as a model fixed-dose combination to produce a co-amorphous system. Additionally, the impact of two spray dryer process parameters, namely feed flowrate and atomising gas flowrate are studied. These parameters were chosen as they can control the droplet sizes produced in the spray dryer which have a directly affect the confinement space and drying time. These factors can subsequently influence the solid-state and particle size of the product.1,33 This study aims to demonstrate the direct impact that these spray drying parameters can have on the solid-state and particle properties of a co-amorphous system and determine suitable parameters to stabilise the co-amorphous mixture without the use of excipients.
Materials
Carbamazepine (Kemprotec Ltd, UK), chlorothiazide (Thermo Fisher Scientific, USA), acetone for HPLC >99.8% (Thermo Fisher Scientific, USA), methanol for HPLC 99.9% (Thermo Fisher Scientific, USA), isopropyl Alcohol (IPA) for HPLC >99.7% (Thermo Fisher Scientific, USA) and 0.45 μm PTFE membrane filters (VWR International Ltd, Ireland).Methods
Solubility screening
Solubility screening was performed on both APIs, carbamazepine and chlorothiazide, in methanol, acetone and IPA. API was added to 10 ml of solvent in a sample jar until the solution was saturated. The sample jar was then placed in the Polar Bear Plus (PBP) heating and stirring platform (Cambridge Reactor Design Ltd, UK) at 25 °C for 24 hours. Once the undissolved solute material settled at the bottom of the jars taken from the PBP, an aliquot was taken and dispensed through a 0.45 μm PTFE membrane filter into a clean, dry sample jar (‘wet sample’). The jar was placed in an oven set at 50 °C for 24 hours. After the jar was removed from the oven it was re-weighed (‘dry sample’) (see solubility calculation in ESI†).Spray drying
A B-290 Mini Spray Dryer coupled with the Büchi Inert Loop B-295 (Büchi Labortechnik AG, Switzerland) was used in this investigation. A closed loop was set up as an organic solvent, acetone, was used. A two fluid nozzle was used and the experiments were conducted using 10 mg mL−1 of a 2![[thin space (1/6-em)]](https://www.rsc.org/images/entities/char_2009.gif) :
:![[thin space (1/6-em)]](https://www.rsc.org/images/entities/char_2009.gif) 1 molar ratio of carbamazepine and chlorothiazide in acetone. The condenser temperature was fixed at −20 °C. The aspirator was set at 100% (35.0 m3 h−1). The inlet temperature was adjusted to keep the outlet temperature fixed at 50 °C. The only variables in this study were the atomising gas flowrate and feed flowrate. The range of the process parameters were determined through preliminary screening runs with acceptable final yield.
1 molar ratio of carbamazepine and chlorothiazide in acetone. The condenser temperature was fixed at −20 °C. The aspirator was set at 100% (35.0 m3 h−1). The inlet temperature was adjusted to keep the outlet temperature fixed at 50 °C. The only variables in this study were the atomising gas flowrate and feed flowrate. The range of the process parameters were determined through preliminary screening runs with acceptable final yield.
Design of experiments
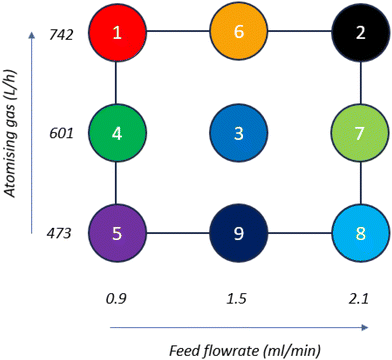
A design of experiments (DoE) was used to investigate the impact of process parameters on the stability of the formulated co-amorphous mixture. A JMP® Pro 17 custom DoE module (JMP® Pro, UK) was used to design a set of experiments varying atomising gas flowrate (246–742 L h−1) and feed flowrate (0.9–2.1 ml min−1). Fig. 1 and Table S1 (ESI†) show the experimental design matrix of points 1–9, namely Run 1–Run 9.Powder X-Ray diffraction (PXRD)
An Empyrean diffractometer (Malvern Panalytical, UK) was used in this study. The diffractometer was used in reflection mode with Cu Kα radiation (λ = 1.5406 Å) at room temperature. The tube voltage was set at 45 kV and current was set at 40 mA. Samples were lightly pressed on a silicon zero-background disc before analysis.Thermogravimetric analysis (TGA)
A TGA 4000 (PerkinElmer, USA) was used to carry out TGA analysis. Approximately 3 mg of the sample was weighed into the crucible. The sample was heated past the point of degradation at a heating rate of 10 °C min−1 under nitrogen gas.Differential scanning calorimetry (DSC)
A DSC 214 Polyma (NETZSCH, Germany) was used to perform DSC analysis on each of the samples. Approximately 3 mg of sample was loaded into the hermetically sealed aluminium pan. Samples were heated at 10 °C min−1 under the nitrogen flow rate of 30 ml min−1. The DSC thermograms were measured from 35–190 °C.Scanning electron microscopy (SEM)
A Hitachi SU-70 Scanning Electron Microscope (Hitachi, Japan) was used to obtain the SEM images in this study. An accelerating voltage of 5 kV was applied. A small amount of the powder was placed onto adhesive carbon tape previously attached to a cylindrical aluminium 15 mm SEM stub. The samples were coated with gold using an Emitech K550 (Emitech, United Kingdom) sputter coater at 20 mA for 90 s.Particle size analysis
The ImageJ java-based image processing program was used to analyse the average particle size from the SEM images. To determine the particle number distribution (Dn) for each sample, the diameter of 100 particles was measured.Stability testing
An Amebis U062 temperature-controlled cabinet was used to store samples for stability analysis. The stability conditions were set at ICH standard accelerated stability at 40 °C per 75% relative humidity (RH).34 A saturated solution of sodium chloride was used to obtain 75% RH.35 Samples were assessed at Day 0, Day 30, Day 60 and Day 90. The solid-state stability of the co-amorphous compounds at each timepoint was analysed by PXRD and SEM.Results & discussion
Solubility screening
Solubility screening was carried out for carbamazepine and chlorothiazide using several solvents: methanol, acetone and IPA. Methanol, acetone and IPA are classified as green solvents and are selected as preferred solvents by industry leaders such as Pfizer and Sanofi.36 These solvents are also preferred green solvents for spray drying.37,38 The results are displayed in Table 1. It was decided that for this investigation a green solvent would be used and chlorothiazide had the highest solubility in acetone. Acetone was, therefore, chosen as the solvent; both chlorothiazide and carbamazepine have a solubility of 10 mg ml−1 and 11 mg ml−1 in acetone, consecutively.| Solubility averages | |||
|---|---|---|---|
| Solvent | Solvent ratio | Chlorothiazide | Carbamazepine |
| Methanol | Pure | 0.003 g ml−1 | 0.075 g ml−1 |
| Acetone | Pure | ![[0 with combining low line]](https://www.rsc.org/images/entities/char_0030_0332.gif) . .![[0 with combining low line]](https://www.rsc.org/images/entities/char_0030_0332.gif) ![[1 with combining low line]](https://www.rsc.org/images/entities/char_0031_0332.gif) ![[0 with combining low line]](https://www.rsc.org/images/entities/char_0030_0332.gif) ![[g with combining low line]](https://www.rsc.org/images/entities/char_0067_0332.gif) ![[m with combining low line]](https://www.rsc.org/images/entities/char_006d_0332.gif) ![[l with combining low line]](https://www.rsc.org/images/entities/char_006c_0332.gif) −1 −1 |
![[0 with combining low line]](https://www.rsc.org/images/entities/char_0030_0332.gif) . .![[0 with combining low line]](https://www.rsc.org/images/entities/char_0030_0332.gif) ![[1 with combining low line]](https://www.rsc.org/images/entities/char_0031_0332.gif) ![[1 with combining low line]](https://www.rsc.org/images/entities/char_0031_0332.gif) ![[g with combining low line]](https://www.rsc.org/images/entities/char_0067_0332.gif) ![[m with combining low line]](https://www.rsc.org/images/entities/char_006d_0332.gif) ![[l with combining low line]](https://www.rsc.org/images/entities/char_006c_0332.gif) −1 −1 |
| IPA | Pure | 0.0007 g ml−1 | 0.009 g ml−1 |
The impact of process parameters on the yield
The 9 samples were spray dried at random and the results from each run are displayed in Table 2. The atomising gas flowrate was varied from 357 L h−1 to 742 L h−1, where lower atomising gas flowrates resulted in no product collecting. The feed flowrate was varied from 0.9 ml min−1 to 2.1 ml min−1, higher feed flowrates also resulted in no product collecting. The yield obtained ranged from 25.6% to 86.2%, from the results obtained it can be observed that higher atomising gas flowrates resulted in higher yields. The reason for this is explained further in the particle properties section.| Run no. | Feed (ml min−1) | Atomising gas (L h−1) | Inlet T (°C) | Outlet T (°C) | Yield (%) |
|---|---|---|---|---|---|
| 1 | 0.9 | 742 | 65 | 49–50 °C | 861.6 mg/1000 mg |
| 86.2% | |||||
| 2 | 2.1 | 742 | 65 | 49–50 °C | 811.5 mg/1000 mg |
| 81.2% | |||||
| 3 | 1.5 | 601 | 65 | 48–49 °C | 664.8 mg/1000 mg |
| 66.5% | |||||
| 4 | 0.9 | 601 | 65 | 49–51 °C | 772.4 mg/1000 mg |
| 77.2% | |||||
| 5 | 0.9 | 473 | 65 | 49–51 °C | 350.1 mg/1000 mg |
| 35.0% | |||||
| 6 | 1.5 | 742 | 65 | 49–50 °C | 774.0 mg/1000 mg |
| 77.4% | |||||
| 7 | 2.1 | 601 | 65 | 48–49 °C | 551.9 mg/1000 mg |
| 55.2% | |||||
| 8 | 2.1 | 473 | 65 | 48–50 °C | 210.7 mg/1000 mg |
| 25.6% | |||||
| 9 | 1.5 | 473 | 65 | 50–51 °C | 295.5 mg/1000 mg |
| 31.0% |
The results were input into JMP® Pro to produce the contour plot displayed in Fig. 2[A]. The contour plot is colour coded to show at which feed flowrates and atomising gas flowrates low yield (red) and high yields (green) can be obtained. The plot shows that feed flowrate has a minor influence on the yield within the ranges that were trialled, however, the atomising gas flowrate has a more significant effect. The prediction profiles displayed in Fig. 2[B]–[D] are based on the data reported herein and can be used to predict the yield for runs performed using different atomising gas flowrate or feed flowrate parameters within the limits of the DoE and subject to validation. The profile in Fig. 2[D], for example, shows that when the atomising gas flowrate is set at 742 L h−1 and the feed flowrate is set at 2.1 ml min−1 then the predicted yield is 76.1%, as obtained in this work. The prediction profiler further emphasises the trend in the contour plot showing that atomising gas flowrate has a more significant effect on yield. The prediction profiler shows that there was a 12% difference between using a feed flowrate of 0.9 ml min−1 and a feed flowrate of 2.1 ml min−1 when atomising gas flowrate was fixed. In contrast there was a 51% difference between using an atomising gas flowrate of 357 L h−1 and 742 L h−1 when feed flowrate is fixed.
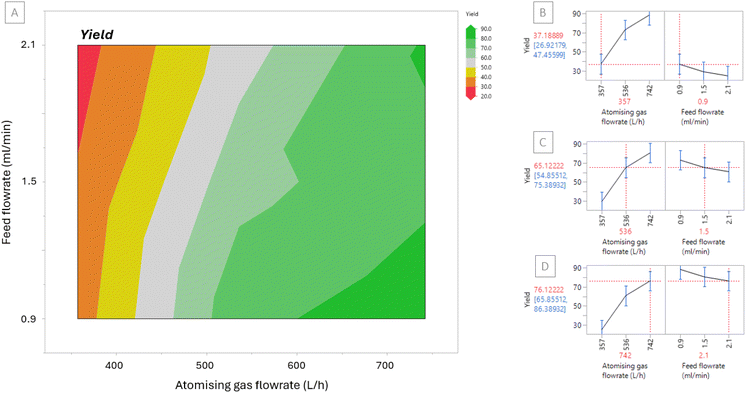 | ||
| Fig. 2 [A] Contour plot for yield based on Runs 1–9 [B]–[D] Prediction profile to predict yield at selected atomising gas and feed flowrates (red) including standard deviation values (blue). | ||
The impact of process parameters on the particle properties
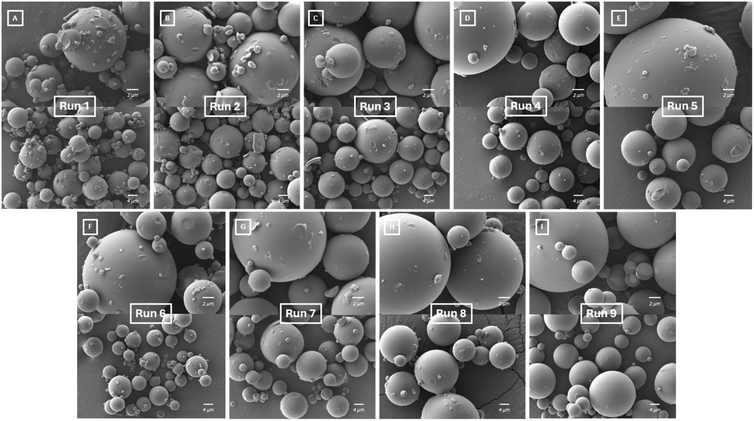
SEM images in Fig. 3 show the morphology of each of the spray dried samples, Runs 1–9. The morphology of the particles in each sample are spheres with smooth surfaces showing that the drying conditions were similar in each case. This morphology is beneficial for downstream processing; smoother particles have better flowability and compaction properties due to reduced frictional forces.39 Although the samples have a similar morphology, their particle sizes differ.The particle size of each sample was analysed from the SEM images and are displayed in Table 3. For all samples the Dn50 ranges from ∼4 μm to 7 μm. A contour plot of the Dn50 particle sizes is displayed in Fig. 4[A] where larger particle sizes are represented in red and smaller particle sizes are represented in green.
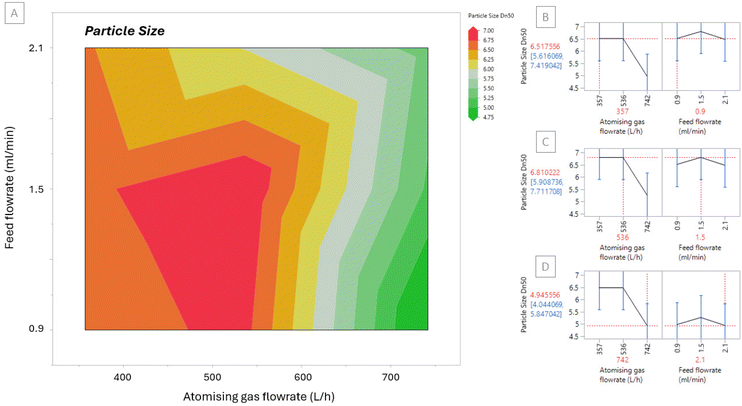 | ||
| Fig. 4 [A] Contour plot for Dn50 particle size based on Runs 1–9 [B]–[D] Prediction profile to predict particle size (red) at selected atomising gas and feed flowrates. | ||
It is advantageous to know the trends in spray dried particle size to be able to predict a desired particle size for downstream processing. The results also show that the highest atomising gas flowrate produced the smallest particle sizes which can explain why higher yields were also obtained. Smaller, lighter particles have a greater chance of reaching the sample collection vessel than larger, heavier, semi-dry particles that stick to the drying chamber and other glassware components rather than being collected at the sample collection point. Sticking was observed for the runs producing larger particles, Runs 5, 8 and 9, as a light layer of material deposited on the drying chamber and cyclone. The contour plot shows that the feed flowrate has a minor influence on the particle sizes obtained whereas the atomising gas flowrate has a much more significant effect. The prediction profiles in Fig. 4[B] shows how using the results obtained it can be predicted that if an atomising gas flowrate of 357 L h−1 and a feed flowrate of 0.9 ml min−1 is used, a particle size of 6.5 μm can be achieved. Fig. 4[C] and [D] show two more examples of selecting different atomising gas and feed flowrates to predict particle size. Using this predictor, a desired particle size for the spray dried sample can be manufactured.
The impact of process parameters on the solid-state
The PXRD diffractograms in Fig. 5 represent each of the spray dried samples. The absence of any crystalline peaks in the diffractograms confirms the formation of a co-amorphous mixture regardless of the process parameters.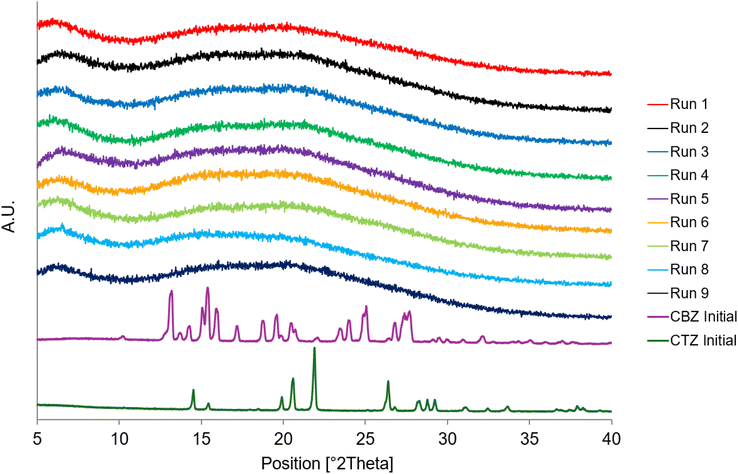 | ||
| Fig. 5 PXRD diffractograms of Runs 1–9 at Day 0 and the starting materials, CBZ Initial and CTZ Initial. | ||
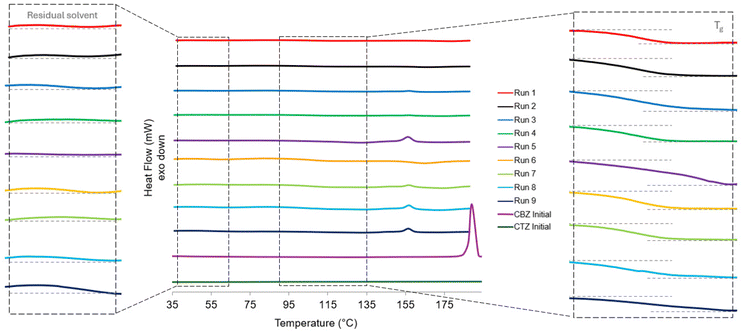
The DSC thermogram in Fig. 6 shows the thermogram for each of the spray dried samples. In contrast to the diffractograms, there are differences in the thermograms for the samples. This suggests that some of the samples have a portion of crystallinity present that is too low to be detectable by PXRD. For Run 5, Run 8 and Run 9, there is an endothermic peak present at 156 °C with an onset at 152 °C. For Run 3, Run 4 and Run 7 there is a smaller endothermic peak present at the same temperature and a glass transition temperature (Tg) mid-point at ∼100 °C (Fig. 6). The Tg for carbamazepine is between 52–61 °C40 and a Tg has not been reported for pure CTZ as its amorphous form is highly unstable.41 For Run 1, Run 2 and Run 6 there is no endothermic peak present suggesting that these samples are fully amorphous with a Tg mid-point at ∼100 °C (Fig. 6). The three samples with larger endotherms were produced at the lowest atomising gas flowrate whereas the three samples with no endotherm were produced at the highest atomising gas flowrate. This shows that the lower atomising gas flowrate produced larger droplet sizes which have longer drying times allowing for small crystals to form. In contrast, the higher atomising gas flowrate produced smaller droplets which dried rapidly and did not allow enough time for molecular rearrangement and crystallisation. The endotherm corresponds to the melting temperature of the CBZ-CTZ cocrystal at 155.75 °C.31 This confirms that there is a small presence of the cocrystal in the samples produced at lower atomising gas flowrates that is detectable by DSC analysis but not PXRD analysis. The melting temperature of the initial form of CBZ before spray drying is 190 °C; there is no onset for the melting endotherm present in any of the spray dried sample thermograms.1 The melting temperature for CTZ, the stable polymorphic form I, is 344.45 °C;31 however, the thermograms were measured up to 190 °C before CBZ decomposition occurred. After CBZ decomposes, this can affect the CTZ composition and solid-state in the samples.
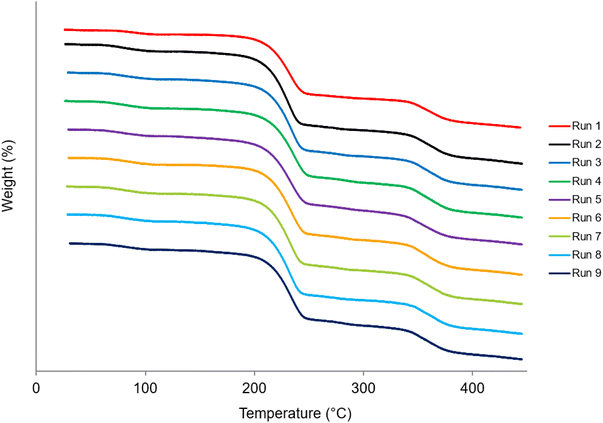
The TGA thermogram in Fig. 7 shows a residual solvent content being removed as well as the subsequent deposition of CBZ and CTZ. The TGA thermograms of the starting materials, CBZ Initial and CTZ Initial, are displayed in Fig. S1.† Table S2† shows the percentage of weight loss at different temperature ranges. The weight loss between 50 °C and 150 °C is due to residual solvent loss as acetone evaporates at its boiling point, 56 °C.42 The residual solvent loss is 4.8–5.5% for all samples. The solvent loss can also be observed in the magnified DSC thermograms in Fig. 6. The weight loss between 150 °C and 300 °C is due to the deposition of CBZ which occurs between 215.5–225 °C.40 The weight loss between 300 °C and 450 °C is due to the decomposition of CTZ which occurs as it begins to melt at its melting temperature 358.6 °C. There is no significant difference in the weight loss occurrences in the TGA results for each of the spray dried samples (Table S2†).
Stability testing
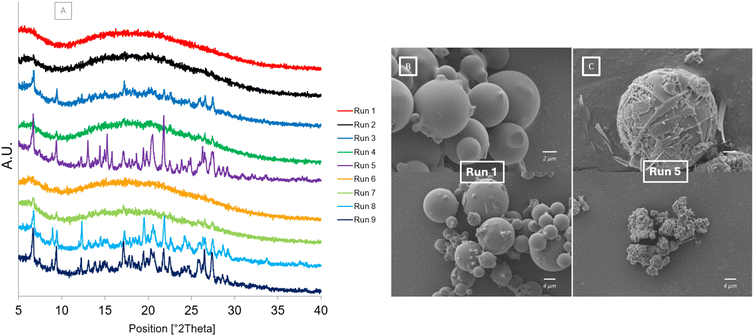
The PXRD and SEM results after one month at accelerated stability conditions are shown in Fig. 8. The diffractograms in Fig. 8[A] show that after one month at accelerated stability conditions some of the samples begin to crystallise. The diffractograms for Run 5, Run 8 and Run 9 have all slightly crystallised as shown by characteristic peaks of the cocrystal forming: 6.56°, 9.25°, 17.49°, 26.31°, 27.28° (Fig S2†). Run 5 also has additional peaks present at 8.94° and 12.32° which correspond to the dihydrate form of carbamazepine. Run 3, Run 4 and Run 7 are beginning to crystallise with only some characteristic peaks of the cocrystal present. Run 1, Run 2 and Run 6 all remain fully amorphous without any crystalline peaks present in their diffractograms. This shows the impact of the atomising gas flowrate, and subsequent droplet size, on the purity and subsequent stability of the co-amorphous mixture formed. Only the samples produced at the highest atomising gas flowrate remain unchanged and fully amorphous after 30 days. This is likely due to the smaller droplets produced at higher atomising gas flowrates drying faster and not allowing enough time for crystallisation to occur. The SEM images show Run 1 (Fig. 8[A]) and Run 5 (Fig. 8[B]) after 30 days at accelerated stability conditions, 40 °C per 75% RH. The morphology of Run 1 has not changed; however, the morphology of Run 5 has changed as it has started to crystallise. Fine needles and prism shaped crystals can be observed around the original spherical morphology. The only spray drying parameter that was changed between Run 1 and Run 5 was the atomising gas flowrate as these samples were both spray dried at the same feed flowrate of 0.9 ml min−1.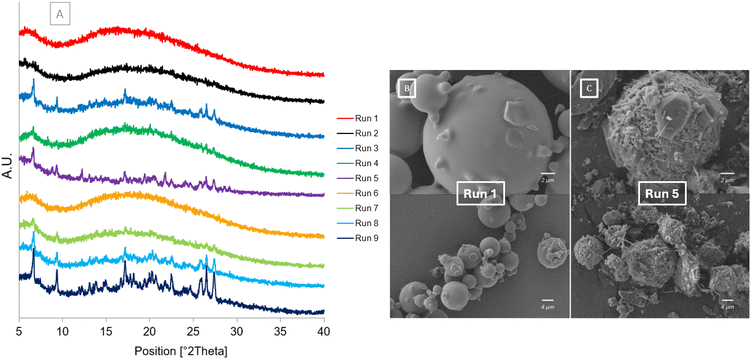 | ||
| Fig. 8 After storage at 40 °C/75% RH [A] PXRD diffractograms of Runs 1–9 at Day 30 [B] SEM image of Run 1 at Day 30 [C] SEM image of Run 5 at Day 30. | ||
The results after the samples were placed under accelerated stability conditions for 60 days are shown in Fig. 9. The diffractograms of the spray dried samples show a similar trend to the results after 30 days on stability. The crystalline peaks present in Run 5, Run 8 and Run 9 are more intense after 60 days. Run 5 has characteristic peaks of the CBZCTZ cocrystal31 present at 6.66°, 9.33°, 17.50°, 22.51°26.42°, 27.33°, CBZ form III43 present at 13.09°, 15.25° and 24.77°, CBZ dihydrate form44 present at 8.84° and 12.24° and CTZ form I29 present at 14.42°, 19.44°, 20.44°, 21.80° and 26.58° (Fig S2†). Run 8 and Run 9 have characteristic peaks of the CBZCTZ cocrystal and CTZ form I present, it is not clear if characteristic crystalline peaks of CBZ form III are also present. It can also be observed that the dihydrate form of carbamazepine can also be identified in Run 8 and Run 9 after 60 days. This shows that, for these samples, the cocrystal and both individual APIs begin to crystallise. The spray drying process rapidly isolates particles which may have led to the formation of certain particles which retained a homogeneous mixture of the two APIs and co-crystallised over time, whereas phase separation may have occurred in other particles over time leading to them crystallising into the individual APIs. Some particles may have become hydrated during storage leading to the formation of the dihydrate form of CBZ. The crystalline peaks present in Run 3, Run 4 and Run 7 have not changed significantly since day 30. The diffractograms for Run 1, Run 2 and Run 6 all remain unchanged and non-crystalline showing that the particles produced from smaller droplets did not have enough time to crystallise. The SEM images of Run 1 (Fig. 9[A]) and Run 5 (Fig. 9[B]) again show the contrast between the samples produced at different atomising gas flowrates. The morphology of Run 1 remains as smooth spherical particles whereas the morphology of Run 5 shows needle like crystals emerging from the spherical particles as a transformation takes place.
 | ||
| Fig. 9 After storage at 40 °C/75% RH [A] PXRD diffractograms of Runs 1–9 at Day 60 [B] SEM image of Run 1 at Day 60 [C] SEM image of Run 5 at day 60. | ||
The results after storing the samples at accelerated stability conditions for 90 days are displayed in Fig. 10. The PXRD diffractograms (Fig. 10[A]) show that all crystalline peaks present in Run 5, Run 8 and Run 9 appear to be more intense. It can be observed that after 90 days, the dihydrate form of CBZ is no longer present at 8.84° and 12.24° in Run 3 and its characteristic peaks in Run 9 are less intense. This indicates that over time, under the accelerated storage conditions, the dihydrate form of CBZ present in the samples is transforming into the stable form III.45 The peaks present for Run 3, Run 4 and Run 7 do not appear as intense, even after 90 days. For Run 1, Run 2 and Run 6 the samples appear to remain amorphous with no characteristic crystalline peaks present. The SEM image of Run 1 (Fig. 10[B]) shows that the morphology of the sample remains smooth and spherical, however, there is a trace of small needle shaped particles observed. This indicates the possible initiation of the sample transforming to a crystalline phase due to phase separation occurring at the high humidity condition. Water increases the molecular mobility of the API which can allow for crystallisation to occur.5 In contrast, the SEM image of Run 5 (Fig. 10[C]) shows that the spherical shaped particles are transforming to needles. As these needles are as a result of a combination of the cocrystal, and each API crystallising simultaneously, multiple crystal habits with different orientations are forming. The only difference between Run 1 and Run 5 causing this significant change in amorphous form stability is the atomising gas flowrate set in the spray dryer.
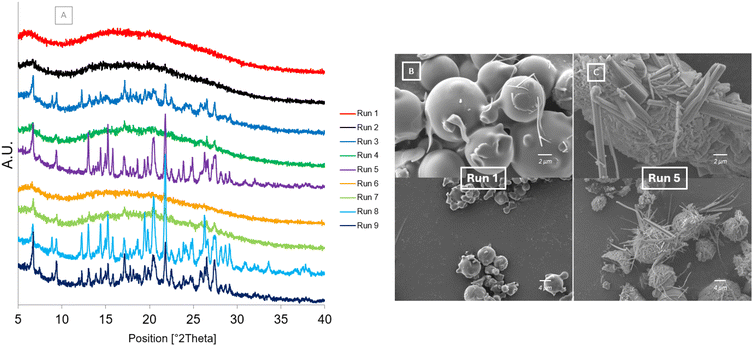 | ||
| Fig. 10 After storage at 40 °C/75% RH [A] PXRD diffractograms of Runs 1–9 at Day 90 [B] SEM image of Run 1 at Day 90 [C] SEM image of Run 5 at Day 90. | ||
The impact of optimising spray drying process parameters for co-amorphous systems
The stability results presented herein show a trend is emerging between the atomising gas flowrate and co-amorphous purity. As the atomising gas flowrate increases, the co-amorphous purity increases. The feed flowrate does not have a significant effect. This can be explained in terms of droplet size and subsequent drying time. A low atomising gas flowrate will produce larger droplets in the spray drying process which require more time for solvent evaporation and particle drying. As a result, there is more time for nucleation to occur to initiate the crystallisation process. It is likely that in this case, when the atomising gas flowrate was set at 357 L h−1 that some nuclei began to form during the spray drying process which subsequently seeded the transformation of portions of the samples over time. Alternatively, over time phase separation of the two APIs can occur due to environmental factors such as exposure to high humidity.5,8,46,47 In contrast, at high atomising gas flowrates smaller droplets are produced which require less time for solvent evaporation. The shorter time for drying reduces the chance for nucleation to occur. This can explain how the co-amorphous particles isolated at 742 L h−1 had a high purity and prolonged stability. The smaller droplet size could also act as a confinement space preventing particle reorganisation and crystallisation.1The greatest challenge when producing amorphous or co-amorphous products is producing pure, non-crystalline products and prolonging their stability. In most cases it is the addition of excipients that is recommended to prolong their stability, such as polymer matrices and mesoporous silica.16 Particle coating with a surfactant could also help prolong the stability of the co-amorphous mixture.21 If a co-amorphous system demonstrates poor stability generally the first protocol is to increase excipient load in order to stabilise the amorphous form. This can be unfavourable as the volume of excipient an end user should be ingesting should be the minimum quantity required in order for the active ingredient to perform effectively. This study demonstrates how optimising a spray drying process can produce co-amorphous products of higher purity which can prolong their stability. Increasing the atomising gas flowrate can produce high purity co-amorphous products without the use of additives or excipients. Additionally, the amorphous form of CTZ is not stable and is prone to rapid crystallisation,41 however, as demonstrated, it can be stabilised in a co-amorphous formulation by choosing the right spray drying conditions. The addition of a small quantity of polymer to form a ternary co-amorphous mixture has also demonstrated potential in preventing phase separation over time and prolonging the stability of a co-amorphous mixture.48
As well as optimising the spray drying parameters to prolong stability of amorphous products, the study also provides a guide to predicting and controlling the particle size and yield of a co-amorphous mixture by spray drying. By increasing the atomising gas flowrate small particle sizes can be obtained, whereas increasing the atomising gas flowrate can produce larger particles. Smaller particles can be beneficial in terms of having a higher surface area with positive implications for the dissolution49 whereas larger particles can have more desirable compaction and flowability properties.50 Increasing the atomising gas flowrate can also increase the yield of the co-amorphous mixture by spray drying. Overall, the feed flowrate, in this case, did not show any significant effect on the co-amorphous purity, the particle size or the yield.
Conclusion
Spray drying parameters can have a direct impact on the solid-state and particle properties of the sample produced. The PXRD results initially showed the complete transformation of the mixture of CBZ and CTZ to a co-amorphous system at all spray drying conditions while DSC results revealed the presence of a minor crystalline phase identified as the cocrystal in some samples produced at lower atomising gas flowrates. The accelerated stability study showed the effect of altering the atomising gas flowrate on the stability of the co-amorphous system produced; for samples produced at lower atomising gas flowrates, the samples recrystallised over time to a mixture of the cocrystal and individual APIs. On the other hand, increasing the atomising gas flowrate reduced the droplet sizes, which increased the amorphous purity, yield and produced smaller particle sizes of the co-amorphous system. This study shows the potential of spray drying as a technique for producing and controlling the stability of co-amorphous systems by controlling the solid-state properties using the process parameters such as atomising gas flowrate. These findings have significant implications for co-amorphous product manufacturing whereby controlling process parameters to stabilise co-amorphous systems can prevent the need for adding high excipient load to stabilise the co-amorphous system.Data availability
The data supporting this article have been included as part of the ESI.†Conflicts of interest
There are no conflicts to declare.Acknowledgements
The research conducted in this publication was funded by the Irish Research Council under grant number [GOIPG/2020/1648]. This work was supported by SSPC, the SFI Research Centre for Pharmaceuticals, under grant number [12/RC/2275_P2].References
- A. Parkes, et al., Controlled isolation and stabilisation of pure metastable carbamazepine form IV by droplet-confinement via a continuous manufacturing route, CrystEngComm, 2022, 24, 6825–6829 RSC.
- A. Ziaee, et al., Spray drying of pharmaceuticals and biopharmaceuticals: Critical parameters and experimental process optimization approaches, Eur. J. Pharm. Sci., 2019, 127, 300–318 CrossRef CAS PubMed.
- P. Sacchi, et al., Crystal size, shape, and conformational changes drive both the disappearance and reappearance of ritonavir polymorphs in the mill, Proc. Natl. Acad. Sci. U. S. A., 2024, 121(15), e2319127121 CrossRef CAS PubMed.
- S. R. Chemburkar, et al., Dealing with the impact of ritonavir polymorphs on the late stages of bulk drug process development, Org. Process Res. Dev., 2000, 4(5), 413–417 CAS.
- X. Ma and R. O. Williams III, Characterization of amorphous solid dispersions: An update, J. Drug Delivery Sci. Technol., 2019, 50, 113–124 CrossRef CAS.
- D. Singhal and W. Curatolo, Drug polymorphism and dosage form design: a practical perspective, Adv. Drug Delivery Rev., 2004, 56(3), 335–347 CAS.
- D. Zhou, et al., Physical Stability of Amorphous Pharmaceuticals: Importance of Configurational Thermodynamic Quantities and Molecular Mobility, J. Pharm. Sci., 2002, 91(8), 1863–1872 Search PubMed.
- Q. Shi, S. M. Moinuddin and T. Cai, Advances in coamorphous drug delivery systems, Acta Pharm. Sin. B, 2019, 9(1), 19–35 Search PubMed.
- M. Karimi-Jafari, et al., Creating Cocrystals: A Review of Pharmaceutical Cocrystal Preparation Routes and Applications, Cryst. Growth Des., 2018, 18(10), 6370–6387 CAS.
- S. Kalepu and V. Nekkanti, Insoluble drug delivery strategies: review of recent advances and business prospects, Acta Pharm. Sin. B, 2015, 5(5), 442–453 Search PubMed.
- R. B. Chavan, et al., Co amorphous systems: A product development perspective, Int. J. Pharm., 2016, 515(1–2), 403–415 CrossRef CAS.
- A. Ziaee, et al., Spray drying ternary amorphous solid dispersions of ibuprofen – An investigation into critical formulation and processing parameters, Eur. J. Pharm. Biopharm., 2017, 120, 43–51 CrossRef CAS.
- K. Löbmann, et al., Coamorphous drug systems: enhanced physical stability and dissolution rate of indomethacin and naproxen, Mol. Pharm., 2011, 8(5), 1919–1928 CrossRef PubMed.
- K. Hashim Ali, et al., Enhanced dissolution of valsartan-vanillin binary co-amorphous system loaded in mesoporous silica particles, J. Microencapsulation, 2019, 36(1), 10–20 CrossRef CAS PubMed.
- J. Liu, et al., Co-amorphous drug formulations in numbers: Recent advances in co-amorphous drug formulations with focus on co-formability, molar ratio, preparation methods, physical stability, in vitro and in vivo performance, and new formulation strategies, Pharmaceutics, 2021, 13(3), 389 Search PubMed.
- Q. Shi, et al., Co-amorphous Drug Delivery Systems: a Review of Physical Stability, In Vitro and In Vivo Performance, AAPS PharmSciTech, 2022, 23(7), 259 Search PubMed.
- R. Laitinen, et al., Emerging trends in the stabilization of amorphous drugs, Int. J. Pharm., 2013, 453(1), 65–79 Search PubMed.
- H. Wang, et al., Drug–drug co-amorphous systems: An emerging formulation strategy for poorly water-soluble drugs, Drug Discovery Today, 2024, 29(2), 103883 Search PubMed.
- J. F. Silva, et al., Introduction to Pharmaceutical Co-amorphous Systems Using a Green Co-milling Technique, J. Chem. Educ., 2023, 100(4), 1627–1632 Search PubMed.
- S. J. Dengale, et al., Recent advances in co-amorphous drug formulations, Adv. Drug Delivery Rev., 2016, 100, 116–125 Search PubMed.
- G. Craye, et al., Characterization of amorphous and co-amorphous simvastatin formulations prepared by spray drying, Molecules, 2015, 20(12), 21532–21548 CAS.
- J. Mishra, et al., Influence of solvent composition on the performance of spray-dried co-amorphous formulations, Pharmaceutics, 2018, 10(2), 47 Search PubMed.
- A. Beyer, et al., Preparation and recrystallization behavior of spray-dried co-amorphous naproxen–indomethacin, Eur. J. Pharm. Biopharm., 2016, 104, 72–81 CAS.
- A. L. Grzesiak, et al., Comparison of the four anhydrous polymorphs of carbamazepine and the crystal structure of form I, J. Pharm. Sci., 2003, 92(11), 2260–2271 CAS.
- D. Huang, et al., Phase solubility investigation and theoretical calculations on drug-drug cocrystals of carbamazepine with Emodin, Paeonol, J. Mol. Liq., 2021, 329, 115604 CAS.
- E. D. Freis, et al., Treatment of essential hypertension with chlorothiazide (Diuril): its use alone and combined with other antihypertensive agents, J. Am. Med. Assoc., 1958, 166(2), 137–140 CrossRef CAS PubMed.
- R. M. Kaiser, The Introduction of the Thiazides: A Case Study in Twentieth-Century, in The Inside Story of Medicines: A Symposium, American Institute of the History of Pharmacy, 1997 Search PubMed.
- M. Majrashi, et al., Experimental measurement and thermodynamic modeling of Chlorothiazide solubility in supercritical carbon dioxide, Case Stud. Therm. Eng., 2023, 41, 102621 CrossRef.
- I. D. Oswald, et al., High-pressure structural studies of the pharmaceutical, chlorothiazide, CrystEngComm, 2010, 12(9), 2533–2540 RSC.
- R. K. Brydson and A. R. Kennedy, A monoclinic polymorph of chlorothiazide, Struct. Rep., 2024, 80(7), 806–810 CAS.
- M. Aljohani, et al., A Comprehensive Cocrystal Screening Study of Chlorothiazide, Cryst. Growth Des., 2017, 17(10), 5223–5232 CrossRef CAS.
- S. N. Wong, et al., Cocrystal engineering of pharmaceutical solids: therapeutic potential and challenges, CrystEngComm, 2021, 23(40), 7005–7038 RSC.
- C. Aundhia, et al., Spray Drying in the pharmaceuticaul Industry-A Review, J. Pharm. Res., 2011, 2, 63–65 Search PubMed.
- EMA. Stability testing of new drug substances and products. ICH Q1A (R2) 2003 1-24]; Available from: https://www.ema.europa.eu/en/ich-q1a-r2-stability-testing-new-drug-substances-drug-products-scientific-guideline.
- L. Greenspan, Humidity fixed points of binary saturated aqueous solutions, J. Res. Natl. Bur. Stand., 1977, 81(1), 89–96 CrossRef.
- F. P. Byrne, et al., Tools and techniques for solvent selection: green solvent selection guides, Sustainable Chem. Processes, 2016, 4(1), 7 CrossRef.
- B. B. Patel, et al., Revealing facts behind spray dried solid dispersion technology used for solubility enhancement, Saudi Pharm. J., 2015, 23(4), 352–365 CrossRef.
- D. Walsh, et al., Engineering of pharmaceutical cocrystals in an excipient matrix: Spray drying versus hot melt extrusion, Int. J. Pharm., 2018, 551(1), 241–256 CrossRef CAS PubMed.
- J. Y. S. Tay, et al., Effects of particle surface roughness on in-die flow and tableting behavior of lactose, J. Pharm. Sci., 2019, 108(9), 3011–3019 CrossRef CAS PubMed.
- A. Dołęga, P. M. Zieliński and N. Osiecka-Drewniak, New insight into thermodynamical stability of carbamazepine, J. Pharm. Sci., 2019, 108(8), 2654–2660 CrossRef.
- K. J. Paluch, et al., Impact of alternative solid state forms and specific surface area of high-dose, hydrophilic active pharmaceutical ingredients on tabletability, Mol. Pharm., 2013, 10(10), 3628–3639 CrossRef CAS.
- W. L. Luyben, Control of the maximum-boiling acetone/chloroform azeotropic distillation system, Ind. Eng. Chem. Res., 2008, 47(16), 6140–6149 CAS.
- V. L. Himes, A. D. Mighell and W. H. De Camp, Structure of carbamazepine: 5H-dibenz [b, f] azepine-5-carboxamide, Acta Crystallogr. B: Struct. Crystallogr. Cryst. Chem., 1981, 37(12), 2242–2245 Search PubMed.
- A. Kogan, et al., Microemulsion–Facilitated Crystallization of Carbamazepine, J. Dispersion Sci. Technol., 2007, 28(7), 1008–1019 CAS.
- A. V. Hall, A. J. Cruz-Cabeza and J. W. Steed, What Has Carbamazepine Taught Crystal Engineers?, Cryst. Growth Des., 2024, 24, 7342–7360 CAS.
- D. E. Moseson, et al., Trends in amorphous solid dispersion drug products approved by the U.S. Food and Drug Administration between 2012 and 2023, Int. J. Pharm.: X, 2024, 7, 100259 CAS.
- C. Luebbert, C. Klanke and G. Sadowski, Investigating phase separation in amorphous solid dispersions via Raman mapping, Int. J. Pharm., 2018, 535(1), 245–252 Search PubMed.
- L. Arnfast, et al., Melt extrusion of high-dose co-amorphous drug-drug combinations: theme: formulation and manufacturing of solid dosage forms guest editors: Tony Zhou and Tonglei Li, Pharm. Res., 2017, 34, 2689–2697 Search PubMed.
- X. Zhang, et al., Pharmaceutical dispersion techniques for dissolution and bioavailability enhancement of poorly water-soluble drugs, Pharmaceutics, 2018, 10(3), 74 CrossRef CAS PubMed.
- H. Mangal, M. Kirsolak and P. Kleinebudde, Roll compaction/dry granulation: Suitability of different binders, Int. J. Pharm., 2016, 503(1–2), 213–219 CAS.
Footnote |
| † Electronic supplementary information (ESI) available. See DOI: https://doi.org/10.1039/d4pm00257a |
| This journal is © The Royal Society of Chemistry 2025 |

