 Open Access Article
Phosphoric acid based geopolymer foam-activated carbon composite for methylene blue adsorption: isotherm, kinetics, thermodynamics, and machine learning studies
Muhammad Irfan Khan *ab,
Suriati Sufian*ab,
Farrukh Hassanc,
Rashid Shamsuddin
 d and
Muhammad Farooqe
aDepartment of Chemical Engineering, Universiti Teknologi PETRONAS, Bandar Sri Iskandar, Perak 32610, Malaysia
bCentre of Innovative Nanostructures & Nano Devices (COINN), Institute of Autonomous System, Universiti Teknologi PETRONAS, Seri Iskandar, Perak, Malaysia
cDepartment of Data Science and Artificial intelligence, School of Engineering and Technology, Sunway University, Bandar Sunway, Subang Jaya, Malaysia
dDepartment of Chemical Engineering, Faculty of Engineering, Islamic University of Madinah, 42311, Madinah, Saudi Arabia
eNational Centre of Excellence in Physical Chemistry, University of Peshawar, Peshawar, Pakistan
First published on 22nd January 2025
Abstract
In this study, a binary composite adsorbent based on activated carbon and phosphoric acid geopolymer foam (ACP) was prepared by combining phosphoric acid geopolymer (PAGP) with activated carbon (AC) and applied for the removal of methylene blue (MB). Activated carbon was thoroughly mixed with a mixture of fly ash and metakaolin in varying ratios, followed by phosphoric acid activation and thermal curing. The ACP adsorbent was characterized using scanning electron microscope (SEM), Fourier transform infrared (FTIR) spectrophotometer, X-ray diffractometer (XRD), surface area analyser (SAP), and thermogravimetric analyser (TGA). Batch analysis was performed to examine the effects of various adsorption parameters including pH (2, 4, 6, 7, 8, and 10), adsorbent dosage (0.06–0.2 g), MB concentration (50–250 mg L−1), contact duration (up to 240 minutes), and temperature (25–55 °C). The ACP with 70% PAGP and 30% AC was found to be the most suitable adsorbent as it maintained its structure and exhibited better MB adsorption. The ACP had a surface area of 47.36 m2 g−1 and a pore size of 5.6 nm and was found to be amorphous in nature. The adsorption equilibrium reached in 240 minutes at pH 7, indicating an efficient adsorption process. The adsorption increased with the initial dye concentration and decreased with the increase in temperature. The ideal parameters for adsorption of MB using ACP include 0.2 g of adsorbent, 25 °C, pH 10, and 240 minutes. The adsorption data fitted well with the Langmuir isotherm, pseudo-second-order (PSO) kinetics model, and three-step intraparticle diffusion (IPD) model. The adsorption capacity calculated using the Langmuir isotherm was 204.8 mg g−1 with an R2 = 0.989. Thermodynamics parameters showed that the adsorption process was exothermic, energetically favourable, and associated with a decrease in entropy. According to the FTIR findings, pH effect, Langmuir isotherm, PSO kinetics, IPD model, and thermodynamics factors, chemisorption is identified as the predominant process. Different machine learning models, i.e., gaussian process regression (GPR), support vector regression (SVR and SVR-rbf), random forest regression (RFR), decision tree regression (DTR) and artificial neural network (ANN), were trained and tested using adsorption capacity and % removal data. The ANN model (random search) demonstrated better performance compared to other models, achieving an R2 value of 0.873 for adsorption capacity and 0.799 for % removal on test data.
1 Introduction
Dye production is increasing exponentially to meet the demand and choice of the growing global population.1,2 At a compound annual growth rate of 4.6%, the size of the global market for textile dyes is expected to increase from USD 11.1 billion in 2022 to USD 14.0 billion by 2027. This market is being driven by factors, such as growing demand for cellulose fibre dyes and rising demand from the apparel sector.3 This increasing production has directly increased the discharge of dyes into water bodies, as nearly 15–50% of the dye is wasted during the dying process.4 In garment-producing countries, streams near textile industries are deeply coloured due to the discharge of waste dyes.5 Methylene blue (MB) dye, a complex molecule, is cationic in nature due to a large cationic group, and is employed in textile, leather and polymer industries for dyeing cotton, silk, yarn, shoes, leather, jackets, etc..6 The consequences of exposure to MB include permanent damage to eyes, local burns, nausea, vomiting, mental disorders, and methemoglobinemia. Moreover, MB potentially interferes with the respiration process and may cause carcinoma due to its aromatic structure.4 Additionally, light penetration through the water bodies is blocked by MB leading to reduced photosynthesis of aquatic plants.6,7 All these problems caused by the discharge of MB into the environment as waste emphasize upon its remediation from waste water.Treatment techniques used to screen out MB from the environment include physicochemical (mostly adsorption),8 chemical (using sophisticated oxidation processes),9 and biological (using enzymes and microorganisms) methods.10,11 Adsorption is one of the effective and economic techniques that has the advantage of having realistic working conditions and does not produce secondary contaminants as in the case of chemical technique, e.g. photo catalysis.11,12 The adsorption of dyes is achieved by employing solid adsorbents possessing a large surface area, assembly of active surface functional groups, and robust chemical and physical stability.13 Adsorbents studied for the dyes removal from waste water include carbon-based materials such as activated carbon,14 carbon nanotubes,15 graphene and graphene oxide.16–18 Carbonaceous adsorbents pose a threat to the forestation and plantation, cause thermal pollution, and have poor thermal stability.11 Polymeric adsorbents, a synthetic alternative to carbonaceous adsorbents, are emerging as adsorbents of choice due to their ready availability, commercial production, raw material availability, mechanical stability and tailoring of properties according to the use.19 Despite the advantages offered by polymeric adsorbents, synthetic polymers are increasingly recognized as contemporary pollutants due to the release of toxic chemicals as waste and the production of micro and nanoplastics.20–22 Owing to their very small size, microplastics (MPs) and nanoplastics (NPs) can enter not only to the ecosystem but are detected in human blood and organs, e.g., lungs, liver, gut, and face etc. A litre of bottled water included, on average, almost 2.4 × 10⁵ plastic particles, mostly (90%) in the form of nanoplastics.23 MPs and NPs build up in different organs, causing damage that hinders cellular enzyme action, promotes oxidative stress, or leads to localized inflammation.22,24 Other than microplastics, polymeric products release certain chemicals that are toxic to living organisms, e.g. bisphenol A (BPA) released from plastic container is found to cause early type II diabetes due to insulin resistance.21 Besides diabetes, BPA exposure can cause gene expression leading to the propagation of diseases over generations.25 Owing to the environmental and health risks associated with polymeric products, researchers are attempting to produce environment-friendly and healthy materials to replace their polymeric counterparts.26
Geopolymer and geopolymeric composites have emerged as replacement adsorbents of environmental importance, as they are prepared from waste raw materials, e.g., coal fly ash, steel slag, and ore waste.2 Secondarily, geopolymers are successfully used to adsorb pollutants such as heavy metals,27 uranium,28 dyes,7,29 ammonium and phosphate ions,30 rare earth elements,31 pesticides,32 antibiotics,33 CO2![[thin space (1/6-em)]](https://www.rsc.org/images/entities/char_2009.gif) 34 and surfactants.35 Geopolymers have the potential to partially or completely replace carbonaceous adsorbents for wastewater treatment applications.36 Due to the lower adsorption capacity of geopolymers,37 partial replacement of activated carbon will result in enhanced remediation of pollutants. The binding behaviour of geopolymers helps in maintaining the integrity of the carbon-based adsorbents and offers better thermal stability. In most of the previous studies, alkali-activated geopolymers alone or in combination with secondary materials are used as adsorbents for dye removal.2 In the case of PAGPs, metakaolin is preferably used as a raw material, as fly ash-based PAGPs harden very quickly.38 Due to sharp exotherm and quicker setting, FA-based PAGPS cannot be transformed to foam, and require additional changes in the formulation. The incorporation of metakaolin to regulate setting and exothermic reactions, hydrogen peroxide for foaming, and activated carbon to improve dye adsorption offers a solution to the challenges associated with FA-based PAGPs.
34 and surfactants.35 Geopolymers have the potential to partially or completely replace carbonaceous adsorbents for wastewater treatment applications.36 Due to the lower adsorption capacity of geopolymers,37 partial replacement of activated carbon will result in enhanced remediation of pollutants. The binding behaviour of geopolymers helps in maintaining the integrity of the carbon-based adsorbents and offers better thermal stability. In most of the previous studies, alkali-activated geopolymers alone or in combination with secondary materials are used as adsorbents for dye removal.2 In the case of PAGPs, metakaolin is preferably used as a raw material, as fly ash-based PAGPs harden very quickly.38 Due to sharp exotherm and quicker setting, FA-based PAGPS cannot be transformed to foam, and require additional changes in the formulation. The incorporation of metakaolin to regulate setting and exothermic reactions, hydrogen peroxide for foaming, and activated carbon to improve dye adsorption offers a solution to the challenges associated with FA-based PAGPs.
Machine learning (ML), an important component of artificial intelligence (AI), uses algorithms to train models for predictive purposes, eliminating the need for explicit programming for each task.39 The key determinants of AI applications are their simplicity and cost-effectiveness, as they enable exact issue estimate, processing of large amounts of complicated data, and solving highly nonlinear problems that are beyond the reach of empirical equations. Several AI models such as artificial neural network (ANN), multilinear regression (MLR), radial basis function (RBF), support vector machine (SVM), decision tree, random forest regression and artificial neural netweork (ANN) have potentially predicted the adsorption of pollutants from wastewater.39,40 Chong Liu et al. used 12 different machine learning models to predict the adsorption of eight dyes, and the gradient boosting regressor outperformed all models with an R2 value of 0.988 for a total of 627 data points.41 In another study, adsorbents derived from the leaves of Citrus aurantifolia were used for MB adsorption, and the adsorption was predicted using 8 different ML models, among which the linear regression was found to be the best model.42 In most of the previous studies, either % removal or adsorption capacity was used as a dependent variable. As the ML models vary with the type of adsorbents and adsorbates, it is desirable to find an appropriate model for MB adsorption using ACP adsorbents.
In this work, a phosphoric acid based geopolymer foam-activated carbon composite is reported with the aim to partially replace maximum portion of AC by the geopolymer. An activated carbon-phosphoric acid-based geopolymer composites was synthesized in this work and used for MB adsorption. The adsorption parameters were studied using conventional and machine learning models. This work is first of its nature where a phosphoric acid geopolymer foam-based activated carbon composite is prepared and then used for MB removal with the aid of ML tools.
2 Material and methods
2.1 Materials
A power plant located in Lumut, Malaysia, provided powdered coal fly ash (FA), which was used in its original state without any additional treatment. The X-ray fluorescence (XRF) analysis revealed that FA is composed of 44.52% SiO2, 22.5% Al2O3, 11.6% Fe2O3, and 9.84% CaO and classified as class F-fly ash.43 Methylene blue, kaolin, phosphoric acid, hydrogen peroxide, sodium hydroxide, hydrochloric acid, ethanol, and isopropanol were obtained from local chemical suppliers. The Milli-Q deionized water having resistivity of 18.2 MΩ cm at 25 °C was used throughout this research. Furthermore, activated carbon was used for the preparation of ACP adsorbents.2.2 Preparation of the adsorbent
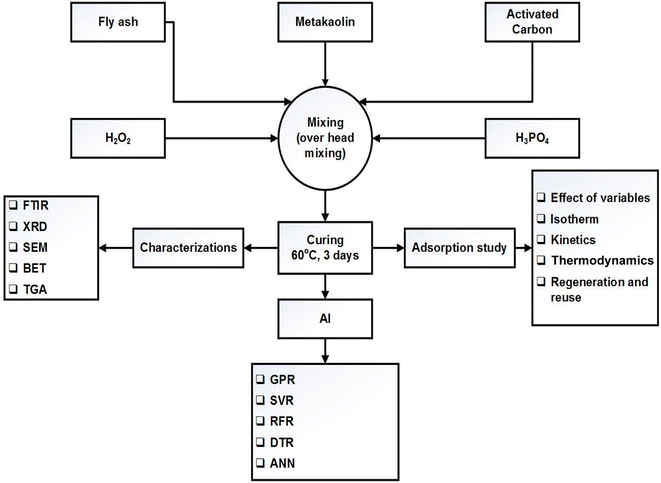
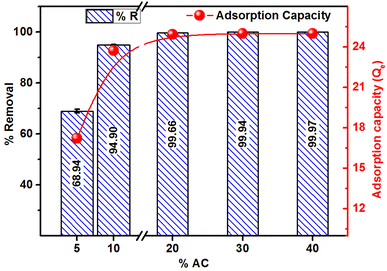
Metakaolin was prepared using kaolin in a furnace (Protherm, Turkey) via thermal conversion at 700 °C for 6 hours following the procedure reported earlier.29 Then 60% H3PO4 solution was prepared, using deionized water and phosphoric acid (R&M chemicals, 85%), 24 hours before geopolymer formation. To control the mechanical processing of the resulting geopolymer, both metakaolin and fly ash were used as starting materials. Raw material (60% fly ash and 40% metakaolin) and activated carbon (5–40% by mass of the aluminosilicate precursor) were taken in a plastic/Teflon beaker and thoroughly mixed for 30 minutes using an overhead stirrer to prepare a uniform mixture. A certain amount of phosphoric acid solution (keeping a P to Al mole ratio of 1/1) was added dropwise to make a paste while mechanically mixing the mixture. To reduce the effect of heat produced and to ensure controlled setting during geopolymerization, the beaker was immersed in a water bath at 25 °C. Hydrogen peroxide (1 mass percent of the raw material) was added to the geopolymer paste at room temperature. Mixing H2O2 before PA addition resulted in sudden expansion of the geopolymer and is not advisable. The sample was further mixed for 5 minutes to ensure complete mixing of hydrogen peroxide with the geopolymer paste and left at room temperature overnight. The black-coloured geopolymer paste was then cured in an oven at 60 °C for 72 hours. The activated carbon geopolymer foam obtained in this process was thoroughly washed with deionized water to remove any unreacted phosphoric acid, hydrogen peroxide, or any soluble salt formed during this geopolymerization process. Lastly, it was oven-dried at 105 °C till constant mass. A detailed flow sheet diagram of the protocol is given in Fig. 1. The prepared adsorbent was characterized using various instrumental techniques and used for the adsorption of methylene blue from model water.2.3 Characterisation of ACP
The ACP adsorbent was characterized by Fourier transform infrared (FTIR) spectroscopy, X-ray diffraction (XRD), scanning electron microscopy (SEM), surface analysis and porosimetry (SAP) and thermogravimetric analysis (TGA), following standard methods reported in the literature.29,43 An ATR-FTIR spectrometer (PerkinElmer, US) was used for FTIR analysis of the PAGP and ACP samples, in the wavelength range of 4000 cm−1 to 450 cm−1. Solid PAGP and ACP samples placed on the ATR window and pressed for 80% were scanned at 4 scans per sample. The data were baseline-corrected when required and normalized in the range of 0–100. Using an X-ray diffractometer (Panalytical, X'pert Powder), the amorphous nature of the samples and the existence of crystalline phases were determined in the 2-theta range of 2–80°. The data obtained were corrected for the baseline and smoothed when required. Scanning electron microscopic analysis was performed to explore the microstructure of the ACP and PAGP. Typically, samples were mounted on an aluminium stub using a carbon tape and then examined at a magnification in the range of 100–7000× using a 10 keV scanning electron microscope (TESCAN Vega, Czech Republic). Employing the energy-dispersive X-ray (EDX) function of the SEM, the chemical compositions of the ACP and PAGP were established.The surface area, pore diameter and pore volume of the adsorbent were determined using a surface area and porosity analyser (ASAP 2020, Micromeritics) by N2 adsorption and desorption methods. The samples were degassed at 100 °C for 240 minutes. A simultaneous thermal analyzer (STA 6000, PerkinElmer) was used for the thermogravimetric analysis of the ACP sample. About 5 mg sample was thermally analysed under an inert (N2) atmosphere, in the temperature range of 30 °C to 700 °C at a heating rate of 10 °C min−1.
2.4 Adsorption study
Table 1 lists the conditions under which the effects of pH, amount of adsorbent, concentration of MB solution, time of contact, and temperature were investigated. To explore the impact of pH, 50 ml of 250 mg L−1 of MB solution and 0.2 g of ACP were mixed and agitated at 230 rpm for 240 minutes at ambient temperature in a multipurpose orbital shaker (PSU 20i, Biosan). The effect of the amount of the adsorbent was examined by adding 0.06, 0.08, 0.10, 0.12, 0.15, and 0.20 g of ACP to 50 ml of 250 mg L−1 MB solution and the mixture was shaken for 240 minutes. The influence of MB concentration was assessed by dynamically shaking MB solutions of 50, 100, 150, 200, and 250 mg L−1 concentration with 0.2 g of adsorbent for four hours. The impact of temperature and time was investigated by looking at the MB adsorption at different temperatures (25 °C to 55 °C) and time intervals (10 minutes to 240 minutes), as shown in Table 1. A UV-Vis spectrophotometer (UV-1800, Shimadzu, Japan) in photometric mode was used to analyse the concentration of MB solution in these samples. By applying a single-wavelength calibration curve method, the concentration of MB solution was determined at a fixed wavelength of 664 nm, with 1–25 mg L−1 MB solutions serving as the standards. The % removal and adsorption capacity of the samples were determined using eqn (1) and (2):
 | (1) |
 | (2) |
| pH | Dosage (g) | Conc. (mg L−1) | Time (min) | Temp (°C) | |
|---|---|---|---|---|---|
| Effect of pH | 2, 4, 6, 7, 8, 10 | 0.2 | 250 | 240 | 25 |
| Effect of dosage | 7 | 0.06, 0.08, 0.10, 0.12, 0.15, 0.20 | 250 | 240 | 25 |
| Effect of dye conc. | 7 | 0.2 | 50, 100, 150, 200, 250 | 240 | 25 |
| Effect of time | 7 | 0.2 | 100, 150, 200 | 10, 20, 30, 40, 60, 120, 180, 240 | 25 |
| Effect of temp. | 7 | 0.2 | 200 | 240 | 25, 35, 45, 55 |
2.5 Isotherm, kinetics, and thermodynamics studies
Adsorption isotherm and kinetics studies not only provide an insight into the type of adsorption that has occurred, but also help in predicting adsorption capacity, mechanism of adsorption, and speed of the adsorption. There are 36 different adsorption isotherm models documented in the literature; however, in this work, three distinct isotherm models—Langmuir, Freundlich, and Temkin—given in eqn (3)–(5), respectively, were used:44
 | (3) |
 | (4) |
Qe = B![[thin space (1/6-em)]](https://www.rsc.org/images/entities/char_2009.gif) ln ln![[thin space (1/6-em)]](https://www.rsc.org/images/entities/char_2009.gif) A + B A + B![[thin space (1/6-em)]](https://www.rsc.org/images/entities/char_2009.gif) ln ln![[thin space (1/6-em)]](https://www.rsc.org/images/entities/char_2009.gif) Ce Ce
| (5) |
In eqn (3) (Langmuir isotherm), the maximum adsorption capacity and the adsorption energy are denoted by Qm, and KL, respectively. In the Freundlich equation, the adsorption intensity is indicated by KF, whereas n is the Freundlich constant. Furthermore, B is the Temkin constant for the sorption heat (J mol−1) and A is the Temkin isotherm constant (L g−1). In the isotherm investigation, the best fit (highest R2) was used as the benchmark to determine which model best describes the adsorption process. RL is an additional parameter that is derived from the Langmuir isotherm and is computed using eqn (6):
 | (6) |
The favourability of adsorption is predicted by the RL value based on the Langmuir isotherm: when RL = 0, all adsorption sites are occupied and the adsorption is irreversible. For favourable adsorption, 0 < RL < 1, and unfavourable adsorption is represented by RL > 1.45
Kinetic parameters were determined by analysing the data derived from the adsorption of MB against time. Using Lagergren pseudo-first-order (PFO) and pseudo-second-order (PSO) eqn (7) and (8), the kinetics of the MB adsorption process was evaluated.46 Additionally, intraparticle diffusion (IPD) and liquid film diffusion (LFD) models' equations (eqn (9) and (10)) were applied to predict the adsorption mechanism and the diffusion mode.46,47 In these equations, the adsorption capacity at a certain time t is represented by Qt, t is the time interval, the intercept of the IPD model is denoted by C, and F is equal to Qt/Qe. R2 was used to describe the best-fitted kinetics model:
 | (7) |
 | (8) |
 | (9) |
| ln(1 − F) = kFT | (10) |
Lastly, the thermodynamic parameters, which include the enthalpy change (ΔH), change in free energy (ΔG), and change in entropy (ΔS), were determined using eqn (11)–(13):48
 | (11) |
 | (12) |
| ΔG = ΔH − TΔS | (13) |
2.6 Regeneration and reuse
Desorption is an important aspect of the adsorption of MB since it guarantees that the adsorbent can be used continuously. For the regeneration of the ACP adsorbent, 1 M NaOH, 1 M HCl, and ethanol solutions were utilized. To regenerate the adsorbent, 50 ml of each solvent was stirred with 0.2 g of the used adsorbent (prepared by adsorbing a 200 mg L−1 MB solution on 0.2 g of adsorbent) in an orbital mixer at 230 rpm for two hours. The amount of MB recovered was measured using a UV-Vis spectrophotometer. Eqn (1) and (2) were used to compute the percentage recovery and desorption capabilities of the ACP. After desorption, the ACP was dried and then used for five times for methylene blue (MB) adsorption using 200 mg L−1 MB solution and 0.2 g of adsorbent for 4 hours.2.7 Model development using machine learning (ML)
Machine learning was used to predict the MB adsorption on ACP using different ML models, i.e., gaussian process regression (rotational quadratic), support vector regression (kernel = ‘poly’), support vector regression (kernel = ‘rbf’), random forest regression (n_estimators = 10) decision tree regression (max_depth = 10) and artificial neural network (ANN). Table 2 shows the adsorption data, which were obtained by changing the three factors, i.e., concentration of the dye, time, and pH. Two responses, i.e., % removal and adsorption capacity were used as dependent variables. The dataset for adsorption capacity and methylene blue removal was divided into two subsets: 70% for training the models and 30% for evaluation. Data processing, model training, and testing were conducted on Google Colab, a Python-based platform known for its effectiveness in machine learning research and development.| Independent variable | Dependent variable/response | |||
|---|---|---|---|---|
| MB concentration | Ads. time | pH | % removal | Ads. capacity |
| 150 | 10 | 4 | 85.32 | 31.99 |
| 150 | 20 | 4 | 95.60 | 35.85 |
| 150 | 30 | 4 | 97.75 | 36.66 |
| 150 | 40 | 4 | 98.44 | 36.92 |
| 150 | 60 | 4 | 98.61 | 36.98 |
| 150 | 90 | 4 | 98.67 | 37.00 |
| 150 | 120 | 4 | 99.47 | 37.30 |
| 150 | 180 | 4 | 99.84 | 37.44 |
| 150 | 240 | 4 | 99.99 | 37.50 |
| 150 | 10 | 7 | 98.35 | 36.88 |
| 150 | 20 | 7 | 99.02 | 37.13 |
| 150 | 30 | 7 | 99.37 | 37.26 |
| 150 | 40 | 7 | 99.38 | 37.27 |
| 150 | 60 | 7 | 99.41 | 37.28 |
| 150 | 90 | 7 | 99.54 | 37.33 |
| 150 | 120 | 7 | 99.60 | 37.35 |
| 150 | 180 | 7 | 99.84 | 37.44 |
| 150 | 240 | 7 | 99.90 | 37.46 |
| 150 | 10 | 10 | 93.73 | 35.15 |
| 150 | 20 | 10 | 95.96 | 35.98 |
| 150 | 30 | 10 | 98.04 | 36.77 |
| 150 | 40 | 10 | 98.62 | 36.98 |
| 150 | 60 | 10 | 99.22 | 37.21 |
| 150 | 90 | 10 | 99.04 | 37.14 |
| 150 | 120 | 10 | 99.74 | 37.40 |
| 150 | 180 | 10 | 99.94 | 37.48 |
| 150 | 240 | 10 | 99.99 | 37.49 |
| 200 | 10 | 4 | 77.50 | 38.75 |
| 200 | 20 | 4 | 92.03 | 46.01 |
| 200 | 30 | 4 | 95.60 | 47.80 |
| 200 | 40 | 4 | 97.21 | 48.61 |
| 200 | 60 | 4 | 98.62 | 49.31 |
| 200 | 90 | 4 | 98.90 | 49.45 |
| 200 | 120 | 4 | 99.64 | 49.82 |
| 200 | 180 | 4 | 99.69 | 49.85 |
| 200 | 240 | 4 | 99.92 | 49.96 |
| 200 | 10 | 7 | 92.23 | 46.11 |
| 200 | 20 | 7 | 96.29 | 48.15 |
| 200 | 30 | 7 | 98.09 | 49.04 |
| 200 | 40 | 7 | 98.28 | 49.14 |
| 200 | 60 | 7 | 99.24 | 49.62 |
| 200 | 90 | 7 | 99.51 | 49.75 |
| 200 | 120 | 7 | 99.51 | 49.76 |
| 200 | 180 | 7 | 99.63 | 49.82 |
| 200 | 240 | 7 | 99.69 | 49.85 |
| 200 | 10 | 10 | 84.24 | 42.12 |
| 200 | 20 | 10 | 96.80 | 48.40 |
| 200 | 30 | 10 | 97.73 | 48.87 |
| 200 | 40 | 10 | 98.25 | 49.12 |
| 200 | 60 | 10 | 98.77 | 49.38 |
| 200 | 90 | 10 | 99.02 | 49.51 |
| 200 | 120 | 10 | 99.72 | 49.86 |
| 200 | 180 | 10 | 99.81 | 49.91 |
| 200 | 240 | 10 | 99.96 | 49.98 |
| 250 | 10 | 4 | 76.14 | 47.59 |
| 250 | 20 | 4 | 84.54 | 52.84 |
| 250 | 30 | 4 | 88.53 | 55.33 |
| 250 | 40 | 4 | 89.36 | 55.85 |
| 250 | 60 | 4 | 94.38 | 58.99 |
| 250 | 90 | 4 | 96.76 | 60.47 |
| 250 | 120 | 4 | 98.01 | 61.25 |
| 250 | 180 | 4 | 98.42 | 61.51 |
| 250 | 240 | 4 | 99.17 | 61.98 |
| 250 | 10 | 7 | 70.86 | 44.29 |
| 250 | 20 | 7 | 77.65 | 48.53 |
| 250 | 30 | 7 | 91.85 | 57.41 |
| 250 | 40 | 7 | 93.75 | 58.60 |
| 250 | 60 | 7 | 96.61 | 60.38 |
| 250 | 90 | 7 | 98.17 | 61.36 |
| 250 | 120 | 7 | 98.95 | 61.84 |
| 250 | 180 | 7 | 99.11 | 61.95 |
| 250 | 240 | 7 | 99.64 | 62.27 |
| 250 | 10 | 10 | 66.54 | 41.59 |
| 250 | 20 | 10 | 81.68 | 51.05 |
| 250 | 30 | 10 | 93.77 | 58.61 |
| 250 | 40 | 10 | 93.99 | 58.75 |
| 250 | 60 | 10 | 97.39 | 60.87 |
| 250 | 90 | 10 | 98.52 | 61.58 |
| 250 | 120 | 10 | 98.97 | 61.86 |
| 250 | 180 | 10 | 99.38 | 62.12 |
| 250 | 240 | 10 | 99.69 | 62.31 |
3 Results and discussions
3.1 Adsorbent's characterization
The FTIR analysis of the PAGP and ACP samples using the ATR-FTIR approach is shown in Fig. 2. PAGP produces noteworthy absorption frequencies at 3184, 1630, 1045, 922, 789, 613 and 582 cm−1, whereas ACP produced absorption frequencies at 3283, 1632, 1053, 932, 794, 615, and 585.6 cm−1. In the FTIR spectra of PAGP and ACP, notable peaks at 3184 and 3283 cm−1, 1630 cm−1 and 1632 cm−1, and 789 cm−1 and 794 cm−1, represent the existence of hydroxyl (OH) groups.49 The broad peaks at 3184–3283 cm−1, 1630 cm−1 and 790 cm−1 represent the asymmetric stretching, bending vibrations, and out-of-plane bending or rocking vibrations of the O–H bond in hydroxyl groups, respectively.50 The broadness of the ∼3200 cm−1 peak represents that more than one type of OH, e.g., water molecule, silanol (Si–O–H) and aluminol (Al–O–H) groups are present in both samples. The frequency band at 1045 cm−1 in PAGP and 1053 cm−1 in ACP can be assigned to Si–O, Al–O and P–O bonds, representing the geopolymerization process.29 A detailed insight of the extent of geopolymerization is shown in Fig. 2b and c, representing that FA did not react completely and unreacted FA is present in both samples. Three distinct peaks at 1140–1160 cm−1, 1045–1049 cm−1 and 923–932 cm−1 are observed in Fig. 2b and c. The high peak intensity and peak area of the 1045–1049 cm−1 peak (geopolymer peak) indicate that most of the aluminosilicate material has transformed into the geopolymer.51 The peak above 1100 cm−1 manifests the existence of unreacted FA particles in the PAGP and ACP.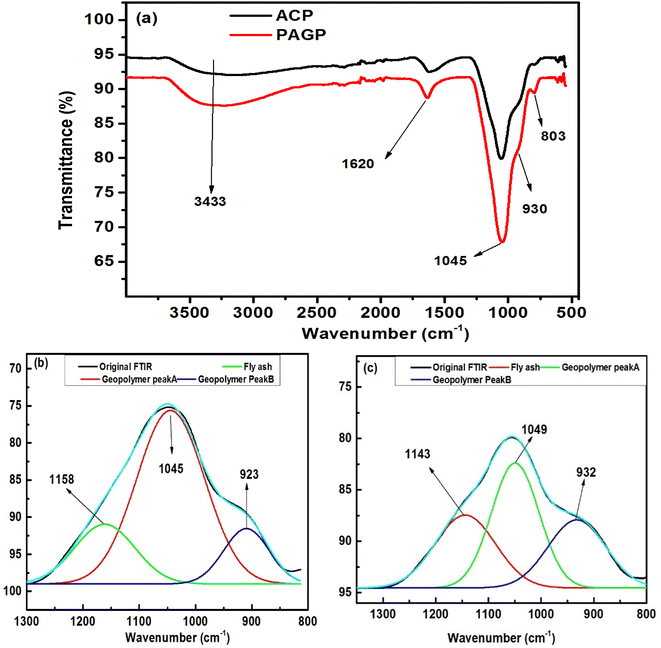 | ||
| Fig. 2 (a) FTIR analysis of the PAGP and ACP adsorbents. Deconvolution of the geopolymer peak in (b) PAGP and (c) ACP. | ||
A slight shift of the geopolymer peak to a higher wavenumber in the ACP sample compared to PAGP indicates interaction between PAGP and AC. An upsurge shift in the frequency band at 1045 cm−1 for the PAGP sample to 1049 cm−1 for the ACP and a subsequent decrease in peak intensity and peak area indicates that the addition of activated carbon hindered geopolymer formation. This phenomenon may be caused by the presence of attractive forces between PAGP and AC, e.g., hydrogen bonding, surface group interactions and impact of molecular environment. Moreover, part of the phosphoric acid may be adsorbed by AC reducing its activation behaviour.
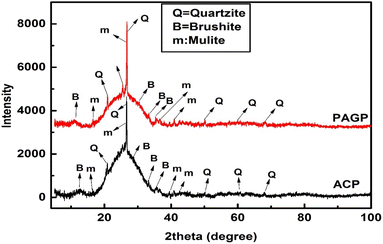
The powder X-ray diffraction analysis of the PAGP and ACP, in the 2 theta range of 2–80°, is presented in Fig. 3. Analysis of the XRD data reveals that both samples are mostly amorphous with traces of some crystalline phases. A broad hump in the 20–27° 2 theta range is particularly noticeable in Fig. 4 and is indicative of the material's amorphous nature.38 In addition to the amorphous material, the quartzite phase is very prominent as evidenced by the peaks at 20.8°, 26.5°, 50.2°, 60.1°, and 68.3°.29 Both ACP and PAGP show the existence of brushite and mullite phases. The amorphous material and brushite phase existence as indicated by the PXRD patterns represents the formation of PAGP in both samples, whereas quartzite and mullite phases manifest the unreacted FA. The XRD is in close agreement with the FTIR analysis, as it also indicates the presence of unreacted FA.
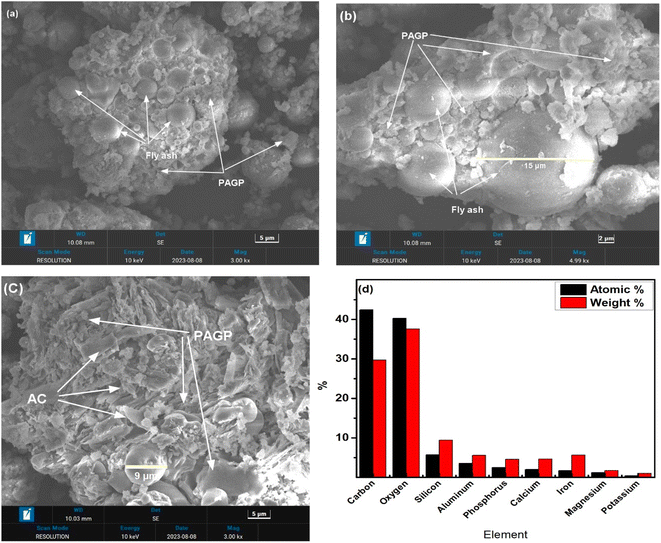 | ||
| Fig. 4 (a–c) SEM micrographs of ACP of different points at different magnifications. (d) EDX analysis of ACP. | ||
The SEM micrographs of the ACP at different resolutions (3000×–5000×) are presented in Fig. 4(a–c). Two types of morphologies are visualized in the micrographs, i.e., geopolymer and fly ash particles embedded in the geopolymer matrix with the sizes in the range of 5 μm to 15 μm. Small plate-like morphologies observed in Fig. 4c are representing activated carbon. The EDX analysis is shown in Fig. 4d, which indicates that the main constituents of ACP are Al, Ca, Si, S, P, C, and O.
The formation of geopolymers, homogeneity of the geopolymer and AC, and the interfacial transition zone between the geopolymer and AC can be established from the SEM analysis.29 The homogenous geopolymer matrix indicated the successful formation of PAGP in the presence of activated carbon. Large-sized unreacted and partially reacted fly ash particles demonstrated that large particles are mostly crystalline and less reactive.51 Mechano-chemical activation using ball milling or pre-screening improves the geopolymer content and reduces the unreacted fly ash quantity.52 The SEM images agree closely with the XRD and FTIR analysis discussed earlier. The EDX analysis presents that a P to Al ratio of 1 is maintained by ACP. The high % of C is linked with the AC in the sample and the carbon tape used for mounting sample to aluminum stub.
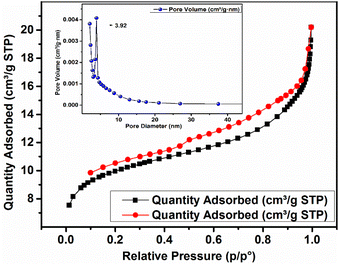
The nitrogen adsorption–desorption isotherm obtained by the BET surface area analysis is depicted in Fig. 5. ACP exhibited a surface area of 47.36 m2 g−1, an adsorption pore diameter of 5.39 nm, and a cumulative pore volume of 0.0206 cm3 g−1 (ascertained by BJH adsorption within the pore size range of 1.700 to 300 nm). A hysteresis loop, which is indicative of a type IV isotherm in the IUPAC classification, is shown by the isotherm.53 The findings showed that the combination of the geopolymer and AC resulted in a mesoporous material having a considerably higher surface area than that of geopolymers alone.29 A pore diameter of 5.39 nm also supports the mesoporous nature of the ACP being in the range of 2–50 nm.
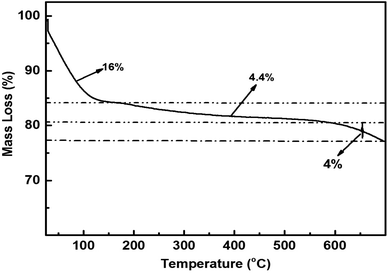
The TGA study findings for the ACP are presented in Fig. 6. The analysis was performed in a N2 atmosphere at a heating rate of 10 °C min−1, encompassing in the temperature range of 25 to 700 °C. Across the three apparent steps, there is a 16% mass loss in the first step, i.e., below 100 °C followed by the 2nd mass loss in the temperature range of 100–500 °C, and a steady mass loss of 4.4% is observed, whereas 4% mass loss is recorded above 500 °C. A cumulative mass loss of 24.4% is attained during TG analysis.
The first step is a representation of the evaporation of the physically adsorbed water molecules (weakly linked with the solid surface) on the surface of the ACP. The less steep step 2 in the TGA curve from 200 to 600 °C indicates the breakdown of the germinal and vicinal silanol groups, whereas mass loss from 600 to 700 °C is the outcome of the isolated silanol groups' breakdown.54 TG analysis reveals that ACP exhibits good thermal stability up to 700 °C.
3.2 Adsorption study
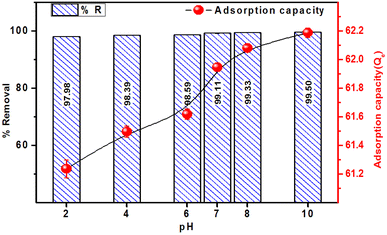
The effect of pH on the adsorption of MB, in terms of % removal and adsorption capacity, on the ACP adsorbent is presented in Fig. 8. The % removal achieved ranged between 97.98 and 99.50% at different pH values with the highest removal achieved at pH 10. There is a slight difference among the %R at different pH values, which represent that ACP is effective at all pH values. It is necessary to mention that the final pH of all the samples, after 4 hours of shaking, was recorded in the range of pH 6 to pH 8, representing that ACP has normalized the solution pH to neutral pH.
Similar to % removal, the adsorption capacity has shown a slight variation as a function of pH and remained in the range of 61.2–62.1 mg g−1, establishing that the adsorbent is equally effective at acidic, neutral, and alkaline pH values. The maximum adsorption capacity of 62.11 mg g−1 was achieved at pH 10. The uniform adsorption capacity and % removal at different pH levels are linked to the chemistry of PAGPs, which tends to adsorb maximum amount of MB at pH 10.
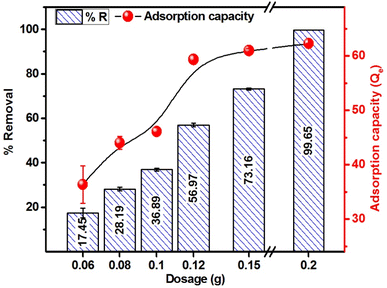
Fig. 9 presents the percent removal and adsorption capacity of MB as a function of adsorbent dosage at a fixed MB concentration (250 mg L−1) and volume (50 mL). The results reveal that 15.99, 28.77, 37.53, 57.15, 72.27 and 99.69% of MB was adsorbed at the adsorbent doses of 0.06, 0.08, 0.10, 0.12, 0.15 and 0.20 g/50 ml of MB solution, respectively. The adsorption capacity obtained for 0.06 to 0.20 g dosage ranged from 33.3 to 62.3 mg g−1. Overall, an upsurge in the % removal and adsorption capacity is attained with the increase in adsorbent dosage, and the trend is explained on the grounds that with more adsorbent, there is an increase in adsorption sites due to the presence of more adsorbent materials. The adsorption capacity increases with the higher adsorbent doses due to increased surface area, active sites availability, and interaction possibilities. This enhances the efficiency and leads to multilayer adsorption.15
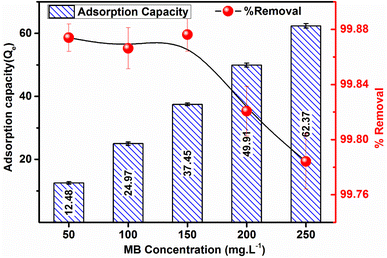
Fig. 10 illustrates the graphical presentation, depicting the influence of MB concentration on both the %R and adsorption capacity of the ACP adsorbent. The removal efficiency of ACP exhibits values of 99.88%, 99.87%, 99.88%, 99.82%, and 99.78% for MB concentrations of 50 mg L−1, 100 mg L−1, 150 mg L−1, 200 mg L−1, and 250 mg L−1, respectively.
However, the recorded adsorption capacity manifests values of 12.48, 24.97, 37.45, 49.91, and 62.37 mg g−1 for the MB concentrations of 50, 100, 150, 200 and 250 mg L−1, respectively. Remarkably, a negligible decreasing trend in terms of %R and a prominent increasing trend in adsorption capacity are evident in this experimental investigation. These findings feature a concentration-dependent behaviour of the MB adsorption process and contribute valuable insights for optimizing the performance of ACP in MB removal applications.
A concentration-dependent adsorption phenomenon is suggested by the rise in methylene blue's adsorption capacity using ACP that is observed as the dye concentration increased from 50 to 250 mg L−1. The outcome suggests that more MB molecules are successfully adsorbed onto the ACP surface as the initial dye concentration increases. This is probably because there is a stronger driving force for mass transfer. The slight decrease in %R may be explained by the concentration effects, i.e., at high concentrations, the MB molecules have affinity between them.
Studying the adsorption process's kinetics and thermodynamics is necessary, in which time and temperature play a role. MB adsorption on ACP adsorbent is displayed as a function of time for 240 minutes, as shown in Fig. 11(a and b). In the plots depicting % removal vs. time (%R vs. t) and adsorption capacity vs. time (Qt vs. t), equilibrium is achieved within 30 minutes for solutions with concentrations of 150 mg L−1 and 200 mg L−1. In contrast, 250 mg L−1 solution requires 60 minutes to reach equilibrium. Irrespective of the different equilibrium times, 70–90% of MB has been adsorbed in first 10 minutes. This quicker adsorption compared to geopolymers and AC-based adsorbents is the unique feature of the ACP, as most of the geopolymeric adsorbents take at least 60–240 minutes to reach the equilibrium point.8,55 This quicker adsorption of MB is achieved due to the charged structure of PAGP, high surface area of ACP, foaming property by H2O2 and additional activation of AC by H3PO4 used for PAGP formation. Phosphoric acid treatment chemically activates AC by introducing additional pores and enhancing surface area, enhancing adsorption capacity and reactivity. This modification also influences the functional groups on the surface, contributing to improved MB capture and removal, particularly in applications of water purification.
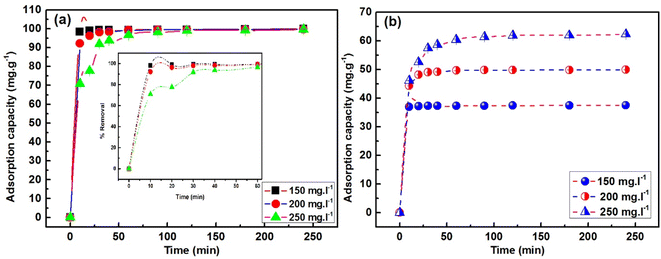 | ||
| Fig. 11 Time influence on MB adsorption by ACP at initial concentrations (Ci) of 150, 200 and 250 mg L−1: (a) % removal (b) adsorption capacity. | ||
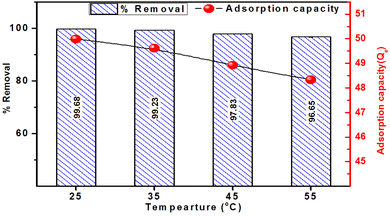
The influence of temperature on the adsorptive removal of MB using ACP adsorbent is illustrated in Fig. 12. The figure distinctly demonstrates a decreasing trend in MB adsorption as the temperature rises from 25 °C to 35 °C, 45 °C and 55 °C. The adsorption percentages were 99.68%, 99.22%, 97.83% and 96.65% at 25 °C, 35 °C, 45 °C and 55 °C, respectively. Mirroring the trend observed in % removal, the adsorption capacity of ACP exhibited a declining pattern (49.8, 49.6, 48.9, and 48.3 mg g−1) with the increase in temperature. These results indicate the involvement of exothermic adsorption, and the decrease in adsorption with elevated temperature suggests the extent of this exothermic adsorption process.48
Additionally, increased temperatures disturb the equilibrium between adsorption and desorption by supplying increased thermal energy, causing an accelerated desorption of methylene blue from the adsorbent's surface, hence reducing adsorption. Furthermore, elevated temperatures may induce molecular alterations in both the adsorbent and methylene blue, further impacting their interaction.56 A similar trend has been reported in geopolymer-based adsorbents for MB removal.2,29,57
3.3 Isotherm study
Adsorption isotherms provide an understanding of the distribution of adsorbate molecules across the liquid and solid phases and their interactions that occur involving the adsorbate and the adsorbent at a specific temperature. The adsorption isotherms forecast whether and how the molecules of the adsorbate interact with molecules of the adsorbent and reveal the details about the types of interactions. There are 36 unique types of adsorption isotherms that may be used to calculate the effectiveness of adsorption at equilibrium and other adsorption-related metrics.58 Three well-known isotherms—the Langmuir, Freundlich, and Temkin isotherms—were employed in this study. The Langmuir, Freundlich, and Temkin isotherm plots for the remediation of MB using ACP adsorbent are displayed in Fig. 13a–c.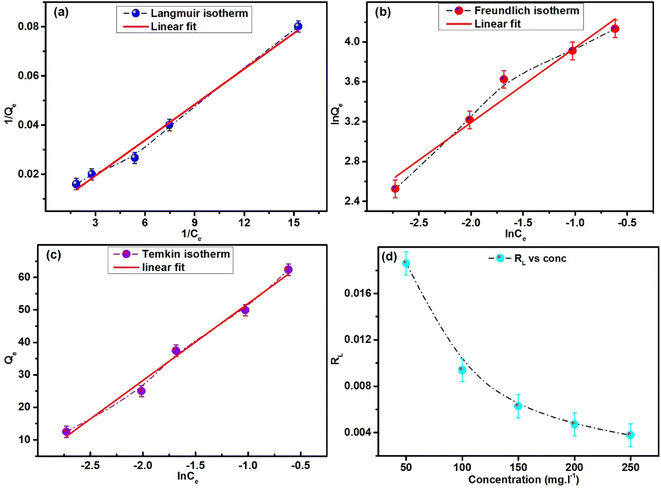 | ||
| Fig. 13 Adsorption isotherms of MB using ACP: (a) Langmuir isotherm, (b) Freundlich isotherm, and (c) Temkin isotherm. (d) Variation in RL with concentration. | ||
The degree of fitting (R2) of the linear fit of the data from experiments was used to determine the optimal isotherm from the equilibrium concentration (Ce) vs. adsorption capacity (Qe) data at different concentrations of MB. As shown in Table 3, the degree of fitting of Langmuir isotherm is higher than those of the Freundlich and Temkin isotherms. The linear fits of the Freundlich and Temkin isotherms yielded lower degrees of fitting, i.e., 0.947 and 0.984 compared to the Langmuir isotherm (0.989). Qm, KL, and R2 values of 204.08 mg g−1, 1.02 L mg−1, and 0.989, respectively, were obtained by the Langmuir isotherm.
| Isotherm | Parameters | Values |
|---|---|---|
| Langmuir | Qm (mg g−1) | 204.08 |
| KL (L mg−1) | 1.02 | |
| RL | 0.019 | |
| R2 | 0.989 | |
| Freundlich | N | 1.2832 |
| KF | 112.415 | |
| R2 | 0.947 | |
| Temkin | A (L g−1) | 24.3772 |
| B (J mol−1) | 23.68 | |
| R2 | 0.984 |
In the Langmuir isotherm, it is believed that adsorption occurs on the uniform surfaces of the adsorbent material, leading to a monolayer adsorption process. Furthermore, the reversibility of the adsorption and desorption processes is postulated and the adsorption sites on adsorbent are homogeneous, meaning that their energies are all identical.29,59,60 Additionally, the model suggests a maximum adsorption capacity, above which no more adsorption occurs. The adsorption is a reversible process and ceases once a site is occupied, preventing any contact between the molecules of the adsorbate. The favourability of the adsorption is further supported by the RL (Fig. 13d) value calculated using eqn (6) as it lies between 0 and 1. The extent of fitting of the Freundlich and Temkin isotherms (R2 = 0.947 and 0.984) is reasonably closer to the Langmuir isotherm, representing that along with homogenous adsorption, heterogeneous adsorption occurs.
The value of n obtained using the Freundlich isotherm is 1.283, surpassing the threshold of 1. A linear adsorption process with uniform adsorption is indicated by a value of n = 1. Conversely, if n is greater than 1, it means that the adsorbent's adsorption capacity increases more sharply as the concentration of MB in the solution increases. This behaviour is frequently linked to the strong interactions between the adsorbent and the adsorbate as well as the occurrence of multilayer adsorption. It provides more evidence for the existence of multilayer adsorption and chemisorption processes. Furthermore, unfavourable and irreversible adsorption processes are represented by n < 1 and n = 0.61
3.4 Kinetics study
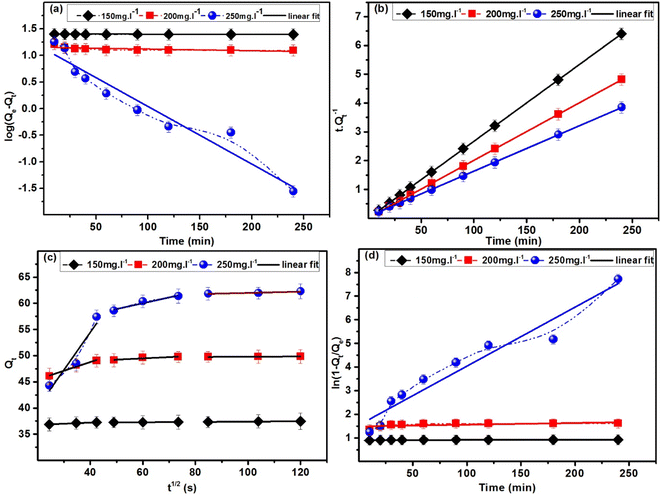
Because of the provision of information related to the adsorption process, its efficacy, and possible industrial uses, the adsorption kinetics study is considered as a significant part of adsorption studies. Following eqn (7) and (8), plots of Lagergren pseudo-first-order (PFO) and pseudo-second-order (PSO) models are shown in Fig. 14(a and b), and the data obtained are tabulated in Table 4.46 The extent of fitting (R2) and closeness of Qcalculated with Qexperimental provides the ground to decide about the most relevant kinetics model.| Qe,exp (mg g−1) | Qe,Cal (mg g−1) | k1(PFO) (min−1) | k2(PSO) (min−1) | kIPD (mg g−1 s−1/2) | kLFD (mg g−1 min−1) | R2 | |
|---|---|---|---|---|---|---|---|
| PFO (150 mg L−1) | 37.46 | 4.06 | 0.0001 | 0.630 | |||
| PFO (200 mg L−1) | 49.84 | 3.15 | 0.0007 | 0.419 | |||
| PFO (250 mg L−1) | 62.27 | 3.08 | 0.0248 | 0.939 | |||
| PSO (150 mg L−1) | 37.46 | 37.45 | 0.106 | 0.999 | |||
| PSO (200 mg L−1) | 49.84 | 50.00 | 0.030 | 0.999 | |||
| PSO (250 mg L−1) | 62.27 | 63.29 | 0.004 | 0.999 | |||
| IPD step 01 | 49.84 | 0.1652 | 0.979 | ||||
| IPD step 02 | 49.84 | 0.0245 | 0.869 | ||||
| IPD step 3 | 49.84 | 0.0025 | 0.981 | ||||
| LFD (150 mg L−1) | 37.46 | 0.00007 | 0.630 | ||||
| LFD (200 mg L−1) | 49.84 | 0.0007 | 0.419 | ||||
| LFD (250 mg L−1) | 62.27 | 0.0250 | 0.939 |
As indicated in Table 4, the PFO model exhibited R2 values of 0.630, 0.419, and 0.939 for MB solutions having concentrations of 150, 200, and 250 mg L−1, respectively. In contrast, the PSO model demonstrated a robust fit with an R2 value of 0.999 across all concentrations. Beyond the R2 values, the adsorption capacity calculated using the PFO model falls within the range of 3.06–4.08 mg g−1, which is nearly ten times lower than the experimentally determined adsorption capacity. On the contrary, noteworthy agreement between the estimated and actual adsorption capacities is evident in the kinetics data of the PSO model strengthening the conclusion that the kinetics process followed by ACP is the PSO model at each concentration. KPSO, rate of adsorption of MB by ACP, showed a decreasing trend with the increase in MB concentration, representing that the rate of adsorption is decreasing with the surge in MB concentration.
Several important aspects of the adsorption process are implied by the adherence of adsorption kinetics to the PSO model. It is proposed that chemisorption is more prevalent than physical adsorption, meaning that chemical bonds are formed during the contact between the MB and the ACP, resulting in a more strong and focused binding. Emphasizing the uniformity of the adsorption sites and their attraction for the MB, the model also assumes a homogenous surface with uniform adsorption sites. On the surface, MB molecules are organized in a monolayer according to the preference for a single-layer adsorption process. Additionally, according to the PSO model, the chemical interaction determines the rate of adsorption, making it the process's rate-limiting phase.29,62
The drop in k value seen during the PSO kinetics of MB by increasing the concentration can be ascribed by the quick saturation of adsorption sites at higher concentrations and increased competition amongst MB molecules for these sites. The surface saturation restricts the number of adsorption sites available, which lowers the rate constant. A lower k is the outcome of increased competition amongst MB molecules, which reduces the overall efficiency of the adsorption process. Furthermore, there may be possible changes in the way that MB and the adsorbent surface interact, diffusion restrictions, and site heterogeneity.
Fig. 14c and d show the IPD and the LFD models applied to adsorption kinetics data, respectively. The IPD model applied to the whole dataset produced a linear fit with an R2 value of 0.556, suggesting that the single-step IPD model was not the main rate-limiting mechanism. Similarly, the LFD model did not fit well to the experimental data producing a lower R2 value.47,63,64 Furthermore, a three-step IPD model produced R2 values of 0.979, 0.869 and 0.981 for step 1, 2 and 3, respectively. The rate constant (k) exhibited a decrement from step 1 to step 2 and a further increment in step 3, indicating a swifter adsorption in the initial step that varies over the time. This decrease signifies that most of the adsorption occurs within the first 30 minutes, highlighting a reduction in adsorption efficiency as the process time advances. Moreover, the non-zero intercept value showed that intraparticle diffusion was not the sole phase in the adsorption process.65 These findings showed that intraparticle diffusion was not the sole phase in the adsorption process that limited the speed, and the model's linear curve did not pass through the origin (0,0). The findings lead to the conclusion that neither the single-step IPD model nor the LFD model constitutes the primary mechanism. Instead, the three-step IPD model provides a superior fit to the experimental data.
In the prior research related to the adsorption of MB onto PAGPs and alkali-activated geopolymers (AAGPs), a dominant trend emerges with the consistent adoption of the PSO model.43 This signifies the predominant role played by the ionic structure inherent in geopolymers, whether in the form of PAGPs or AAGPs, in driving the adsorption process through predominant ionic interactions. The widespread utilization of the PSO model across diverse studies underlines a consideration of the fundamental mechanisms governing MB adsorption onto geopolymers, shedding light on the pivotal influence of the ionic nature of geopolymers in facilitating adsorption interactions.
3.5 Thermodynamics study
Examining the thermodynamics of the adsorption processes helps in understanding the fundamental forces and mechanisms that control how adsorbate molecules interact with adsorbent, the energetics of the adsorption process, and the spontaneity of the adsorption process. A thermodynamic viewpoint helps in understanding the equilibrium dynamics and provides a comprehensive understanding of the driving forces behind adsorption. Eqn (11) was used to produce the plot of ln![[thin space (1/6-em)]](https://www.rsc.org/images/entities/char_2009.gif) Kc against temperature, which is shown in Fig. 15. Eqn (12) and (13) were used to derive the thermodynamic parameters, ΔH, ΔG, and ΔS, and are presented in Table 5.
Kc against temperature, which is shown in Fig. 15. Eqn (12) and (13) were used to derive the thermodynamic parameters, ΔH, ΔG, and ΔS, and are presented in Table 5.
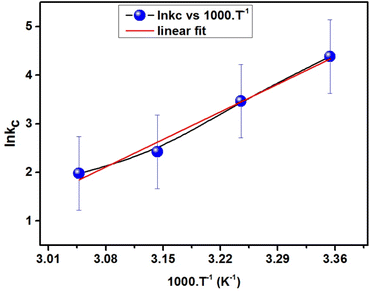 | ||
| Fig. 15 Plot of the linear correlation between the van ‘t Hoff equation and temperature used for the adsorption of MB dye on ACP. | ||
| T (°C) | ΔH kJ mol−1 | ΔG kJ mol−1 | ΔS J mol−1 K−1 | R2 |
|---|---|---|---|---|
| 25 | −67.443 | −10.742 | −190.174 | 0.983 |
| 35 | −8.840 | |||
| 45 | −6.939 | |||
| 55 | −5.037 |
The thermodynamic parameters that are computed for the adsorption of MB on ACP provide information about the characteristics of the adsorption process. The enthalpy change is negative (ΔH = −67.443 kJ mol−1), suggesting that heat is released during the adsorption process and the adsorption process is exothermic. Furthermore, the adsorption process on ACP appears to be spontaneous based on the negative change in Gibbs free energy (ΔG = −10.742 to −5.037 kJ mol−1), implying that there is an energy favourability to the procedure. As the MB adsorption on ACP is more favourable at a lower ΔG value, therefore lower temperature is better for MB adsorption.65 A reduction in randomness at the interface is shown by the negative entropy change (ΔS = −190.174 J mol−1 K−1), which represents a more ordered adsorption system after adsorption. All parameters considered, these thermodynamic parameters offer thorough insights into the spontaneity and energetics of the MB-ACP adsorption, which are essential for comprehending and refining the adsorption process.48,62,64
3.6 Regeneration and re-use of the ACP
The spent ACP was regenerated using 1 M HCl, 1 M NaOH and ethanol. NaOH and HCl solutions did not regenerate the ACP over a time of 120 minutes and only traces of MB were leached out. Ethanol solution desorbed out most of the MB adsorbed in 10 minutes representing a quicker regeneration. The spent adsorbent was successfully regenerated and reused to adsorb MB for 5 cycles, as shown in Fig. 16a. The % removal is in the range of 99.9–98.76% representing a very minute decrease in % removal. Similarly, the adsorption capacity altered slightly with the number of utilizations of ACP. The % loss in function as a dependent variable of the number of re-use cycles of ACP is given in Fig. 16b. The extrapolation of the linear fitting reveals that 100% efficiency will be lost in 286 cycles of use, which is reasonably good. It is concluded that ethanol effectively regenerate ACP and it can be used for multiple cycles.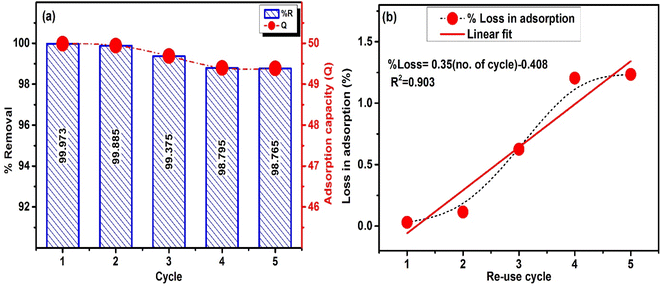 | ||
| Fig. 16 (a) Re-use of ACP for 5 times (MB conc. = 200 mg L−1, V = 50 ml and dosage = 0.2 g) (b) % loss in adsorption with cycles. | ||
3.7 Adsorption mechanism
The adsorption mechanism was established using FTIR analysis, kinetics, diffusion, isotherm and thermodynamics modelling parameters obtained by analysis of the adsorption data.![[double bond, length as m-dash]](https://www.rsc.org/images/entities/char_e001.gif) C bonds of benzene, whereas the frequency band at 1325 cm−1 is linked with C
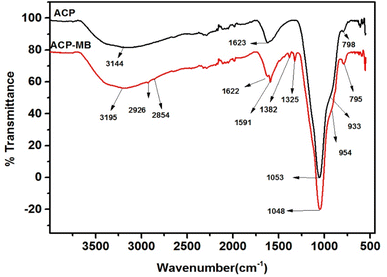
C bonds of benzene, whereas the frequency band at 1325 cm−1 is linked with C![[double bond, length as m-dash]](https://www.rsc.org/images/entities/char_e001.gif) N of the MB.66,67 The presence of these frequencies supports that MB has been adsorbed by the ACP. The shifting of the OH group to a higher frequency represents a decrease in hydrogen bonding between OH groups located on the ACP surface. The position of the OH band shifts to a lower frequency when more hydrogen bonding exists. In the ACP-MB system, the hydrogen bonding of the ACP is reduced as the OH group started interaction with MB molecules. Moreover, the absence of additional peaks around 3700–3600 cm−1 demonstrates that free OH radicals do not exist neither in ACP nor in ACP-MB.68 Another important frequency shift observed in the ACP-MB sample is the shifting of geopolymer peak located at 1053 cm−1 in ACP to 1048 in ACP MB. This red shift represents the weakening of the geopolymer bond indicating a probable interaction between the MB molecules and the Al–O–P bond. This red shift support adsorption of MB on the geopolymer part of the ACP. It can be concluded that multiple types of interactions are responsible for MB adsorption.
N of the MB.66,67 The presence of these frequencies supports that MB has been adsorbed by the ACP. The shifting of the OH group to a higher frequency represents a decrease in hydrogen bonding between OH groups located on the ACP surface. The position of the OH band shifts to a lower frequency when more hydrogen bonding exists. In the ACP-MB system, the hydrogen bonding of the ACP is reduced as the OH group started interaction with MB molecules. Moreover, the absence of additional peaks around 3700–3600 cm−1 demonstrates that free OH radicals do not exist neither in ACP nor in ACP-MB.68 Another important frequency shift observed in the ACP-MB sample is the shifting of geopolymer peak located at 1053 cm−1 in ACP to 1048 in ACP MB. This red shift represents the weakening of the geopolymer bond indicating a probable interaction between the MB molecules and the Al–O–P bond. This red shift support adsorption of MB on the geopolymer part of the ACP. It can be concluded that multiple types of interactions are responsible for MB adsorption.
Combining characterization, kinetics, isotherms and thermodynamics, the MB adsorption on ACP is a combination of physisorption and chemisorption owing to multiple types of functional groups of PAGP and AC.
Finally, following three types of interactions could be responsible for MB adsorption.
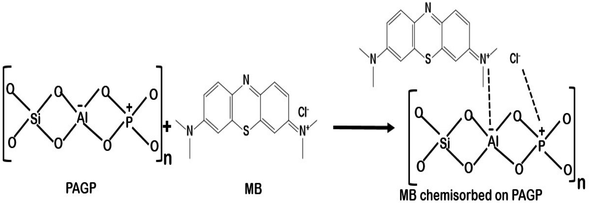
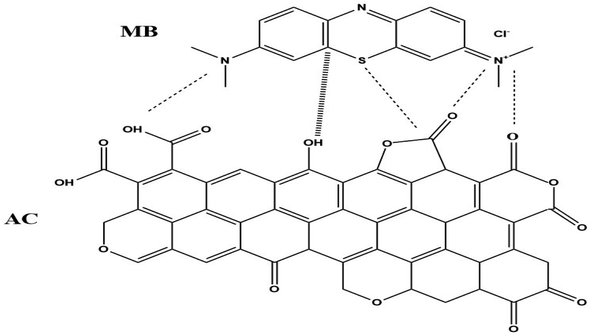
(1) PAGP has negatively charged aluminium and positively charged phosphorus atoms and these atoms have strong interactions with the cationic MB molecules, as shown in reaction Scheme 1.29,71 As both PAGP and MB are having charged centres, this interaction will be the dominant mechanism.
(2) The second type of interaction includes the stronger attractions between MB and various functional groups on the surface of the activated carbon, e.g. the carboxylate, hydroxyl and carbonyl groups, as given in reaction Scheme 2. Activated carbon has hydroxyl, carboxyl, carbonyl, vinyl, ethereal and anhydride types of functional groups that attract MB molecules using hydrogen bonding, dipole–dipole interactions, and van der Waals forces etc.10
(3) The third type of interaction includes weak non bonded intermolecular forces between MB and adsorbents, e.g. London forces and dipole-induced dipole forces.10
3.8 Comparison with previous studies
The findings of the present study were compared with various types of geopolymers, geopolymer foams, and geopolymer composites used for methylene blue removal (Table 6). Alkali-activated geopolymers adsorbed more MB than phosphoric acid geopolymers owing to the anionic silico aluminate moiety in the polymeric network.8,29 This anionic point attracts a cationic MB molecule by stabilizing its ionic structure via electrostatic attractions. The compactness and high density of the PAGPs also contributed towards the lower adsorption of MB.29 The introduction of foaming agents into the geopolymers improved their adsorption capacity mainly due to the porous structure and lower density.60,73 The addition of secondary adsorbent into the geopolymer resulted in further improvement in adsorption capacity. Geopolymer composites prepared by the addition of graphitic carbon nitride resulted in reasonably high adsorption capacity of 170.9 mg g−1, whereas TiO2–geopolymer composites adsorbed 103.19 mg g−1 of MB.37,73 The ACP material, prepared in this work, adsorbed 204.08 mg g−1 MB, which is better than geopolymers, geopolymer foams and geopolymer composites reported previously. Interestingly, irrespective of the geopolymer type, Langmuir isotherm, PSO kinetics, exothermic behaviour and chemisorption are observed in most of the geopolymer-based adsorbents.| Adsorbent | Activator | Isotherm | Kinetics | Energetics | Mechanism | Q (mg g−1) | Ref. |
|---|---|---|---|---|---|---|---|
| FA-GP | Alkali | Freundlich | PSO | Not discussed | Chemisorption | 79.81 | 8 |
| MK-GP | Alkali | Langmuir | PSO | Not discussed | Chemisorption | 39.5 | 60 |
| MK-GP | H3PO4 | Langmuir | PSO | Exothermic | Chemisorption | 3.01 | 29 |
| MK-GP foam | Alkali | Freundlich | PSO | Endothermic | Chemisorption | 12.5 | 7 |
| MK-GP foam | Alkali | Langmuir | PSO | Endothermic | Chemisorption | 40.0 | 72 |
| Graphitic carbon nitride/GP | Alkali | Langmuir | PSO | Exothermic | Chemisorption | 170.9 | 73 |
| FAGP/TiO2 | Alkali | Langmuir | PSO | Exothermic | Chemisorption | 103.19 | 37 |
| ACP | H3PO4 | Langmuir | PSO | Exothermic | Chemisorption | 204.08 | This study |
3.9 Machine learning-based predictive modelling
| Model type | RMSE (Train) | R2 (Train) | MAE (Train) | RMSE (Test) | R2 (Test) | MAE (Test) |
|---|---|---|---|---|---|---|
| Gaussian process regression (rotational quadratic) | 2.544 | 0.939 | 1.871 | 2.889 | 0.858 | 1.931 |
| Support vector regression (kernel = ‘poly’) | 1.889 | 0.967 | 1.266 | 5.325 | 0.518 | 3.343 |
| Support vector regression (kernel = ‘rbf’) | 7.661 | 0.453 | 6.702 | 6.099 | 0.369 | 4.914 |
| Random forest regression (n_estimators = 10) | 0.577 | 0.997 | 0.338 | 3.499 | 0.792 | 2.001 |
| Decision tree regression (max_depth = 10) | 0.8089 | 0.994 | 0.456 | 2.824 | 0.865 | 1.624 |
| Artificial neural network (ANN) | 1.323 | 0.984 | 1.107 | 2.737 | 0.873 | 1.912 |
| Model type | RMSE (Train) | R2 (Train) | MAE (Train) | RMSE (Test) | R2 (Test) | MAE (Test) |
|---|---|---|---|---|---|---|
| Gaussian process regression (rotational quadratic) | 2.489 | 0.679 | 2.0316 | 7.932 | 0.326 | 4.660 |
| Support vector regression (kernel = ‘poly’) | 2.639 | 0.638 | 1.344 | 8.609 | 0.205 | 4.443 |
| Support vector regression (kernel = ‘rbf’) | 3.539 | 0.348 | 1.521 | 9.815 | 0.0325 | 5.094 |
| Random forest regression (n_estimators = 10) | 0.660 | 0.977 | 0.448 | 6.040 | 0.608 | 3.067 |
| Decision tree regression (max_depth = 10) | 2.275 | 0.730 | 1.137 | 5.596 | 0.664 | 3.194 |
| Artificial neural network (ANN) | 1.778 | 0.835 | 1.394 | 4.320 | 0.799 | 3.29 |
The choice of kernel function significantly influenced the performance of support vector regression (SVR) models. For example, when employed a support vector regression (SVR) model with a polynomial kernel, an R2 value of 0.967 was attained during training for adsorption capacity data. However, when using rbf kernel, the R2 value decreased to 0.453. Similarly, for % removal prediction, the R2 value decreased from 0.638 to 0.348.
To ensure the optimal performance and minimize errors, hyperparameter optimization was conducted for the five algorithms applied to this data.
| Optimizer | Interactions/grids | Error index | |||||
|---|---|---|---|---|---|---|---|
| RMSE | R2 | MAE | |||||
| Train | Test | Train | Test | Train | Test | ||
| Gaussian process regression (GPR) | |||||||
| Bayesian | 30 | 3.324 | 2.98 | 0.858 | 0.858 | 2.37 | 2.19 |
| 40 | 2.685 | 2.889 | 0.858 | 0.858 | 1.931 | 1.931 | |
| 50 | 2.685 | 2.889 | 0.858 | 0.858 | 1.9311 | 1.931 | |
| Grid search | 2 | 2.544 | 2.889 | 0.939 | 0.858 | 1.871 | 1.931 |
| 3 | 2.544 | 2.889 | 0.939 | 0.858 | 1.871 | 1.931 | |
| 5 | 2.544 | 2.889 | 0.939 | 0.858 | 1.871 | 1.931 | |
| Random search | 30 | 2.646 | 2.932 | 0.858 | 0.858 | 1.903 | 2.030 |
| 40 | 2.658 | 2.935 | 0.858 | 0.858 | 1.903 | 1.903 | |
![[thin space (1/6-em)]](https://www.rsc.org/images/entities/char_2009.gif) |
|||||||
| Random forest regressor (RFR) | |||||||
| Bayesian | 30 | 0.561 | 6.432 | 0.973 | 0.532 | 0.674 | 3.984 |
| 40 | 0.561 | 6.432 | 0.973 | 0.532 | 0.456 | 3.984 | |
| 50 | 0.557 | 3.449 | 0.997 | 0.792 | 0.338 | 2.001 | |
| Grid search | 2 | 0.572 | 5.640 | 0.982 | 0.674 | 0.456 | 2.348 |
| 3 | 0.572 | 6.432 | 0.973 | 0.674 | 0.456 | 2.348 | |
| 5 | 0.572 | 6.432 | 0.973 | 0.674 | 0.674 | 3.987 | |
| Random search | 30 | 0.561 | 6.432 | 0.973 | 0.532 | 0.674 | 3.987 |
| 40 | 0.561 | 6.432 | 0.973 | 0.532 | 0.674 | 2.348 | |
![[thin space (1/6-em)]](https://www.rsc.org/images/entities/char_2009.gif) |
|||||||
| Decision tree | |||||||
| Bayesian | 30 | 0.823 | 5.632 | 0.981 | 0.664 | 0.562 | 3.712 |
| 40 | 0.823 | 5.632 | 0.981 | 0.664 | 0.562 | 3.712 | |
| 50 | 0.823 | 5.632 | 0.981 | 0.664 | 0.562 | 3.634 | |
| Grid search | 2 | 0.823 | 5.632 | 0.981 | 0.664 | 0.562 | 3.634 |
| 3 | 0.809 | 2.824 | 0.994 | 0.865 | 0.456 | 1.624 | |
| 5 | 0.836 | 4.640 | 0.981 | 0.817 | 0.569 | 2.520 | |
| Random search | 30 | 0.823 | 5.632 | 0.981 | 0.664 | 0.562 | 3.624 |
| 40 | 0.823 | 5.632 | 0.981 | 0.664 | 0.562 | 3.624 | |
![[thin space (1/6-em)]](https://www.rsc.org/images/entities/char_2009.gif) |
|||||||
| Artificial neural network (ANN) | |||||||
| Bayesian | 30 | 2.734 | 2.897 | 0.978 | 0.817 | 3.532 | 2.154 |
| 40 | 1.997 | 4.961 | 0.978 | 0.864 | 2.928 | 4.234 | |
| 50 | 11.323 | 9.024 | 0.589 | 0.563 | 8.678 | 7.523 | |
| Grid search | 2 | 1.321 | 3.921 | 0.984 | 0.824 | 3.425 | 3.456 |
| 3 | 1.422 | 3.921 | 0.984 | 0.824 | 2.228 | 2.228 | |
| 5 | 1.422 | 3.921 | 0.984 | 0.824 | 2.228 | 2.228 | |
| Random search | 30 | 1.323 | 2.737 | 0.984 | 0.873 | 1.107 | 1.912 |
| 40 | 1.712 | 2.862 | 0.984 | 0.814 | 2.234 | 2.453 | |
![[thin space (1/6-em)]](https://www.rsc.org/images/entities/char_2009.gif) |
|||||||
| Support vector machine (SVM) | |||||||
| Bayesian | 30 | 1.889 | 5.325 | 0.967 | 0.518 | 1.266 | 3.343 |
| Optimizer | Interactions/grids | Error index | |||||
|---|---|---|---|---|---|---|---|
| RMSE | R2 | MAE | |||||
| Train | Test | Train | Test | Train | Test | ||
| Gaussian process regression (GPR) | |||||||
| Bayesian | 30 | 4.442 | 9.014 | 0.523 | 0.321 | 2.042 | 5.453 |
| 40 | 4.442 | 8.005 | 0.632 | 0.321 | 2.053 | 5.453 | |
| 50 | 3.564 | 7.664 | 0.632 | 0.321 | 2.053 | 4.675 | |
| Grid search | 2 | 3.564 | 7.764 | 0.632 | 0.326 | 2.053 | 4.675 |
| 3 | 2.489 | 7.932 | 0.679 | 0.326 | 2.031 | 4.660 | |
| 5 | 2.489 | 7.993 | 0.679 | 0.326 | 2.031 | 4.660 | |
| Random search | 30 | 2.489 | 7.993 | 0.545 | 0.326 | 2.134 | 4.660 |
| 40 | 2.642 | 7.993 | 0.545 | 0.326 | 2.134 | 4.660 | |
![[thin space (1/6-em)]](https://www.rsc.org/images/entities/char_2009.gif) |
|||||||
| Random forest regression (RFR) | |||||||
| Bayesian | 30 | 0.775 | 7.222 | 0.962 | 0.552 | 0.534 | 4.234 |
| 40 | 0.775 | 7.222 | 0.972 | 0.567 | 0.467 | 3.034 | |
| 50 | 0.775 | 6.132 | 0.972 | 0.559 | 0.467 | 3.034 | |
| Grid search | 2 | 0.779 | 6.132 | 0.983 | 0.554 | 0.448 | 3.034 |
| 3 | 0.771 | 6.132 | 0.983 | 0.554 | 0.448 | 4.165 | |
| 5 | 0.771 | 6.132 | 0.983 | 0.559 | 0.448 | 3.067 | |
| Random search | 30 | 0.660 | 6.040 | 0.997 | 0.608 | 0.448 | 3.067 |
| 40 | 0.660 | 6.040 | 0.992 | 0.603 | 0.459 | 3.192 | |
![[thin space (1/6-em)]](https://www.rsc.org/images/entities/char_2009.gif) |
|||||||
| Decision tree | |||||||
| Bayesian | 30 | 2.281 | 5.596 | 0.721 | 0.663 | 1.229 | 3.200 |
| 40 | 2.275 | 5.596 | 0.721 | 0.667 | 1.137 | 3.204 | |
| 50 | 2.275 | 5.596 | 0.730 | 0.667 | 1.137 | 3.194 | |
| Grid search | 2 | 2.342 | 5.666 | 0.730 | 0.667 | 1.139 | 3.284 |
| 3 | 2.342 | 5.786 | 0.730 | 0.653 | 1.139 | 3.284 | |
| 5 | 3.732 | 6.321 | 0.701 | 0.653 | 1.139 | 3.284 | |
| Random search | 30 | 3.732 | 6.321 | 0.701 | 0.653 | 2.348 | 3.284 |
| 40 | 4.765 | 6.432 | 0.692 | 0.664 | 2.348 | 3.284 | |
![[thin space (1/6-em)]](https://www.rsc.org/images/entities/char_2009.gif) |
|||||||
| Artificial neural network (ANN) | |||||||
| Bayesian | 30 | 1.923 | 5.431 | 0.793 | 0.752 | 3.678 | 3.452 |
| 40 | 1.923 | 5.431 | 0.784 | 0.752 | 2.549 | 4.625 | |
| 50 | 1.923 | 5.564 | 0.784 | 0.752 | 2.549 | 4.625 | |
| Grid search | 2 | 2.987 | 4.320 | 0.784 | 0.764 | 1.493 | 4.625 |
| 3 | 1.178 | 4.320 | 0.831 | 0.794 | 1.493 | 4.625 | |
| 5 | 1.178 | 4.320 | 0.835 | 0.799 | 1.493 | 3.356 | |
| Random search | 30 | 1.178 | 4.320 | 0.835 | 0.799 | 1.394 | 3.29 |
| 40 | 1.181 | 4.320 | 0.835 | 0.799 | 1.493 | 3.381 | |
![[thin space (1/6-em)]](https://www.rsc.org/images/entities/char_2009.gif) |
|||||||
| Support vector machine (SVM) | |||||||
| Bayesian | 30 | 2.639 | 8.609 | 0.638 | 0.205 | 1.344 | 4.443 |
Following hyper parameter optimization, the study conducted loss function optimization using three distinct optimizers. For GPR in adsorption capacity, the grid search optimizer with grid sizes of 2, 3, and 5 achieved the lowest error, while for the % removal, the minimum error was attained with grid search using grid sizes of 3 and 5. Using 30 iterations, the random search optimizer yielded a minimal error for ANN in both scenarios. Notably, the SVM model exhibited a significantly high R2 value at the optimized hyper parameters, prompting the decision to forego further optimization for the SVM model. The neural network model with 15 layers, with 128 nodes in the first layer and 256 nodes in the second layer and then the number of nodes increasing in the subsequent layers outperformed all the models in terms of adsorption capacity as well as % removal.
The ANN model (random search) demonstrated better performance than other models, achieving an R2 value of 0.835 for adsorption capacity and 0.799 for % removal. This highlights the ANN model's effectiveness in predicting the percentage of methylene blue removal based on key parameters, like pH, adsorption time, and initial dye concentration. The high R2 values obtained by the ANN and decision tree models provide robust evidence of their accuracy in estimating the adsorption percentage and dye removal capacity. These models can be considered reliable tools for predicting MB adsorption efficiency in diverse scenarios.
4 Conclusions
It is concluded that composite adsorbents based on activated carbon and phosphoric acid geopolymeric foams have the potential to replace the conventional activated carbon-based adsorbents. A 30% AC-based geopolymer composite shows good physical integrity and crossing this percentage results in the disintegration of the composite. The ACP adsorbent is effective in acidic, basic and neutral pH values. The adsorbents achieve equilibrium in 240 minutes with maximum adsorption in the first 30 minutes. The adsorption capacity decreases with the increase in temperature, showing the exothermic behaviour. The increase in dye concentration results in upsurge in adsorption capacity. The process gives the best fit to the Langmuir isotherm, PSO kinetic, and 3-step IPD model, indicating that monolayer chemisorption occurs and the rate determining step is dependent on both MB and the adsorbent. The probable mechanism includes chemical interactions between charge possesing elements of PAGP and MB, and between AC and MB. The spent adsorbent can be regenerated using ethanol and used for 5 times without compromising its dye remediation ability. Among 6 supervised machine learning models, ANN better described the adsorption capacity and % removal data on the basis of higher R2, lower MAE and RMSE for both training and testing data.Data availability
The data used in this manuscript are available from the authors upon request.Author contributions
All authors contributed to the study conception and design. Material preparation, data collection, analysis, and explanation were performed by Muhammad Irfan Khan. Suriati Sufian, Rashid Shamsuddin and Muhammad Farooq provided the detailed insight and guidance related to the research. Farrukh Hassan contributed towards AI and ML study of the data. The first draft of the manuscript was written by Muhammad Irfan Khan and all authors contributed in shaping the manuscript. All authors read and approved the final manuscript.Conflicts of interest
The authors have no relevant financial or non-financial interests to disclose.Acknowledgements
Financial support provided by the YUTP grant no. 015PBC-026 in terms of samples analysis, chemical and equipments, purchase is acknowledged.References
- U. Nimkar, Sustainable chemistry: A solution to the textile industry in a developing world, Curr. Opin. Green Sustainable Chem., 2018, 9, 13–17 CrossRef.
- A. A. Siyal, M. R. Shamsuddin, M. I. Khan, N. E. Rabat, M. Zulfiqar and Z. Man, et al., A review on geopolymers as emerging materials for the adsorption of heavy metals and dyes, J. Environ. Manage., 2018, 224, 327–339 CrossRef CAS.
- Research And Markets.com, The Worldwide Textile Dyes Industry Is Expected to Reach $14 Billion by 2027 Report by ResearchAndMarketscom, November 01, 2022 Search PubMed.
- R. Al-Tohamy, S. S. Ali, F. Li, K. M. Okasha, Y. A. G. Mahmoud and T. Elsamahy, et al., A critical review on the treatment of dye-containing wastewater: Ecotoxicological and health concerns of textile dyes and possible remediation approaches for environmental safety, Ecotoxicol. Environ. Saf., 2022, 231, 113160 CrossRef CAS PubMed.
- H. Regan, Asian Rivers Are Turning Black. And Our Colorful Closets Are to Blame, CNN news, 2020 Search PubMed.
- P. O. Oladoye, T. O. Ajiboye, E. O. Omotola and O. J. Oyewola, Methylene blue dye: Toxicity and potential elimination technology from wastewater, Results Eng., 2022, 16, 100678 CrossRef CAS.
- F. Eshghabadi and V. Javanbakht, Preparation of porous metakaolin-based geopolymer foam as an efficient adsorbent for dye removal from aqueous solution, J. Mol. Struct., 2024, 1295, 136639 CrossRef CAS.
- R. M. Novais, J. Carvalheiras, D. M. Tobaldi, M. P. Seabra, R. C. Pullar and J. A. Labrincha, Synthesis of porous biomass fly ash-based geopolymer spheres for efficient removal of methylene blue from wastewaters, J. Cleaner Prod., 2019, 207, 350–362 CrossRef CAS.
- C. Anushree and J. Philip, Efficient removal of methylene blue dye using cellulose capped Fe3O4 nanofluids prepared using oxidation-precipitation method, Colloids Surf., A, 2019, 567, 193–204 CrossRef CAS.
- A. Nasrullah, B. Saad, A. H. Bhat, A. S. Khan, M. Danish and M. H. Isa, et al., Mangosteen peel waste as a sustainable precursor for high surface area mesoporous activated carbon: Characterization and application for methylene blue removal, J. Cleaner Prod., 2019, 211, 1190–1200 CrossRef CAS.
- H. Yildiz, The production of a novel adsorbent from forest waste (Platanus orientalis L.) for dye adsorption: Adsorption process optimization and experimental design, Mater. Sci. Eng. B, 2024, 304, 117366 CrossRef CAS.
- G. Bal and A. Thakur, Distinct approaches of removal of dyes from wastewater: A review, Mater. Today: Proc., 2022, 50, 1575–1579 CAS.
- A. Akbari, H. Abbasi, M. Shafiee and H. Baniasadi, Synergistic adsorption of methylene blue with carrageenan/hydrochar-derived activated carbon hydrogel composites: Insights and optimization strategies, Int. J. Biol. Macromol., 2024, 265, 130750 CrossRef CAS PubMed.
- C. Jlassi, M. Jabli, H. Agougui and S. B. Abdessalem, Preparation of activated carbon from Zilla spinosa biomass by means of microwave for efficient bio-sorption of hazardous methylene blue colorant from water, Biomass Convers. Biorefin., 2024, 1–13 Search PubMed.
- A. Abutaleb, M. Imran, N. Zouli, A. H. Khan, S. Hussain and M. A. Ali, et al., Fe3O4-multiwalled carbon nanotubes-bentonite as adsorbent for removal of methylene blue from aqueous solutions, Chemosphere, 2023, 316, 137824 CrossRef CAS.
- A. Nouri, W. L. Ang, E. Mahmoudi, S. F. Chua, A. W. Mohammad and A. Benamor, et al., Decoration of polylactic acid on graphene oxide for efficient adsorption of methylene blue and tetracycline, Chemosphere, 2023, 322, 138219 CrossRef CAS.
- Z. Bano, N. Z. Ali, M. A. Khan, S. Mutahir, S. Zhu and F. Wang, et al., Synthesis, characterization and applications of 3D porous graphene hierarchical structure by direct carbonization of maleic acid, Ceram. Int., 2022, 48(6), 8409–8416 CrossRef CAS.
- G. Song, Y. Shi, A. Li, H. Wang and G. Ding, Facile preparation of three-dimensional graphene oxide/ι-carrageenan composite aerogel and its efficient ability for selective adsorption of methylene blue, J. Mater. Sci., 2021, 56(26), 14866–14879 CrossRef CAS.
- Y. He, Z. Guo, M. Chen, S. Wan, N. Peng and X. Fu, et al., Efficient adsorption of methyl orange and methylene blue dyes by a novel carbazole-based hyper-crosslinked porous polymer, J. Porous Mater., 2023, 30(5), 1439–1448 CrossRef.
- G. Assis, R. Antonelli, A. S. Dantas and A. Teixeira, Microplastics as hazardous pollutants: occurrence, effects, removal and mitigation by using plastic waste as adsorbents and supports for photocatalysts, J. Environ. Chem. Eng., 2023, 111107 CrossRef CAS.
- A. Seal, S. K. Malin, A. Schaffner, M. R. Hubbard, S. K. Keadle and H. Brunner-Gaydos, et al., 17-OR: ADA Presidents’ Select Abstract: Oral Bisphenol A Administration Decreased Peripheral Insulin Sensitivity in Healthy Adults, Diabetes, 2024, 73(Supplement_1) DOI:10.2337/db24-17-OR.
- O. Pencik, M. Durdakova, K. Molnarova, A. Kucsera, D. Klofac and M. Kolackova, et al., Microplastics and nanoplastics toxicity assays: A revision towards to environmental-relevance in water environment, J. Hazard. Mater., 2023, 454, 131476 CrossRef CAS PubMed.
- N. Qian, X. Gao, X. Lang, H. Deng, T. M. Bratu and Q. Chen, et al., Rapid single-particle chemical imaging of nanoplastics by SRS microscopy, Proc. Natl. Acad. Sci. U. S. A., 2024, 121(3), e2300582121 CrossRef CAS PubMed.
- Y. Zhu, R. Che, X. Zong, J. Wang, J. Li and C. Zhang, et al., A comprehensive review on the source, ingestion route, attachment and toxicity of microplastics/nanoplastics in human systems, J. Environ. Manage., 2024, 352, 120039 CrossRef CAS PubMed.
- T. Qin, X. Zhang, T. Guo, T. Yang, Y. Gao and W. Hao, et al., Epigenetic alteration shaped by the environmental chemical bisphenol A, Front. Genet., 2021, 11, 618966 CrossRef PubMed.
- A. Samir, F. H. Ashour, A. A. Hakim and M. Bassyouni, Recent advances in biodegradable polymers for sustainable applications, npj Mater. Degrad., 2022, 6(1), 68 CrossRef CAS.
- K. Liang, G. Yang, X. Q. Wang, C. L. Chow and D. Lau, Development of effective porous geopolymer adsorbent with high strength for copper (II) ion removal, J. Cleaner Prod., 2024, 449, 141752 CrossRef CAS.
- H. Majdoubi, S. Şimşek, R. E. K. Billah, N. Koçak, S. Kaya and Y. Tamraoui, et al., Novel geopolymer composite based on oil shale and chitosan for enhanced uranium (VI) adsorption: Experimental and theoretical approaches, J. Mol. Liq., 2024, 395, 123951 CrossRef CAS.
- M. I. Khan, T. K. Min, K. Azizli, S. Sufian, H. Ullah and Z. Man, Effective removal of methylene blue from water using phosphoric acid based geopolymers: synthesis, characterizations and adsorption studies, RSC Adv., 2015, 5(75), 61410–61420 RSC.
- S. Li, D. Xu, D. Wu and A. Howard, Characteristic of geopolymer modified by MgO and its adsorption capacity of phosphate and ammonium ions from swine wastewater, Process Saf. Environ. Prot., 2024, 182, 1130–1142 CrossRef CAS.
- G. S. Dos Reis, V. Srivastava, M. F. A. Taleb, M. M. Ibrahim, G. L. Dotto and D. L. Rossatto, et al., Adsorption of rare earth elements on a magnetic geopolymer derived from rice husk: studies in batch, column, and application in real phosphogypsum leachate sample, Environ. Sci. Pollut. Res., 2024, 31(7), 10417–10429 CrossRef CAS.
- I. Luttah, D. O. Onunga, V. O. Shikuku, B. Otieno and C. O. Kowenje, Removal of endosulfan from water by municipal waste incineration fly ash-based geopolymers: Adsorption kinetics, isotherms, and thermodynamics, Front. Environ. Chem., 2023, 4, 1164372 CrossRef.
- H. Jin, C. Qiu, Y. Li, J. Liu, D. Zhang and Q. Chen, et al., Insight into adsorption properties and mechanism of geopolymer adsorbents with inherent alkali release for tetracycline, J. Environ. Chem. Eng., 2024, 12(3), 112663 CrossRef CAS.
- Y. Wang, L. Liu, C. Ren, J. Ma, B. Shen and P. Zhao, et al., A novel amine functionalized porous geopolymer spheres from municipal solid waste incineration fly ash for CO2 capture, J. Environ. Manage., 2024, 349, 119540 CrossRef CAS PubMed.
- A. A. Siyal, M. R. Shamsuddin, S. H. Khahro, A. Low and M. Ayoub, Optimization of synthesis of geopolymer adsorbent for the effective removal of anionic surfactant from aqueous solution, J. Environ. Chem. Eng., 2021, 9(1), 104949 CrossRef CAS.
- H. Lin, J. Zhang, R. Wang, W. Zhang and J. Ye, Adsorption properties and mechanisms of geopolymers and their composites in different water environments: A comprehensive review, J. Water Proc. Eng., 2024, 62, 105393 CrossRef.
- J. Alahmad, A. BiBi and M. A. Al-Ghouti, Application of TiO2-loaded fly ash-based geopolymer in adsorption of methylene blue from water: Waste-to-value approach, Groundwater for Sustain. Dev., 2024, 25, 101138 CrossRef.
- D. Bernasconi, A. Viani, L. Zárybnická, P. Mácová, S. Bordignon and C. Caviglia, et al., Phosphate-based geopolymer: Influence of municipal solid waste fly ash introduction on structure and compressive strength, Ceram. Int., 2023, 49(13), 22149–22159 CrossRef CAS.
- M. R. R. Kooh, R. Thotagamuge, Y.-F. C. Chau, A. H. Mahadi and C. M. Lim, Machine learning approaches to predict adsorption capacity of Azolla pinnata in the removal of methylene blue, J. Taiwan Inst. Chem. Eng., 2022, 132, 104134 CrossRef CAS.
- A. S. M. Ghumman, R. Shamsuddin, A. Abbasi, M. Ahmad, Y. Yoshida and A. Sami, et al., The predictive machine learning model of a hydrated inverse vulcanized copolymer for effective mercury sequestration from wastewater, Sci. Total Environ., 2024, 908, 168034 CrossRef CAS.
- C. Liu, P. Balasubramanian, F. Li and H. Huang, Machine learning prediction of dye adsorption by hydrochar: Parameter optimization and experimental validation, J. Hazard. Mater., 2024, 480, 135853 CrossRef CAS PubMed.
- N. S. Zain, M. H. H. Mahmoud, M. I. Khan, F. Zafar, S. Manzoor and N. Akhtar, et al., Machine learning-assisted optimization and evaluation of methylene blue adsorption kinetics on citrus aurantifolia leaves: Insights from isotherm and thermodynamic studies, J. Taiwan Inst. Chem. Eng., 2024, 164, 105696 CrossRef CAS.
- M. I. Khan, S. Sufian, R. Shamsuddin, M. Farooq and N. Saafie, Synergistic adsorption of methylene blue using ternary composite of phosphoric acid geopolymer, calcium alginate, and sodium lauryl sulfate, Environ. Sci. Pollut. Res., 2024, 1–20 Search PubMed.
- Z. H. Mussa, L. R. Al-Ameer, F. F. Al-Qaim, I. F. Deyab, H. Kamyab and S. Chelliapan, A comprehensive review on adsorption of methylene blue dye using leaf waste as a bio-sorbent: isotherm adsorption, kinetics, and thermodynamics studies, Environ. Monit. Assess., 2023, 195(8), 940 Search PubMed.
- M. A. Al-Ghouti and R. S. Al-Absi, Mechanistic understanding of the adsorption and thermodynamic aspects of cationic methylene blue dye onto cellulosic olive stones biomass from wastewater, Sci. Rep., 2020, 10(1), 15928 CrossRef CAS PubMed.
- S. K. Lagergren, About the theory of so-called adsorption of soluble substances, Sven. Vetenskapsakad. Handingarl, 1898, 24, 1–39 Search PubMed.
- J. Wang and X. Guo, Rethinking of the intraparticle diffusion adsorption kinetics model: Interpretation, solving methods and applications, Chemosphere, 2022, 309, 136732 Search PubMed.
- S. Salvestrini, L. Ambrosone and F.-D. Kopinke, Some mistakes and misinterpretations in the analysis of thermodynamic adsorption data, J. Mol. Liq., 2022, 352, 118762 CrossRef CAS.
- G. Sharmila and R. Jeyalakshmi, Unravelling the stability of solvated silicate species in sodium silicate activator solution of different silica modulus by FTIR and NMR studies and their chemical reactivity on metakaolin and fly ash geopolymerisation, Sustain. Chem. Pharm., 2024, 39, 101578 Search PubMed.
- C. A. Rees, J. L. Provis, G. C. Lukey and J. S. Van Deventer, In situ ATR-FTIR study of the early stages of fly ash geopolymer gel formation, Langmuir, 2007, 23(17), 9076–9082 CrossRef CAS PubMed.
- M. I. Khan, K. Azizli, S. Sufian and Z. Man, Sodium silicate-free geopolymers as coating materials: Effects of Na/Al and water/solid ratios on adhesion strength, Ceram. Int., 2015, 41(2), 2794–2805 CrossRef.
- S. Hosseini, N. A. Brake, M. Nikookar, Ö. Günaydın-Şen and H. A. Snyder, Enhanced strength and microstructure of dredged clay sediment-fly ash geopolymer by mechanochemical activation, Constr. Build. Mater., 2021, 301, 123984 CrossRef CAS.
- S. A. Rasaki, Z. Bingxue, R. Guarecuco, T. Thomas and Y. Minghui, Geopolymer for use in heavy metals adsorption, and advanced oxidative processes: A critical review, J. Cleaner Prod., 2019, 213, 42–58 CrossRef CAS.
- T. Alomayri, F. Shaikh and I. M. Low, Thermal and mechanical properties of cotton fabric-reinforced geopolymer composites, J. Mater. Sci., 2013, 48, 6746–6752 CrossRef CAS.
- Y. Ge, X. Cui, C. Liao and Z. Li, Facile fabrication of green geopolymer/alginate hybrid spheres for efficient removal of Cu(II) in water: Batch and column studies, Chem. Eng. J., 2017, 311, 126–134 CrossRef CAS.
- M. Khapre, A. Shekhawat, D. Saravanan, S. Pandey and R. Jugade, Mesoporous Fe–Al-doped cellulose for the efficient removal of reactive dyes, Mater. Adv., 2022, 3(7), 3278–3285 RSC.
- S. Nurddin, Sufian, Z. Man, N. Rabat and N. Ahmad, Synthesis of high-porosity hybrid geopolymer/alginate adsorbent for effective removal of methylene blue and optimization of parameters using RSM, IOP Conf. Ser. Mater. Sci. Eng., 2020, 012082 CrossRef CAS.
- M. M. Mahdieh, V. Kordzadeh-Kerman, V. Ghalandari, A. Askari and M. Sillanpää, Adsorption isotherm models A comprehensive and systematic review (2010−2020), Sci. Total Environ., 2022, 812, 151334 CrossRef.
- M. Almas, A. S. Khan, A. Nasrullah, I. U. Din, T. M. Fagieh and E. M. Bakhsh, et al., Substantial increase in adsorption efficiency of local clay-alginate beads toward methylene blue impregnated with SDS, Environ. Sci. Pollut. Res., 2022, 1–17 Search PubMed.
- S. Candamano, G. Coppola, A. Mazza, J. I. C. Caranqui, S. Bhattacharyya and S. Chakraborty, et al., Batch and Fixed Bed Adsorption of Methylene Blue Onto Foamed Metakaolin-based Geopolymer: A Preliminary Investigation, Chem. Eng. Res. Des., 2023, 197, 761–773 CrossRef CAS.
- M. Kumar and R. Tamilarasan, Kinetics and Equilibrium Studies on the Removal of Victoria Blue Using Prosopis juliflora-Modified Carbon/Zn/Alginate Polymer Composite Beads, J. Chem. Eng. Data, 2013, 58(3), 517–527 CrossRef CAS.
- B. Aouan, S. Alehyen, M. Fadil, M. El Alouani, H. Saufi and E. H. El Herradi, et al., Development and optimization of geopolymer adsorbent for water treatment: Application of mixture design approach, J. Environ. Manage., 2023, 338, 117853 CrossRef CAS PubMed.
- S.-N. Zhuo, T.-C. Dai, H.-Y. Ren and B.-F. Liu, Simultaneous adsorption of phosphate and tetracycline by calcium modified corn stover biochar: Performance and mechanism, Bioresour. Technol., 2022, 359, 127477 CrossRef CAS.
- G. Mosoarca, C. Vancea, S. Popa, M. Gheju and S. Boran, Syringa vulgaris leaves powder a novel low-cost adsorbent for methylene blue removal: isotherms, kinetics, thermodynamic and optimization by Taguchi method, Sci. Rep., 2020, 10(1), 17676 CrossRef CAS.
- Y. Chu, M. A. Khan, M. Xia, W. Lei, F. Wang and S. Zhu, Synthesis and Mechanism of Adsorption Capacity of Modified Montmorillonite with Amino Acids for 4-Acetaminophenol Removal from Wastewaters, J. Chem. Eng. Data, 2019, 64(12), 5900–5909 CrossRef CAS.
- J. Ederer, P. Ecorchard, M. Š. Slušná, J. Tolasz, D. Smržová and S. Lupínková, et al., A Study of Methylene Blue Dye Interaction and Adsorption by Monolayer Graphene Oxide, Adsorpt. Sci. Technol., 2022, 2022, 7385541 CrossRef.
- E. N. Asamoah, H. Liu and X. Fan, Fixed-bed adsorption of methylene blue using granular NaX zeolite/attapulgite composite: efficiency, mechanism and reusability of saturated G-NaX/A, Sep. Purif. Technol., 2025, 354, 128710 CrossRef CAS.
- F. Dai, Q. Zhuang, G. Huang, H. Deng and X. Zhang, Infrared Spectrum Characteristics and Quantification of OH Groups in Coal, ACS Omega, 2023, 8(19), 17064–17076 CrossRef CAS.
- Y. Cao, L. Yang, F. Liu and Q. Yu, Adsorption experiments and mechanisms of methylene blue on activated carbon from garden waste via deep eutectic solvents coupling KOH activation, Biomass Bioenergy, 2024, 182, 107074 CrossRef CAS.
- C. Onyango, W. Nyairo, B. Kwach, V. Shikuku, T. Sylvain and H. D. Tamaguelon, et al., Synthesis of pumice and medical waste incinerator fly ash based phosphate geopolymers for methylene blue dye adsorption: co-valorization, parameters and mechanism, Mater. Adv., 2024, 5(21), 8546–8563 RSC.
- Y. He, L. Liu, L. He and X. Cui, Characterization of chemosynthetic H3PO4–Al2O3–2SiO2 geopolymers, Ceram. Int., 2016, 42(9), 10908–10912 CrossRef CAS.
- S. Candamano, G. Coppola, A. Mazza, J. I. Caicho Caranqui, S. Bhattacharyya and S. Chakraborty, et al., Batch and fixed bed adsorption of methylene blue onto foamed metakaolin-based geopolymer: A preliminary investigation, Chem. Eng. Res. Des., 2023, 197, 761–773 CrossRef CAS.
- K. Kaya-Özkiper, A. Uzun and S. Soyer-Uzun, Boosting methylene blue adsorption capacity of an industrial waste-based geopolymer by depositing graphitic carbon nitride onto its surface: Towards sustainable materials for wastewater treatment, Chem. Eng. Sci., 2024, 284, 119398 Search PubMed.
| This journal is © The Royal Society of Chemistry 2025 |

