 Open Access Article
An electroanalytical sensor for the detection of antibiotic cefoperazone sodium sulbactam sodium residue in wastewater
Mohsin Javeda,
Afzal Shah *a and
Muhammad Umar Farooqb
aDepartment of Chemistry, Quaid-i-Azam University, Islamabad 45320, Pakistan. E-mail: afzals_qau@yahoo.com
bNational Center for Physics, Islamabad, 45320, Pakistan
First published on 22nd January 2025
Abstract
The misuse and uncontrolled release of pharmaceuticals into water bodies lead to environmental challenges and the development of resistance, thereby reducing their effectiveness. To mitigate these problems, it is essential to identify pharmaceuticals in water sources and eliminate them prior to human use. This study presents the designing of a novel nanosensor for the detection of the antibiotic Cefoperazone Sodium Sulbactam Sodium (CSSS). The nanosensor was prepared by modifying the surface of a glassy carbon electrode (GCE) with the nanoparticles of NiO and MWCNTs. A green synthetic method was applied for the synthesis of NiO nanoparticles. Their structural and morphological characterization was conducted using X-ray diffraction and scanning electron microscopy, while optical properties were assessed through UV-vis spectroscopy. NiO nanoparticles in conjunction with MWCNTs enhanced the sensitivity of the GCE for the detection of CSSS. Electrochemical impedance spectroscopy revealed efficient charge transport through the designed sensing platform designated as NiO/MWCNTs/GCE. Square wave voltammetry demonstrated an eightfold increase in peak current intensity of CSSS at the NiO/MWCNTs/GCE as compared to the unmodified GCE. The electrochemical analysis of CSSS in solution of different pH indicated the involvement of protons during electron transfer reactions of CSSS. The limit of detection of CSSS with a value of 3.31 nM was obtained at the designed sensing platform under optimized experimental conditions. The current investigations combine advanced materials with principles of green chemistry, significantly enhancing efforts in wastewater remediation from antibiotic drugs.
1. Introduction
An individual's survival, well-being, and contentment hinge on the availability of potable water. Availability of clean water is a fundamental human right.1 Access to potable water for drinking, sanitation, and hygiene is vital to avert waterborne illnesses and ensure health sustainability.2 The lack of access to clean water poses serious health threats. Ensuring clean water availability is essential as it interlinks with food and energy production, thereby facilitating energy generation, agricultural development, and industrial growth, all of which contribute to economic progress and the alleviation of poverty.3,4 Water is fundamentally connected to multiple Sustainable Development Goals (SDGs).5 Goal 6, which focuses on “Clean Water and Sanitation,” seeks to guarantee universal access to sustainable water and sanitation services. Addressing the challenges of water purification is essential for the attainment of other SDGs, including SDG 1 (poverty eradication), SDG 3 (health promotion), SDG 2 (food security), and SDG 11 (sustainable urban development). Effective management of water resources can enhance health outcomes, reduce poverty, and support environmental sustainability.6 The occurrence of pharmaceutical substances in aquatic ecosystems significantly contributes to water pollution, which is a pressing global issue.7 Medications that are not fully metabolized by the human body are expelled through urine and subsequently enter wastewater treatment systems. When these pharmaceutical residues evade conventional treatment processes, they can taint water bodies such as lakes, rivers, and underground aquifers.8 This contamination poses serious risks to aquatic life, potentially causing reproductive and developmental issues in fish and other species by interfering with their endocrine functions.9 Consequently, there is an urgent need for advanced water purification technologies and stringent regulations to detect and remove even trace amounts of pharmaceuticals, thereby protecting both public health and aquatic ecosystems.Cefoperazone sodium (CS) is a third-generation semi-synthetic cephalosporin antibiotic. It possesses broad-spectrum antibacterial properties and is utilized in managing diverse infections caused by Gram-positive and Gram-negative bacteria.10 Sulbactam sodium (SS) functions as an irreversible β-lactamase inhibitor by attaching its beta-lactam ring to the active site of β-lactamase, thereby safeguarding the efficacy of other β-lactam antibiotics.9 When used with other β-lactam antibiotics, such as cephalosporins, it significantly enhances their antibacterial effectiveness, increasing it by a factor of 4 to 32. Cefoperazone Sodium Sulbactam Sodium (CSSS) is a combination of β-lactam and β-lactamase inhibitor SS. CSSS is a broad-spectrum antibiotic often used to treat anaerobes and infections caused by Gram (+) cocci and Gram (−) bacilli.11 It is a water-soluble third-generation cephalosporin. It shows potent clinical efficacy for febrile neutropenia and even against multi-drug-resistant organisms. It is widely utilized worldwide to cure infections caused by bacteria.12 However, CSSS also causes serious health problems in humans. Hypersensitivity reactions, gastrointestinal effects, hepatic effects, hematologic abnormalities, and renal effects are some of the significant health issues caused by CSSS. Identifying CSSS is essential due to its potential adverse effects, such as diarrhea, nausea, vomiting, skin rashes, and reactions at the injection site. Administered through intramuscular injection, CSSS achieves peak plasma concentration and disseminates throughout the body while associating with plasma proteins. Although it rarely penetrates the cerebrospinal fluid, it extensively distributes across different tissues and fluids in the body. Additionally, it crosses the placenta, and its diminished concentrations are often detected in breast milk, raising significant concerns.13 Because of its adverse side effects, it has been discontinued in the United States.14
Pharmaceuticals, particularly antibiotics such as CSSS pose significant risks when they enter wastewater, necessitating their detection. Due to their stability, these substances persist in aquatic environments, impacting marine life and humans through the food chain. Prolonged use of CSSS and comparable antibiotics may contribute to the emergence of antibiotic resistance. Therefore, continuously monitoring these xenobiotics in wastewater is essential to mitigate their harmful effects. Various techniques, including chromatographic, spectrophotometric, and voltammetric methods, are employed to identify pharmaceuticals in wastewater, human serum, and urine.15,16 Voltammetric techniques, particularly square wave voltammetry (SWV), are favoured for pharmaceutical detection due to their fast speed of analysis and high sensitivity. This method entails applying a series of square wave potentials to an electrode immersed in solution of analyte containing supporting electrolyte.16 The peak current response generated by SWV is then measured and analyzed to determine the concentration of the analyte of interest. Additionally, this method requires only a minimal amount of the analyte and is capable of effectively detecting very low concentrations.
Metal oxide nanoparticles (NPs) serve a crucial role in the modification of electrodes.17 NiO NPs, in particular, enhance the sensitivity of transducers by facilitating efficient electron transfer and providing selectivity, making them an optimal choice for electrode modification in rapid detection applications.17 Furthermore, their chemical and mechanical stability ensures sustained performance and durability of the sensor.18 Sensors based on NPs present an effective and economical solution for detecting pharmaceuticals in aquatic environments.19 The incorporation of multi-walled carbon nanotubes (MWCNTs) as an electrode modifier markedly enhances sensitivity. This enhancement is attributed to MWCNTs' large surface area and excellent electrical conductivity, which reduce detection limits in electrochemical sensing. This modification increases the availability of active sites for analyte adsorption and accelerates electron transfer rates, which is why MWCNTs are utilized alongside metal NPs for improving the sensitivity of the electrode.19,20
To the best of our knowledge, there is currently no existing report on the detection of CSSS. This study aims to fill that gap in the literature by addressing safety concerns associated with both direct consumption and indirect exposure to pharmaceutical wastes containing CSSS. It represents the inaugural report on the nanomolar voltammetric detection of CSSS through environmentally friendly methods and materials. The research presents a sustainable approach for synthesizing nickel oxide nanoparticles, which were employed in conjunction with multi-walled carbon nanotubes for the electrochemical detection of CSSS. An electrochemical sensing layer of nickel oxide nanoparticles was deposited, followed by a layer of multi-walled carbon nanotubes on the surface of a glassy carbon electrode (GCE). NiO nanoparticles exhibit moderate band gap energy of 3.06 eV, which promotes electron transfer within their conduction band. The exceptional electronic conductivity of MWCNTs enhances the conductivity thereby improving the sensing capabilities of modified GCE. The voltammetric response of the CSSS was recorded on the designed sensing platform and the method presented enabled highly sensitive electrochemical detection of CSSS and probing of its pH-dependent redox mechanism.
2. Experimental section
2.1 Chemicals
CS and SS were purchased from Daneen Pharma Pvt. Pakistan. All other chemicals used in this study were acquired from Sigma Aldrich and used without additional purification.2.2 Phytosynthesis of NiO NPs
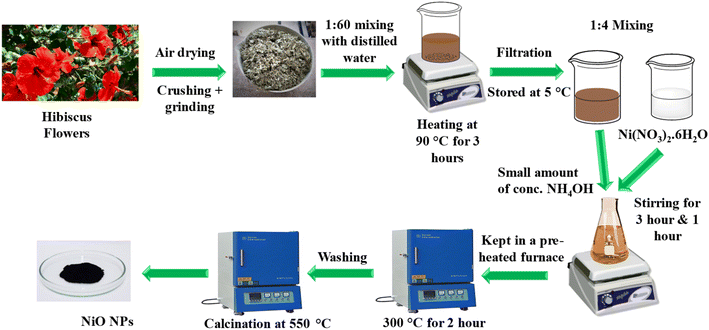
NiO NPs were synthesized using an eco-friendly green synthetic method using the hibiscus extract. A reported method was followed with certain modifications.21 The flowers from the plant, as mentioned above, were initially gathered from a rose garden in Islamabad. After collection, the flowers underwent a thorough washing with double-distilled water. They were then spread out and allowed to air dry for up to 10 days. Once dried, the flowers were ground into a fine powder. A quantity of 5 g of this powdered material was combined with 300 mL of distilled water and heated at a temperature of 90–95 °C for approximately 3 hours. The resulting extract was subsequently filtered and centrifuged to eliminate any insoluble impurities, and the purified extract was stored at 5 °C for future use.To synthesize NiO NPs, 0.1 M solution of Ni(NO3)2·6H2O was treated with the flower extract in a ratio of 1![[thin space (1/6-em)]](https://www.rsc.org/images/entities/char_2009.gif) :
:![[thin space (1/6-em)]](https://www.rsc.org/images/entities/char_2009.gif) 4. The mixture was allowed to stir for about 3 hours. After that, a small amount of concentrated NH4OH was added and stirred for one hour. NH4OH acted as a reducing agent and facilitated the formation of Ni(OH)2 by providing alkaline media. Then, it was kept in an oven at 300 °C for almost 2 hours. During the reaction, the organic part obtained from flower extract and NH4OH acted as a reducing agent, while the metal nitrate (Ni(NO3)2·6H2O) acted as an oxidizing agent, forming NiO NPs. The extract also acted as a capping agent. NiO nanoparticles were carefully washed several times with ethanol and doubly distilled water to ensure that all contaminants were eliminated. Subsequently, NiO NPs were calcined at a temperature of 550 °C for three hours and stored in an airtight glass vial for further use. The schematic illustration for the green synthesis of NiO NPs is illustrated in Fig. 1.
4. The mixture was allowed to stir for about 3 hours. After that, a small amount of concentrated NH4OH was added and stirred for one hour. NH4OH acted as a reducing agent and facilitated the formation of Ni(OH)2 by providing alkaline media. Then, it was kept in an oven at 300 °C for almost 2 hours. During the reaction, the organic part obtained from flower extract and NH4OH acted as a reducing agent, while the metal nitrate (Ni(NO3)2·6H2O) acted as an oxidizing agent, forming NiO NPs. The extract also acted as a capping agent. NiO nanoparticles were carefully washed several times with ethanol and doubly distilled water to ensure that all contaminants were eliminated. Subsequently, NiO NPs were calcined at a temperature of 550 °C for three hours and stored in an airtight glass vial for further use. The schematic illustration for the green synthesis of NiO NPs is illustrated in Fig. 1.
2.3 Modification of electrode
The GCE was cleaned using a nylon rubbing mat using chemical and physical methods. The GCE was rubbed in the shape of 8 on a rubbing mat containing an alumina slurry with a particle size of 1 μM. The cleaned transducer was subjected to 10 minutes of sonication in a mixture of ethanol, water, and acetone. Afterwards, it was air-dried. The GCE was then cleaned electrochemically by conducting cyclic voltammograms within a potential window of −0.1 V to 1.0 V until consistent and repeatable voltammograms were achieved. To modify the GCE for enhancing the electro-oxidation signal of CSSS, dispersions of MWCNTs and NiO NPs were prepared in dimethylformamide using ultrasonication for 5 hours, with a concentration of 1 mg per 1 mL. The GCE was pre-cleaned and then modified by NiO NPs and MWCNTs through a layer-by-layer approach. The modified GCE was air-dried and implemented to identify CSSS.To conduct electrochemical assays of CSSS, a 0.1 mM solution of the drug was made using doubly-distilled water. Further dilutions were made using doubly distilled water until the desired concentration was achieved. Once the modified GCE was fabricated, the drop cast method was employed. A small drop of analyte solution was cast over the surface of the NiO/MWCNTs/GCE, followed by its immersion in supporting electrolyte solution for recording voltammograms. The electrochemical cell containing phosphate buffer electrolyte was used to observe the electrochemical performance of CSSS on the modified GCE. The capacity of the sensing scaffold to detect CSSS was evaluated by performing CV and SWV, followed by comparing their peak current responses with those obtained on the unmodified GCE.
3. Results and discussion
3.1 Structural analysis of NiO
The optical properties of NiO NPs were studied using UV-vis spectroscopy. The UV-vis absorption spectrum of the synthesized NiO NPs is shown in Fig. 2(A). The characteristic peak at 325 nm is well following the reported literature. The band gap of the synthesized NiO NPs was calculated using Tauc plot method using the following equation.22
 | (1) |
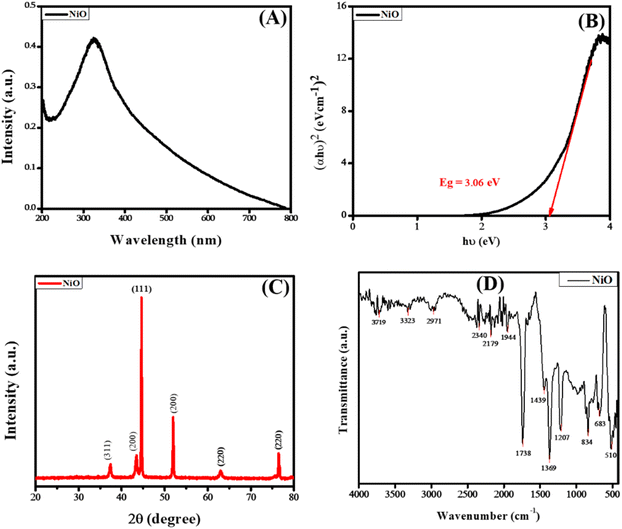 | ||
| Fig. 2 (A) UV-vis absorption spectrum (B) Tauc plot (C) XRD and (D) FTIR spectrum of the synthesized NiO NPs. | ||
The phase purity and structural analysis of NiO NPs were investigated via powder XRD. Fig. 2(C) depicts the XRD diffractogram showing the crystalline structure of NiO NPs. The diffraction signals at 2θ values of 37.3°, 43.4°, 44.5°, 51.9°, 62.9°, and 76.5° with corresponding crystallographic planes (311), (200), (111), (200), (220), and (220) match well with the JCPDS # 04-0835. The XRD pattern corresponding to the specified JCPDS card number indicates a pure face-centered cubic phase and crystalline structure, as illustrated in Fig. 2(C). The average value of the grain size was calculated via the Debye–Scherrer formula.23
 | (2) |
The FTIR spectrum of NiO NPs is shown in Fig. 2(D), which shows multiple absorption peaks. The signal at 3719 cm−1 corresponds to the –OH stretching due to the presence of water, while the peak at 3323 cm−1 indicates the –OH due to NH4OH. The signals at 2340 and 2179 cm−1 indicate the presence of –C![[double bond, length as m-dash]](https://www.rsc.org/images/entities/char_e001.gif) O groups. The peak at 1738 cm−1 corresponds to the presence of the carbonyl group (–C
O groups. The peak at 1738 cm−1 corresponds to the presence of the carbonyl group (–C![[double bond, length as m-dash]](https://www.rsc.org/images/entities/char_e001.gif) O stretching vibrations), while peaks at 1369 cm−1 and 1207 cm−1 correspond to the presence of –CH2– vibrations and –OH vibrations, respectively. The occurrence of the peak at 683 cm−1 and 510 cm−1 correspond to the stretching vibrations of Ni–O.24,25
O stretching vibrations), while peaks at 1369 cm−1 and 1207 cm−1 correspond to the presence of –CH2– vibrations and –OH vibrations, respectively. The occurrence of the peak at 683 cm−1 and 510 cm−1 correspond to the stretching vibrations of Ni–O.24,25
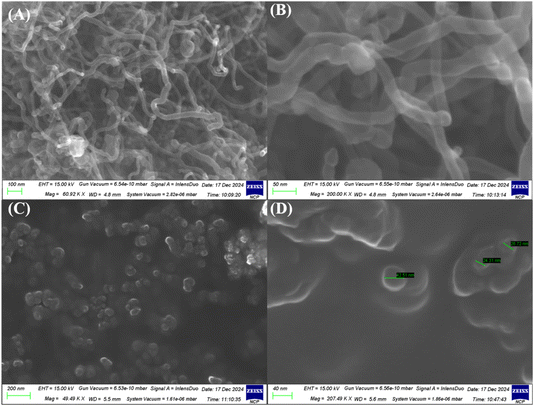
The SEM images (Fig. 3) of MWCNTs and NiO nanoparticles illustrate their morphology and distribution. MWCNTs exhibit a distinct tube-like structure, as depicted in Fig. 3(A) and (B). Conversely, the NiO nanoparticles appear as spherical entities and form spherical nanoclusters due to agglomeration, as shown in Fig. 3(C) and (D), with sizes aligning with XRD measurements. The distinct spots representing NiO nanoparticles in the SEM images, measuring 24.31 nm, correlate with the crystallite size determined by XRD, thereby validating the precision of both characterization methods. This alignment between SEM and XRD findings highlights the consistency and uniformity of the synthesized NiO nanoparticles in terms of size and shape.
Crystallinity can be assessed by comparing the dimensions of the crystallites, a process that can be accomplished through scanning electron microscopy (SEM). The following equation illustrates the concept of crystallinity:
| I = Dp(SEM)/Dcry(XRD) | (3) |
The crystallinity index is denoted as I, while Dp refers to the particle size determined via SEM, and Dcry represents the crystallite size derived from the Scherrer equation.26 The current investigations reveal that the crystallinity index of the NiO nanoparticles is approximately 1, suggesting that they are monocrystalline, in contrast to polycrystalline materials, which exhibit a significantly higher crystallinity index.
3.2 Electrochemical characterizations of NiO NPs and MWCNTs
The electrode's surface area plays an essential role in examining the sensing capability of the developed sensor. The increased surface area of the sensing scaffold facilitates the exchange of more species, leading to an elevated current signal. The shift of the oxidation signal to lower potentials indicates the electrocatalytic function of the electrode modifier. Anions move through the electrical potential gradient between electrodes, facilitating the transfer of electrons to the anode. The anions subsequently undergo oxidation. The oxidized species is required to diffuse away from the electrode surface. If they maintain contact with the electrode, they hinder the surface of the electrode, obstructing the migration of additional anions onto the electrode's surface. The ion exchange rate on an electrode remains constant per unit area. The increased surface area facilitates more active sites, resulting in an enhanced exchange of charge carriers and the subsequent emergence of intense current signals.
The Randles–Sevcik equation is useful for determining the electrode's electroactive surface area.27 It relates peak current with scan rate.
| Ipa = 2.6 × 10⁵n3/2D1/2Cv1/2A | (4) |
| Working electrode | Rs (Ω) | Rct (Ω) | Surface area (cm2) | Peak separation (ΔEp) (mV) | Exchange current density (μA cm−2) |
|---|---|---|---|---|---|
| Bare GCE | 130 | 3256 | 0.029 | 103 | 7.88 |
| NiO/GCE | 132 | 2106 | 0.049 | 91 | 12.19 |
| MWCNTs/GCE | 130 | 1272 | 0.086 | 72 | 20.18 |
| NiO/MWCNTs/GCE | 129 | 509 | 0.114 | 65 | 50.44 |
The exchange current density (Jo) is an essential parameter in electrochemistry, indicating the rate of electron transfer between an electrode and an electrolyte at equilibrium, characterized by the absence of net current flow.28 This parameter is vital for comprehending the kinetics of electrochemical reactions. An increased current density reflects a more reactive electrode surface, which promotes quicker electron transfer reactions. This aspect is critical for sensors, as it influences their sensitivity and response time directly. The performance of electrochemical sensors depends on the effective transfer of electrons between the analyte and the electrode. A higher exchange current density indicates that the sensor can more effectively detect lower concentrations of the analyte, thereby improving its sensitivity. The exchange current density can be calculated using the following formula:
 | (5) |
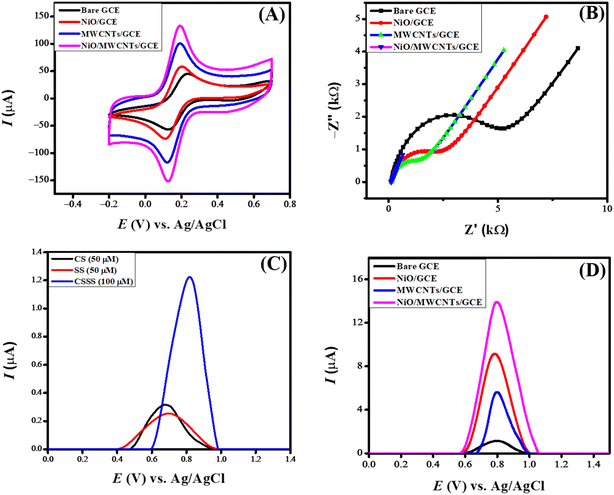
An EIS spectrum consists of two distinct components. A semicircle (at the higher frequency region) whose diameter refers to charge transfer resistance and the linear part representing Warburg resistance (Zw) due to diffusional transport. Zw and Rct are associated with mass and electron transfer at the electrode–electrolyte interface. Fig. 4(B) displays the Nyquist plots of the EIS data obtained at a constant amplitude of 10 mV for the bare and modified glassy carbon electrodes immersed in 0.1 M KCl electrolyte containing 0.005 M K3[Fe(CN6)] redox probe. The larger semicircle suggests more resistance (Rct value of 4653 Ω) to the transfer of electrons between the GCE and the redox probe. The modified electrodes exhibited a substantially decreased Rct value, with the lowest charge transfer of 509 Ω for NiO/MWCNTs/GCE, indicating it as the most suitable platform for efficient charge transport.
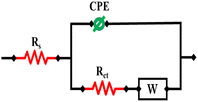
Randle's equivalent circuit is used to model the behavior of electrochemical systems. The three main parts are the double-layer capacitance (Cdl), charge transfer resistance (Rct), and solution/electrolyte resistance (Rs). Rct and Cdl are connected in parallel, while Rs is connected in series with the remaining components. Fig. 5 demonstrates the application of an equivalent circuit model (RCRW) to represent the experimental impedance results. This model includes a constant phase element, resistors, and Warburg impedance. The NiO/MWCNTs/GCE depicted a low charge transfer resistance as compared to other modified and bare GCEs. It also offered low impedance, which resulted in fast electron transfer during the electrochemical process. The EIS parameters are listed in Table 1.
3.3 Square voltammetric study of CSSS
When cefoperazone sodium and sulbactam sodium are analyzed separately using square wave voltammetry, they show peaks at different potentials due to their distinct electrochemical properties. However, combined, they form a single peak in square wave voltammetry. The combined mixture exhibits a synergistic electrochemical behavior, resulting in a merged response, depicted in Fig. 4(C). The voltammograms of 100 μM CSSS were recorded in PBS of pH 6 in the potential range of 0 V to 1.5 V at a deposition potential of 0 V and accumulation time of 5 seconds. Fig. 4(D) presents the square wave voltammetric profile at the bare and modified GCE. NiO/MWCNTs/GCE shows the maximum peak current for CSSS in contrast to NiO/GCE, MWCNTs/GCE, and unmodified GCE. This trend is also obvious from the CV and EIS data because NiO/MWCNTs/GCE was found to have greater surface area and lower charge transfer resistance.MWCNTs facilitate electron transfer because of their conductive nature. The reason for the efficient charge transport through NiO/MWCNTs/GCE can be linked to MWCNTs possessing porous structures with abundant surface defects, which also help the analyte absorption. NiO is a semiconducting material with higher thermal stability, and it offers stability and more catalytic sites to GCE, leading to efficient electro-oxidation of the analyte. The synergistic effect of NiO and MWCNTs is evident from the drug's intense electro-oxidation signal on NiO/MWCNTs/GCE. MWCNTs have delocalized π-electrons, which interact with the π-electronic cloud of the drug, leading to pre-concentration at the electrode–electrolyte interface with consequent generation of the intense electro-oxidation signal. So NiO/MWCNTs/GCE is selected as the optimum electrocatalyst for the sensing of CSSS owing to the catalytic activity of NiO, porous structure of MWCNTs, π–π interaction, and absorption of analyte onto MWCNTs.
3.4 Optimization of experimental conditions
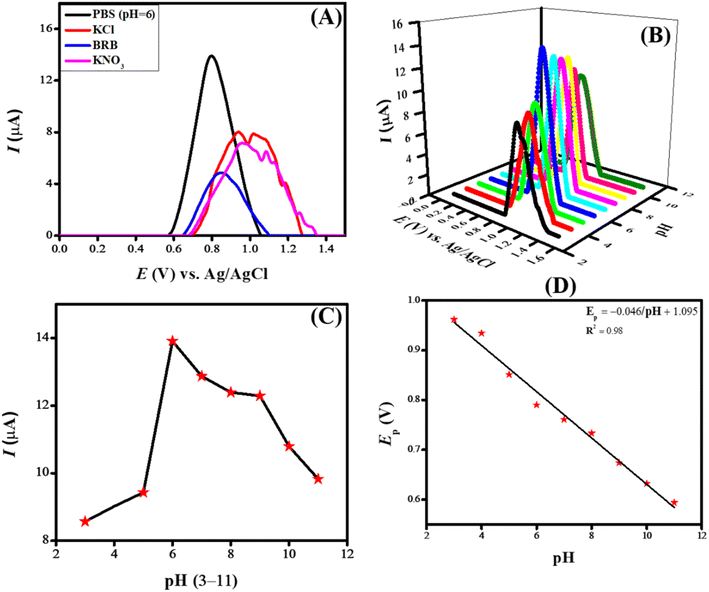
Each experiment requires parameters and variables to be optimized before execution to ensure consistent results. Accuracy and efficiency are critical factors in every experiment, making optimizing experimental conditions an essential step. Several factors, such as peak intensity, peak potential, and peak shape of the analyte, can be influenced by adjusting the electrolyte, pH, deposition potential, and deposition time. Various experimental parameters were optimized to enhance the sensitivity of the designed sensing scaffolds. The critical process in electrochemical sensing is the optimization of electrolytes, which leads to enhanced sensitivity by influencing the designed sensing scaffold. Different electrolytes have different ionic conductivity, ionic strength, chemical equilibria, and ion migration, which greatly alters the SWV peak current response. The main purpose of incorporating a supporting electrolyte is to improve conductivity by reducing the system's voltage drop (IR drop).To investigate the current response of NiO/MWCNTs/GCE toward the oxidation of CSSS, different supporting electrolytes such as KCl, KNO3, Britton–Robinson buffer, and phosphate buffer were tested. Acidic and basic media were also used as supporting electrolytes, but no prominent peaks were observed. This may be attributed to protonation and deprotonation, which result in the appearance of broad peaks, making them less distinguishable. Fig. 6(A) illustrates the effect of changing the inert electrolyte on the sensing of CSSS. The most intense signal of the analyte was obtained at the NiO/MWCNTs/GCE sensor in PBS (pH 6) compared to the other electrolytes. PBS, which contains sodium, phosphate, and potassium, is a balanced mixture of monovalent and divalent ions. Additionally, it provides reproducible and reliable results due to its stability across various temperatures and pH values. Therefore, PBS was selected for further electrochemical analyses of CSSS.
The electrochemical sensing of CSSS by the designed sensing scaffold now relies on PBS as the supporting electrolyte, making pH optimization a crucial step. The analyte's sensitivity and accuracy depend highly on pH, and optimizing them can improve both. PBS also influences the redox potential, so the reaction must occur at a favorable potential. Fluctuations in peak current at different pH values may result from variations in the dissociation constant. Additionally, pH fluctuations can affect reaction rates, ionic mobility, and protonation/deprotonation of moieties at the electrode surface, leading to changes in the voltammograms' peak current, potential, and shape. Therefore, a well-controlled pH experiment is necessary to minimize interference from the surrounding environment.
To examine the influence of pH on the electrooxidation of CSSS (100 μM) using our designed sensing scaffold, the pH of PBS was varied from 3 to 11, and SWVs were recorded. Fig. 6(B) illustrates the SWVs recorded at different pH values for the oxidation of CSSS. Fig. 6(C) shows the fluctuation in peak current as a function of pH for the oxidation of CSSS. There is a regular increase in peak current from pH 3 to pH 6, and after that, there is a steady decrease until pH 11. The maximum peak current was observed at pH 6, which was determined to be the optimal pH for the supporting electrolyte in the electroanalysis of CSSS.
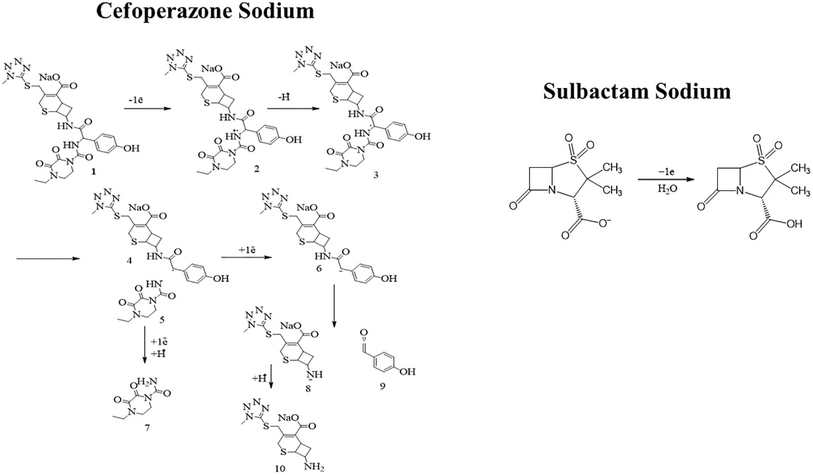
An Ep vs. pH plot was drawn to determine the number of protons and electrons transferred during the electrooxidation of CSSS. The shift in peak position with changing pH confirms the involvement of both electrons and protons in the electrooxidation process. The Ep vs. pH plot for the electrochemical detection of CSSS is shown in Fig. 6(D). From the Ep vs. pH plot, it was confirmed that protons are transferred along with electrons during the electroanalysis of CSSS. The number of electrons was determined using the full-width at half maximum (FWHM), and the proton-to-electron ratio was calculated using the Nernstian slope. Based on these findings, the proposed mechanism for the electrooxidation of CSSS is presented in Fig. 7.
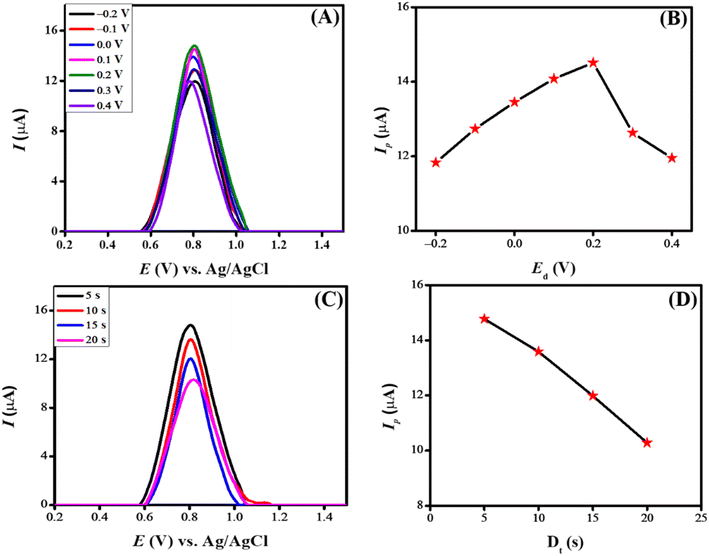
The deposition potential is decisive in electrochemical sensing as it impacts the detection process. When a pre-concentrated analyte is deposited onto the electrode surface, it enhances sensitivity by allowing the sensing scaffold to detect lower drug concentrations. Additionally, it improves selectivity by selectively depositing the analyte and reducing interference from the surroundings, thus ensuring the accuracy of the sensing scaffold. Fig. 8(A) illustrates the result of changing deposition potential from −0.2 V to 0.4 V on the peak current of CSSS. The peak current increased consistently as the deposition potential rose from −0.2 V to 0.2 V. Beyond 0.2 V, the peak current gradually decreased. The most intense signal was detected at a deposition potential of 0.2 V, which can be ascribed to the anionic nature of CSSS. At this potential, the drug interacts strongly with the designed sensing scaffold. Therefore, a deposition potential of 0.2 V was chosen for the further electrochemical investigation of CSSS due to the maximum peak current observed at this value. Fig. 8(B) depicts the variation in peak current concerning deposition potential.
The deposition time significantly impacts the electrochemical sensing platform's ability to sense. Generally, a longer deposition time can enhance the signal because more analyte accumulates on the electrode surface. However, extended deposition times can sometimes lead to lower signal intensity due to analyte saturation and interference from the surrounding environment. Additionally, uncontrolled deposition times can affect repeatability by causing uneven drug accumulation on the electrode's surface. Therefore, optimizing the deposition period to achieve optimal drug deposition, minimize non-specific adsorption, and ensure consistent and accurate results is crucial. The influence of deposition time on the electrooxidation of CSSS was studied from 5 s to 20 s at a deposition potential of 0.2 V. Fig. 8(C) shows the effect of accumulation time on the peak current of CSSS at this deposition potential using the modified sensing platform. A gradual fall in peak current was noticed as the accumulation time increased from 5 s to 20 s. The maximum peak current was achieved at an accumulation time of 5 s, indicating that the maximum number of CSSS molecules were optimally oriented and deposited on the electrode surface at this accumulation time. The decrease in peak current with longer deposition times can be attributed to saturation of the analyte's functionalities and accessible sites on the sensing scaffold, as well as potential blockage in the mass transport of drug molecules. Consequently, a deposition time of 5 s and a deposition potential of 0.2 V was chosen for further electro-analysis of CSSS. Fig. 8(D) illustrates the variation in peak current as a function of deposition time for the electrooxidation of CSSS.
3.5 Analytical applications of the designed sensing platform
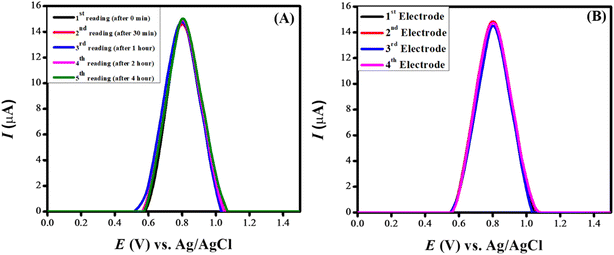
Investigations were conducted to assess the uniformity of the sensing surface, focusing on the reproducibility and repeatability of the modified GCE. The sensor's stability was evaluated by analyzing its electrochemical response to CSSS under the pre-optimized conditions established for the experiment. SWVs were recorded under pre-optimized conditions to determine the sensitivity of the sensing scaffolds at different concentrations. The SWVs for the electro-oxidation of CSSS were recorded by varying its concentration from 0.06 μM to 100 μM under pre-optimized conditions, as shown in Fig. 9(A). The calibration plot for the lower concentrations of CSSS is depicted in Fig. 9(B). The LOD and LOQ were estimated using the following equations.29
 | (6) |
 | (7) |
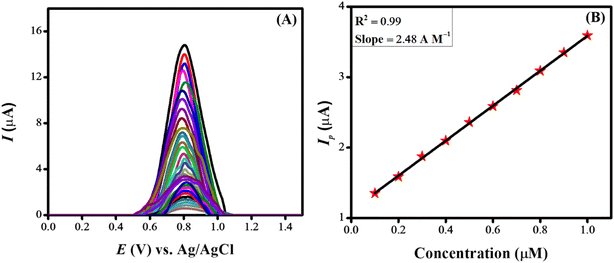 | ||
| Fig. 9 (A) Variation of current with change in concentration under pre-optimized conditions for CSSS and (B) calibration plot at lower concentrations for CSSS. | ||
4. Conclusions
The findings of the current study demonstrate that the sensing capabilities of the transducer can be improved through surface modification using an appropriate combination of electrode modifiers that exhibit outstanding electronic conductivity. Modification of glassy carbon electrode (GCE) with NiO nanoparticles and MWCNTs led to four times faster charge transport in comparison to bare GCE as revealed from the results of electrochemical impedance spectroscopy. The engineered sensing platform (NiO/MWCNTs/GCE) exhibited significant effectiveness in identifying the antibiotic Cefoperazone Sodium Sulbactam Sodium (CSSS) within wastewater. The eight fold intense square wave voltammetric oxidation signal of CSSS at the modified GCE as compared to unmodified GCE revealed the strong electrocatalytic role of NiO and MWCNTs. The pH dependent electrochemical investigations revealed protons accompaniment during the electrooxidation of CSSS. Under optimized conditions (PBS supporting electrolyte, pH 6, deposition time of 5 s and deposition potential of 0.2 V) the sensing platform showed a remarkable sensitivity for detecting CSSS with a limit of detection of 3.31 nM. The repeatability and reproducibility tests revealed the practical applicability of the designed sensor. The results of this study highlight the importance of electrochemical sensors in detecting pharmaceutical residues, evaluating their contamination levels, and investigating their proton-coupled redox mechanisms.Data availability
All data are available within the manuscript in the form of tables and figures.Conflicts of interest
The authors declare no conflict of interest regarding the publication of this manuscript.Acknowledgements
We acknowledge the support of Quaid-i-Azam University and the Higher Education Commission of Pakistan for supporting this work.References
- W. Jepson, J. Budds, L. Eichelberger, L. Harris, E. Norman, K. O'Reilly, A. Pearson, S. Shah, J. Shinn and C. Staddon, Advancing human capabilities for water security: A relational approach, Water Security, 2017, 1, 46–52 CrossRef.
- M. Pal, Y. Ayele, M. Hadush, S. Panigrahi and V. Jadhav, Public health hazards due to unsafe drinking water, Air Water Borne Dis., 2018, 7(1000138), 2 Search PubMed.
- W. J. Cosgrove and D. P. Loucks, Water management: Current and future challenges and research directions, Water Resour. Res., 2015, 51(6), 4823–4839 CrossRef.
- O. L. Ume, B. C. Ekeoma, M. Yusuf, A. A. Al-Kahtani, M. Ubaidullah and M. Sillanpää, Batch studies of hexavalent chromium biosorption from mining wastewater using Aspergillus niger, Results Chem., 2022, 4, 100490 CrossRef CAS.
- M. Velis, K. I. Conti and F. Biermann, Groundwater and human development: synergies and trade-offs within the context of the sustainable development goals, Sustain. Sci., 2017, 12, 1007–1017 CrossRef.
- A. D. Ofori and A. Mdee, Integrated water resource management, in Clean Water and Sanitation, Springer, 2022, pp. 344–357 Search PubMed.
- M. Ortúzar, M. Esterhuizen, D. R. Olicón-Hernández, J. González-López and E. Aranda, Pharmaceutical pollution in aquatic environments: a concise review of environmental impacts and bioremediation systems, Front. Microbiol., 2022, 13, 869332 CrossRef.
- R. Sarathi, S. M. Sundar, P. Jayamurugan, S. Ganganagunta, D. Sudhadevi, M. Ubaidullah, B. Pandit, M. Gupta, S. S. Sehgal and N. S. Rao, Impacts of pH on photocatalytic efficiency, the control of energy and morphological properties of CuO nanoparticles for industrial wastewater treatment applications, Mater. Sci. Eng., B, 2023, 298, 116856 CrossRef CAS.
- I. O. Sanusi, G. O. Olutona, I. G. Wawata and H. Onohuean, Occurrence, environmental impact and fate of pharmaceuticals in groundwater and surface water: a critical review, Environ. Sci. Pollut. Res., 2023, 30(39), 90595–90614 CrossRef CAS PubMed.
- V. Ghodake, J. Vishwakarma, S. L. Vavilala and V. Patravale, Cefoperazone sodium liposomal formulation to mitigate P. aeruginosa biofilm in Cystic fibrosis infection: A QbD approach, Int. J. Pharm., 2020, 587, 119696 CrossRef CAS PubMed.
- Y.-H. Ku and W.-L. Yu, Cefoperazone/sulbactam: New composites against multiresistant gram negative bacteria?, Infect., Genet. Evol., 2021, 88, 104707 CrossRef CAS PubMed.
- D. Saxena, R. Maitra, R. Bormon, M. Czekanska, J. Meiers, A. Titz, S. Verma and S. Chopra, Tackling the outer membrane: facilitating compound entry into Gram-negative bacterial pathogens, npj Antimicrobials and Resistance, 2023, 1(1), 17 CrossRef.
- B. Dogan, A. Golcu, M. Dolaz and S. A. Ozkan, Electrochemical behaviour of the bactericidal cefoperazone and its selective voltammetric determination in pharmaceutical dosage forms and human serum, Curr. Pharm. Anal., 2009, 5(2), 179–189 CrossRef CAS.
- E. A. Funk and L. J. Strausbaugh, Antimicrobial activity, pharmacokinetics, adverse reactions, and therapeutic indications of cefoperazone, Pharmacotherapy, 1982, 2(4), 185–196 CrossRef CAS PubMed.
- Y. Tan, Q. Song, W. Liu, M. Li, J. Xiao and C. Chen, Dual-channel microchip electrophoresis with amperometric detection system for rapid analysis of cefoperazone and sulbactam, Anal. Sci., 2019, 35(10), 1103–1109 CrossRef CAS.
- X. J. Wu, X. Huang, H. Y. Shi, X. K. Chen, Q. Dong, G. X. Hao, Y. Li, Y. Zheng and W. Zhao, Determination of cefoperazone and sulbactam in serum by HPLC-MS/MS: An adapted method for therapeutic drug monitoring in children, Biomed. Chromatogr., 2018, 32(4), e4143 CrossRef PubMed.
- N. Raeisi-Kheirabadi, A. Nezamzadeh-Ejhieh and H. Aghaei, Electrochemical amperometric sensing of loratadine using NiO modified paste electrode as an amplified sensor, Iran. J. Catal., 2021, 11(2), 181–189 CAS.
- F. A. Sayao, A. S. Martins, J. J. Da Silva and M. V. B. Zanoni, Evaluation of Ni0, NiO, and NiS as a Cocatalyst Modifier on TiO2 Nanotubes Matrix for the Enhancement of Photoelectrocatalytic Oxidation of Penicillin G, J. Electrochem. Soc., 2021, 168(7), 076503 CrossRef CAS.
- V. Schroeder, S. Savagatrup, M. He, S. Lin and T. M. Swager, Carbon nanotube chemical sensors, Chem. Rev., 2018, 119(1), 599–663 CrossRef.
- G. Cho, S. Azzouzi, G. Zucchi and B. Lebental, Electrical and electrochemical sensors based on carbon nanotubes for the monitoring of chemicals in water—A review, Sensors, 2021, 22(1), 218 CrossRef.
- M. Al-saidi, R. J. A. Al-Bana, E. Hassan and B. A. L. Al-Rubaii, Extraction and characterization of nickel oxide nanoparticles from Hibiscus plant using green technology and study of its antibacterial activity, Biomedicine, 2022, 42(6), 1290–1295 CrossRef.
- M. Terlemezoglu, O. Surucu, M. Isik, N. M. Gasanly and M. Parlak, Temperature-dependent optical characteristics of sputtered NiO thin films, Appl. Phys. A:Mater. Sci. Process., 2022, 128(1), 50 CrossRef CAS.
- U. Holzwarth and N. Gibson, The Scherrer equation versus the'Debye-Scherrer equation', Nat. Nanotechnol., 2011, 6(9), 534 CrossRef CAS PubMed.
- H. Qiao, Z. Wei, H. Yang, L. Zhu and X. Yan, Preparation and characterization of NiO nanoparticles by anodic arc plasma method, J. Nanomater., 2009, 2009(1), 795928 CrossRef.
- S. Ghazal, A. Akbari, H. A. Hosseini, Z. Sabouri, F. Forouzanfar, M. Khatami and M. Darroudi, Sol-gel biosynthesis of nickel oxide nanoparticles using Cydonia oblonga extract and evaluation of their cytotoxicity and photocatalytic activities, J. Mol. Struct., 2020, 1217, 128378 CrossRef CAS.
- A. Rahdar, M. Aliahmad and Y. Azizi, NiO nanoparticles: synthesis and characterization, J. Nanostruct., 2015, 5, 145–151 Search PubMed.
- S. Mundinamani and M. Rabinal, Cyclic voltammetric studies on the role of electrode, electrode surface modification and electrolyte solution of an electrochemical cell, J. Appl. Chem., 2014, 7(9), 45–52 Search PubMed.
- F. Aslam, A. Shah, N. Ullah and S. Munir, Multiwalled carbon nanotube/Fe-doped ZnO-based sensors for droplet electrochemical detection and degradation monitoring of brilliant green, ACS Appl. Nano Mater., 2023, 6(7), 6172–6185 CrossRef CAS.
- M. U. Sadiq, A. Shah, J. Nisar and I. Shah, Photoelectrocatalytic Detection and Degradation Studies of a Hazardous Textile Dye Safranin T, Nanomaterials, 2023, 13(15), 2218 CrossRef CAS.
| This journal is © The Royal Society of Chemistry 2025 |

