 Open Access Article
Unveiling the structural aspects of novel azo-dyes with promising anti-virulence activity against MRSA: a deep dive into the spectroscopy via integrated experimental and computational approaches†
Ahmed M. Hegazy *ab,
Michael G. Shehatc,
Alaa. Abouelfetouhcd,
Mohamed Telebefg,
Sherine N. Khattab*a and
Nesreen S. Haibah
aChemistry Department, Faculty of Science, Alexandria University, Alexandria 21321, Egypt. E-mail: sherinekhattab@alexu.edu.eg; ahmed.hegazy@alexu.edu.eg
bDepartment of Materials Science, Institute of Graduate Studies and Research, Alexandria University, Alexandria, Egypt
cDepartment of Microbiology and Immunology, Faculty of Pharmacy, Alexandria University, 21521 Alexandria, Egypt
dDepartment of Microbiology and Immunology, Faculty of Pharmacy, Alamein International University, 51718 Alamein, Egypt
eDepartment of Pharmaceutical Chemistry, Faculty of Pharmacy, Alexandria University, 21521 Alexandria, Egypt
fCancer Nanotechnology Research Laboratory (CNRL), Faculty of Pharmacy, Alexandria University, 21521 Alexandria, Egypt
gDepartment of Medicinal Chemistry, Faculty of Pharmacy, Alamein International University (AIU), Alamein City 5060310, Egypt
hDepartment of Physics and Chemistry, Faculty of Education, Alexandria University, Egypt
First published on 20th January 2025
Abstract
A novel series of azo dyes was successfully synthesized by combining amino benzoic acid and amino phenol on the same molecular framework via azo linkage. The structural elucidation of these dyes was carried out using various spectroscopic techniques, including UV-vis, FT-IR, NMR spectroscopy, and HRMS. Surprisingly, the aromatic proton in some dyes exhibited exchangeability in D2O, prompting a 2D NMR analysis to confirm this phenomenon. Furthermore, comprehensive density functional theory (DFT) calculations were conducted to unravel synthetic dyes' geometrical and electronic properties. Meanwhile, the reactivity of various sites was further investigated through Frontier Molecular Orbitals (FMOs) analysis and molecular electrostatic potential mapping. Besides, the experimental NMR spectra were interpreted by incorporating theoretically computed NMR spectrum and reduced density gradient (RDG) function. These computations revealed a pronounced intramolecular hydrogen bond through O–H⋯N interaction that significantly influenced the proton chemical shift. The dyes were assessed for their antimicrobial activities using agar diffusion, micro broth dilution, and biofilm inhibition assays. Interestingly, one of the synthetic dyes showed promising antibacterial effects against S. aureus (ATCC-6538) as well as against a multidrug-resistant MRSA clinical isolate with a MIC (minimum inhibitory concentration) of 78.12 μg mL−1. Moreover, that dye inhibited biofilm formation of the strong biofilm former clinical MRSA isolate with a concentration as low as 0.25 MIC (19.53 μg mL−1). Indeed, our qPCR data suggest that inhibiting the SaeS/SaeR system is another potential mechanism by which D4 exerts its antibacterial and anti-virulence effects. Altogether, this shows these synthetic azo dyes' promising antibacterial and anti-virulence activities concerning MRSA clinical infections.
1 Introduction
The spread of antibiotic resistance has engendered profound public health concerns, leading to the WHO declaration of AMR as one of the top 10 global health threats, requiring immediate attention.1,2 Among the numerous multi-resistant microorganisms, methicillin-resistant Staphylococcus aureus (MRSA) has stood out as an exceptionally dangerous bacterium in recent decades, resulting in nosocomial infections, and community-acquired bacterial infections that can be life-threatening.3 This pathogenic ability of MRSA is mainly related to its resistance to antibiotics belonging to different classes and its carriage of multiple virulence determinants, allowing it to evade the immune defenses and counteract antimicrobial chemotherapy.4 Numerous researchers are orienting their research efforts toward improving innovative treatments for infectious diseases to address this point. Within this realm, azo dyes have garnered considerable attention as a class of chemical compounds with potential therapeutic applications against various diseases. Azo dyes are a well-established class of organic compounds encompassing the linkage of primary aromatic amine and activated coupler through chromophoric –N![[double bond, length as m-dash]](https://www.rsc.org/images/entities/char_e001.gif) N– bonds.5,6
N– bonds.5,6
An azo group's linkage of aromatic moieties causes an extended conjunction primarily responsible for dyes' color chemistry.7 Unexpectedly, azo dyes were discovered accidently when William Henry Perkin synthesized a purple dye known as mauveine in 1856.8–11 Subsequently, azo dyes were included in various applications, including chemical sensors,12 indicators,11 and printing inks.13 In addition to the primary application of azo dyes as a colorant, azo dyes were reported as potential bacteriostatic,14 fungicidal,15 anti-cancer agents,16 and carriers for drug delivery.17 Indeed, some dyes were utilized as innovative therapeutic agents.18 For instance, methylene blue has been utilized in treating methemoglobinemia and as a potential neuroprotective agent in Alzheimer's disease research.19
A further example is indocyanine green, a fluorescent dye employed in medical imaging to assess liver function and cardiac output.20 Another unique aspect is that some specific azo dyes have demonstrated excellence in photodynamic therapy by generating reactive oxygen species following light activation, destroying the cancer cells.21 Among all pharmacological applications, azo dyes exhibited outstanding antibacterial activity.6,22 Mechanistically, Gerhard Domagk concluded that the antimicrobial activity of prontosil (an amino sulphonamide azo dye) is mainly attributed to the toxic product generated after the reduction of the azo group.23 This reduction process can be accomplished by azoreductases in human and animal intestinal microbiota, yielding the corresponding aromatic amine.24 Alternatively, azo dyes can bind to several metal ions, forming complexes demonstrating antibacterial properties by inhibiting DNA replication through several pathways.25 Therefore, it is evident that the research focus revolves around the design and synthesis of novel azo dyes that possess exceptional antibacterial properties. More specifically, dyes that include a coupler with amino groups are anticipated to exhibit more activity than other dyes. Despite the publication of various research papers aimed at advancing the field of antibacterial activity of dyes, there are remaining gaps that need to be tackled in this area. Nevertheless, the synthesis of azo dyes can be a challenging process. The difficulty could be attributed to the potential occurrence of self-coupling,26 the generation of several products,27 and the specific requirements for preserving the diazonium salt stable during the entire reaction period.28,29 Furthermore, the spectroscopic characteristics of dyes are occasionally mysterious. This could be attributed to geometrical isomerization across the –N![[double bond, length as m-dash]](https://www.rsc.org/images/entities/char_e001.gif) N– bond and the great possibility of tautomerization.30–33
N– bond and the great possibility of tautomerization.30–33
At this stage, it is crucial to incorporate quantum chemical calculations for structural elucidation and theoretical spectra computations. With the development of quantum computing technologies, there is an excellent advancement in computational chemistry.34 Where accurate methods could lead to a substantial interpretation of chemical problems. Although several methods are used to predict the geometry of molecules and spectroscopic properties, density functional theory (DFT) remains superior to most other methods.35–38 Researchers often choose to use DFT as a calculation method due to the compensation between the precision of theoretical results and the processing time required.39–41
In this study, we designed a series of novel azo dyes derived from isomeric amino benzoic acid coupled with isomeric amino phenols in an acidic medium. All synthetic dyes were characterized by different spectroscopic techniques such as UV-vis, FT-IR, NMR spectroscopy and high-resolution mass spectra (HRMS). Additionally, comprehensive DFT calculations were conducted to reveal synthetic dyes' geometrical and electronic properties besides spectroscopic data interpretation. The experimental NMR spectra have been extensively interpreted by combining the computed NMR spectrum and the reduced density gradient (RDG) function to unravel the noncovalent interaction (NCI) contributing to the unique chemical shifts. Impressively, an aromatic proton in certain dyes was exchangeable in D2O. For these reasons, a 2D NMR experiment was conducted to verify the exchangeability of this aromatic proton.
Further relevant molecular characteristics, including Frontier Molecular Orbitals (FMOs) and molecular electrostatic potential maps (MEP), were also computed to elaborate structural reactivity. The dyes were assessed for their antimicrobial and anti-virulence activities against different Staphylococcus aureus strains. Considering the structural aspects of synthetic dyes, it can be regarded as a potent antibacterial agent.
2 Experimental and computational methods
All chemicals utilized in this research have been obtained from Alfa Aesar and used without additional processes. TLC analysis was conducted on Merck silica gel plates with aluminium backing. The appropriate solvent systems were used, and the spots were detected using a Spectroline UV lamp at either 254 or 365 nm.2.1. Measurements and instruments
The electronic (UV-vis) spectra were recorded in ethanol as a solvent on a Shimadzu double-beam UV-visible spectrophotometer (Model No. UV 1800). Fourier transform infrared spectra (FT-IR) were collected using Bruker Tensor 37 FT-IR spectrometer with KBr pellets in the 500–4000 cm−1 range. The NMR spectra for the synthetic dyes were obtained using a 500 MHz JEOL NMR spectrometer with deuterated DMSO-d6 as solvent. The chemical shift values δ are presented in parts per million (ppm), and the spectra were calibrated using residual solvent as an internal reference. Meanwhile, the coupling constant J values were reported in Hz. An LC/Q-TOF, 6350 (Agilent Technologies, Santa Clara, CA, USA) instrument was utilized to acquire the high-resolution mass spectral data using the electrospray ionization method. The melting points were determined through MEL-Temp II equipment with open capillaries without further correction.2.2. The general methodology for the synthesis of dyes D1–D4
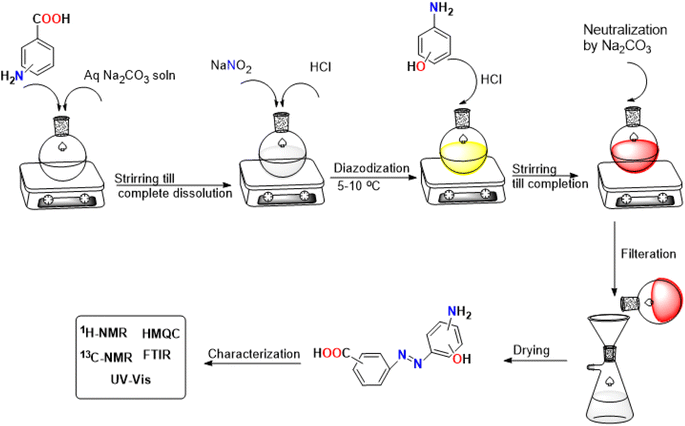
The dyes were synthesized by adjusting the molar ratio to match the reaction's stoichiometry.42 The synthesis started by introducing (2.00 g, 14.50 mmol) of isomeric amino benzoic acid in 10 mL of 0.729 M sodium carbonate solution; the solution was stirred until complete solubilization. The solution was cooled, and sodium nitrite (1.01 g, 14.50 mmol) was added. The diazotization process was initiated by the dropwise addition of 2 M HCl. Afterwards, the mixture was stirred in an ice bath for 2–3 hours and checked by TLC for the completion of diazotization. To start the coupling reaction, (1.58 g, 14.50 mmol) of isomeric amino phenol as an activated coupler was dissolved in 7.24 mL of 2 M HCl and added carefully to the diazonium salt solution over 1 hour. The solution was further stirred for 1–2 hours till the completion of the coupling reaction monitored by TLC. The solution was neutralized with sodium carbonate until the desired dyes were precipitated entirely. The precipitated dyes were filtered and washed several times with cold and hot water and dried under a vacuum to afford the pure desired product. A schematic diagram of the synthesis process is shown in Fig. 1.![[double bond, length as m-dash]](https://www.rsc.org/images/entities/char_e001.gif) O carboxylic acid), 1490 (N
O carboxylic acid), 1490 (N![[double bond, length as m-dash]](https://www.rsc.org/images/entities/char_e001.gif) N), cm−1; 1H-NMR (500 MHz: DMSO-d6): δ isomer I (80%): 5.44 (brs, 2H, NH2, D2O exchangeable), 6.15–6.22 (m, 1H, Ar–H), 6.60 (d, J = 10 Hz, 1H, 1Ar–H), 7.20–7.30 (m, 1H, 1Ar–H), 7.35–7.70 (m, 2H, 2Ar–H), 7.71 (d, J = 9.5 Hz, 1H, 1Ar–H), 7.81–7.87 (m, 1H, Ar–H), 8.94 (brs, 1H, COOH, D2O exchangeable), 14.43 (s, 1H, OH, D2O exchangeable). Isomer II (20%): 5.44 (brs, 2H, NH2, D2O exchangeable), 6.15–6.22 (m, 1H, Ar–H), 6.39 (d, J = 10 Hz, 1H, 1Ar–H), 7.20–7.30 (m, 1H, 1Ar–H), 7.35–7.70 (m, 2H, 2Ar–H), 7.78 (d, J = 9.5 Hz, 1H, 1Ar–H), 7.81–7.87 (m, 1H, Ar–H), 8.94 (brs, 1H, COOH, D2O exchangeable), 14.43 (s, 1H, OH, D2O exchangeable). 13C-NMR (125 MHz: DMSO-d6): δ 163.76, 161.39, 140.56, 138.27, 136.27, 136.92, 131.24, 130.85, 129.90, 127.81, 126.67, 116.32, 115.76, 98.73. Elemental analysis calculated for molecular formula C13H11N3O3: C, 60.70; H, 4.31; N, 16.33. Found: C, 60.97; H, 4.67; N, 16.05.
N), cm−1; 1H-NMR (500 MHz: DMSO-d6): δ isomer I (80%): 5.44 (brs, 2H, NH2, D2O exchangeable), 6.15–6.22 (m, 1H, Ar–H), 6.60 (d, J = 10 Hz, 1H, 1Ar–H), 7.20–7.30 (m, 1H, 1Ar–H), 7.35–7.70 (m, 2H, 2Ar–H), 7.71 (d, J = 9.5 Hz, 1H, 1Ar–H), 7.81–7.87 (m, 1H, Ar–H), 8.94 (brs, 1H, COOH, D2O exchangeable), 14.43 (s, 1H, OH, D2O exchangeable). Isomer II (20%): 5.44 (brs, 2H, NH2, D2O exchangeable), 6.15–6.22 (m, 1H, Ar–H), 6.39 (d, J = 10 Hz, 1H, 1Ar–H), 7.20–7.30 (m, 1H, 1Ar–H), 7.35–7.70 (m, 2H, 2Ar–H), 7.78 (d, J = 9.5 Hz, 1H, 1Ar–H), 7.81–7.87 (m, 1H, Ar–H), 8.94 (brs, 1H, COOH, D2O exchangeable), 14.43 (s, 1H, OH, D2O exchangeable). 13C-NMR (125 MHz: DMSO-d6): δ 163.76, 161.39, 140.56, 138.27, 136.27, 136.92, 131.24, 130.85, 129.90, 127.81, 126.67, 116.32, 115.76, 98.73. Elemental analysis calculated for molecular formula C13H11N3O3: C, 60.70; H, 4.31; N, 16.33. Found: C, 60.97; H, 4.67; N, 16.05.![[double bond, length as m-dash]](https://www.rsc.org/images/entities/char_e001.gif) O carboxylic acid), 1479 (N
O carboxylic acid), 1479 (N![[double bond, length as m-dash]](https://www.rsc.org/images/entities/char_e001.gif) N) cm−1; 1H-NMR (500 MHz: DMSO-d6): δ isomer I (87.13%): 5.95 (s, 1H, Ar–H), 6.31 (dd, J1 = 9 Hz, J2 = 1.8 Hz, 1H, Ar–H), 6.73 (brs, 2H, NH2, D2O exchangeable), 7.40 (d, J = 10 Hz, 1H, 1Ar–H), 7.53–7.57 (m, 1H, 1Ar–H), 7.86 (t, J = 8.6 Hz, 2H, 2Ar–H), 8.16 (s, 1H, 1Ar–H), 13.01 (brs, 1H, COOH, D2O exchangeable), 14.10 (s, 1H, OH, D2O exchangeable). Isomer II (12.87%): 6.15 (dd, 1H, Ar–H), 6.19 (s, 1H, Ar–H), 6.73 (brs, 2H, NH2, D2O exchangeable), 7.53–7.57 (m, 2H, 2Ar–H), 7.70 (d, J = 10 Hz, 1H, 1Ar–H), 7.92–7.98 (m, 2H, Ar–H), 8.24 (s, 1H, 1Ar–H), 13.01 (brs, 1H, COOH, D2O exchangeable), 14.10 (s, 1H, OH, D2O exchangeable). 13C-NMR (125 MHz: DMSO-d6): δ 167.64, 160.68, 156.57, 149.94, 134.22, 132.61, 131.45, 130.26, 128.85, 125.12, 120.37, 99.14. Elemental analysis calculated for molecular formula C13H11N3O3: C, 60.70; H, 4.31; N, 16.33. Found: C, 60.93; H, 4.66; N, 16.01.
N) cm−1; 1H-NMR (500 MHz: DMSO-d6): δ isomer I (87.13%): 5.95 (s, 1H, Ar–H), 6.31 (dd, J1 = 9 Hz, J2 = 1.8 Hz, 1H, Ar–H), 6.73 (brs, 2H, NH2, D2O exchangeable), 7.40 (d, J = 10 Hz, 1H, 1Ar–H), 7.53–7.57 (m, 1H, 1Ar–H), 7.86 (t, J = 8.6 Hz, 2H, 2Ar–H), 8.16 (s, 1H, 1Ar–H), 13.01 (brs, 1H, COOH, D2O exchangeable), 14.10 (s, 1H, OH, D2O exchangeable). Isomer II (12.87%): 6.15 (dd, 1H, Ar–H), 6.19 (s, 1H, Ar–H), 6.73 (brs, 2H, NH2, D2O exchangeable), 7.53–7.57 (m, 2H, 2Ar–H), 7.70 (d, J = 10 Hz, 1H, 1Ar–H), 7.92–7.98 (m, 2H, Ar–H), 8.24 (s, 1H, 1Ar–H), 13.01 (brs, 1H, COOH, D2O exchangeable), 14.10 (s, 1H, OH, D2O exchangeable). 13C-NMR (125 MHz: DMSO-d6): δ 167.64, 160.68, 156.57, 149.94, 134.22, 132.61, 131.45, 130.26, 128.85, 125.12, 120.37, 99.14. Elemental analysis calculated for molecular formula C13H11N3O3: C, 60.70; H, 4.31; N, 16.33. Found: C, 60.93; H, 4.66; N, 16.01.![[double bond, length as m-dash]](https://www.rsc.org/images/entities/char_e001.gif) O carboxylic acid), 1465 (N
O carboxylic acid), 1465 (N![[double bond, length as m-dash]](https://www.rsc.org/images/entities/char_e001.gif) N), cm−1, 1H-NMR (500 MHz: DMSO-d6): δ isomer I (80%): 5.96 (s, 1H, Ar–H), 6.41 (d, J = 11 Hz, 1H, 1Ar–H), 7.45 (brs, 2H, NH2, D2O exchangeable), 7.69 (d, J = 10 Hz, 2H, 2Ar–H), 7.94–8.09 (m, 3H, 3Ar–H), 10.77 (s, 1H, COOH, D2O exchangeable), 14.39 (s, 1H, OH, D2O exchangeable). Isomer II (20%): 6.20–6.24 (m, 1H, Ar–H), 6.59–6.70 (m, 1H, 1Ar–H), 7.45 (brs, 2H, NH2, D2O exchangeable), 7.56–7.63 (m, 2H, 2Ar–H), 7.83 (d, J = 10 Hz, 1H, 1Ar–H), 7.94–8.09 (m, 2H, 2Ar–H), 10.77 (s, 1H, COOH, D2O exchangeable), 14.39 (s, 1H, OH, D2O exchangeable). 13C-NMR (125 MHz: DMSO-d6): δ 167.53, 164.48, 132.03, 130.99, 128.83, 121.49, 118.92, 101.05, 99.02. Elemental analysis calculated for molecular formula C13H11N3O3: C, 60.70; H, 4.31; N, 16.33. Found: C, 60.88; H, 4.65; N, 16.12.
N), cm−1, 1H-NMR (500 MHz: DMSO-d6): δ isomer I (80%): 5.96 (s, 1H, Ar–H), 6.41 (d, J = 11 Hz, 1H, 1Ar–H), 7.45 (brs, 2H, NH2, D2O exchangeable), 7.69 (d, J = 10 Hz, 2H, 2Ar–H), 7.94–8.09 (m, 3H, 3Ar–H), 10.77 (s, 1H, COOH, D2O exchangeable), 14.39 (s, 1H, OH, D2O exchangeable). Isomer II (20%): 6.20–6.24 (m, 1H, Ar–H), 6.59–6.70 (m, 1H, 1Ar–H), 7.45 (brs, 2H, NH2, D2O exchangeable), 7.56–7.63 (m, 2H, 2Ar–H), 7.83 (d, J = 10 Hz, 1H, 1Ar–H), 7.94–8.09 (m, 2H, 2Ar–H), 10.77 (s, 1H, COOH, D2O exchangeable), 14.39 (s, 1H, OH, D2O exchangeable). 13C-NMR (125 MHz: DMSO-d6): δ 167.53, 164.48, 132.03, 130.99, 128.83, 121.49, 118.92, 101.05, 99.02. Elemental analysis calculated for molecular formula C13H11N3O3: C, 60.70; H, 4.31; N, 16.33. Found: C, 60.88; H, 4.65; N, 16.12.![[double bond, length as m-dash]](https://www.rsc.org/images/entities/char_e001.gif) O carboxylic acid), 1460 (N
O carboxylic acid), 1460 (N![[double bond, length as m-dash]](https://www.rsc.org/images/entities/char_e001.gif) N) cm−1; 1H-NMR (500 MHz: DMSO-d6): δ isomer I (60%): 6.72–6.76 (m, 1H, Ar–H), 7.03–7.09 (m, 1H, 1Ar–H), 7.15 (brs, 1H, Ar–H), 7.31–7.34 (m, 1H, Ar–H), 7.48–7.51 (m, 1H, Ar–H), 7.64–7.66 (m, 1H, Ar–H), 7.89–7.97 (m, 3H, 1Ar–H + NH2, D2O exchangeable), 8.21 (brs, 1H, Ar–H), 9.72 (s, 1H, COOH, D2O exchangeable), 12.54 (brs, 1H, OH, D2O exchangeable). Isomer II (40%): 6.68–6.70 (m, 1H, Ar–H), 7.03–7.09 (m, 2H, 2Ar–H), 7.28–7.29 (m, 1H, Ar–H), 7.58–7.61 (m, 1H, Ar–H), 7.70–7.71 (m, 1H, Ar–H), 7.89–7.97 (m, 2H, NH2, D2O exchangeable), 8.21 (brs, 1H, Ar–H), 9.72 (s, 1H, COOH, D2O exchangeable), 12.54 (brs, 1H, OH, D2O exchangeable). 13C-NMR (125 MHz: DMSO-d6): δ 168.45, 167.60, 153.05, 149.34, 144.76, 129.44, 121.93, 118.55, 114.99, 112.73, 104.06. Elemental analysis calculated for molecular formula C13H11N3O3: C, 60.70; H, 4.31; N, 16.33. Found: C, 60.88; H, 4.65; N, 16.12.
N) cm−1; 1H-NMR (500 MHz: DMSO-d6): δ isomer I (60%): 6.72–6.76 (m, 1H, Ar–H), 7.03–7.09 (m, 1H, 1Ar–H), 7.15 (brs, 1H, Ar–H), 7.31–7.34 (m, 1H, Ar–H), 7.48–7.51 (m, 1H, Ar–H), 7.64–7.66 (m, 1H, Ar–H), 7.89–7.97 (m, 3H, 1Ar–H + NH2, D2O exchangeable), 8.21 (brs, 1H, Ar–H), 9.72 (s, 1H, COOH, D2O exchangeable), 12.54 (brs, 1H, OH, D2O exchangeable). Isomer II (40%): 6.68–6.70 (m, 1H, Ar–H), 7.03–7.09 (m, 2H, 2Ar–H), 7.28–7.29 (m, 1H, Ar–H), 7.58–7.61 (m, 1H, Ar–H), 7.70–7.71 (m, 1H, Ar–H), 7.89–7.97 (m, 2H, NH2, D2O exchangeable), 8.21 (brs, 1H, Ar–H), 9.72 (s, 1H, COOH, D2O exchangeable), 12.54 (brs, 1H, OH, D2O exchangeable). 13C-NMR (125 MHz: DMSO-d6): δ 168.45, 167.60, 153.05, 149.34, 144.76, 129.44, 121.93, 118.55, 114.99, 112.73, 104.06. Elemental analysis calculated for molecular formula C13H11N3O3: C, 60.70; H, 4.31; N, 16.33. Found: C, 60.88; H, 4.65; N, 16.12.2.3. Computational methods
All quantum chemical calculations performed during this study were done through Gaussian 09 software along with Gauss View 5.0.43 The DFT method was selected for all computations, employing the Becke 3–Lee–Yang–Parr (B3LYP) functional in conjunction with standard 6-311++G(d,p) basis sets.44,45 All calculations started by optimizing the geometry of the synthetic dyes; subsequently, vibrational frequency calculations were performed to confirm that the optimized geometries were global minima at the potential energy surface. Further optimization in DMSO solvent was performed using the Conductor-like Polarizable Continuum model (CPCM) to model the solvent effect.46 Besides, the nuclear shielding constant was computed based on the GIAO method, from which the theoretical chemical shifts were computed.47 We used Vesta software, Gauss View 5.0, and ChemCraft 1.8 to visualize frontier molecular orbitals, MEP, and optimized geometries, respectively.48–50 Different NCI within the molecule were elucidated through the RDG function through Multiwfn and Visual Molecular Dynamics (VMD) software.51,522.4. Assessment of the antimicrobial activity of the different dyes
| Primer | Sequence |
|---|---|
| SaeR_F | GTCGTAACCATTAACTTCTG |
| SaeR_R | ATCGTGGATGATGAACAA |
| SaeS_F | TGTATTTAAAGTGATAATATGAGTC |
| SaeS_R | CTTAGCCCATGATTTAAAAACACC |
| Gyr_F | CCAGGTAAATTAGCCGATTGC |
| Gyr_R | AAATCGCCTGCGTTCTAGAG |
3 Results and discussion
3.1. Synthesis and structural perspectives
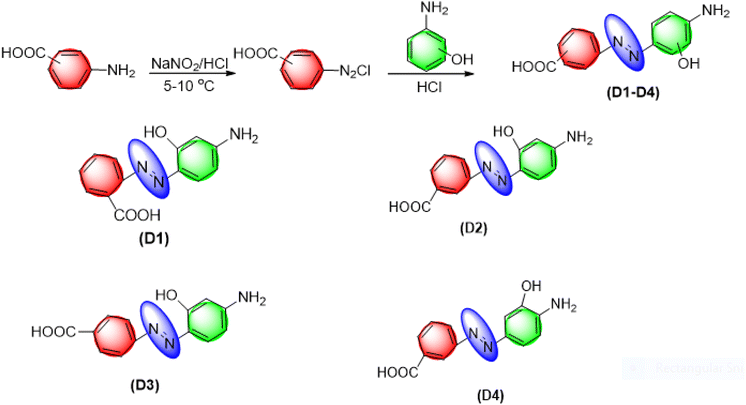
Dyes D1–D4 were synthesized through diazotization of amino benzoic acid isomers, followed by coupling with isomeric amino phenols (Scheme 1). Since diazonium salts may undergo coupling reactions in both acidic and basic conditions, we conducted the coupling process in an acidic medium. Indeed, the selection of an acidic medium in our work is attributed to the fact that coupling with amino phenols in the basic medium can lead to numerous coupling products, which decrease the yield and purity of the targeted product.After the completion of the reactions, dyes D1–D4 were subjected to various spectroscopic techniques, including UV-vis, FT-IR, (1H and 13C) NMR spectroscopy, and HRMS to confirm their structures. Further characterization by Heteronuclear Multiple Quantum Coherence (HMQC) was selectively performed for dye D2 as a representative structure for dyes to unravel 1-bond coupling. Another structural aspect of dyes is their geometrical structure. Since dyes can exist in either the syn form or the anti-one, the designation of the geometrical structure of dyes is a must. A key factor for the designation of geometrical forms is the thermodynamic stability of various geometrical isomers. It is reported that most dyes are thermodynamically more stable when they exist in the anti-form.59 This might be caused by the decreased electrostatic repulsive forces between the coupler structure and the amine.60 For these reasons, all computational calculations were performed for the anti-form of the dyes. Alternatively, some dyes in our work exist in both geometrical forms, confirmed by a relative comparison of the integration in 1H-NMR spectroscopy.
3.2. Vibrational spectroscopy analysis
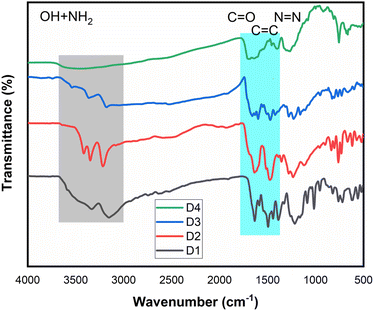
Vibrational spectroscopy is crucial in characterizing organic molecules, particularly in identifying their functional groups. Fig. 2 presents the stacked FT-IR spectra of synthetic dyes D1–D4, revealing several critical observations. Initially, all dyes exhibit a broad band in the 2741–3710 cm−1 range and a sharp peak around 3000 cm−1. These overlapping bands correspond to hydroxyl groups and the characteristic aromatic C–H vibrational band. Although amino groups typically display two distinct stretching vibrational bands centered at approximately 3100 and 3300 cm−1, these modes are not always detectable in the synthetic dyes under study. This is likely due to the broadness of the hydroxyl group bands, which obscure the amino group vibrational modes.Furthermore, all dyes show three other fundamental vibrational modes around 1680–1711, 1600, and 1460–1490 cm−1, consistent with the expected structural features of these synthetic dyes. A detailed analysis reveals that the 1680–1711 cm−1 peak is associated with the carbonyl group of carboxylic acid functionalities. The peak around 1600 cm−1 is likely due to the stretching vibration of C![[double bond, length as m-dash]](https://www.rsc.org/images/entities/char_e001.gif) C within the aromatic rings of the amine or the coupler. Finally, the peak near 1460 cm−1 indicates the presence of an azo group, confirming the linkage between the amine and the coupler structure.61
C within the aromatic rings of the amine or the coupler. Finally, the peak near 1460 cm−1 indicates the presence of an azo group, confirming the linkage between the amine and the coupler structure.61
3.3. UV-vis analysis
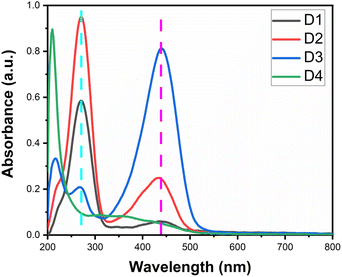
UV-visible spectroscopy is an invaluable technique for elucidating electronic transitions within organic dyes, providing critical insights into their photophysical properties. The UV-vis spectra for synthesized dyes D1–D4 are shown in Fig. 3. Accordingly, various insightful conclusions can be formulated. Concerning dyes D1–D3 derived from m-amino phenol, they exhibit two characteristic bands centered at 270 nm and 430–440 nm. The constancy of spectral band positions for these dyes implies that shifting of carboxylic acid substituent has a minor impact on the light absorption properties of dyes D1–D3. A careful examination of the origin of these two bands leads to assigning the electronic transitions responsible for these spectral bands. The band located around 270 nm is predominantly attributed to π–π* transition, while the band situated in the 430–440 nm region is associated with n–π* transition.In comparison, dye D4 derived from o-amino phenol demonstrated two unique bands at 210 and 350 nm originating from π–π* and n–π* transitions, respectively. A particularly meaningful research question explores how altering the position of the hydroxyl group within the coupler structure influences the electronic spectra, specifically of D2 and D4. Notably, there is a significant hypsochromic shift for dye D4. This positioning of the hydroxyl group relative to the amino group mainly causes this decrease. One potential explanation of this phenomenon is that the existence of the hydroxyl group in the ortho position relative to the amino group hinders the capability of an amino group to contribute to the conjugation; hence, λmax decreases. This observation aligns perfectly with the ortho effect observed frequently in aromatic compounds where the ortho substituent causes a considerable decline in λmax when compared to other positions.31,62
3.4. NMR interpretation
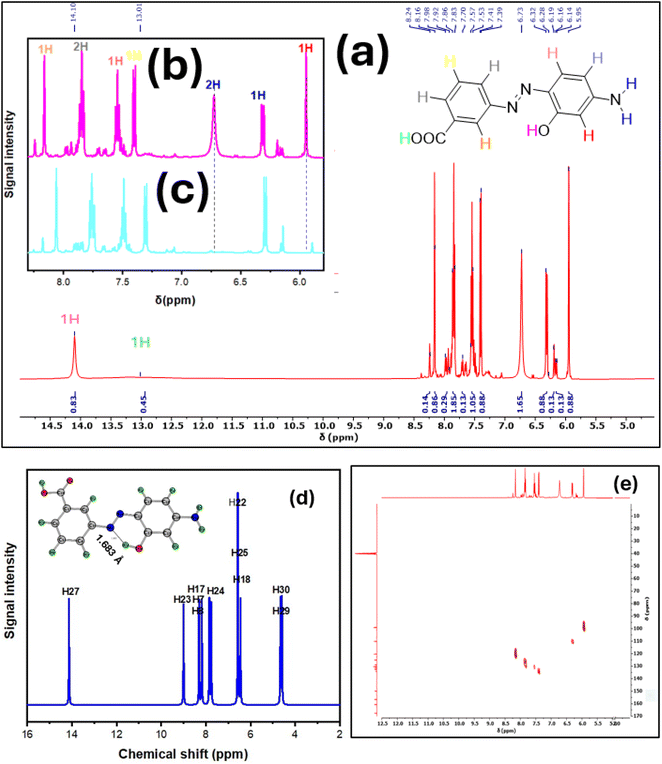
NMR spectroscopy is the most effective spectroscopic technique for identifying the chemical structure of synthesized organic compounds. The NMR spectra of dyes D1–D4 are shown in the ESI.† While NMR spectra of dye D2 are shown in Fig. 4 as operational spectra for illustration. The interpretation begins by focusing on the most deshielded protons, typically those of the carboxyl group within the amine structure and the hydroxyl group within the coupler structure. The hydroxyl group within the coupler structure for dyes D1–D3 was observed at 14.10–14.43 ppm. The intramolecular hydrogen bonding between the proton of the hydroxyl group and the nitrogen of the azo functional group mainly drives this substantial downfield effect.To further confirm this hypothesis, we computed the theoretical chemical shifts for dye D2 based on the same basis set and method pertained in all calculations but in DMSO solvent. The computed spectrum is shown in Fig. 4d. Remarkably, the hydroxyl proton was the most deshielded proton, with a computed chemical shift of 14.12 ppm. Along with this, the computed bond length for O–H⋯N was found to be 1.683 Å, a typical value for stable intramolecular hydrogen bonds. These results were in excellent agreement with the experimental findings.
Moreover, we performed the NMR analysis with the inclusion of deuterium oxide (D2O), and the resulting spectrum is shown in Fig. 4c. Significantly, the peak has disappeared, indicating that this proton is exchangeable and attached to the heteroatom. These results match those observed in earlier studies for o-hydroxy azo compounds.63–66
Compared to dye D4, the hydroxyl group proton was observed at 9.72 ppm. This significant difference in the chemical shift is ascribed to the positioning of the hydroxyl group. In the case of dye D4, the hydroxyl group is far away from the azo group, and there is no chance of intramolecular hydrogen bond formation with the azo group. Another highly deshielded proton is the carboxylic group proton, which appeared for most of the dyes as a broad peak around 8.94–13.01 ppm and wholly disappeared in the presence of D2O. The amino group protons were observed in the 5.44–7.97 ppm range for dyes D1–D4. Also, these peaks vanished in D2O.
Unique results were obtained regarding the analysis of aromatic protons region. First of all, the relative comparison of Z![[thin space (1/6-em)]](https://www.rsc.org/images/entities/char_2009.gif) :
:![[thin space (1/6-em)]](https://www.rsc.org/images/entities/char_2009.gif) E isomers percent was calculated from the integration values. The aromatic protons were observed within the 5.95–8.21 ppm chemical shift range. We will interpret the spectra of D2 as a representative example. The most shielded aromatic proton was the one adjacent to the amino and hydroxyl groups, which appeared as a singlet peak at 5.95 ppm. This might be explained by the strong electron-donating capability of these groups, which leads to an increase in electron density in the surrounding region and a decline in the chemical shift.
E isomers percent was calculated from the integration values. The aromatic protons were observed within the 5.95–8.21 ppm chemical shift range. We will interpret the spectra of D2 as a representative example. The most shielded aromatic proton was the one adjacent to the amino and hydroxyl groups, which appeared as a singlet peak at 5.95 ppm. This might be explained by the strong electron-donating capability of these groups, which leads to an increase in electron density in the surrounding region and a decline in the chemical shift.
On the contrary, the most deshielded aromatic proton was the one situated ortho to the azo and carboxylic acid groups. This proton experiences a singlet peak at 8.10–8.20 ppm. This increase in chemical shift is allocated to the electron-withdrawing effect of the neighbouring functional groups, which renders the adjacent proton in deshielded regions; thus, the chemical shift increases. Concurrently, a triplet peak is observed at 7.80–7.90 ppm, probably attributed to the two protons ortho to the carboxylic acid group and the azo group separately. The last three protons were observed at 7.50–7.60, 7.40, and 6.30 ppm. The proton observed at 7.50–7.60 is assigned to be the one ortho to the azo group within the coupler structure. On the other hand, the proton observed at 6.30 ppm is expected to be the one ortho to the amino group only. Finally, the remaining proton is the meta to the azo and carboxylic groups.
A highly debated research question emerges from the experimental spectra depicted in Fig. 4a–c. It is evident that in the presence of D2O, the peak intensity at 5.95 ppm significantly decreases. This observation warrants further investigation since this peak corresponds to an aromatic proton. To interpret this unexpected phenomenon, we must employ additional spectroscopic techniques to elucidate the one-bond C–H correlation. Using these spectroscopic data, we can determine whether this exchangeable proton is bonded to carbon or not.
One of the well-established methods for examining proton-carbon coupling and correlations is 2D-NMR spectroscopy, specifically Heteronuclear Multiple Quantum Coherence (HMQC). For our study, we performed an HMQC spectrum for compound D2, as shown in Fig. 4e. Notably, we observed a correlation between the peak at 5.95 ppm in the 1H-NMR and the peak at 98.96 ppm in the 13C-NMR.
These findings confirm that the aromatic proton in question is exchangeable in D2O. The exchangeability of aromatic protons has been previously discussed in the literature, marking a significant advancement in kinetics and reaction mechanism investigations.69–71
3.5. HRMS analysis
The high-resolution mass spectrum stands as a cornerstone technique for precisely determining the molecular weights of organic compounds. The mass spectral data for dyes D1–D4 were presented in the ESI.† Despite their similar molecular weights, the fragmentation patterns of these dyes tell a tale of divergence. For dyes D2–D4, the expected dominant peak emerges at [M + 1]+˙ = 258.087 (Fig. S8, S12, and S16 (ESI)†), a predictable outcome that aligns with theoretical predictions. However, then comes dye D1 (Fig. S4†), which has a mass spectrum that requires further understanding. Instead of following the anticipated path, for dye D1 exhibits its most intense peak at a substantially higher m/z value. One plausible explanation is the formation of adducts, where a stable intermediate interacts with other species, giving rise to unexpected products.67This hypothesis supports the unique structural features of dye D1. Here, the carboxyl and hydroxy groups are positioned ortho to the azo group, setting the stage for fascinating chemical dynamics. Literature suggests that ortho-substituted benzoic acid derivatives, under specific conditions, can undergo cleavage to form a ketene intermediate.68 This reactive species could further interact with the dye, culminating in the observed increase of the molecular ion peak.
3.6. FMOs analysis
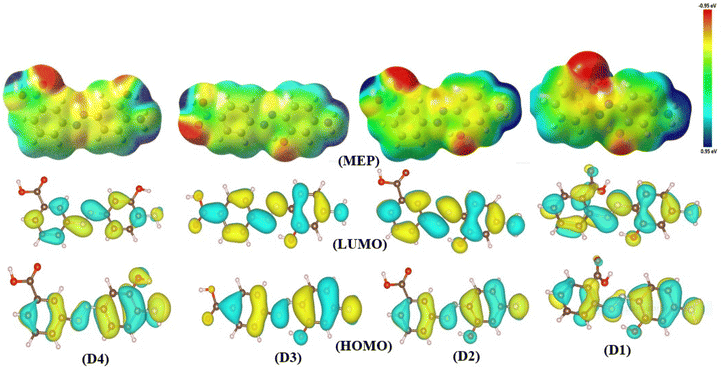
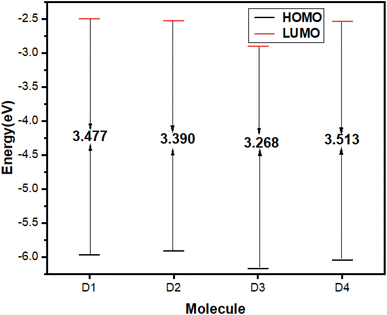
Despite the continuous advancements in computing molecular reactivity descriptors, the Frontiers Molecular Orbitals (FMOs) stand out as one of the most crucial reactivity descriptors.72 FMOs primarily identify two distinct orbitals: the highest occupied molecular orbital (HOMO), which is strongly localized to moieties within the molecule that acts as electron donors. Nevertheless, the lowest unoccupied molecular orbital (LUMO) is vital in deciding the regions within the molecule that can act as an electron acceptor. The energy gap between HOMO and LUMO is a distinctive reactivity descriptor that gives pivotal information about a molecule's stability and biological activity.73Fig. 5 provides essential information about the moieties within the synthetic dyes responsible for charge donation and acceptance. The charge distribution density in HOMO is predominantly a π character localized over the aromatic rings, azo group, and a considerable contribution from heteroatoms at the coupler ring. Meanwhile, the carboxyl group has a minor contribution to HOMO, which completely disappears in dyes D2 and D4. A closer inspection of the energy values of HOMO for the newly synthesized dyes leads to the conclusion that D2 has the most pronounced potential as a donor structure. This is evident from its HOMO energy, which is typically −5.915 eV. However, the dye with the minor capability for charge donation is D3, with a typical value for EHOMO = −6.168 eV.
Another significant aspect of reactivity is examining the charge distribution density within the LUMO. A comprehensive interpretation of charge distribution density from Fig. 5 shows that the LUMO is somehow distributed over the entire molecule, primarily exhibiting a π* character. The energy values analysis also demonstrated that the dye with the highest electrophilic character is D3, with a typical energy for LUMO equal to −2.900 eV. Conversely, dye D4 experienced the lowest reactivity towards being a charge acceptor with a typical value for energy of the LUMO = −2.538 eV.
Having discussed the FMOs analysis, it is crucial to analyze the energy gap data, which provides a comprehensive basis for comparing the reactivity of different dyes. The energy gap plots for dyes are shown in Fig. 6. Among these dyes, the dye with the highest susceptibility towards the excitation of charges from HOMO to LUMO is D3, with a typical energy gap value of 3.268 eV. Nonetheless, dye D4 exhibits remarkable stability with a typical energy gap of 3.513 eV.
3.7. MEP analysis
The molecular electrostatic potential is a distinctive function that reveals the molecular regions prone to electrophilic and nucleophilic attacks. MEP values are visualized through color-coded plots that indicate these reactive areas. The MEP color codes encompass a spectrum, where red denotes regions with the most considerable negative potential, identifying nucleophilic sites. In contrast, blue areas exhibit the highest electrophilicity, and green regions are neutral. It's important to note that reduced color intensity signifies weaker interactions. These plots are vital for understanding biological reactivity and molecular recognition.74Fig. 5 displays the MEP maps for the newly synthesized dyes. These results show that the red regions correspond to areas near the most electronegative atom, typically oxygen. The intense red color shifts across the iso-density surface, particularly near the hydroxyl and carboxylate groups on the aromatic rings. Additionally, regions around the azo group, the nitrogen of the amino group, and the aromatic ring cores are highlighted in yellow. This yellow color results from stabilizing the test-positive charge by the electrostatic attraction with nearby electrons. A much-interesting question is the existence of yellow color within the aromatic moieties, which could be ascribed to the existence of π electronic density. Due to their electrophilic nature, the hydrogen atoms attached to the aromatic ring and amino group are the most blue-colored regions within the MEP maps.
3.8. Global reactivity descriptors analysis
The effect of positioning the functional group in either the aromatic amine or the coupler moiety on reactivity is computed and presented in Table 2. These parameters include the absolute electronegativity (χ), hardness (η), softness (σ), chemical potential (μ), dipole moment (μo), and polarizability 〈α〉, which were calculated according to the reported equations.75 Notably, the positions of substituents strongly influence the quantum chemical descriptors. For instance, the computed dipole moment is an essential electronic descriptor closely related to electronic charges. The dipole moment values for dyes D1, D2, D3, and D4 are 3.563, 2.804, 6.088, and 4.187 debye, respectively. As a result, the order of polarity is D3 > D4 > D1 > D2. Relatively, the most polar compounds are those where the charge orientations are opposite, such as in the case of D3, and the dye D4 in which two functional groups within the coupler structure are positioned closest to each other. In contrast, the dye with the lowest dipole moment is D2, where the substituents are far away from each other, resulting in a decreased dipole moment. Through all studied dyes, the dipole moment vector is oriented towards the amino phenol moiety, indicating the impact of the substituent at the amino phenol scaffold on the polarity of the molecules.| Molecular descriptor | (D1) | (D2) | (D3) | (D4) |
|---|---|---|---|---|
| EHOMO (eV) | −5.972 | −5.915 | −6.168 | −6.051 |
| ELUMO (eV) | −2.495 | −2.525 | −2.900 | −2.538 |
| η (eV) | 1.738 | 1.695 | 1.634 | 1.756 |
| σ (eV)−1 | 0.575 | 0.589 | 0.611 | 0.569 |
| χ (eV) | 4.233 | 4.220 | 4.534 | 4.294 |
| μ (eV) | −4.233 | −4.220 | −4.534 | −4.294 |
| μo (D) | 3.563 | 2.804 | 6.088 | 4.187 |
| 〈α〉 (au) | 232.376 | 240.241 | 255.520 | 230.103 |
Further, the computed chemical potential for dyes D1–D4 is negative, indicating the stability of the investigated systems. Overall, these results showcase the effectiveness of computational chemistry methods in describing molecular and electronic interactions.
3.9. RDG analysis
The RDG function is one of the most successful functions to unravel different Interactions within the molecule. The distinctive aspect of the RDG function is its ability to be graphically translated over a molecule, displaying various attractions or repulsions using particular color codes. Hydrogen bonding, a kind of attractive force, is shown by the blue color. Meanwhile, the steric repulsion is represented by red, whereas green denotes van der Waals interactions.76Fig. S17† displays the RDG plots for the D2 and D4 compounds. An in-depth analysis of the RDG plot for the D2 compound would provide essential insights into the impact of intermolecular forces on experimental spectra. The RDG plot shows an intense blue color between the hydroxyl group's hydrogen atom and the azo group. This could be closely linked to the experimental 1H-NMR spectrum of D2, where the origin of the most deshielded proton at 14.10 ppm is attributed to intramolecular hydrogen bonding. This conclusion aligns with the experimental finding and could be treated as evidence for the significant impact of this intramolecular hydrogen bond interaction on the chemical shift.
The comparison of RDG for D4 and D2 reveals that hydrogen bonding is absent in D2. Consequently, the hydroxyl proton in dye D4 is observed within the expected range for the aromatic hydroxyl group at 9.72 ppm. Additionally, both compounds exhibited steric repulsion within the aromatic moiety as a result of π electron density. Thus, it has been demonstrated that integrating RDG analysis with computed NMR spectra is essential for comprehensively interpreting the experimental NMR spectra.
3.10. Assessment of microbiological activity of the different azo dyes and structure–activity relationships
The antibacterial activity of the synthesized dyes D1–D4 was assessed by determining the MIC against S. aureus (ATCC 6538) and another multi-drug-resistant MRSA clinical isolate. As shown in Table 3, D4 showed the lowest MIC value when tested against the S. aureus ATCC 6538.| Dye | Staphylococcus aureus ATCC 6538 | MRSA clinical isolate | |||
|---|---|---|---|---|---|
| D1 | D2 | D3 | D4 | D4 | |
| MIC (μg mL−1) | 625 | 312.5 | 312.5 | 78.125 | 78.125 |
| MBC (μg mL−1) | >1250 | >1250 | >1250 | 625 | 625 |
Investigation of the relationship between the structural characteristics of D1–D4 and their antibacterial activities revealed that the substitution pattern of the phenolic hydroxyl group is critical. As observed, 3-((4-amino-3-hydroxyphenyl)diazenyl)benzoic acid (D4) showed superior antibacterial activity relative to the 2-hydroxy analogs D1–D3. Nevertheless, the proximity of the carboxylic acid group to the diazo group contributed to the antibacterial potency. In this regard, the 2-benzoic acid derivative D1 showed the lowest activity among the series, whereas shifting the carboxylic group one carbon (D2 and D4) or two carbons (D3) away from the diazo group in D1 conferred higher activities to the scaffold. In summary, the optimum activity was observed when conserving the phenolic and carboxylic groups at position 3 i.e. 2 carbons away from the diazo group in the D4 derivative.
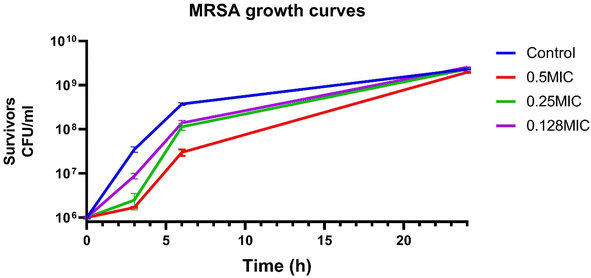
Being the most active dye, the antibacterial activity of D4 was further investigated. It showed good antibacterial activity against multidrug-resistant MRSA isolate at the same MIC seen with the standard strain (MIC = 78 μg mL−1). That is similar to other studies that used chemically relevant dyes that showed antibacterial activity with comparable MIC towards Staphylococcus aureus.77 All dyes were found to be bacteriostatic as evidenced from MBC values against S. aureus ATCC 6538 and the clinical MRSA isolate (Table 3). To assess the effect of D4 on different stages of bacterial growth, the tested MRSA clinical isolate was grown in the presence or absence of different sub-inhibitory concentrations of D4. The number of survivors was determined at various time points, and bacterial growth curves were constructed for each tested concentration. D4 at 0.25 and 0.5× MIC hindered the isolate's growth to approximately one log, relative to the untreated control, at 3 hours. This effect was maintained in the case of 0.5× MIC at 6 hours; however, regrowth occurred at the 24 hour time point (Fig. 7).
3.11. Biofilm inhibition capability of D4
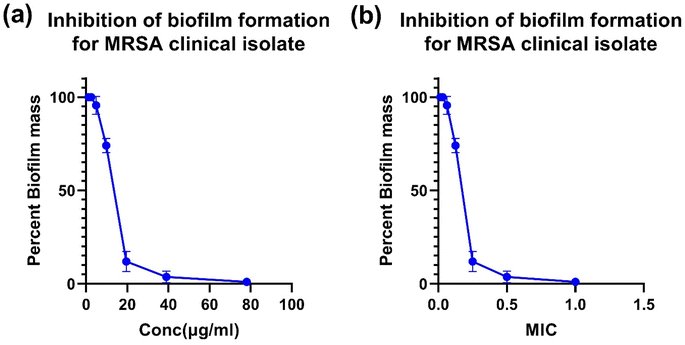
A biofilm inhibition assay was done to study the ability of D4, the most active dye in terms of MIC, to prevent biofilm formation. Biofilm formation is a virulence factor contributing to S. aureus pathogenicity, leading to severe and chronic diseases.78 Biofilm formation allows the bacterium to attach and adhere to different host tissues as well as on different implanted devices or catheter tubing. This process increases S. aureus virulence and resistance to antimicrobial treatment.79,80 We tested the ability of D4 to inhibit biofilm formation of the MRSA clinical isolate by incubating the bacterium with different concentrations of D4 while allowing MRSA to adhere on a plastic 96 well plate. As shown in Fig. 8, D4 was able to inhibit biofilm formation of the tested MRSA clinical isolate, which is a strong biofilm former: at a concentration of 39 μg mL−1 (equivalent to 0.5× MIC), D4 was able to inhibit primarily any biofilm formation (inhibition of 97% of biofilm formation). Interestingly, even at a lower concentration equivalent to 0.25 MIC (19.5 μg mL−1), around 89% of biofilm formation was inhibited. That demonstrates the anti-virulence activity of D4 above-demonstrated. More importantly, the anti-virulence activity of D4 can be used at sub-MIC concentrations, which may limit the development of resistance. Amengor et al. described a 57% inhibition of biofilm formation by S. aureus at 125 μg mL−1.81 Mini et al. reported the antibiofilm potential of carmoisine azo dye against Pseudomonas aeruginosa, presumably due to inhibition of quorum sensing.823.12. D4 inhibits the SaeR/S two-component regulatory system in MRSA
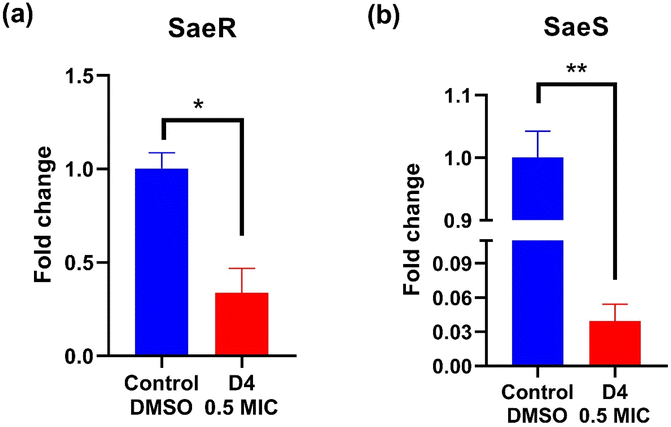
qRT-PCR was used to evaluate the effect of D4 on the expression and regulation of the MRSA clinical isolate's SaeR, SaeS two-component system. SaeR/S is a regulatory system that consists of: SaeS, which is a sensor histidine kinase and SaeR, which is a response regulator. The biological importance of this two-component system is that it controls the expression of several essential virulence factors of S. aureus, such as alpha-hemolysin (Hla), leukocidins, and other virulence factors which are crucial for the bacterium's pathogenicity and ability to evade the immune response. Moreover, by modulating the expression of these virulence factors, the SaeR/S system helps S. aureus survival and its ability to promote infection by allowing the bacteria to adapt to different environmental conditions outside and within the host.83,84 Besides, the Sae system has been known to affect biofilm formation positively or negatively depending on the strain and the environment.85 Inhibiting the SaeR/S can be a plausible way to reduce S. aureus virulence. It is one of the new potential targets for novel therapeutics alone or in combination with known antibacterial agents. To provide mechanistic insights into the mechanism of D4 antibacterial and D4 antibacterial and anti-virulence activities, MRSA bacterial cultures were allowed to grow in the absence or presence of D4 at its 0.5× MIC value for 24 hours. D4 significantly reduced SaeR expression by about 2 fold as compared to the untreated control (Fig. 9). Interestingly, D4 also significantly decreased the expression of SaeS by about 30 fold (0.03 fold change compared to normalized untreated control) (Fig. 9). These qPCR data suggest that inhibiting the SaeS/SaeR system is another potential mechanism by which D4 exerts its antibacterial and anti-virulence effects. In a previous study, phenazopyridine hydrochloride inhibited SaeS kinase activity, ultimately decreasing the expression of toxic shock syndrome toxin (TSST-1) and reducing the virulence of S. aureus.863.13. Stability of dye D4 in biological medium
The stability of dye D4 in PBS has been assessed through UV-vis measurements, which is an established technique for evaluating organic compound stability in biological media.87 The UV-vis spectra for the MIC of the dye before and after incubation in PBS solution at 37 °C for 24 hours were illustrated in Fig. S18 (ESI).† The UV-vis spectra showed no significant changes in absorption band position, indicating that dye D4 remained chemically stable and retained its structural integrity under these conditions. Therefore, the most potent dye is confirmed to be stable in biological medium.4 Conclusion
The present study set out to design novel synthetic azo dyes derived from isomeric amino benzoic acid as potent antibacterial agents, advancing the clinical research field. This is further integrated with diverse experimental spectroscopic techniques such as UV-vis, FTIR, NMR spectroscopy, and HRMS integrated with comprehensive DFT calculations. A summary of the essential outcomes is as follows:• Generally, the dyes were synthesized with an excellent yield, with the minimal use of hazardous organic solvents to comply with the sustainable development goals (SDGs).
• The experimental UV-vis spectra have been assigned to the corresponding transitions, elucidating the crucial influence of substituents on the photochromic properties of the dyes.
• The experimental NMR spectrum agrees with the computed one, confirming the appropriateness of the method and basis sets used for these calculations.
• Further interpretation for experimental NMR was performed by computing RDG functions. In sum, the RDG confirms strong intramolecular hydrogen bond through O–H⋯N interaction for dyes derived from m-amino phenol.
• A key strength of the present study was the proof of the exchangeability of aromatic proton within certain dyes through the utilization of HMQC to elucidate one bond coupling.
• Accurate DFT computations were conducted to find the optimal geometry of the dyes. Subsequently, global reactivity descriptors were calculated and discussed.
• The tendency of different moieties for charge donation or acceptance was designated through visualized FMOs. Meanwhile, the reactivity of atomic sites for electrophilic and nucleophilic attacks was assigned based on MEP map analyses.
• The dyes showed antibacterial activity towards the Staphylococcus aureus standard strain and, more importantly, against clinically isolated multidrug-resistant MRSA strain.
• One promising synthesized dye (D4) showed good antibiofilm activity against the tested MRSA strong biofilm former MRSA strain with about 89% biofilm inhibition with concentrations down to 0.25 MIC.
• D4 demonstrated potential anti-virulence activity by strongly inhibiting the SaeS/SaeR two-component system, a key regulator of various bacterial-associated virulence factors.
• D4 is a promising antibacterial dye with both antibacterial and anti-virulence properties. Its anti-virulence activity, observed at concentrations lower than its MIC, could significantly help in decreasing its resistance in bacterial systems. This makes D4 a valuable candidate for use in clinical settings to combat multi-drug-resistant MRSA.
• Future studies should explore the potential of these dyes to be used as indicators, given their acid/base sensitivity.
Data availability
The data supporting this article have been included as part of the ESI.†Author contributions
Ahmed M. Hegazy: conceptualization, investigation, data curation, formal analysis, visualization, writing – original draft. Michael G. Shehat: investigation, data curation, methodology, formal analysis, writing – review & editing. Alaa Abouelfetouh: funding acquisition, validation, resources, writing – review & editing. Mohamed Teleb: writing – review & editing. Sherine N. Khattab: project administration, conceptualization, methodology, resources, writing – review & editing. Nesreen S. Haiba: formal analysis, validation, writing – review & editing.Conflicts of interest
The authors declare that they have no known competing financial interests or personal relationships that could have appeared to influence the work reported in this paper.Acknowledgements
This study was partly supported by the German Research Council (DFG) through grant ZI665/3-2 to Dr Alaa Abouelfetouh. Additionally, the work received financial support from ICGEB and COMSTECH (Committee on Scientific and Technological Cooperation of the Organization of Islamic Cooperation), project no. CRP/EGY23-01. We express our sincere appreciation to the Royal Society of Chemistry (RSC) who provided chemist Ahmed M. Hegazy with an invaluable Researcher Development and Travel Grant (ID: D23-8142936090).References
- S. De Backer, J. Sabirova, I. De Pauw, H. De Greve, J.-P. Hernalsteens, H. Goossens and S. Malhotra-Kumar, Microorganisms, 2018, 6, 113 CrossRef CAS.
- A. Kaushik, H. Kest, M. Sood, B. W. Steussy, C. Thieman and S. Gupta, Pathogens, 2024, 13, 76 CrossRef CAS PubMed.
- M. Alseqely, M. Newton-Foot, A. Khalil, M. El-Nakeeb, A. Whitelaw and A. Abouelfetouh, Sci. Rep., 2021, 11, 4253 CrossRef CAS.
- B. A. Alghamdi, I. Al-Johani, J. M. Al-Shamrani, H. M. Alshamrani, B. G. Al-Otaibi, K. Almazmomi and N. Y. Yusof, Saudi J. Biol. Sci., 2023, 30, 103604 CrossRef PubMed.
- A. R. Guerroudj, E. U. Mughal, N. Naeem, A. Sadiq, J. H. Al-Fahemi, B. H. Asghar, N. Boukabcha, A. Chouaih and S. A. Ahmed, Spectrochim. Acta, Part A, 2024, 124093 CrossRef.
- R. I. Alsantali, Q. A. Raja, A. Y. Alzahrani, A. Sadiq, N. Naeem, E. U. Mughal, M. M. Al-Rooqi, N. El Guesmi, Z. Moussa and S. A. Ahmed, Dyes Pigm., 2022, 199, 110050 CrossRef CAS.
- R. Allen, in Colour Chemistry, Springer, 1971, pp. 21–36 Search PubMed.
- R. Khanum, R. S. Ali, H. Rangaswamy, S. S. Kumar, A. Prashantha and A. Jagadisha, Results Chem., 2023, 5, 100890 CrossRef CAS.
- A. Bafana, S. S. Devi and T. Chakrabarti, Environ. Rev., 2011, 19, 350–371 CrossRef CAS.
- R. Christie, in Colour Chemistry, 2001, pp. 1–11 Search PubMed.
- D. Dantas, A. I. Ribeiro, F. Carvalho, E. Gil-Martins, R. Silva, F. Remião, A. Zille, F. Cerqueira, E. Pinto and A. M. Dias, Chem. Commun., 2023, 59, 2791–2794 RSC.
- H. Tavallali, A. Parhami, S. R. Dastghaib and M. A. Karimi, Spectrochim. Acta, Part A, 2023, 289, 122194 CrossRef CAS PubMed.
- Y. Li, C. Cao, F. Feng, K. Fang, M. Wang, R. Xie, Z. Zhao and W. Chen, J. Mol. Liq., 2023, 369, 120864 CrossRef CAS.
- D. m. Aziz, S. A. Hassan, D. M. Mamand and K. Qurbani, J. Mol. Struct., 2023, 1284, 135451 CrossRef CAS.
- K. Mezgebe, Y. Melaku, V. P. Ramachandran and E. Mulugeta, New J. Chem., 2024, 48, 4400–4416 RSC.
- J. D. Tadić, J. M. Lađarević, Ž. J. Vitnik, V. D. Vitnik, T. P. Stanojković, I. Z. Matić and D. Ž. Mijin, Dyes Pigm., 2021, 187, 109123 CrossRef.
- K. A. Elhasany, S. N. Khattab, A. A. Bekhit, D. M. Ragab, M. A. Abdulkader, A. Zaky, M. W. Helmy, H. M. Ashour, M. Teleb and N. S. Haiba, Eur. J. Pharm. Biopharm., 2020, 155, 162–176 CrossRef CAS PubMed.
- M. N. Khan, D. K. Parmar and D. Das, Mini Rev. Med. Chem., 2021, 21, 1071–1084 CAS.
- N. Gomez-Sequeda, M. Jimenez-Del-Rio and C. Velez-Pardo, ACS Chem. Neurosci., 2024, 15, 3563–3575 CrossRef CAS.
- G. Papayan and A. Akopov, Photodiagnosis Photodyn. Ther., 2018, 24, 292–299 CrossRef CAS.
- P. C. A. Swamy, G. Sivaraman, R. N. Priyanka, S. O. Raja, K. Ponnuvel, J. Shanmugpriya and A. Gulyani, Coord. Chem. Rev., 2020, 411, 213233 CrossRef.
- K. Mezgebe and E. Mulugeta, RSC Adv., 2022, 12, 25932–25946 RSC.
- G. Domagk, Rev. Infect. Dis., 1986, 8, 163–166 CrossRef.
- S. A. Misal and K. R. Gawai, Bioresour. Bioprocess., 2018, 5, 1–9 CrossRef.
- M. Pervaiz, S. Sadiq, A. Sadiq, U. Younas, A. Ashraf, Z. Saeed, M. Zuber and A. Adnan, Coord. Chem. Rev., 2021, 447, 214128 CrossRef CAS.
- M. Hauser, J. Org. Chem., 1964, 29, 3449–3450 CrossRef CAS.
- J. Chen, X. Xie, J. Liu, Z. Yu and W. Su, React. Chem. Eng., 2022, 7, 1247–1275 RSC.
- J. Qiu, B. Tang, B. Ju, S. Zhang and X. Jin, Dyes Pigm., 2020, 173, 107920 CrossRef.
- M. Toupin and D. Bélanger, J. Phys. Chem. C, 2007, 111, 5394–5401 CrossRef CAS.
- L. Duarte, R. Fausto and I. Reva, Phys. Chem. Chem. Phys., 2014, 16, 16919–16930 RSC.
- A. Demirçalı, J. Mol. Struct., 2021, 1231, 129960 CrossRef.
- S. H. Alarcón, A. C. Olivieri, D. Sanz, R. M. Claramunt and J. Elguero, J. Mol. Struct., 2004, 705, 1–9 CrossRef.
- V. Deneva, A. Lyčka, S. Hristova, A. Crochet, K. M. Fromm and L. Antonov, Dyes Pigm., 2019, 165, 157–163 CrossRef CAS.
- Y. Cao, J. Romero, J. P. Olson, M. Degroote, P. D. Johnson, M. Kieferová, I. D. Kivlichan, T. Menke, B. Peropadre and N. P. Sawaya, Chem. Rev., 2019, 119, 10856–10915 CrossRef CAS PubMed.
- A. M. Hegazy, N. S. Haiba, M. K. Awad, M. Teleb and F. M. Atlam, New J. Chem., 2023, 47, 16470–16483 RSC.
- N. S. Mohamed, S. M. Ibrahim, M. M. Ahmed and A. F. Al-Hossainy, Ind. Eng. Chem. Res., 2023, 62, 4312–4327 CrossRef CAS.
- A. Z. Omar, M. A. El-Rahman, E. A. Hamed, S. K. El-Sadany and M. A. El-Atawy, Sci. Rep., 2023, 13, 7826 CrossRef CAS PubMed.
- A. M. Hegazy, N. S. Haiba, M. K. Awad and F. M. Mahgoub, Phys. Chem. Chem. Phys., 2023, 25, 9532–9547 RSC.
- M. Bursch, J. M. Mewes, A. Hansen and S. Grimme, Angew. Chem., Int. Ed., 2022, 61, e202205735 CrossRef CAS.
- M. A. Salem, M. K. Awad, R. K. Sleet and M. A. El-Ghobashy, Mater. Chem. Phys., 2024, 129795 CrossRef CAS.
- A. M. Bayoumy, A. Hessein, M. A. Belal, M. Ezzat, M. A. Ibrahim, A. Osman and A. A. El-Moneim, J. Power Sources, 2024, 617, 235145 CrossRef CAS.
- F. E. H. David and L. Blangey, Fundamental processes of dye chemistry, Interscience publisher's ltd., London, 1949, p. 1 Search PubMed.
- M. Frisch and F. Clemente, G. Scalmani, V. Barone, B. Mennucci, G. A. Petersson, H. Nakatsuji, M. Caricato, X. Li, H. P. Hratchian, A. F. Izmaylov, J. Bloino and G. Zhe, Gaussian, vol. 9 Search PubMed.
- A. D. Becke, Phys. Rev. A:At., Mol., Opt. Phys., 1988, 38, 3098 CrossRef CAS.
- C. Lee, W. Yang and R. G. Parr, Phys. Rev. B: Condens. Matter Mater. Phys., 1988, 37, 785 CrossRef CAS PubMed.
- B. Mennucci, Wiley Interdiscip. Rev.: Comput. Mol. Sci., 2012, 2, 386–404 CAS.
- K. Wolinski, J. F. Hinton and P. Pulay, J. Am. Chem. Soc., 1990, 112, 8251–8260 CrossRef CAS.
- K. Momma and F. Izumi, J. Appl. Crystallogr., 2011, 44, 1272–1276 CrossRef CAS.
- A. Frisch, A. Nielson and A. Holder, GaussView 5.0, Gaussian Inc., Pittsburgh, PA, 2000, vol. 556 Search PubMed.
- G. Andrienko, Chemcraft, v. 1.8 (build 445)-graphical software for visualization of quantum chemistry computations, in Search PubMed.
- T. Lu and F. Chen, J. Comput. Chem., 2012, 33, 580–592 CrossRef CAS PubMed.
- W. Humphrey, A. Dalke and K. Schulten, J. Mol. Graph., 1996, 14, 33–38 CrossRef CAS PubMed.
- R. M. Humphries, J. Ambler, S. L. Mitchell, M. Castanheira, T. Dingle, J. A. Hindler, L. Koeth and K. Sei, J. Clin. Microbiol., 2018, 56, e01934 CAS.
- L. Boge, H. Bysell, L. Ringstad, D. Wennman, A. Umerska, V. Cassisa, J. Eriksson, M.-L. Joly-Guillou, K. Edwards and M. Andersson, Langmuir, 2016, 32, 4217–4228 CrossRef CAS PubMed.
- C. Rodríguez-Melcón, C. Alonso-Calleja, C. García-Fernández, J. Carballo and R. Capita, Biology, 2021, 11, 46 CrossRef PubMed.
- H. Lade, J. H. Park, S. H. Chung, I. H. Kim, J.-M. Kim, H.-S. Joo and J.-S. Kim, J. Clin. Med., 2019, 8, 1853 CrossRef CAS.
- M. Gomes-Fernandes, M. Laabei, N. Pagan, J. Hidalgo, S. Molinos, R. Villar Hernandez, D. Domínguez-Villanueva, A. T. A. Jenkins, A. Lacoma and C. Prat, PLoS One, 2017, 12, e0175552 CrossRef PubMed.
- J. Duan, M. Li, Z. Hao, X. Shen, L. Liu, Y. Jin, S. Wang, Y. Guo, L. Yang and L. Wang, Emerg. Microb. Infect., 2018, 7, 1–10 CAS.
- J. Garcia-Amoros, A. Sanchez-Ferrer, W. A. Massad, S. Nonell and D. Velasco, Phys. Chem. Chem. Phys., 2010, 12, 13238–13242 RSC.
- A. Georgiev, A. Kostadinov, D. Ivanov, D. Dimov, S. Stoyanov, L. Nedelchev, D. Nazarova and D. Yancheva, Spectrochim. Acta, Part A, 2018, 192, 263–274 CrossRef CAS.
- A. Z. Omar, A. S. Mohamed, E. A. Hamed, S. M. El-Badry and M. A. El-atawy, J. Mol. Liq., 2024, 125216 CrossRef CAS.
- Z. Lei and L. Xiaogang, ACS Sustainable Chem. Eng., 2013, 1(11), 1440–1452 CrossRef.
- A. Z. Omar, A. M. Khamis, E. A. Hamed, S. K. El-Sadany, E. M. A. Rehim, M. E. Elba, M. G. Mohamed and M. A. El-Atawy, Sci. Rep., 2023, 13, 21554 CrossRef CAS.
- P. Debnath, A. Das, K. S. Singh, T. Yama, S. S. Singh, R. J. Butcher, L. Sieroń and W. Maniukiewicz, Inorg. Chim. Acta, 2019, 498, 119172 CrossRef CAS.
- A. C. Olivieri, R. B. Wilson, I. C. Paul and D. Y. Curtin, J. Am. Chem. Soc., 1989, 111, 5525–5532 CrossRef CAS.
- L. Racané, Z. Mihalić, H. Cerić, J. Popović and V. Tralić-Kulenović, Dyes Pigm., 2013, 96, 672–678 CrossRef.
- M. Ueda, N. Kishida, L. Catti and M. Yoshizawa, Chem. Sci., 2022, 13, 8642–8648 RSC.
- P. S. de Carvalho, F. M. Nachtigall, M. N. Eberlin and L. A. B. Moraes, J. Org. Chem., 2007, 72, 5986–5993 CrossRef.
- P. Ruggiero, F. Interesse and O. Sciacovelli, Geochem. Cosmochim. Acta, 1979, 43, 1771–1775 CrossRef CAS.
- P. Ruggiero, F. Interesse, L. Cassidei and O. Sciacovelli, Geochim. Cosmochim. Acta, 1980, 44, 603–609 CrossRef CAS.
- P. Ruggiero, F. Interesse and O. Sciacovelli, Soil Biol. Biochem., 1981, 12(3), 297–299 CrossRef.
- K. Fukui, Science, 1982, 218, 747–754 CrossRef CAS PubMed.
- Y. Huang, C. Rong, R. Zhang and S. Liu, J. Mol. Model., 2017, 23, 1–12 CrossRef.
- H. Weinstein, R. Osman, J. P. Green and S. Topiol, Chemical Applications of Atomic and Molecular Electrostatic Potentials: Reactivity, Structure, Scattering, and Energetics of Organic, Inorganic, and Biological Systems, 1981, pp. 309–334 Search PubMed.
- I. Obot, D. Macdonald and Z. Gasem, Corros. Sci., 2015, 99, 1–30 CrossRef CAS.
- E. R. Johnson, S. Keinan, P. Mori-Sánchez, J. Contreras-García, A. J. Cohen and W. Yang, J. Am. Chem. Soc., 2010, 132, 6498–6506 CrossRef CAS.
- M. Pérez-Aranda, E. Pajuelo, S. Navarro-Torre, P. Pérez-Palacios, B. Begines, I. D. Rodríguez-Llorente, Y. Torres and A. Alcudia, Antibiotics, 2022, 11, 1800 CrossRef.
- J. L. Lister and A. R. Horswill, Front. Cell. Infect. Microbiol., 2014, 4, 178 Search PubMed.
- S. Hogan, N. Stevens, H. Humphreys, J. O'Gara and E. O'Neill, Curr. Pharmaceut. Des., 2015, 21, 100–113 CrossRef CAS.
- L. Barrett and B. Atkins, J. Antimicrob. Chemother., 2014, 69, i25–i27 CrossRef CAS PubMed.
- C. D. K. Amengor, F. K. Kekessie, A. Brobbey, J. N. Addotey, P. Peprah, C. Amaning-Danquah, J. Adu, M. Tetteh and E. B. A. Adusei, Journal of Scientific Research and Reports, 2022, 28, 77–88 CrossRef.
- M. Mini, D. Jayakumar and P. Kumar, J. Biomol. Struct. Dyn., 2023, 1–11 Search PubMed.
- R. P. Novick and D. Jiang, Microbiology, 2003, 149, 2709–2717 CrossRef CAS PubMed.
- C. Goerke and C. Wolz, Int. J. Med. Microbiol., 2010, 300, 520–525 CrossRef PubMed.
- Q. Liu, W.-S. Yeo and T. Bae, Genes, 2016, 7, 81 CrossRef PubMed.
- K. Dufresne, D. A. DiMaggio Jr, C. S. Maduta, S. R. Brinsmade and J. K. McCormick, 2024, preprint, 2024.2002.2027.582338, DOI:10.1101/2024.02.27.582338.
- M. H. Kaulage, B. Maji, S. Pasadi, S. Bhattacharya and K. Muniyappa, Eur. J. Med. Chem., 2017, 139, 1016–1029 CrossRef CAS PubMed.
Footnote |
| † Electronic supplementary information (ESI) available. See DOI: https://doi.org/10.1039/d4ra06367h |
| This journal is © The Royal Society of Chemistry 2025 |

