 Open Access Article
Creative Commons Attribution 3.0 Unported Licence
BT-DNBS: a novel cyanine-based turn-on fluorescent probe with large Stokes shift for sensitive and selective detection of biothiols in live-cell imaging†
Shuai Zhang a,
Yoichiro Fujiokab,
Yusuke Ohbab and
Koji Yamada*c
aGraduate School of Environmental Science, Hokkaido University, Japan. E-mail: zs929783910@eis.hokudai.ac.jp
bDepartment of Cell Physiology, Faculty of Medicine and Graduate School of Medicine, Hokkaido University, Japan
cDivision of Materials Science, Faculty of Environmental Earth Science, Hokkaido University, Japan
First published on 2nd January 2025
Abstract
Detecting biothiols like glutathione (GSH), homocysteine (Hcy), and cysteine (Cys) is key to understanding their roles in health and disease. We developed BT-DNBS, a cyanine-based turn-on fluorescent probe with a dinitrobenzenesulfonyl (DNBS) quencher group. Upon biothiol interaction, the quencher is cleaved, restoring fluorescence. The resulting probe BT-NH shows a maximum emission wavelength at 630 nm and a large Stokes shift (≈200 nm), enhancing detection accuracy. Low cytotoxicity and high time resolution make BT-DNBS suitable for live-cell imaging. Imaging of A431 cells confirmed intracellular biothiol detection, with NEM pre-treatment reducing fluorescence, verifying specificity. BT-DNBS holds promise for biomedical research, particularly in disease diagnostics.
1. Introduction
GSH (glutathione), Hcy (homocysteine), and Cys (cysteine) play pivotal roles in human health. GSH (1–10 mM) acts as a potent antioxidant, protecting cells from oxidative stress and maintaining immune function.1 Elevated Hcy (12–15 μM) levels are linked to cardiovascular diseases,2 while Cys (30–200 μM) is crucial for protein synthesis and detoxification.3 Early detection of these biomarkers is crucial for preventing and treating related illnesses.4 Their assessment aids in identifying individuals at risk of cardiovascular diseases, neurodegenerative disorders, and other conditions, facilitating timely interventions.5 Thus, their evaluation holds significant promise for proactive healthcare management.Traditional methods for biothiol detection often lack sensitivity, specificity, or compatibility with live-cell imaging.6–8 To address these challenges, fluorogenic techniques have emerged as powerful tools for biothiol detection, offering distinct advantages over conventional methods.9 These advantages include tunable optical properties, fast response times, high sensitivity (even at micromolar concentrations), cost-effectiveness and straightforward operational procedures.10–12 Fluorogenic techniques capitalize on the unique reactivity of biothiols with specific fluorogenic probes, resulting in enhanced fluorescence signals that enable sensitive and selective detection.13 Recent advancements in fluorogenic probe design and synthesis have further expanded the utility of these techniques for biothiol analysis in complex biological samples.14–16 However, most of those probes have small Stokes shift, typically less than 100 nm, resulting in overlapping excitation and emission spectra, which can hinder accurate detection.17 Additionally, many probes exhibit short emission wavelengths, limiting their utility for deep tissue imaging and in vivo applications.18 These challenges underscore the critical need for the development of new biothiol-targeting probes that can meet the rigorous demands of modern bioanalytical applications.
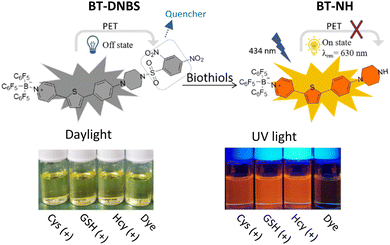
In response to the limitations of existing biothiol-targeting probes, a novel cyanine-based turn-on fluorescent probe, BT-DNBS, has been developed and applied in living cells, demonstrating significant advancements in biothiol detection. The simplified synthetic scheme is depicted in Fig. 1. The probe features a D–π–A framework (Fig. 2) with pyridinium as the electron-withdrawing group and piperazine as the electron-donating group. Additionally, the pyridinium moiety introduced by BCF [tris(pentafluorophenyl) borane, (B(C6F5)3)] enhances electron deficiency.19 DNBS serves as a commonly used fluorescence quenching moiety and reaction site for biotiols.20–24 After reacting with biothiols, the activated probe exhibits a maximum emission at 630 nm, resulting in a notably large Stokes shift of ≈200 nm. This substantial shift effectively minimizes spectral overlap and enhances detection accuracy. It also shows good selectivity over other analytes and linear relationship in concentration titration tests, along with lower cytotoxicity and stability in physiological pH conditions. Furthermore, we successfully applied this probe in living cells and identified its significant potential for broader applications in the field of biochemistry.
2. Results and discussion
The specific synthesis scheme for BT-DNBS is provided in the ESI.† All obtained compounds were characterized using 1H NMR spectroscopy. BT-Boc and BT-DNBS were characterized by 1H/13C NMR spectroscopy and ESI-MS spectrometry (ESI†).2.1 Spectroscopic analysis of BT-DNBS towards biothiols
To optimize the experimental conditions for biothiol detection, the fluorescence intensity of BT-DNBS (10 μM) was evaluated in varying DMSO/PBS ratios (Fig. S7,† right). The results revealed a significant influence of the solvent composition on the fluorescence properties of the probe. Notably, the highest fluorescence intensity was achieved at a DMSO/PBS ratio of 9![[thin space (1/6-em)]](https://www.rsc.org/images/entities/char_2009.gif) :
:![[thin space (1/6-em)]](https://www.rsc.org/images/entities/char_2009.gif) 1 (v/v). This ratio provides an optimal environment for both the solubility of the dye in the organic phase and the biological relevance of the aqueous phase, thus enhancing the fluorescence response upon biothiol interaction. As a result, all subsequent experiments involving biothiol detection were performed under this optimized solvent condition.
1 (v/v). This ratio provides an optimal environment for both the solubility of the dye in the organic phase and the biological relevance of the aqueous phase, thus enhancing the fluorescence response upon biothiol interaction. As a result, all subsequent experiments involving biothiol detection were performed under this optimized solvent condition.
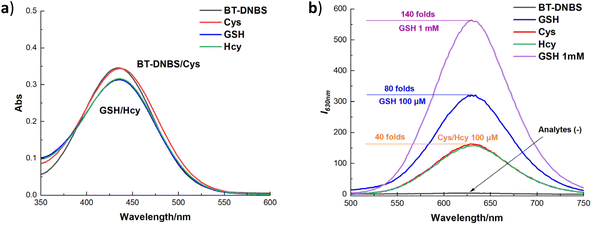
Additionally, to assess the interaction of the fluorescent dye BT-DNBS with biothiols, absorption and emission spectra were recorded for BT-DNBS (10 μM) in the presence and absence of biothiols (100 μM). As shown in Fig. 3, the absorption spectra revealed minimal differences with and without biothiols, suggesting consistent dye behavior irrespective of biothiol presence. However, significant differences were observed in the emission spectra. In the absence of biothiols, only weak fluorescence was detected, implying effective fluorescence quenching by the DNBS motif. In contrast, the introduction of biothiols resulted in a pronounced turn-on fluorescence response, highlighting a notably strong and observable orange fluorescence signal. Moreover, the fluorescence intensity increased by up to 40-fold for Cys/Hcy (100 μM), 80-fold for GSH (100 μM), and notably, up to 140-fold for 1 mM GSH, demonstrating a highly sensitive response to biothiols, especially for GSH. A plausible mechanism for the stronger fluorescence response of GSH compared to Cys and Hcy may involve the formation of an intermediate through an S–C bond between GSH and the DNBS group. The larger, flexible structure of GSH allows for effective intramolecular hydrogen bonding, facilitating hydrogen transfer and promoting the cleavage of the sulfonate group, which releases the fluorescent moiety more readily. Additionally, concentration titration experiments ranging from pure BT-DNBS to varying concentrations of biothiols (0–1000 μM) revealed a good linear relationship (ESI†). Furthermore, ranging from 0–30 μM of biothiols, the limit of detection (LOD) was calculated as 83 nM for GSH, 49 nM for Cys, and 80 nM for Hcy, highlighting the probe's potential for sensitive biothiol detection and quantification. After reacting with biothiols, the activated probe BT-NH demonstrated a maximum emission wavelength at 630 nm, resulting in a substantial Stokes shift (≈200 nm) that effectively minimizes spectral overlap and enhances detection accuracy. To better contextualize the advantages of our probe, we have provided a comparison table (Table S2, ESI†) summarizing reported fluorescent probes containing the DNBS group as a receptor unit. Our probe demonstrates a significantly larger bathochromic shift and a lower LOD (83 nm for GSH, 49 nm for Cys and 80 nm for Hcy) relative to the reported probes. These properties contribute to the probe's enhanced performance in live-cell imaging applications, making it a valuable tool for sensitive and selective detection of biothiols.
2.2 Selectivity analysis of BT-DNBS towards analytes
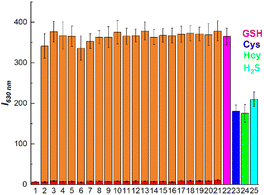
To validate the sensitivity and specificity of BT-DNBS in identifying biothiols, a range of analytes were employed and analyzed. As illustrated in Fig. 4, the fluorescence intensity of BT-DNBS remained relatively unchanged upon the addition of various analysts (including Arg, Gly, His, Leu, Met, Phe, Pro, Ser, Thr, Cl−, Br−, NO2−, HCO3−, SO32−, SO42−, Ca2+, Fe2+, Mg2+, Na+, Vc) compared to the BT-DNBS alone (Fig. 4). However, notable fluorescence responses were observed in the presence of biothiols, suggesting that BT-DNBS exhibited strong sensing capabilities toward biothiols compared to other analytes. The high selectivity of BT-DNBS for biothiols can be attributed to the specific interaction between the DNBS moiety and thiol groups. Interestingly, the probe also responded to H2S, with a fluorescence intensity similar to that observed for Cys and Hcy. This could also be attributed to the nucleophilic properties of H2S, which allows it to interact with the DNBS moiety of BT-DNBS, leading to fluorescence activation. The negligible interference from other common biological and chemical analytes highlight the probe's potential for accurate biothiol detection in complex biological environments. These findings confirm that BT-DNBS is a highly selective and sensitive probe for biothiol detection, making it suitable for applications in bioanalytical chemistry and medical diagnostics.2.3 Time & pH-dependent spectroscopic analysis towards biothiols
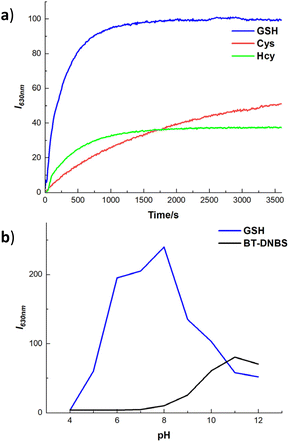
To evaluate the temporal and pH response of BT-DNBS towards biothiols, we conducted a time- and pH-dependent fluorescence intensity analysis. This analysis aimed to determine the kinetics, sensitivity, and pH stability of BT-DNBS when exposed to different biothiols over time and across various pH levels. The fluorescence intensity was monitored at regular intervals to observe the dynamic interaction between BT-DNBS and the target biothiols (GSH, Cys, and Hcy). As depicted in Fig. 5(a), the fluorescence intensity exhibited a rapid increase within the initial 500 s, reaching near-maximum intensity at approximately 1200 s. Subsequently, the fluorescence intensity stabilized for the remaining 1 hour observation period. This swift and consistent response suggests that BT-DNBS possesses high efficiency in detecting biothiols, rendering it advantageous for real-time monitoring applications. Furthermore, it is noteworthy that the response time of BT-DNBS is shorter compared to many biothiol-targeted fluorogenic probes.25–27 The fluorescence intensity changes of BT-DNBS in response to pH variation were investigated across a range from pH 4 to pH 12, as shown in Fig. 5(b). Notably, when BT-DNBS was tested without biothiols, it exhibited stable weak fluorescence intensity between pH 6 and 8. This stability suggests that BT-DNBS remained in a fluorescence-off state under these pH conditions. However, in the presence of GSH, a significant fluorescence-on state was observed within the same pH range of 6 to 8. This indicates that the addition of GSH induced a notable increase in fluorescence intensity, demonstrating the effective response of BT-DNBS to biothiols under physiological pH conditions. However, as the pH increases beyond 8, the fluorescence intensity further increases, probably due to the deprotonation of the DNBS group, which reduces the non-radiative decay pathways and promotes more efficient fluorescence emission. These findings underscore the pH-responsive behavior of BT-DNBS and its ability to detect biothiols under specific pH environments, making it a promising candidate for applications in physiological and biological systems.2.4 Sensing mechanism
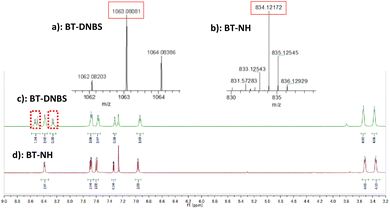
Previous studies have demonstrated that probes incorporating DNBS group as a recognition site undergo nucleophilic aromatic substitution reactions with biothiols.28,29 This reaction mechanism involves the removal of the DNBS group, which suppresses the photo-induced electron transfer (PET), restoring the inherent fluorescence of BT-NH. In the context of BT-DNBS, upon interaction with biothiols such as GSH, Cys, and Hcy, the DNBS group, initially acting as a fluorescence quencher by the intramolecular PET, is cleaved, thereby resulting in a pronounced fluorescence enhancement. To validate the sensing mechanism, BT-DNBS and isolated product BT-NH were analyzed using 1H NMR and ESI-mass spectrometry, as depicted in Fig. 6. The 1H NMR spectra of the isolated reaction product BT-NH showed the disappearance of peaks corresponding to the cleaved DNBS group. Additionally, ESI-mass spectrometry confirmed the presence of a new peak corresponding to BT-NH. These findings provide compelling evidence for the nucleophilic substitution reaction and the subsequent formation of the fluorescent BT-NH product, corroborating the proposed mechanism.2.5 Density functional theory (DFT) calculation
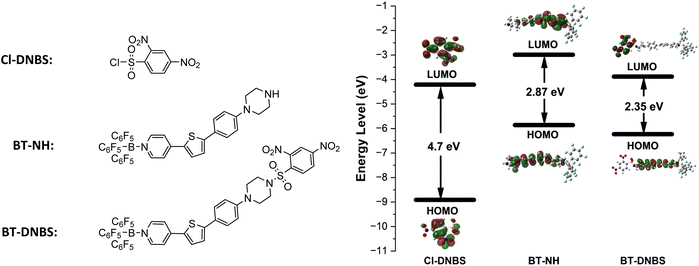
To better understand the fluorescence turn-on mechanism of BT-DNBS from the perspective of frontier molecular orbitals, DFT calculations and structure optimizations were performed for Cl-DNBS, BT-NH, and BT-DNBS using the B3LYP functional and the 6-311G(d,p) basis set, as implemented in the Gaussian 09 program. As shown in Fig. 7, the results indicate that the LUMO (Lowest Unoccupied Molecular Orbital) energy level of Cl-DNBS (−4.21 eV) is positioned between the HOMO (−5.86 eV) (Highest Occupied Molecular Orbital) and LUMO (−2.99 eV) of BT-NH. This suggests that the PET (photoinduced electron transfer) process from excited BT-NH to Cl-DNBS is thermodynamically favorable. Upon reaction of BT-DNBS with biothiols, the N–S bond between the piperazine and DNBS is cleaved, which interrupts the PET process, resulting in the restoration of fluorescence. Moreover, the π-electrons of BT-NH are primarily distributed in both the HOMO and LUMO orbitals, whereas for BT-DNBS, the π-electrons in the HOMO are mainly localized on the dye moiety, and the π-electrons in the LUMO are predominantly distributed on the DNBS moiety. This distribution further supports that the PET process from BT-NH to Cl-DNBS effectively quenches the dye's fluorescence.2.6 Live-cell imaging
Before evaluating the imaging capabilities of BT-DNBS, a cell viability assay was performed to assess its cytotoxicity using CCK-8. A431 cells were treated with varying concentrations of BT-DNBS (0, 1, 10, 100 μM) for 24 hours. The results, depicted in Fig. S8 (ESI†), confirmed the low cytotoxicity of BT-DNBS at an applied concentration of 10 μM for cell imaging applications. Following this, we conducted fluorescence imaging experiments using A431 cells to evaluate the practical applicability of BT-DNBS for live-cell imaging. The cells were incubated with BT-DNBS (10 μM) for different time periods (60, 120, and 240 minutes) at 37 °C. Confocal images were acquired using a spinning disk confocal microscopy. As depicted in Fig. 8(a), the untreated cells (control group) exhibited negligible fluorescence, indicating lower inherent autofluorescence. In contrast, the BT-DNBS-treated cells showed a time-dependent increase in fluorescence intensity: weak fluorescence after 60 minutes (Fig. 8(b)), stronger fluorescence after 120 minutes (Fig. 8(c)), and even stronger fluorescence after 240 minutes (Fig. 8(d)). | ||
| Fig. 8 Fluorescent images. (a): Control group, untreated A431 cells. (b–d): Cells incubated with BT-DNBS (10 μM) for 60 minutes (b), 120 minutes (c), 240 minutes (d). λex = 434 nm, λem = 630 nm. | ||
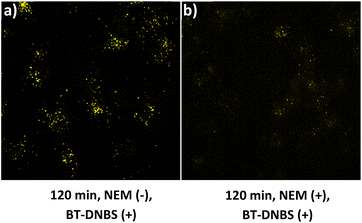
To confirm that the fluorescence observed upon BT-DNBS treatment is due to its specific reaction with intracellular biothiols, we conducted NEM (N-ethylmaleimide) inhibition experiments. NEM is a known thiol-blocking agent,30 and pre-treatment with NEM could weaken fluorescence if BT-DNBS specifically reacts with biothiols. A431 cells were incubated with BT-DNBS (10 μM) for 120 minutes under two conditions: in the absence of NEM (Fig. 9(a)) and in the presence of NEM (50 μM pre-treatment for 60 minutes) (Fig. 9(b)). As expected, cells treated with BT-DNBS alone showed visible fluorescence. In contrast, cells pre-treated with NEM showed weaker fluorescence after BT-DNBS incubation. These results demonstrate that the fluorescence activation of BT-DNBS is specifically triggered by its interaction with biothiols.
3. Conclusion
In this study, we developed and assessed a novel cyanine-based fluorescent probe, BT-DNBS, for biothiol detection. BT-DNBS showed significant fluorescence enhancement upon reacting with biothiols due to a nucleophilic aromatic substitution reaction, confirmed by 1H NMR and ESI-mass spectrometry. The probe exhibited high sensitivity with detection limits of 83 nM for GSH, 49 nM for Cys, and 80 nM for Hcy. Upon activation by biothiols, the resulting probe BT-NH exhibited a maximum emission wavelength of 630 nm, with a significant Stokes shift of ≈200 nm. Selectivity tests confirmed its specificity for biothiols over other analytes. Time- and pH-dependent studies demonstrated its stability and rapid response in physiological conditions. Cytotoxicity assay indicated low toxicity of BT-DNBS at relevant concentrations, supporting its suitability for live-cell applications. Live-cell imaging showed that BT-DNBS could detect biothiols within cells, primarily localizing in the cytoplasm. Additionally, NEM inhibition experiments confirmed the biothiol-specific activation of fluorescence, further supporting the selectivity of the probe. These results suggest that BT-DNBS may serve as a valuable tool for imaging biothiol fluctuations in live cells, with potential applications in disease diagnostics and studies of cellular redox biology. However, it is essential to note that further investigation is required to assess its viability for time-lapse imaging, particularly in determining whether the dye remains stable under continuous excitation light.4. Experimental
The detailed information of materials, reagents, instruments, synthesis, spectroscopic analysis, cell culture, cytotoxicity assay, fluorescence imaging experiments are provided in the ESI.†4.1 Synthesis of BT-DNBS
BT-Boc (100 mg, 0.11 mmol) was dissolved in dichloromethane (3 mL) in a dried flask. Trifluoroacetic acid (0.6 mL) was subsequently added dropwise to the flask, and the resulting mixture was sonicated for 1 hour at room temperature. The solvent was then evaporated, and the residue underwent vacuum drying for 15 hours. Following this, the resultant material was dissolved in dichloromethane (3 mL), and N,N-diisopropylethylamine (57 μL, 0.33 mmol) was added, maintaining the reaction at 0 °C. A mixture of dinitrobenzenesulfonyl chloride (59 mg, 0.22 mmol) and dichloromethane (2 mL) was then slowly added to the reaction system and stirred for 30 minutes. The reaction mixture was subsequently allowed to return to room temperature and stirred for an additional 16 hours. Upon completion of the reaction, as monitored by TLC (hexane![[thin space (1/6-em)]](https://www.rsc.org/images/entities/char_2009.gif) :
:![[thin space (1/6-em)]](https://www.rsc.org/images/entities/char_2009.gif) ethyl acetate = 1
ethyl acetate = 1![[thin space (1/6-em)]](https://www.rsc.org/images/entities/char_2009.gif) :
:![[thin space (1/6-em)]](https://www.rsc.org/images/entities/char_2009.gif) 1), the mixture was subjected to purification via silica gel chromatography (hexane
1), the mixture was subjected to purification via silica gel chromatography (hexane![[thin space (1/6-em)]](https://www.rsc.org/images/entities/char_2009.gif) :
:![[thin space (1/6-em)]](https://www.rsc.org/images/entities/char_2009.gif) ethyl acetate = 2
ethyl acetate = 2![[thin space (1/6-em)]](https://www.rsc.org/images/entities/char_2009.gif) :
:![[thin space (1/6-em)]](https://www.rsc.org/images/entities/char_2009.gif) 1) resulting in the isolation of compound BT-DNBS as a brown solid. (104 mg, 89%).
1) resulting in the isolation of compound BT-DNBS as a brown solid. (104 mg, 89%).
1H NMR (500 MHz, CDCl3, TMS, r.t.): δ 8.53 (dd, J = 8.5, 2.0 Hz, 1H), 8.49 (d, J = 2.0 Hz, 1H) 8.38 (d, J = 6.5 Hz, 2H), 8.26 (d, J = 9.0 Hz, 1H), 7.68 (d, J = 4.0 Hz, 1H), 7.67 (d, J = 7.5 Hz, 2H), 7.57 (d, J = 9.0 Hz, 2H), 7.32 (d, J = 4.0 Hz, 1H), 6.93 (d, J = 9.0 Hz, 2H), 3.54 (t, J = 5.0 Hz, 4H), 3.37 (t, J = 5.0 Hz, 4H). 13C NMR (CDCl3, 125 MHz, r.t.): δ = 152.24, 151.56, 150.49, 148.94, 147.54, 146.84, 137.57, 135.22, 133.16, 131.46, 127.79, 126.59, 125.32, 124.55, 120.19, 117.01, 48.66, 45.77.
ESI-MS (m/z): [M]+ calcd for C43H21BF15N5O6S2+: 1063.0787; Found: 1063.0808.
Data availability
The authors confirm that the data supporting the findings of this study are available within the article [and/or its ESI materials†].Author contributions
Shuai Zhang: conceptualization, methodology, data curation, formal analysis, investigation, writing—original draft preparation, and project administration. Yoichiro Fujioka and Yusuke Ohba: provided technical support and resources for cell imaging experiments. Koji Yamada: supervision, project administration, funding acquisition, resources, reviewing the manuscript, corresponding author responsibilities. All authors have read and approved the final manuscript.Conflicts of interest
There are no conflicts to declare.Acknowledgements
We would like to express our sincere gratitude to JST SPRING for their financial support of this research (No. JPMJSP2119). We also extend our thanks to Yusuke Ohba Lab for their invaluable assistance with cell culture and imaging.Notes and references
- G. Y. Wu, Y. Z. Fang and S. Yang, Glutathione metabolism and its implications for health, J. Nutr., 2004, 134, 489–492 CrossRef CAS.
- H. Refsum, A. D. Smith and P. M. Ueland, Facts and recommendations about total homocysteine determinations: an expert opinion, Clin. Chem., 2004, 50, 3–32 CrossRef CAS.
- D. W. Bak and E. Weerapana, Cysteine-mediated redox signalling in the mitochondria, Mol. BioSyst., 2015, 11, 678–697 RSC.
- K. S. McCully, Homocysteine and the pathogenesis of atherosclerosis, Expert Rev. Clin. Pharmacol., 2015, 8, 211–219 CrossRef CAS PubMed.
- D. P. Jones, J. L. Carlson, V. C. Mody, J. Y. Cai, M. J. Lynn and P. Sternberg, Redox state of glutathione in human plasma, Free Radicals Biol. Med., 2000, 28, 625–635 CrossRef CAS PubMed.
- M. Silvia, D. W. Jeffery, S. Dall'Acqua and A. Masi, A novel HPLC-MS/MS approach for the identification of biological thiols in vegetables, Food Chem., 2021, 339, 12780 Search PubMed.
- Y. Sun, T. Yao, X. Guo, Y. Peng and J. Zheng, Simultaneous assessment of endogenous thiol compounds by LC–MS/MS, J. Chromatogr. B, 2016, 1029–1030, 213–221 CrossRef CAS PubMed.
- V. Kostal, J. Katzenmeyer and E. A. Arriaga, Capillary electrophoresis in bioanalysis, Anal. Chem., 2008, 80, 4533–4550 CrossRef CAS PubMed.
- Y. L. Pak, K. M. Swamy and J. Yoon, Recent Progress in Fluorescent Imaging Probes, Sensors, 2015, 15, 24374–24396 CrossRef PubMed.
- H. S. Jung, X. Q. Chen, J. S. Kim and J. Yoon, Recent progress in luminescent and colorimetric chemosensors for detection of thiols, Chem. Soc. Rev., 2013, 42, 6019–6031 RSC.
- A. R. Lippert, E. J. New and C. J. Chang, Reaction-based fluorescent probes for selective imaging of hydrogen sulfide in living cells, J. Am. Chem. Soc., 2011, 133, 10078–10080 CrossRef CAS.
- Y. L. Pak, K. M. Swamy and J. Yoon, Recent Progress in Fluorescent Imaging Probes, Sensors, 2015, 15, 24374–24396 CrossRef.
- R. Asghar, Y. Li, F. Huo and C. Yin, Sensing mechanism of cysteine specific fluorescence probes and their application of cysteine recognition, Chem. Biomed. Imaging, 2024, 4, 250–269 CrossRef.
- J. Dai, C. Ma, P. Zhang, Y. Fu and B. Shen, Recent progress in the development of fluorescent probes for detection of biothiols, Dyes Pigm., 2020, 177, 108321 CrossRef CAS.
- S. Ding, M. Liu and Y. Hong, Biothiol-specific fluorescent probes with aggregation-induced emission characteristics, Sci. China:Chem., 2018, 61, 882–891 CrossRef CAS.
- Y. Kim, J. Kim, J. M. An, C. Park and D. Kim, All-nontoxic fluorescent probe for biothiols and its clinical applications for real-time glioblastoma visualization, ACS Sens., 2023, 8, 1723–1732 CrossRef CAS.
- L. Zhao, H. Chu, S. Q. Zhang, L. L. Xu, B. Yang, P. Y. Ma, Q. Wu and D. Q. Song, A novel probe for identifying breast cancer cells based on fluorescence response of the cascade process of biothiol and viscosity, Sens. Actuators, B, 2023, 375, 132883 CrossRef CAS.
- Q. Miao, Q. Li, Q. Yuan, L. Li, Z. Hai, S. Liu and G. Liang, Discriminative fluorescence sensing of biothiols in vitro and in living cells, Anal. Chem., 2015, 87, 3460–3466 CrossRef CAS.
- J. Yoshino, N. Kano and T. Kawashima, Fluorescent azobenze- nes and aromatic aldimines featuring an N–B interaction, Dalton Trans., 2013, 42, 15826 RSC.
- X. Dai, T. Zhang, J. Y. Miao and B. X. Zhao, A ratiometric fluorescent probe with DNBS group for biothiols in aqueous solution, Sens. Actuators, B, 2016, 223, 274–279 CrossRef CAS.
- D. G. Chen, Z. Long, Y. M. Sun, Z. J. Luo and X. D. Lou, A red-emission probe for intracellular biothiols imaging with a large Stokes shift, J. Photochem. Photobiol., A, 2019, 368, 90–96 CrossRef CAS.
- Q. K. Gao, W. Z. Zhang, B. Song, R. Zhang, W. H. Guo and J. L. Yuan, Development of a Novel Lysosome-Targeted Ruthenium(II) Complex for Phosphorescence/Time-Gated Luminescence Assay of Biothiols, Anal. Chem., 2017, 89, 4517–4524 CrossRef CAS PubMed.
- F. Wang, X. Fan, Y. Liu, T. Gao, R. Huang, F. Jiang and Y. Liu, Design, synthesis, cell imaging, kinetics and thermodynamics of reaction-based turn-on fluorescent probes for the detection of biothiols, Dyes Pigm., 2017, 145, 451–460 CrossRef CAS.
- X. Liu, H. B. Lei, Y. X. Hu, X. R. Zou, H. Y. Ran, Q. N. Cai, J. J. Huang and C. Liu, Construction of a mitochondria-targeted near-infrared fluorescence turn-on fluorescent probe for H2S detection and imaging in living cells and drug-induced mice inflammatory models, Spectrochim. Acta, Part A, 2024, 306, 123574 CrossRef CAS PubMed.
- B. Gao, L. Cui, Y. Pan, G. Zhang, Y. Zhou, C. Zhang, S. Shuang and C. Dong, A highly selective ratiometric fluorescent probe for biothiol and imaging in live cells, RSC Adv., 2016, 6, 43028–43033 RSC.
- S. Q. Wang, Q. H. Wu, H. Y. Wang, X. X. Zheng, W. L. Shen, Y. R. Zhang, J. Y. Miao and B. X. Zhao, A novel pyrazoline-based selective fluorescent probe for detecting reduced glutathione and its application in living cells and serum, Analyst, 2013, 138, 7169–7174 RSC.
- M. Wei, P. Yin, Y. Shen, L. Zhang, J. Deng, S. Xue, X. Li, B. Guo, Y. Zhang and S. Yao, A new turn-on fluorescent probe for selective detection of glutathione and cysteine in living cells, Chem. Commun., 2013, 49, 4640–4642 RSC.
- L. Yang, Y. Su, Y. Geng, F. Qi, X. Ren, F. Zhang and X. Song, An instantaneous near-infrared trimethyl lock based fluorescent probe for biothiols with a large Stokes shift, Anal. Chim. Acta, 2018, 1034, 168–175 CrossRef CAS PubMed.
- G. Lu, S. Ding, S. Meng and Y. Zhang, A near-infrared turn on fluorescent probe for specific detection of cysteine and its application based on a corrole fluorophore, Dyes Pigm., 2024, 227, 112194 CrossRef CAS.
- W. Zheng, D. Shen, Y. Pan, D. Yi, Y. Long and H. Zheng, Enhancing the peroxidase-like activity of ficin by rational blocking thiol groups for colorimetric detection of biothiols, Talanta, 2019, 204, 833–839 CrossRef CAS.
Footnote |
| † Electronic supplementary information (ESI) available. See DOI: https://doi.org/10.1039/d4ra07109c |
| This journal is © The Royal Society of Chemistry 2025 |


