 Open Access Article
Enhanced physicochemical properties of chitosan films with in situ generation of kafirin particles: optimization via response surface methodology
Aoguo Cao,
Dajian Huang,
Zhehui Wang,
Binbin Hu and
Xiaohu Qiang *
*
School of Material Science and Engineering, Lanzhou Jiaotong University, Lanzhou, 730070, PR China. E-mail: Qiangxioahu@yeah.net
First published on 2nd January 2025
Abstract
Biodegradable food packaging has gained significant attention owing to environmental concerns. Chitosan (CS), a natural polysaccharide, is popular in packaging films, however, its high hydrophilicity, brittleness, and low mechanical strength limit its use. To improve CS film performance, kafirin (Kaf), glycerol (GE), and tannic acid (TA) were added to create biocomposite films. The response surface method (RSM) was used to develop predictive models, with Kaf, GE, and TA as independent variables. Optimal film properties were achieved with a CS to Kaf ratio of 9![[thin space (1/6-em)]](https://www.rsc.org/images/entities/char_2009.gif) :
:![[thin space (1/6-em)]](https://www.rsc.org/images/entities/char_2009.gif) 1, 20% GE as a plasticizer, and 5% TA. The addition of Kaf and TA increased the tensile strength and improved hygroscopicity, solubility loss, swelling, and water contact angle. GE enhanced the film flexibility. Overall, the composite films showed improved mechanical strength, water resistance, and UV resistance, indicating strong potential for food packaging applications.
1, 20% GE as a plasticizer, and 5% TA. The addition of Kaf and TA increased the tensile strength and improved hygroscopicity, solubility loss, swelling, and water contact angle. GE enhanced the film flexibility. Overall, the composite films showed improved mechanical strength, water resistance, and UV resistance, indicating strong potential for food packaging applications.
1. Introduction
Chitosan (CS), a product of the N-deacetylation of chitin, is a type of cationic polysaccharide that has attracted significant attention in the development of food packaging due to its remarkable biological properties. These properties include biocompatibility, biodegradability, bioactivity, and antimicrobial properties.1–3 However, the production of CS films from dilute acid solutions results in their water sensitivity or, in some cases, water solubility, which limits their applicability in food packaging.To enhance the various properties of CS films while preserving their biocompatibility and biodegradability, researchers have introduced various biopolymer particles into the CS matrix.4–7 For example, Yasser A. et al.8 prepared in situ a novel nanocomposite of PdNPs and polyionic cross-linked chitosan (PICCS@Pd) for the delivery of adriamycin (DOX) and 5-fluorouracil (5-FU). The results show that the novel nanocomposites have both good encapsulation efficiency and loading capacity for DOX, 5-FU, and DOX+5-FU, as well as good antimicrobial activity Similarly, Lu et al.9 prepared regenerated cellulose/CS composite films, which exhibited a remarkable increase of 135.14% in the tensile index and a 78.54% improvement in the water vapor barrier performance. Nasr et al.10 prepared hydrogels of Tween 80-lecithin nano-emulsion (OONE) loaded with virgin olive oil (VOO) and quaternized trimethyl chitosan-thiol (TMCT). The results show that olive oil nanoemulsions (OONE) and TMCT help to improve the antimicrobial, anti-biofilm and antioxidant potential of the oils.
Furthermore, Quan et al.11 prepared CS/polypropylene carbonate-based nanoparticles that exhibited high antimicrobial activity. In another study, Mohamed et al.12 prepared composite membranes of amphiphilic chitosan (ACS)/thyme extract (TE) loaded with Ag. The results showed that the composite membrane inhibited Escherichia coli and Staphylococcus aureus. Additionally, Islam et al.13 prepared ρCACS nanogel loaded with ρ-coumaric acid (ρCA) by extracting aromatic chestnut essential oil (SAEO) and ultrasound-assisted deacetylated chitosan (UCS3) from clove buds and squid pens. The results showed that the composite nanogel had antimicrobial effects for the prevention or treatment of diseases.
Finally, Bueno et al.14 prepared a food packaging film using CS, ZN, and PVA as raw materials. These findings indicated that ZN could form a dense structure with CS, but when the ZN content increased, issues such as ZN agglomeration and nonuniform distribution emerged, consequently affecting the water vapor transmission rate and water resistance of the film.
Kafirin (Kaf) is one of the most abundant proteins in sorghum15 and is known for its biodegradability, biocompatibility, and sustainability. Schober et al.16 demonstrated that hydrophobic interactions between protein molecules play a critical role in film formation. Compared with other plant proteins, Kaf is more hydrophobic, allowing it to form more stable food packaging films.17 Ye et al.18 prepared composite nanoparticles utilizing curcumin-loaded gum Arabic, Kaf, and gum Arabic-Zn. These findings indicated that Kaf was more effective than ZN-based composite nanoparticles in regulating curcumin release. In the CS–Kaf binary composite system, CS interacts with Kaf through hydrophobic, electrostatic, and hydrogen bonding interactions, enhancing the mechanical properties and hydrophobicity of the CS–Kaf system. Song et al.19 prepared Kaf–CS composite particles via antisolvent precipitation, and the results demonstrated that these composite particles exhibited good wettability, excellent rheological properties, and antiaggregation stability. However, this system still faces challenges, including insufficient flexibility, water resistance, and light transmission. Although polysaccharide–protein composite films are superior to single-component films in terms of mechanical properties and water resistance, they still fail to fully satisfy the demands of everyday use. The incorporation of cross-linking agents and plasticizers to improve the mechanical properties, water resistance, flexibility, and UV resistance of food packaging films has been recognized as an effective strategy.20–22
Tannic acid (TA) is a natural polyphenol known for its antioxidant, antimicrobial, and antiviral properties.23 Owing to the presence of a significant number of phenolic hydroxyl groups,24 TA has the ability to bind to biopolymers through noncovalent bonds, thereby increasing the surface hydrophobicity of these biopolymers.25 In addition to polysaccharide–protein systems, TA can interact with various proteins (e.g., zein, gliadin, and salivary proteins) through hydrophobic interactions between the aromatic rings of the tannins and the hydrophobic groups of the proteins. Additionally, TA can increase the degree of cross-linking within protein structures such as gelatin and fish gelatin, leading to improved physical properties in polysaccharide–protein systems. Furthermore, the reactive groups, including phenolic hydroxyl and carboxyl groups, on the TA molecular chain can form amphiphilic macromolecules with polysaccharides.26 Zuo et al.27 prepared gelatin/TA composites to reinforce and protect against leather-based artifacts. These findings indicated that the composite material enhances the oxidation resistance of leather products and mitigates the effects of aging. Park et al.28 prepared a novel HGC/TA thermogel and demonstrated that the incorporation of TA improved the physical, mechanical, and biological functions of HGC, resulting in notable antibacterial properties. Che et al.29 prepared a TA–Fe(II)–PS system for the removal of trichloroethylene (TCE). The results revealed that the reducing properties of TA effectively regulated and slowly released Fe(II) during the removal process, activating persulfate and facilitating the continuous release of reactive species.
The addition of plasticizers is a proven method for enhancing the performance of CS films.30 As small molecules, plasticizers can insert themselves into macromolecular structures to disrupt hydrogen bonding and van der Waals forces between molecules. This increase in distance between polymer molecules contributes to a reduction in the glass transition temperature of the polymers.31 Common plasticizers include polyols and lipids, such as sorbitol, diethylene glycol, and glycerol (GE). Among these materials, GE, owing to its relatively small molecular size and high hydroxyl density, is widely used as a plasticizer in the preparation of biocomposite films. Li et al.32 prepared CS/GE composite films and reported that the optimal performance occurred with a GE concentration of 40%, achieving an elasticity recovery rate of up to 95.7%. Fundo et al.33 utilized GE-plasticized CS films for molecular mobility, composition, and structural analysis, revealing that GE and CS are tightly bound, forming a robust film.
In this work, composite films made from CS/Kaf/TA were produced via a cast film-forming method, with CS serving as the matrix, Kaf as the filler, TA as both a dispersant and cross-linking agent, and GE as a plasticizer. We investigated the microstructure, physicochemical properties, mechanical properties, water resistance, and UV transmittance of the composite films via response surface methodology (RSM), scanning electron microscopy (SEM), XRD, XPS and Fourier transform infrared (FT-IR) spectroscopy. Additionally, we explored the mechanisms by which TA, GE, and Kaf affect the properties of CS-based composite films.
2. Materials and methods
2.1 Experimental main raw materials
CS was purchased from Zhejiang Golden Shell Pharmaceutical Co., Ltd, with analytical purity specifications; sorghum powder was purchased from the Lanzhou market. TA, acetic acid, and sodium metabisulfite were purchased from Sinopharm Group Chemical Reagent Limited Congratulations, all have analytical purity specifications.2.2 Preparation of CS/Kaf composite films
Following the method of Buffo34 with some modifications, a suitable amount of defatted and decolorized sorghum flour was initially added to a 75% ethanol solution containing 0.5% sodium bisulfite at a solid–liquid ratio of 1![[thin space (1/6-em)]](https://www.rsc.org/images/entities/char_2009.gif) :
:![[thin space (1/6-em)]](https://www.rsc.org/images/entities/char_2009.gif) 5. The microwave treatment was then conducted at 500 W for 2 min. Subsequently, the mixture underwent ultrasonication for 40 min at 60 °C, followed by centrifugation at 4000 rpm; the supernatant was collected and mixed with an excess of cooled distilled water. The resulting solution was then filtered and freeze-dried to obtain the final Kaf product.
5. The microwave treatment was then conducted at 500 W for 2 min. Subsequently, the mixture underwent ultrasonication for 40 min at 60 °C, followed by centrifugation at 4000 rpm; the supernatant was collected and mixed with an excess of cooled distilled water. The resulting solution was then filtered and freeze-dried to obtain the final Kaf product.
A 3% (w/w) CS solution was prepared by dissolving CS powder in distilled water containing 1% acetic acid and stirring at room temperature until the CS was completely dissolved. A 1% (w/w) Kaf solution was created by dissolving Kaf powder in an 85% (v/v) aqueous ethanol solution, stirring it at room temperature for 40 min, and then centrifuging it at 4000 rpm to eliminate a small quantity of insoluble impurities. A 1% (w/w) TA solution was obtained by dissolving TA powder in distilled water. Precise amounts of Kaf (with ratios of CS![[thin space (1/6-em)]](https://www.rsc.org/images/entities/char_2009.gif) :
:![[thin space (1/6-em)]](https://www.rsc.org/images/entities/char_2009.gif) Kaf equal to 6
Kaf equal to 6![[thin space (1/6-em)]](https://www.rsc.org/images/entities/char_2009.gif) :
:![[thin space (1/6-em)]](https://www.rsc.org/images/entities/char_2009.gif) 1, 9
1, 9![[thin space (1/6-em)]](https://www.rsc.org/images/entities/char_2009.gif) :
:![[thin space (1/6-em)]](https://www.rsc.org/images/entities/char_2009.gif) 1, and 12
1, and 12![[thin space (1/6-em)]](https://www.rsc.org/images/entities/char_2009.gif) :
:![[thin space (1/6-em)]](https://www.rsc.org/images/entities/char_2009.gif) 1, w/w) were gradually added to the CS solution via a constant-pressure dropping funnel while stirring at 550 rpm. Subsequently, TA (at concentrations of 1%, 3%, and 5%, w/w) and GE (at concentrations of 20%, 25%, and 30%, w/w) were added in succession, with stirring continuing for an additional 40 min. The specified volume of the mixture was then transferred to a polycarbonate Petri dish with a diameter of 9 cm and a volume of 113.1 cm2 and allowed to stand in the air. After complete evaporation of the solvent, the composite films were stored in a desiccator for further experiments. The samples were labeled CS, C6K1, C6K1T5, C9K1T5, and C12K1T5G30, where C6K1 denotes a CS
1, w/w) were gradually added to the CS solution via a constant-pressure dropping funnel while stirring at 550 rpm. Subsequently, TA (at concentrations of 1%, 3%, and 5%, w/w) and GE (at concentrations of 20%, 25%, and 30%, w/w) were added in succession, with stirring continuing for an additional 40 min. The specified volume of the mixture was then transferred to a polycarbonate Petri dish with a diameter of 9 cm and a volume of 113.1 cm2 and allowed to stand in the air. After complete evaporation of the solvent, the composite films were stored in a desiccator for further experiments. The samples were labeled CS, C6K1, C6K1T5, C9K1T5, and C12K1T5G30, where C6K1 denotes a CS![[thin space (1/6-em)]](https://www.rsc.org/images/entities/char_2009.gif) :
:![[thin space (1/6-em)]](https://www.rsc.org/images/entities/char_2009.gif) Kaf ratio of 6
Kaf ratio of 6![[thin space (1/6-em)]](https://www.rsc.org/images/entities/char_2009.gif) :
:![[thin space (1/6-em)]](https://www.rsc.org/images/entities/char_2009.gif) 1 and where C6K1T5 indicates the addition of 5% TA solution to the CS
1 and where C6K1T5 indicates the addition of 5% TA solution to the CS![[thin space (1/6-em)]](https://www.rsc.org/images/entities/char_2009.gif) :
:![[thin space (1/6-em)]](https://www.rsc.org/images/entities/char_2009.gif) Kaf ratio of 6
Kaf ratio of 6![[thin space (1/6-em)]](https://www.rsc.org/images/entities/char_2009.gif) :
:![[thin space (1/6-em)]](https://www.rsc.org/images/entities/char_2009.gif) 1. The preparation route is illustrated in Fig. 1.
1. The preparation route is illustrated in Fig. 1.
2.3 Surface characterization
The surface microstructures of the composite films were clearly observed via field emission SEM (Model JSM-670F, JEOL, Ltd, Japan). For cross-sectional microstructure analysis, samples were first immersed in liquid nitrogen for cryogenic freezing, after which their surfaces were coated with a gold layer.An FT-IR instrument was used to analyze the molecular interactions within the composite films. The infrared absorption spectra of the films were recorded in attenuated total reflectance (ATR) mode, covering a wavelength range from 4000 cm−1 to 650 cm−1 with a resolution of 8 cm−1.
The water contact angles of the films were measured via a German-made OCA25 optical contact angle measuring instrument in a controlled room-temperature environment. A drop of deionized water (5 μL) was placed onto the surface of the films via a precision syringe. The angle was captured and recorded after a settling period of 5 seconds. Each sample was subjected to three replicate tests.
The transmittance of the composite film was characterized with a UV-3600 Plus instrument from Shimadzu, Japan. The composite film was prepared as a 10 mm × 50 mm long strip-like sample, which was placed in a cuvette and tested in the range of 200–1000 nm.
The crystalline structure of the composite film was characterised using Bruker D8 advance XRD. The diffraction angle of 2θ was measured in the range of 10–80° at 20° min−1.
XPS analysis of composite films using Thermo Fisher ESCALAB 250Xi.
2.4 Mechanical properties
The TS and elongation at break (EB) of the composite films were evaluated via an AG-IS universal material testing machine. The samples were prepared as long strips measuring 70 mm × 10 mm. The AG-IS sensor had a capacity of 200 N, with an initial scale length of 40 mm and a tensile rate of 2 mm min−1. The resulting data were subsequently imported into Design Expert10 software for response surface optimization.2.5 Water resistance
The method outlined by Lei35 was employed to measure the moisture uptake (MU), water solubility (WS), and equilibrium swelling rate (ESR). To determine MU, the films (20 mm × 30 mm) were dried at 70 °C until they reached a constant weight (approximately 6 h) and were then weighed as m0. Next, the films were placed in a sealed container with a saturated sodium chloride solution and maintained at 75% relative humidity for 24 h to achieve equilibrium. They were subsequently weighed again as m1. This procedure was repeated three times, and the results were calculated via eqn (1).WS was determined by drying the film samples (20 mm × 30 mm) at 70 °C to a constant weight (approximately 6 h) and recording this weight as m. The samples were then submerged in 50 mL of deionized water within a disposable plastic cup for a period of 24 h. After the samples were removed and allowed to dry to a constant weight, they were weighed as m3. This experiment was also conducted three times, with calculations performed according to eqn (2).
The ESR was determined similarly to that of WS,36 with the difference that the samples were immersed in disposable plastic cups filled with 50 mL of deionized water for complete saturation over 24 h. After the experiment, the excess water on the surfaces was removed via filter paper, and the samples were weighed as m4. This experiment was repeated three times, with calculations based on eqn (3).
| MU = (m1 − m0)/m0 × 100% | (1) |
| WS = (m3 − m2)/m2 × 100% | (2) |
| ESR = (m4 − m2)/m2 × 100% | (3) |
3. Results and discussion
3.1 Scanning electron microscope (SEM)
Fig. 2(a–i) shows the microstructural images of the selected films with varying Kaf contents. The cross-sections of the films were examined at magnifications of 1000×, 3000×, and 100![[thin space (1/6-em)]](https://www.rsc.org/images/entities/char_2009.gif) 00×. As depicted in Fig. 2(a–c), the pure CS film has a relatively smooth surface without any apparent defects or phase separation, which is consistent with previous reports.37 In Fig. 2(d–f), the cross-section of the C9K1G20 film shows a uniform structure, with Kaf particles clearly dispersed within the CS matrix. These particles appear spherical or ellipsoidal, displaying significant variation in size and notable aggregation. This phenomenon arises from the interactions between Kaf and CS, which predominantly occur through hydrophobic forces when Kaf binds to CS. Furthermore, the inclusion of GE enhances the density of the film structure. As demonstrated in Fig. 2(g–i), the cross-section of the C9K1T5G20 film is smoother than that of C9K1G20. At a magnification of 3000× magnification, the distribution of Kaf particles appears more homogeneous and relatively uniform in size, whereas at 100
00×. As depicted in Fig. 2(a–c), the pure CS film has a relatively smooth surface without any apparent defects or phase separation, which is consistent with previous reports.37 In Fig. 2(d–f), the cross-section of the C9K1G20 film shows a uniform structure, with Kaf particles clearly dispersed within the CS matrix. These particles appear spherical or ellipsoidal, displaying significant variation in size and notable aggregation. This phenomenon arises from the interactions between Kaf and CS, which predominantly occur through hydrophobic forces when Kaf binds to CS. Furthermore, the inclusion of GE enhances the density of the film structure. As demonstrated in Fig. 2(g–i), the cross-section of the C9K1T5G20 film is smoother than that of C9K1G20. At a magnification of 3000× magnification, the distribution of Kaf particles appears more homogeneous and relatively uniform in size, whereas at 100![[thin space (1/6-em)]](https://www.rsc.org/images/entities/char_2009.gif) 00× magnification, a marked reduction in the size of Kaf particles compared with the C9K1G20 film is observed. This suggests that the amphiphilic TA, which wraps around the surface of Kaf, can form network cross-links with the CS matrix. This interaction facilitates the combination of hydrophobic Kaf and CS, thereby mitigating the agglomeration phenomenon of Kaf pellets and achieving improved dispersion.25 Fig. 2(j–l) show the optical photographs of CS, C9K1G20, and C9K1T5G20, respectively, and it can be clearly seen that the addition of tannic acid results in a darker colour of the film.
00× magnification, a marked reduction in the size of Kaf particles compared with the C9K1G20 film is observed. This suggests that the amphiphilic TA, which wraps around the surface of Kaf, can form network cross-links with the CS matrix. This interaction facilitates the combination of hydrophobic Kaf and CS, thereby mitigating the agglomeration phenomenon of Kaf pellets and achieving improved dispersion.25 Fig. 2(j–l) show the optical photographs of CS, C9K1G20, and C9K1T5G20, respectively, and it can be clearly seen that the addition of tannic acid results in a darker colour of the film.
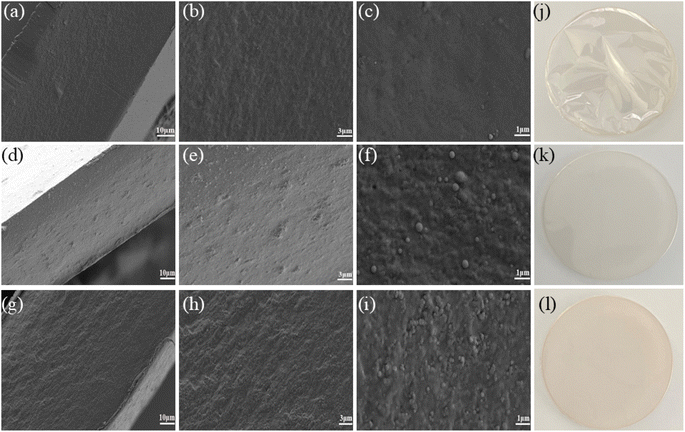 | ||
| Fig. 2 SEM and optical electron microscopy image images of composite film sections: (a–c and j) CS film; (d–f and k) C9K1G20 composite film; (g–i and l) C9K1T5G20 composite film. | ||
3.2 Fourier transform infrared (FT-IR) spectroscopy
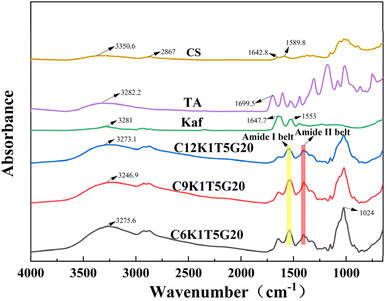
FT-IR spectroscopy was employed to analyze and characterize the interactions between CS, Kaf, and TA. The FT-IR spectra of Kaf, CS, TA, C12K1T5G20, C9K1T5G20, and C6K1T5G20 in the wavelength range of 4000–650 cm−1 are presented in Fig. 3. The prominent peak of Kaf at 3281.0 cm−1 corresponds to the hydroxyl vibrational peaks within the range of 3100–3500 cm−1. The characteristic peaks at 1647.7 cm−1 (amide I band: 1750–1600 cm−1) and 1553 cm−1 (amide II band: 600–1500 cm−1) are attributed to the stretching vibrational peaks of the C![[double bond, length as m-dash]](https://www.rsc.org/images/entities/char_e001.gif) O and C–N bonds, as well as the bending and stretching of the N–H bond and the stretching vibration of the C–N, respectively.38,39 The characteristic peaks of TA are found at 3282.2 cm−1 and 1699.5 cm−1, where the peak at 3282.2 cm−1 is due to O–H vibrations, whereas the peak at 1699.5 cm−1 is associated with the ester bonding group. The range of 1606.2–1443.8 cm−1 corresponds to the backbone vibrations of the benzene ring.40
O and C–N bonds, as well as the bending and stretching of the N–H bond and the stretching vibration of the C–N, respectively.38,39 The characteristic peaks of TA are found at 3282.2 cm−1 and 1699.5 cm−1, where the peak at 3282.2 cm−1 is due to O–H vibrations, whereas the peak at 1699.5 cm−1 is associated with the ester bonding group. The range of 1606.2–1443.8 cm−1 corresponds to the backbone vibrations of the benzene ring.40
Similarly, the principal absorption peaks of CS include the hydroxyl group stretching vibration peak at 3350.6 cm−1 and the C–H stretching vibration peak at 2867 cm−1. The peaks observed at 1642.8 cm−1 and 1589.8 cm−1 correspond to the amide I and amide II stretching vibration peaks, respectively. Additionally, the peaks at 1374.8 cm−1, 1022.3 cm−1, and 893.1 cm−1 are attributed to the bending vibration of N–H, the stretching vibration of C–O–C, and the vibrational absorption peaks of the pyran ring, respectively. Upon binding Kaf to both TA and CS, the peaks shifted to 3275.6 cm−1 (C6K1T5G20), 3246.9 cm−1 (C9K1T5G20), and 3272 cm−1 (C12K1T5G20). This shift indicates that the amide bond of Kaf experienced strong hydrogen bonding with the hydroxyl groups of both TA and CS. Compared with those of Kaf, the amide I and amide II bands of the composite films shifted to 1549 cm−1 and 1406 cm−1, respectively, suggesting the occurrence of electrostatic interactions during the reaction. The peak at 1024 cm−1 is associated with the interaction between GE(–OH) and CS.41 Overall, the hydrogen bonding and electrostatic interactions between Kaf, TA, and CS were critical in the formation of the composite films.
3.3 Mechanical properties
The ratios of CS/Kaf (A), GE addition (B), and TA addition (C) were considered the three factors for analysis via the Box–Behnken response surface method with Design-Expert 10 software.42 The levels of these experimental factors are summarized in Table 1. The experimental results of the BDD design are shown in Table 2.| Factors | Number | Level | ||
|---|---|---|---|---|
| −1 | 0 | 1 | ||
| CS/Kaf | A | 6![[thin space (1/6-em)]](https://www.rsc.org/images/entities/char_2009.gif) : :![[thin space (1/6-em)]](https://www.rsc.org/images/entities/char_2009.gif) 1 1 |
9![[thin space (1/6-em)]](https://www.rsc.org/images/entities/char_2009.gif) : :![[thin space (1/6-em)]](https://www.rsc.org/images/entities/char_2009.gif) 1 1 |
12![[thin space (1/6-em)]](https://www.rsc.org/images/entities/char_2009.gif) : :![[thin space (1/6-em)]](https://www.rsc.org/images/entities/char_2009.gif) 1 1 |
| GE | B | 20 | 25 | 30 |
| TA | C | 1 | 3 | 5 |
| RUN | Factors | Response | |||
|---|---|---|---|---|---|
| A | B | C | TS (MPa) | EB (%) | |
| 1 | 6![[thin space (1/6-em)]](https://www.rsc.org/images/entities/char_2009.gif) : :![[thin space (1/6-em)]](https://www.rsc.org/images/entities/char_2009.gif) 1 1 |
20 | 3 | 23.96 | 28.73 |
| 2 | 12![[thin space (1/6-em)]](https://www.rsc.org/images/entities/char_2009.gif) : :![[thin space (1/6-em)]](https://www.rsc.org/images/entities/char_2009.gif) 1 1 |
20 | 3 | 30.91 | 35.19 |
| 3 | 6![[thin space (1/6-em)]](https://www.rsc.org/images/entities/char_2009.gif) : :![[thin space (1/6-em)]](https://www.rsc.org/images/entities/char_2009.gif) 1 1 |
30 | 3 | 17.33 | 40.77 |
| 4 | 12![[thin space (1/6-em)]](https://www.rsc.org/images/entities/char_2009.gif) : :![[thin space (1/6-em)]](https://www.rsc.org/images/entities/char_2009.gif) 1 1 |
30 | 3 | 25.41 | 51.21 |
| 5 | 6![[thin space (1/6-em)]](https://www.rsc.org/images/entities/char_2009.gif) : :![[thin space (1/6-em)]](https://www.rsc.org/images/entities/char_2009.gif) 1 1 |
25 | 1 | 19.15 | 32.03 |
| 6 | 12![[thin space (1/6-em)]](https://www.rsc.org/images/entities/char_2009.gif) : :![[thin space (1/6-em)]](https://www.rsc.org/images/entities/char_2009.gif) 1 1 |
25 | 1 | 27.17 | 37.71 |
| 7 | 6![[thin space (1/6-em)]](https://www.rsc.org/images/entities/char_2009.gif) : :![[thin space (1/6-em)]](https://www.rsc.org/images/entities/char_2009.gif) 1 1 |
25 | 5 | 20.65 | 29.67 |
| 8 | 12![[thin space (1/6-em)]](https://www.rsc.org/images/entities/char_2009.gif) : :![[thin space (1/6-em)]](https://www.rsc.org/images/entities/char_2009.gif) 1 1 |
25 | 5 | 28.57 | 32.46 |
| 9 | 9![[thin space (1/6-em)]](https://www.rsc.org/images/entities/char_2009.gif) : :![[thin space (1/6-em)]](https://www.rsc.org/images/entities/char_2009.gif) 1 1 |
20 | 1 | 26.42 | 27.94 |
| 10 | 9![[thin space (1/6-em)]](https://www.rsc.org/images/entities/char_2009.gif) : :![[thin space (1/6-em)]](https://www.rsc.org/images/entities/char_2009.gif) 1 1 |
30 | 1 | 24.85 | 45.42 |
| 11 | 9![[thin space (1/6-em)]](https://www.rsc.org/images/entities/char_2009.gif) : :![[thin space (1/6-em)]](https://www.rsc.org/images/entities/char_2009.gif) 1 1 |
20 | 5 | 29.52 | 26.18 |
| 12 | 9![[thin space (1/6-em)]](https://www.rsc.org/images/entities/char_2009.gif) : :![[thin space (1/6-em)]](https://www.rsc.org/images/entities/char_2009.gif) 1 1 |
30 | 5 | 26.41 | 40.13 |
| 13 | 9![[thin space (1/6-em)]](https://www.rsc.org/images/entities/char_2009.gif) : :![[thin space (1/6-em)]](https://www.rsc.org/images/entities/char_2009.gif) 1 1 |
25 | 3 | 24.42 | 30.07 |
| 14 | 9![[thin space (1/6-em)]](https://www.rsc.org/images/entities/char_2009.gif) : :![[thin space (1/6-em)]](https://www.rsc.org/images/entities/char_2009.gif) 1 1 |
25 | 3 | 23.57 | 28.32 |
| 15 | 9![[thin space (1/6-em)]](https://www.rsc.org/images/entities/char_2009.gif) : :![[thin space (1/6-em)]](https://www.rsc.org/images/entities/char_2009.gif) 1 1 |
25 | 3 | 22.28 | 26.65 |
| 16 | 9![[thin space (1/6-em)]](https://www.rsc.org/images/entities/char_2009.gif) : :![[thin space (1/6-em)]](https://www.rsc.org/images/entities/char_2009.gif) 1 1 |
25 | 3 | 23.84 | 29.52 |
| 17 | 9![[thin space (1/6-em)]](https://www.rsc.org/images/entities/char_2009.gif) : :![[thin space (1/6-em)]](https://www.rsc.org/images/entities/char_2009.gif) 1 1 |
25 | 3 | 22.89 | 31.42 |
The experimental data in Table 2 were analyzed, leading to the development of a mathematical model. The regression equations for TS and EB are as follows:
| TS = 48.37562 + 1.81583A − 2.93275B + 2.62062C + 0.014333AB − 4.16667E − 003AC − 1.5050BC − 0.47778A2 + 0.0546B2 + 0.22875C2 |
| EB = 215.92022 − 5.51275A − 13.94625B − 5.84237C + 0.066333AB + 0.16737BC − 0.12042AC + 0.29293A2 + 0.28571B2 + 0.28378C2 |
On the basis of the aforementioned model, three-dimensional response plots of the remaining two factors were created using one of the factors as the baseline level.43 The interaction effects among the three factors (A, B, and C) on TS are clearly illustrated in Fig. 4. In Fig. 4(a), the relationships between CS/Kaf and GE with TS at a fixed TA concentration are presented. When CS/Kaf = 12![[thin space (1/6-em)]](https://www.rsc.org/images/entities/char_2009.gif) :
:![[thin space (1/6-em)]](https://www.rsc.org/images/entities/char_2009.gif) 1, the TS of the composite film clearly reaches its peak. This is attributed to the cross-linking of Kaf with CS through electrostatic interactions, hydrogen bonding, and hydrophobic effects. At lower concentrations of CS, excess Kaf tends to aggregate through hydrophobic interactions, which adversely impacts the mechanical properties.
1, the TS of the composite film clearly reaches its peak. This is attributed to the cross-linking of Kaf with CS through electrostatic interactions, hydrogen bonding, and hydrophobic effects. At lower concentrations of CS, excess Kaf tends to aggregate through hydrophobic interactions, which adversely impacts the mechanical properties.
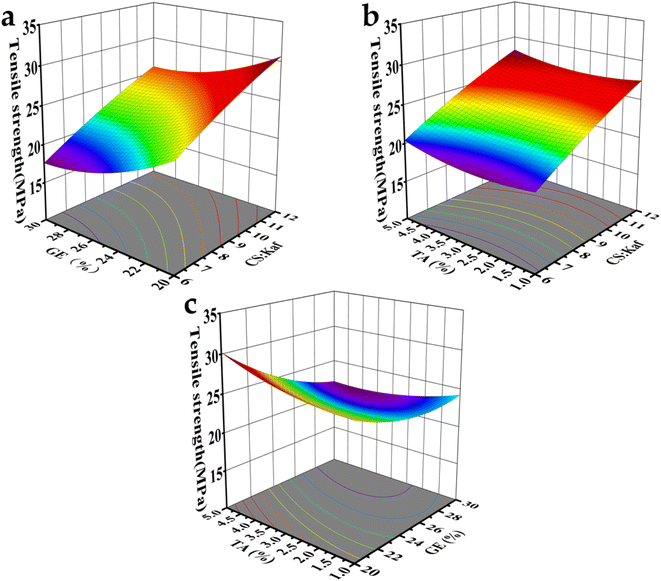 | ||
| Fig. 4 3D response surface plots of factors affecting TS; (a) CS/Kaf and GE; (b) CS/Kaf and TA; (c) TA and GE. | ||
Fig. 4(b) shows that the TS of the composite film increases with increasing TA content. This enhancement is primarily due to the interaction between TA and Kaf, which initially attract each other through hydrophobic interactions, followed by the formation of a hydrogen bonding network. Conversely, Fig. 5(c) indicates a decrease in TS as the GE content increases from 20% to 30%. This decline occurs because CS generates molecular forces with Kaf and TA, predominantly forming hydrogen bonds. However, the introduction of GE disrupts these molecular bonding forces and weakens the original van der Waals forces between molecules, resulting in a softened structure of the film.
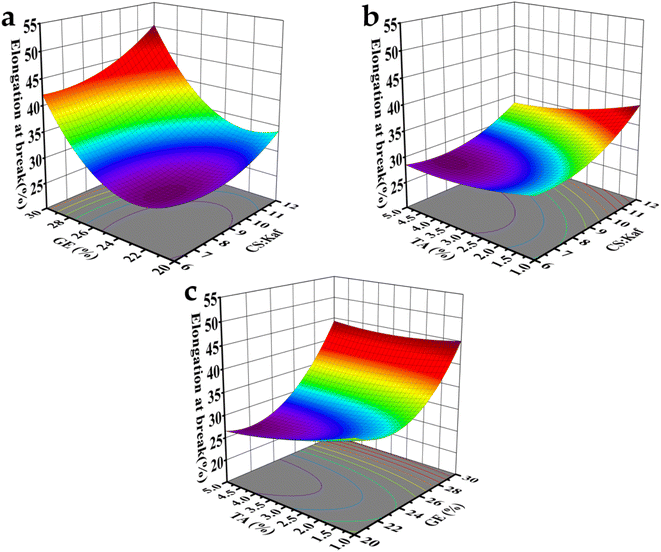 | ||
| Fig. 5 3D response surface plots of factors affecting EB; (a) CS/Kaf and GE; (b) CS/Kaf and TA; (c) TA and GE. | ||
The interaction effects of the three factors (A, B, and C) on the EB are illustrated in Fig. 5, where the ranking is GE > CS/Kaf > TA. Fig. 5(a) and b indicates that the EB of the composite film increases with increasing contents of GE and CS. The impact of GE on film EB is particularly pronounced, as the small molecules of GE can infiltrate the molecular chains of the CS matrix. This infiltration increases the spacing between chains and disrupts the intermolecular forces (hydrogen bonding and van der Waals forces) within the CS polymer matrix, resulting in a softer structure and enhanced mobility of the molecular chains.
Conversely, as the CS![[thin space (1/6-em)]](https://www.rsc.org/images/entities/char_2009.gif) :
:![[thin space (1/6-em)]](https://www.rsc.org/images/entities/char_2009.gif) Kaf ratio decreases from 12
Kaf ratio decreases from 12![[thin space (1/6-em)]](https://www.rsc.org/images/entities/char_2009.gif) :
:![[thin space (1/6-em)]](https://www.rsc.org/images/entities/char_2009.gif) 1 to 6
1 to 6![[thin space (1/6-em)]](https://www.rsc.org/images/entities/char_2009.gif) :
:![[thin space (1/6-em)]](https://www.rsc.org/images/entities/char_2009.gif) 1, the increasing content of Kaf leads to a gradual reduction in the EB. The introduction of Kaf into the matrix fosters the formation of numerous hydrogen bonds. Additionally, the negatively charged groups (–COO–) present in Kaf particles create electrostatic interactions with the positively charged groups (–NH3+) in the matrix. These interactions collectively diminish the mobility of the molecular chains within the composite film, contributing to the observed decrease in EB.
1, the increasing content of Kaf leads to a gradual reduction in the EB. The introduction of Kaf into the matrix fosters the formation of numerous hydrogen bonds. Additionally, the negatively charged groups (–COO–) present in Kaf particles create electrostatic interactions with the positively charged groups (–NH3+) in the matrix. These interactions collectively diminish the mobility of the molecular chains within the composite film, contributing to the observed decrease in EB.
As displayed in Fig. 5(c), increasing the content of TA is correlated with a reduction in EB. This phenomenon is attributed to the interaction between TA, CS, and Kaf, which results in the formation of a denser structure. The 3D spatial maps provided in the figures serve to clarify the relationships among CS/Kaf, TA, and GE. Ultimately, the optimal ratios for the mechanical properties of the composite films were determined to be 9.79![[thin space (1/6-em)]](https://www.rsc.org/images/entities/char_2009.gif) :
:![[thin space (1/6-em)]](https://www.rsc.org/images/entities/char_2009.gif) 1 for CS/Kaf, 4.96% for TA addition, and 20.06% for GE addition. After fine-tuning on the basis of the experimental conditions, the CS/Kaf ratio was set to 9
1 for CS/Kaf, 4.96% for TA addition, and 20.06% for GE addition. After fine-tuning on the basis of the experimental conditions, the CS/Kaf ratio was set to 9![[thin space (1/6-em)]](https://www.rsc.org/images/entities/char_2009.gif) :
:![[thin space (1/6-em)]](https://www.rsc.org/images/entities/char_2009.gif) 1, with TA and GE additions of 5% and 20%, respectively. The experiment was subsequently repeated three times, with results that were consistent with the response surface results.
1, with TA and GE additions of 5% and 20%, respectively. The experiment was subsequently repeated three times, with results that were consistent with the response surface results.
3.4 Water resistance
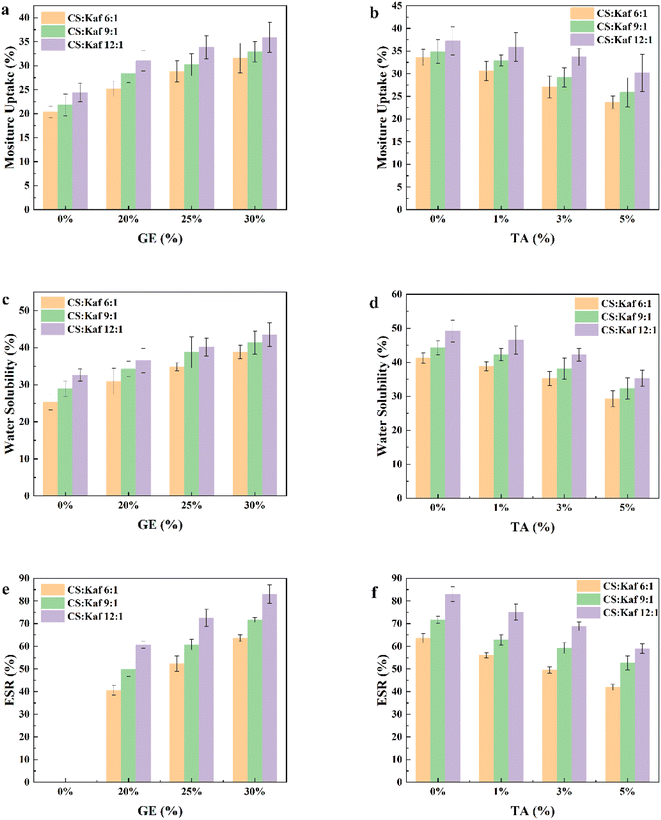
As illustrated in Fig. 6, the increase in Kaf content results in a decrease in the MU, WS, and ESR of the composite films. This phenomenon occurs because Kaf integrates into the matrix and chemically interacts with the hydroxyl and amino groups of the CS matrix through hydrogen bonding, leading to a denser structure that impedes the diffusion of water molecules. Additionally, the structural alterations and unfolding of the protein molecules expose more hydrophobic groups, thereby enhancing the water resistance of the composite films. In Fig. 6(a), it is evident that the MU of the composite film increases with the addition of GE. This can be attributed to GE being a polar and hydrophilic molecule. A similar trend is observed for MU, WS, and ESR with the incorporation of TA at concentrations of 0%, 1%, 3%, and 5%, respectively. These results indicate that as the TA content in the composite film increased, the MU, WS, and ESR decreased to varying extents. These findings suggest that TA contributes to enhancing the water resistance of the composite films. This enhancement can be explained by two key factors. First, TA contains many phenolic hydroxyl groups, which can form hydrogen bonds with CS while also engaging in hydrophobic interactions with Kaf. This reaction results in a more compact structure that further restricts the diffusion of water molecules. Second, the size of Kaf influences the hydrophobicity of the composite film. FTIR and SEM analyses demonstrated that TA can form a network structure with Kaf and the CS matrix. Importantly, TA improved the dispersion of Kaf and reduced its size, leading to a more homogeneous distribution of Kaf within the matrix. Consequently, this finer dispersion enhances the hydrophobicity of the composite film.3.5 Water contact angle
The water contact angle of a film serves as a key indicator for the direct assessment of its hydrophilicity. To explore the effects of Kaf, GE, and TA on the wettability of the film, we photographed the samples after placing a water drop on the film surface for 5 s. As illustrated in Fig. 7(a), the contact angle of the pure CS film was 80.1°. This angle increased from 84.6° to 98.4° as the ratio of Kaf to CS was adjusted from 12![[thin space (1/6-em)]](https://www.rsc.org/images/entities/char_2009.gif) :
:![[thin space (1/6-em)]](https://www.rsc.org/images/entities/char_2009.gif) 1 to 6
1 to 6![[thin space (1/6-em)]](https://www.rsc.org/images/entities/char_2009.gif) :
:![[thin space (1/6-em)]](https://www.rsc.org/images/entities/char_2009.gif) 1, a change attributed to the greater exposure of hydrophobic groups in Kaf.39 Fig. 7(b) shows that TA contributes to an increase in the water contact angle of the composite film. This enhancement is due to the interactions between TA, Kaf, and CS, which lead to the formation of a denser mesh structure, which is consistent with the findings from SEM and water resistance tests. In contrast, Fig. 7(c) indicates that the addition of GE results in a decreased contact angle, suggesting that the plasticizing effect of GE reduces the contact angle. However, dissolution rate analyses revealed that GE also increased the water sensitivity of the films.
1, a change attributed to the greater exposure of hydrophobic groups in Kaf.39 Fig. 7(b) shows that TA contributes to an increase in the water contact angle of the composite film. This enhancement is due to the interactions between TA, Kaf, and CS, which lead to the formation of a denser mesh structure, which is consistent with the findings from SEM and water resistance tests. In contrast, Fig. 7(c) indicates that the addition of GE results in a decreased contact angle, suggesting that the plasticizing effect of GE reduces the contact angle. However, dissolution rate analyses revealed that GE also increased the water sensitivity of the films.
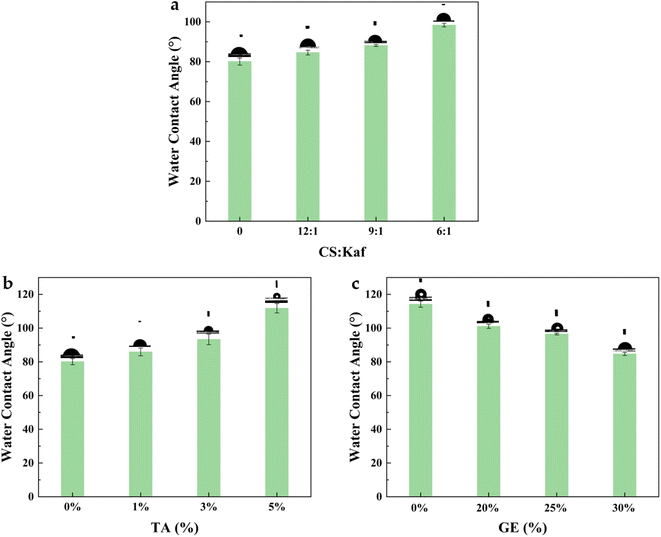 | ||
| Fig. 7 Water contact angles of composite films with different CS contents: Kaf (a), TA (b), and GE (c) contents. | ||
3.6 UV transmittance
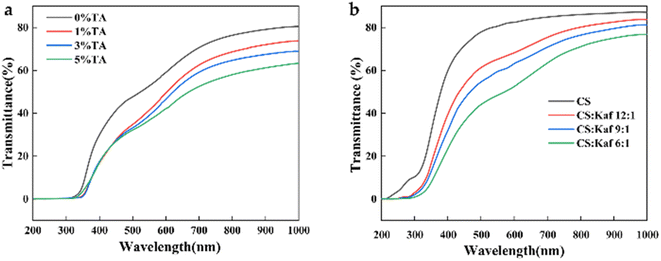
Films, which are commonly utilized as packaging materials, should exhibit excellent barrier properties to visible light to effectively protect various food products from UV radiation.44 Fig. 8(a) shows the trend in light transmittance of composite films with different TA contents: 80.5% for the 0% TA composite film, 73.8% for the 1% TA composite film, 68.9% for the 3% TA composite film, and 63.4% for the 5% TA composite film, with all samples containing 20% GE. The transmittance of the composite films clearly decreases as the TA content increases. In the 200–320 nm range, the light transmittance of all the films is nearly zero. However, in the 320–380 nm range, the UV transmittance of the composite films containing 1%, 3%, and 5% TA is significantly lower than that of the 0% TA composite film, indicating that TA enhances the light barrier performance of the composite films. This enhancement is primarily due to the abundant aromatic amino acids present in TA, which are capable of absorbing ultraviolet radiation, thereby making the film more advantageous for food packaging applications. Fig. 8(b) reveals that the light transmittance of the CS film is 87.1%, whereas for the CS![[thin space (1/6-em)]](https://www.rsc.org/images/entities/char_2009.gif) :
:![[thin space (1/6-em)]](https://www.rsc.org/images/entities/char_2009.gif) Kaf ratio of 12
Kaf ratio of 12![[thin space (1/6-em)]](https://www.rsc.org/images/entities/char_2009.gif) :
:![[thin space (1/6-em)]](https://www.rsc.org/images/entities/char_2009.gif) 1, it is 83.6%; for the 9
1, it is 83.6%; for the 9![[thin space (1/6-em)]](https://www.rsc.org/images/entities/char_2009.gif) :
:![[thin space (1/6-em)]](https://www.rsc.org/images/entities/char_2009.gif) 1 ratio, it is 81.2%; and for the 6
1 ratio, it is 81.2%; and for the 6![[thin space (1/6-em)]](https://www.rsc.org/images/entities/char_2009.gif) :
:![[thin space (1/6-em)]](https://www.rsc.org/images/entities/char_2009.gif) 1 ratio, it is 76.8%. The transmittance in the visible region (300–1000 nm) decreases as the Kaf content increases. Moreover, in the ultraviolet region (200–300 nm), the CS film exhibited a certain level of transmittance, which approached 0% with the addition of Kaf. This phenomenon may be explained by the presence of amino acids in Kaf,45 particularly aromatic amino acids that can absorb UV light. Overall, the incorporation of TA and Kaf enhances the UV resistance of the film, supporting the applicability of this composite film in the field of UV oxidation-resistant food packaging.
1 ratio, it is 76.8%. The transmittance in the visible region (300–1000 nm) decreases as the Kaf content increases. Moreover, in the ultraviolet region (200–300 nm), the CS film exhibited a certain level of transmittance, which approached 0% with the addition of Kaf. This phenomenon may be explained by the presence of amino acids in Kaf,45 particularly aromatic amino acids that can absorb UV light. Overall, the incorporation of TA and Kaf enhances the UV resistance of the film, supporting the applicability of this composite film in the field of UV oxidation-resistant food packaging.
3.7 XRD analysis
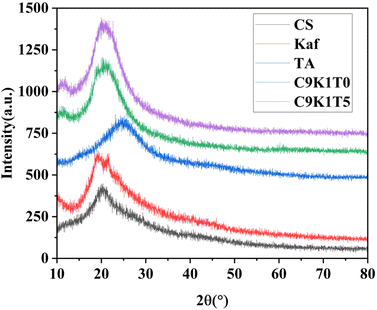
The effect of TA addition on the structure of the composite film was investigated using XRD analysis, and the results are shown in Fig. 9. The diffraction peaks were 2θ = 20.3° for CS, 2θ = 24.3° for TA, and 2θ = 19.2° and 21.7° for Kaf. After adding Kaf, the diffraction peaks of G9K1 were 2θ = 20.63° and 21.65°. With the addition of TA, the diffraction peaks of G9K1T5 were 2θ = 21.05° and 21.91°. The broadening of the diffraction peaks with the addition of Kaf and TA indicates that the composite system forms a tightly ordered structure, and all of them come from the diffraction region of the self-amorphous region. It is proved that the addition of an appropriate amount of TA can effectively promote the improvement of material stability.3.8 XPS analysis
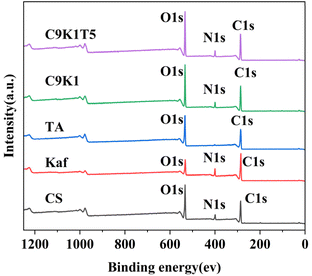
Fig. 10 shows the XPS full spectrum comparison of the composite membrane. As can be seen from Fig. 10, CS showed characteristic peaks of C 1s, N 1s, and O 1s near 286 eV, 399 eV, and 532 eV, respectively. Kaf showed characteristic peaks of C 1s, N 1s, and O 1s near 284 eV, 399 eV, and 531 eV, respectively. TA showed characteristic peaks of C 1s and O 1s near 285 eV and 400 eV, respectively. Compared with CS, C9K1 and C9K1T5 showed additional N 1s absorption peaks at 399 eV. It indicates that CS undergoes effective binding with Kaf and tannic acid. Table 3 shows the surface elemental composition of the composite membranes. The same conclusion can be seen from Table 3.| Elemental content/% | |||
|---|---|---|---|
| Sample | C | N | O |
| CS | 59 | 7.99 | 33.01 |
| Kaf | 73.73 | 10.33 | 15.94 |
| TA | 68.98 | 0 | 31.02 |
| C9K1 | 64.98 | 4.13 | 30.89 |
| C9K1T5 | 63.09 | 4.12 | 32.79 |
4. Conclusions
CS/Kaf biocomposite films were successfully prepared via the sol–gel method, with TA serving as a dispersant and cross-linker and GE serving as a plasticizer. SEM images revealed that Kaf exhibited a small spherical shape within the matrix. The incorporation of TA led to a more homogeneous dispersion and reduced the size of Kaf, which was attributed to the hydrophobic and hydrogen bonding interactions between TA and Kaf. The addition of GE resulted in a smoother film texture. FTIR, XRD and XPS analyses confirm the presence of hydrogen bonding and electrostatic interactions among Kaf, TA, and the CS matrix, as well as interactions between GE and CS. Consequently, the combination of CS, Kaf, and TA had significant synergistic effects on enhancing the tensile properties of the biocomposite films. GE also effectively improved the flexibility of the composite films. The optimal ratios for the composite films were established via RSM (CS![[thin space (1/6-em)]](https://www.rsc.org/images/entities/char_2009.gif) :
:![[thin space (1/6-em)]](https://www.rsc.org/images/entities/char_2009.gif) Kaf: 9
Kaf: 9![[thin space (1/6-em)]](https://www.rsc.org/images/entities/char_2009.gif) :
:![[thin space (1/6-em)]](https://www.rsc.org/images/entities/char_2009.gif) 1, TA: 5%, GE: 20%). Additionally, Kaf and TA contributed to the increased surface hydrophobicity of the CS film due to Kaf's inherent hydrophobic properties and the cross-linking effect of TA on the CS matrix. The contact angle of the films was 98.4° at CS
1, TA: 5%, GE: 20%). Additionally, Kaf and TA contributed to the increased surface hydrophobicity of the CS film due to Kaf's inherent hydrophobic properties and the cross-linking effect of TA on the CS matrix. The contact angle of the films was 98.4° at CS![[thin space (1/6-em)]](https://www.rsc.org/images/entities/char_2009.gif) :
:![[thin space (1/6-em)]](https://www.rsc.org/images/entities/char_2009.gif) Kaf: 6
Kaf: 6![[thin space (1/6-em)]](https://www.rsc.org/images/entities/char_2009.gif) :
:![[thin space (1/6-em)]](https://www.rsc.org/images/entities/char_2009.gif) 1 and 111.8° at 5% TA incorporation. Furthermore, TA and Kaf also reduced the UV transmittance of the composite films, which was 76.81% at CS
1 and 111.8° at 5% TA incorporation. Furthermore, TA and Kaf also reduced the UV transmittance of the composite films, which was 76.81% at CS![[thin space (1/6-em)]](https://www.rsc.org/images/entities/char_2009.gif) :
:![[thin space (1/6-em)]](https://www.rsc.org/images/entities/char_2009.gif) Kaf: 6
Kaf: 6![[thin space (1/6-em)]](https://www.rsc.org/images/entities/char_2009.gif) :
:![[thin space (1/6-em)]](https://www.rsc.org/images/entities/char_2009.gif) 1 and 63.36% at 5% TA. When this is attributed to the fact that they contain a large number of amino acids that are capable of absorbing UV radiation.
1 and 63.36% at 5% TA. When this is attributed to the fact that they contain a large number of amino acids that are capable of absorbing UV radiation.
Data availability
All relevant data are within the paper.Conflicts of interest
There are no conflicts to declare.References
- J. E. Viloria Angarita, D. Insuasty, J. D. Rodríguez M, J. I. Castro, C. H. Valencia-Llano, P. A. Zapata, J. Delgado-Ospina, D. P. Navia-Porras, A. Albis and C. D. Grande-Tovar, RSC Adv., 2024, 14, 13565–13582 RSC.
- S. Lv, S. Zhang, J. Zuo, S. Liang, J. Yang, J. Wang and D. Wei, Int. J. Biol. Macromol., 2023, 242, 124915 CrossRef CAS PubMed.
- H. Haghighi, S. Biard, F. Bigi, R. De Leo, E. Bedin, F. Pfeifer, H. W. Siesler, F. Licciardello and A. Pulvirenti, Food Hydrocolloids, 2019, 95, 33–42 CrossRef CAS.
- S. M. Ojagh, M. Rezaei, S. H. Razavi and S. M. H. Hosseini, Food Chem., 2010, 120, 193–198 CrossRef CAS.
- E. Portes, C. Gardrat, A. Castellan and V. Coma, Carbohydr. Polym., 2009, 76, 578–584 CrossRef CAS.
- L. Sánchez-González, C. González-Martínez, A. Chiralt and M. Cháfer, J. Food Eng., 2010, 98, 443–452 CrossRef.
- S. Jiang, C. Qiao, X. Wang, Z. Li and G. Yang, RSC Adv., 2022, 12, 3969–3978 RSC.
- Y. A. Hassan, M. Y. Alfaifi, A. A. Shati, S. E. I. Elbehairi, R. F. M. Elshaarawy and I. Kamal, J. Drug Delivery Sci. Technol., 2022, 69, 103151 CrossRef CAS.
- D. Lu, X. Liu, J. Shao, Z. Wang, Z. Li, S. Ren, X. Lan and W. Liu, Ind. Crops Prod., 2024, 218, 118959 CrossRef CAS.
- A. M. Nasr, S. M. Aboelenin, M. Y. Alfaifi, A. A. Shati, S. E. I. Elbehairi, R. F. M. Elshaarawy and N. H. A. Elwahab, Pharm., 2022, 14, 1319 CAS.
- Z. Quan, C. Luo, B. Zhu, C. Zhao, M. Yang, M. Bjørås, K. Zhu and A.-L. Kjøniksen, RSC Adv., 2021, 11, 10121–10129 RSC.
- M. A. Zein, B. H. Asghar, A. M. Almohyawi, N. F. Alqahtani, A. Ahmed, J. Alkabli, R. F. M. Elshaarawy and L. A. Ismail, React. Funct. Polym., 2024, 194, 105791 CrossRef CAS.
- I. Kamal, A. I. M. Khedr, M. Y. Alfaifi, S. E. I. Elbehairi, R. F. M. Elshaarawy and A. S. Saad, Int. J. Biol. Macromol., 2021, 188, 523–533 CrossRef CAS.
- J. N. Bueno, E. Corradini, P. R. de Souza, V. d. S. Marques, E. Radovanovic and E. C. Muniz, Polym. Test., 2021, 101, 107279 CrossRef CAS.
- G. Lookhart and S. Bean, Handbook of Cereal Science Technology, Revised and Expanded, 2000, pp. 363–383 Search PubMed.
- T. J. Schober, S. R. Bean, M. Tilley, B. M. Smith and B. P. Ioerger, J. Cereal Sci., 2011, 54, 241–249 CrossRef CAS.
- A. Oom, A. Pettersson, J. R. Taylor and M. Stading, J. Cereal Sci., 2008, 47, 109–116 CrossRef CAS.
- Z. Ye, Y. Wang, P. Shen, L. M. C. Sagis and J. Landman, Food Hydrocolloids, 2024, 156, 110254 CrossRef CAS.
- S. Song, L. Zhong, Y. Wei, Y. Li, L. Tao and L. Yu, LWT--Food Sci. Technol., 2023, 177, 114591 CrossRef CAS.
- Y. Cai, X. Deng, T. Liu, M. Zhao, Q. Zhao and S. Chen, Food Hydrocolloids, 2018, 79, 391–398 CrossRef CAS.
- Y. Du, J. Sun, L. Wang, C. Wu, J. Gong, L. Lin, R. Mu and J. Pang, Int. J. Biol. Macromol., 2019, 137, 1076–1085 CrossRef CAS.
- M. Kouhi, M. P. Prabhakaran and S. Ramakrishna, Trends Food Sci. Technol., 2020, 103, 248–263 CrossRef CAS.
- J. Serrano, R. Puupponen-Pimiä, A. Dauer, A. M. Aura and F. Saura-Calixto, Mol. Nutr. Food Res., 2009, 53, S310–S329 CrossRef PubMed.
- K.-T. Chung, T. Y. Wong, C.-I. Wei, Y.-W. Huang and Y. Lin, Crit. Rev. Food Sci. Nutr., 1998, 38, 421–464 CrossRef CAS PubMed.
- Y. Zou, J. Guo, S.-W. Yin, J.-M. Wang and X.-Q. Yang, J. Agric. Food Chem., 2015, 63, 7405–7414 CrossRef CAS.
- R. Li, S. Peng, R. Zhang, T. Dai, G. Fu, Y. Wan, C. Liu and D. J. McClements, Food Res. Int., 2019, 123, 266–275 CrossRef CAS PubMed.
- Z. Tong, B. Lyu, D. Gao, J. Ma and Y. Zhang, Int. J. Biol. Macromol., 2024, 277, 134184 CrossRef.
- S. Y. Park, S. Kim, S. Y. Shin, W. K. Cho and K. M. Huh, Chem. Eng. J., 2024, 493, 152286 CrossRef CAS.
- M. Che, H. Su, X. Zhao, D. Fu, R. Huang, X. Guo and R. Su, RSC Adv., 2023, 13, 34371–34377 RSC.
- J. F. Martucci, A. Accareddu and R. A. Ruseckaite, J. Mater. Sci., 2012, 47, 3282–3292 CrossRef CAS.
- J.-W. Rhim, A. Gennadios, C. L. Weller, C. Cezeirat and M. A. Hanna, Ind. Crops Prod., 1998, 8, 195–203 CrossRef CAS.
- S. Li, H. Lyu, Y. Wang, X. Kong, X. Wu, L. Zhang, X. Guo and D. Zhang, Polym., 2023, 15, 2380 CAS.
- J. F. Fundo, R. Fernandes, P. M. Almeida, A. Carvalho, G. Feio, C. L. M. Silva and M. A. C. Quintas, Food Chem., 2014, 144, 2–8 CrossRef CAS.
- R. A. Buffo, C. L. Weller and A. Gennadios, Cereal Chem., 1997, 74, 473–475 CrossRef CAS.
- Y. Lei, H. Wu, C. Jiao, Y. Jiang, R. Liu, D. Xiao, J. Lu, Z. Zhang, G. Shen and S. Li, Food Hydrocolloids, 2019, 94, 128–135 CrossRef CAS.
- S. Bhuvaneshwari, D. Sruthi, V. Sivasubramanian, K. Niranjana and J. Sugunabai, Int. J. Eng. Res. Ind. Appl., 2011, 1, 292–299 Search PubMed.
- V. Rubentheren, T. A. Ward, C. Y. Chee and P. Nair, Cellulose, 2015, 22, 2529–2541 CrossRef CAS.
- C. Sun, Y. Gao and Q. Zhong, Food Hydrocolloids, 2018, 82, 173–185 CrossRef CAS.
- J. Xiao, S. Nian and Q. Huang, Food Hydrocolloids, 2015, 51, 166–175 CrossRef CAS.
- Z. Huang, L. Liao, D. J. McClements, J. Li, R. Li, Y. Zou, M. Li and W. Zhou, LWT--Food Sci. Technol., 2022, 154, 112814 CrossRef CAS.
- A. Vejdan, S. M. Ojagh, A. Adeli and M. Abdollahi, LWT--Food Sci. Technol., 2016, 71, 88–95 CrossRef CAS.
- S. Saini, T. Sharma, A. Jain, H. Kaur, O. Katare and B. Singh, Colloids Surf., B, 2021, 205, 111838 CrossRef CAS PubMed.
- B. Drużyńska, J. Łukasiewicz, E. Majewska and R. Wołosiak, Antioxidants, 2024, 13, 414 CrossRef.
- J. Xiao, S. Nian and Q. Huang, Food Hydrocolloids, 2015, 51, 166–175 CrossRef CAS.
- M. Emmambux, M. Stading and J. Taylor, J. Cereal Sci., 2004, 40, 127 CrossRef CAS.
| This journal is © The Royal Society of Chemistry 2025 |


