 Open Access Article
Mass production of ultrasmall Mn3O4 nanoparticles for glutathione responsive off-on T1/T2 switching magnetic resonance imaging and tumor theranostics
Qinghua Xieae,
Gaorui Zhangbc,
Dawei Zhoubc,
Hong Liu ad,
Dexin Yu
 *bc and
Jiazhi Duan
 *ad
*ad
aState Key Laboratory of Crystal Materials, Shandong University, Jinan, Shandong 250100, P.R. China. E-mail: jiazhiduan_sdu@163.com
bDepartment of Radiology, Qilu Hospital of Shandong University, Jinan, Shandong 250012, China. E-mail: yudexin0330@sina.com
cTranslational Medicine Research Center in Nano Molecular and Functional Imaging of Shandong University, Jinan, 250100, China
dInstitute for Advanced Interdisciplinary Research, University of Jinan, Jinan 250022, P. R. China
eShandong BIOBASE Biology Co., Ltd, China
First published on 23rd January 2025
Abstract
Individual theranostics with an integrated multifunction holds considerable promise for clinical application compared with multicomponent regimes. Mn3O4 nanoparticles with an ultrasmall size (4 nm) and mass production capability were developed with dual function of integrated tumor magnetic resonance imaging (MRI) and therapy. The high valence state of Mn3O4 nanocrystals enables a sensitive reaction with the glutathione (GSH) molecule and favorable decomposition ability, which further induces a unique, favorable, variable T1 turn-off and T2 turn-on MRI property. In addition, ultrasmall Mn3O4 nanoparticles reacted with high-level GSH in the tumor microenvironment induces responsive and enhanced variable T1- and T2-MRI imaging capability for accurate cancer diagnosis. Moreover, the synthesized ultrasmall Mn3O4 nanoparticles exhibit considerable ferroptosis effect towards tumor cells and excellent in vivo biocompatibility, thus indicating promising effective cancer treatment application. The developed ultrasmall Mn3O4 nanoparticles with integrated dual functions of GSH-responsive variable T1 and T2 MRI imaging effects and ferroptosis capability show promising potential as a candidate for tumor theranostics in clinical applications.
1. Introduction
The current epidemiology of cancer shows that the incidence rate and mortality rate of cancer are increasing annually.1,2 The accurate diagnosis of cancer, especially in the early stage, is of great importance for its treatment.3 Among the various diagnostic techniques, MRI has been recognized as one of the most powerful medical diagnostic tools with comprehensive and detailed detection ability in the clinic.4,5 MRI is proposed as an effective noninvasive method with high spatial resolution and real-time monitoring capability, which can reflect whole tumor biological features and account for accurate diagnosis and treatment.6,7 In addition, numerous recent preclinical studies report that the combination of MRI detection and tumor therapy holds great promise for enhancing both cancer treatment efficiency and effectiveness.8–10 Although MRI tests possess huge advantages, their sensitivity and resolution ratio for differentiating various diseases in some cases remains to be improved using a well-designed contrast agent.11,12 Therefore, developing advanced MRI contrast agents integrated with high cytotoxicity towards tumor cells has become one of the most urgent tasks for improving the efficiency of synergistic MRI diagnosis and cancer treatment.13–15Manganese-based nanomaterials, a hot research target in recent years, have aroused considerable interest from researchers owing to their unique characteristic and broad application in biology and medicine, especially for tumor MRI theranostics.16–18 According to the MRI principle, MRI contrast agents are generally classified into two types: positive and negative signal improvements, which are T1- and T2-weighted MRI, respectively.19,20 Moreover, the integration of T1- and T2-mode MRI in one operation in the clinic could immensely promote diagnosis accuracy and efficiency.21 Previous research has shown that Mn-based nanomaterials including MnO, Mn3O4 and MnO2 possess an ideal T1-mode MRI enhancement ability, thus enabling the development of a competitive alternative contrast agent.22–24 Nevertheless, the development strategy for Mn-based nanomaterials for T1 and T2 dual-mode MRI mainly relies on combination with the T2 MRI contrast agent of Fe3O4, which requires a rigorous process and extensive work. The translation of an Mn-based T1 and T2 dual-mode MRI agent to clinical application is challenging as there exist many obstacles that need to be overcome, including scaling up the production, improving stability and exporting the standard.25 Furthermore, Mn-based nanomaterials have been utilized for tumor treatment for their effective antitumor effect, negligible immunogenicity, and excellent MRI contrast enhancement.26,27 The tumor microenvironment is usually characterized by a high level of glutathione (GSH) and H2O2. Based on these features, the development of Mn-based nanomaterials as tumor microenvironment responsive nanoagents for both tumor T1/T2 MRI and therapy can help enhance cancer treatment and promote their clinical translation.28,29
Herein, we well designed advanced theranostic ultrasmall Mn3O4 nanoparticles that possess tumor microenvironment responsive off-on T1/T2 switching MRI imaging capability and an effective ferroptosis therapy effect. The synthesized ultrasmall Mn3O4 nanoparticles are about 4 nm in size with excellent uniformity and mass production ability. The high valence state Mn in Mn3O4 nanocrystals offer the effective glutathione (GSH) responsive ability and variable MRI imaging property. The sensitive reaction of ultrasmall Mn3O4 nanoparticles with a GSH molecule enable the functional T1 turn-off to T2 turn-on MRI switching effect, which furnish better signal quality and diagnose accuracy in an in vitro and in vivo environment. Moreover, ultrasmall Mn3O4 nanoparticles could effectively induce the ferroptosis effect to tumor cells with favorable in vivo biocompatibility. The finely developed individual ultrasmall Mn3O4 nanoparticles with an integrated responsive MRI effect and ferroptosis function make it an ideal candidate for tumor theranostics in the clinic.
2. Experimental methods
2.1 Mass production and modification of ultrasmall Mn3O4 nanoparticles
Oleylamine, oleyl alcohol, dimercaptosuccinic acid (DMSA), manganese(II) acetate tetrahydrate and anhydrous sodium carbonate were purchased from Shanghai Macklin Biochemical Co. Ltd Ethanol, tetrahydrofuran and n-hexane were purchased from Sinopharm Chemical Reagent Co. LtdUltrasmall Mn3O4 nanoparticles were synthesized according to previous research with some modifications.30 Briefly, 60 g oleylamine, 100 g oleyl alcohol and 300 mL 1-octadecene were mixed with 4.9 g manganese(II) acetate tetrahydrate. The mixture was then homogenized and slowly heated to 100 °C. Thereafter, 2 mL manganese acetate tetrahydrate aqueous (0.1 M) was added to the solution. The reaction was maintained for 30 min and then cooled to room temperature. Mn3O4 nanoparticles were obtained by adequately washing the solution with ethanol and n-hexane.
Ultrasmall Mn3O4 nanoparticles were modified with the DMSA molecule to endow better dispersity in water. Briefly, 10 mg of the obtained Mn3O4 nanoparticles were added to 1 mL tetrahydrofuran, and 10 mg DMSA was added to 1 mL anhydrous sodium carbonate aqueous. The two solutions were well mixed and applied for ultrasonic treatment for 30 min. Mn3O4-DMSA was purified via centrifugation and the freeze-drying process.
2.2 Characterization
The size and morphology of the synthesized nanomaterials were detected using TEM and HRTEM (JEM-2100, JEOL, Tokyo, Japan). The structure information of the nanomaterials was tested using XRD (D8 Advance, Bruker, Ettlingen, Germany). The atomic valence and element composition information were characterized through XPS. FTIR spectroscopy (Nicolet Nexus 670, Thermo Fisher Scientific, Inc., Waltham, MA) was used to characterize the functional group of nanomaterials. Size distribution and zeta potential value were tested using a Malvern Zetasizer Nano Series. The absorbance spectrum of nanomaterials was characterized using a UV–vis spectrophotometer (UV-6100, Meipuda, Xi'an, China). The MRI property was tested using a 3.0-T clinical MRI scanner (GE Signa HDx 3.0 T MRI, USA) in a 16-channel brain coil.2.3 Cells and animals
Mouse 4T1 cells were obtained from the Institute of Biochemistry and Cell Biology (Shanghai, China). Experiment mice (BALB/c, male) were acquired from Jinan Peng Yue Laboratory Animal Co., Ltd, Jinan, China. The 4T1 cells and mice were cultured as per manufacturer instructions. All mouse research has the approbation of Laboratory Animal Ethical and Welfare Committee of Shandong University, Cheeloo College of Medicine, China (accreditation number: SYXK:20190005) and was performed in line with the guidelines.The subcutaneous tumor-bearing model was constructed by injecting 1 × 10⁶ 4T1 cells in the right hind leg of BALB/c male mice (6–8 week-old). The liver metastatic tumor model was constructed by injecting 5 × 10⁴ 4T1 cells in 2 mL normal saline into the tail vein of mice.
2.4 MRI property measurement
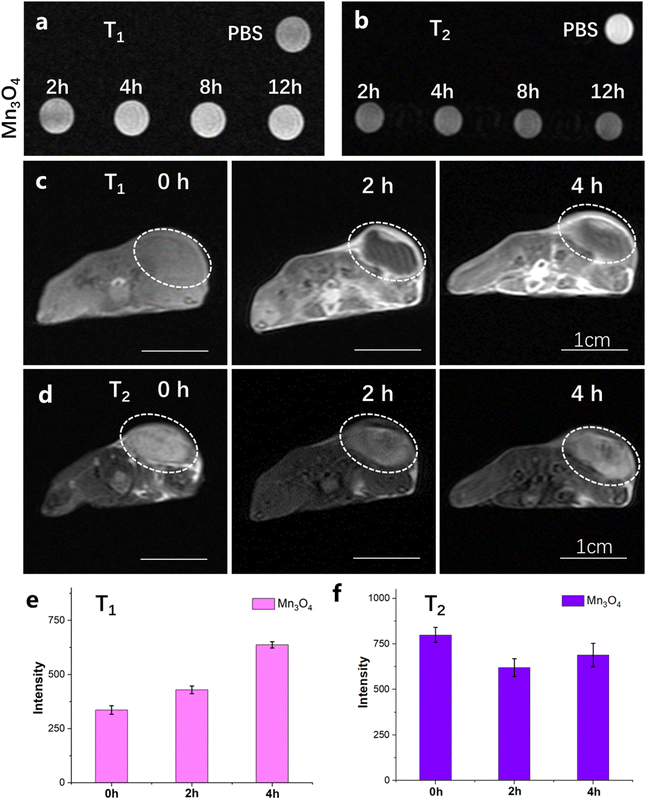
The T1 and T2 MRI imaging and relaxivity property of ultrasmall Mn3O4 nanoparticles (6.25, 12.5, 25, 50, 100, and 200 μg mL−1) were tested using a 3.0-T MR scanner. Furthermore, 5 mM and 10 mM GSH were reacted with ultrasmall Mn3O4 nanoparticles (6.25, 12.5, 25, 50, 100, and 200 μg mL−1), and MRI imaging and relaxivity were recorded using the same method. The T1 and T2 MRI imaging abilities of ultrasmall Mn3O4 nanoparticles for cancer cells (4T1) were assessed by incubating 4T1 cells with 50 μg mL−1 Mn3O4 nanoparticles for 2 h, 4 h, 8 h, and 12 h. The treated 4T1 cells were resuspended in 1 mL of the cell culture medium and characterized using an MRI scanner.The in vivo MRI imaging effect of ultrasmall Mn3O4 nanoparticles was verified in both the 4T1 subcutaneous tumor and liver metastatic tumor models. The tumor-bearing mouse was treated with 5 mg kg−1 ultrasmall Mn3O4 nanoparticles through intravenous injection and then examined using an MRI scanner; the obtained images and signal intensity were recorded at the time points of 0, 2 and 4 h.
2.5 Cell viability assay of ultrasmall Mn3O4 nanoparticles
The cell viability of ultrasmall Mn3O4 nanoparticles was tested using live/dead staining. 4T1 cells were cocultured with Mn3O4 nanoparticles (6.25, 12.5, 25, and 50 μg mL−1) for 24 h and then stained with a live/dead regent, and the cells were observed using an inverted fluorescence microscope. The cytotoxicity of ultrasmall Mn3O4 nanoparticles was assayed using CCK-8 and flow cytometry, and 4T1 cells were cocultured with Mn3O4 nanoparticles (6.25, 12.5, and 25 μg mL−1) for 24 h and then detected using a CCK-8 kit as well as counting the live and dead cells using flow cytometry. The cleaved caspase-3 level in 4T1 cells after incubation with Mn3O4 nanoparticles (6.25, 12.5, and 25 μg mL−1) for 24 h was measured using western blot analysis.2.6 Ferroptosis therapy measurement
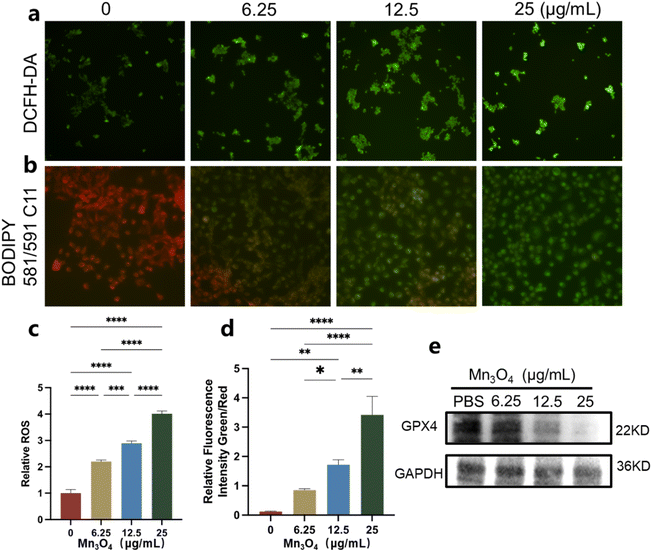
The 4T1 cells were cocultured with Mn3O4 nanoparticles (6.25, 12.5, and 25 μg mL−1) for 24 h and stained using a ferroptosis marker. Dichlorofluorescein diacetate (DCFH-DA, 10 μM) was utilized to detect the intracellular ROS level via incubation with the 4T1 cells for 20 min. The lipid ROS sensor C11 BODIPY581/591 (8 μM) was used to assess the lipid peroxidation level in 4T1 cells, and the treated cells were observed using fluorescence microscopy. The GPX4 level in 4T1 cells after incubation with Mn3O4 nanoparticles was measured using western blot analysis.2.7 Biosafety evaluation
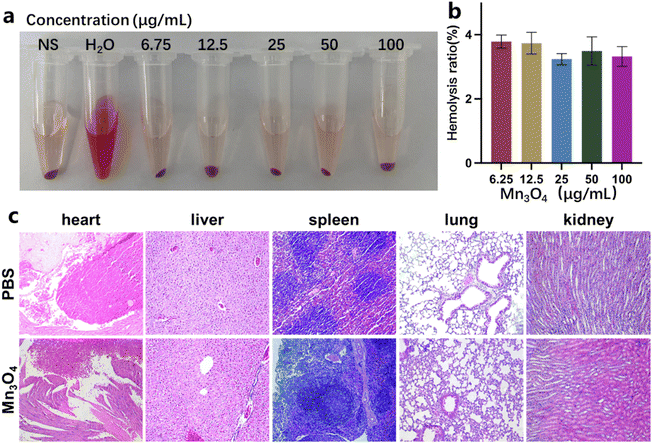
The in vivo biocompatibility of Mn3O4 nanoparticles was assayed before additional MRI and treatment application. The hemolytic property of Mn3O4 nanoparticles (6.25, 12.5, 25, 50, and 100 μg mL−1, experiment group) was tested by comparing the hemolysis rate in the group of isolated red blood cells and the group treated with PBS (positive control) and pure water (negative control). The primary organs of mice after injection with Mn3O4 nanoparticles for 24 h were stained with hematoxylin-eosin (HE), and tissue slicing was observed using fluorescence microscopy.2.8 Statistical analysis
The data were shown as the average ± standard deviation. Comparison between two group statistics was performed using Student's t-test. Comparison in different group statistics was used with the analysis of variance, and the data were defined with *p < 0.05, **p < 0.01 and ***p < 0.001.3. Results and discussion
3.1 Synthesis and characterizations of ultrasmall Mn3O4 nanoparticles
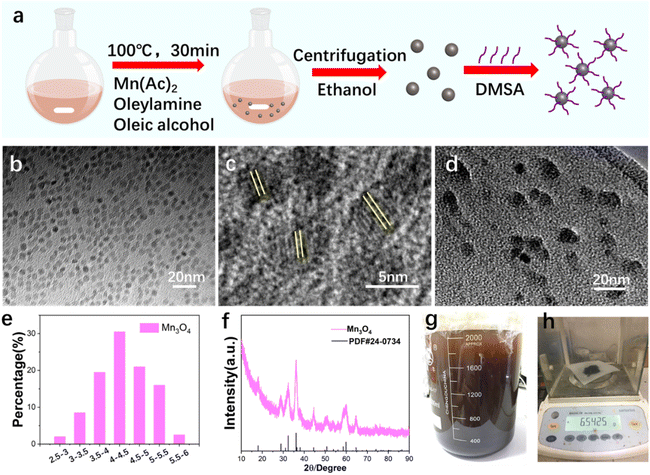
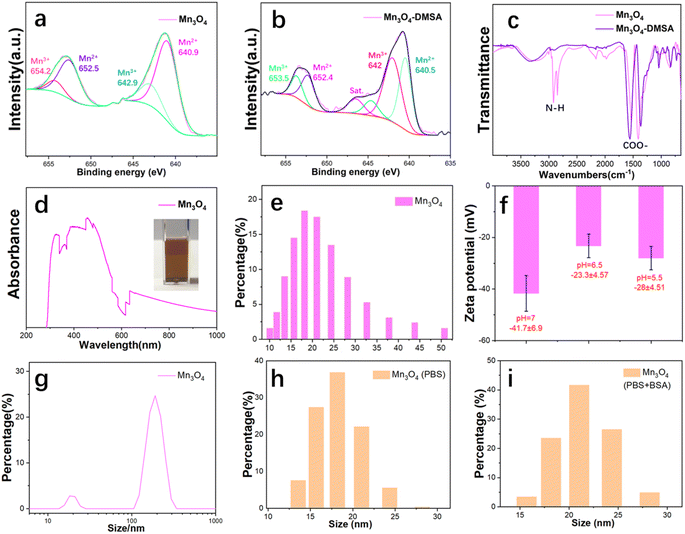
Fig. 1a shows the mass production procedure scheme of ultrasmall Mn3O4 nanoparticles. The size and morphology of the synthesized Mn3O4 nanoparticles were characterized using TEM (Fig. 1b). The TEM result shows that the Mn3O4 nanoparticles are about 4 nm with an ultrasmall size and uniform shape. The enlarged HRTEM image (Fig. 1c) indicates that the obtained ultrasmall Mn3O4 nanoparticles are of good crystallinity. After modification with the DMSA molecule, the Mn3O4 nanoparticles retain their original size and morphology (Fig. 1d). The size distribution statistic of ultrasmall Mn3O4 nanoparticles was analyzed (Fig. 1e), and the result indicates that the size is around 2–6 nm, and the main size is about 4.5 nm. The XRD pattern (Fig. 1f) of the synthesized nanoparticles confirms that nanoparticles are of excellent crystallinity and correspond to the pure Mn3O4 phase (standard PDF card: 24-0734). The washing procedure (Fig. 1g) and final production of 6.54 g of ultrasmall Mn3O4 nanoparticles (Fig. 1h) confirm their large-scale production and clinical translation potential.The DMSA molecule modification endows ultrasmall Mn3O4 nanoparticles with better dispersity, which is essential for their bioapplications. XPS was utilized to analyze the Mn valence state of Mn3O4 (Fig. 2a) and Mn3O4-DMSA (Fig. 2b). XPS spectrum results confirm the existence of Mn2+ and Mn3+ in Mn3O4 and Mn3O4-DMSA, which agrees with the element composition. The DMSA molecule modification of Mn3O4 was further studied using the FTIR spectrum (Fig. 2c). The absorption peaks of Mn3O4 located at 2981.7 and 2849.6 cm−1 correspond to N–H bond stretching vibration, which indicates the existence of the residual oleylamine molecule. For Mn3O4-DMSA, the peaks of N–H vibration disappeared, suggesting the successful substitution of the DMSA molecule with the oleylamine molecule on the surface of Mn3O4 nanoparticles. The synthesized Mn3O4-DMSA nanoparticles show excellent dispersity in water (Fig. 2d, inside) and intense absorbance around 300–600 cm−1 (Fig. 2d). The hydrated particle size (%number) of Mn3O4-DMSA in PBS (Fig. 2e) shows a normal distribution for 10–50 nm and is mainly located at 20 nm, which is beneficial for its utilization as a bioagent in vivo. The zeta potential values of Mn3O4-DMSA in PBS (pH = 7, pH = 6.5 and pH = 5.5) are as high as −41.7 ± 6.9 mV, −23.3 ± 4.57 mV and −28 ± 4.51 mV (Fig. 2f), indicating the nanoparticles are of excellent dispersity and stability in aqueous PBS. The size distribution (%intensity) of Mn3O4-DMSA in PBS in Fig. 2g reveals that most Mn3O4 nanoparticles are monodispersed and there are few aggerates in the aqueous solution. The size distribution (%number) of Mn3O4-DMSA after long-term stability placement (2 weeks) in PBS (Fig. 2h) and PBS + BSA (Fig. 2i) conditions shows similar distribution tendency with small size differences. The hydrated particle size distribution and zeta potential values of Mn3O4-DMSA in different conditions demonstrate its promising bioapplication in vivo.
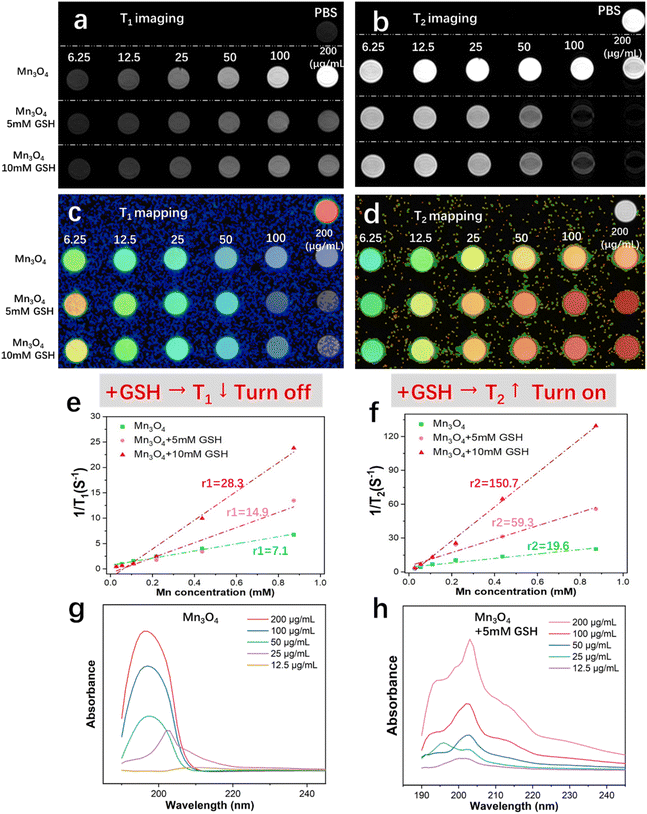
The MRI imaging property of Mn3O4 nanoparticles in vitro was researched in detail. As shown in Fig. 3a, the phantom image of T1-weighted imaging shows an obvious increased lightness as the concentration of Mn3O4 increased from 6.25 to 200 μg mL−1, presenting a typical T1 MRI imaging characteristic. When Mn3O4 was reacted with 5 mM GSH, the phantom image lightness shows a slight increased tendency with increasing concentration and darker intensity compared with the untreated group (pure Mn3O4). As the treatment concentration of GSH increased to 10 mM, the phantom image lightness becomes darker and weaker compared with the treatment of 5 mM GSH, showing a GSH-responsive T1 turn-off effect. The phantom image of T2-weighted imaging is shown in Fig. 3b. The results show that pure Mn3O4 has almost no T2 weight-imaging effect, indicating that Mn3O4 is an effective and pure T1 MRI contrast agent and the state of T2 MRI imaging is off. After treatment with 5 mM and 10 mM, the darkness of T2 imaging becomes deeper as the concentration of GSH increased, indicating a sensitive GSH responsive T2 turn-on property. To summarize, ultrasmall Mn3O4 nanoparticles possess a unique and favorable GSH responsive capability of T1 turn-off and T2 turn-on the MRI switching effect.
The T1 and T2 relaxation times of Mn3O4 nanoparticles treated with the gradient concentration of GSH were measured, and the results were shown as T1 and T2 mapping (Fig. 3c and d). The corresponding r1 and r2 relaxivity values of T1 and T2 relaxation times were calculated from the plots of relaxation time versus Mn3O4 concentration (Fig. 3e and f). The r1 value of T1 MRI imaging in the Mn3O4 group (6.25–200 μg mL−1) is 7.1 mM−1 s−1; with the reaction of 5 mM and 10 mM GSH, the r1 values increase to 14.9 and 28.3 mM−1 s−1, respectively. The r2 value of T2 MRI imaging for the Mn3O4 group (6.25 to 200 μg mL−1) is 19.6 mM−1 s−1; after treatment with 5 mM and 10 mM GSH, r2 values increase to 59.3 and 150.7 mM−1 s−1, respectively. The T1 and T2 MRI mapping and relaxivity values indicate the GSH-responsive T1 turn-off and T2 turn-on property. As Mn3O4 nanoparticles show a brown color and possess obvious light absorption, the UV-vis absorbance spectrum of Mn3O4 nanoparticles at different concentrations (12.5–200 μg mL−1) was obtained (Fig. 3g). Absorption intensity during 180–200 nm increases with an increasing in Mn3O4 concentration. Fig. 3h shows the UV-vis absorbance spectrum of Mn3O4 nanoparticles at different concentrations (12.5–200 μg mL−1) after reaction with 5 mM GSH. These results confirm the intense reaction between Mn3O4 nanoparticles and the GSH molecule as well as MRI variation evidence.
3.2 Cell viability and ferroptosis therapy of ultrasmall Mn3O4 nanoparticles
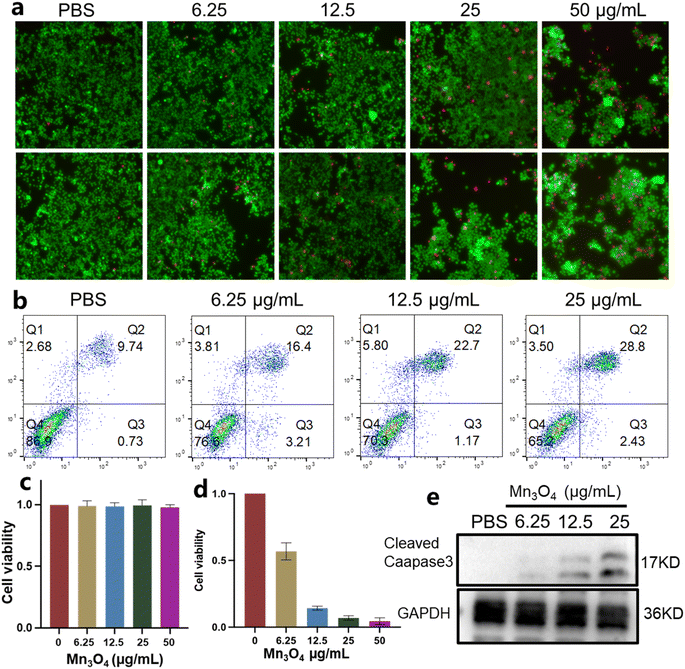
Before ultrasmall Mn3O4 nanoparticles were used as nanomedicine in vivo, their cell viability was assessed. The living/dead staining images of 4T1 cells incubated with 6.25, 12.5, 25 and 50 μg mL−1 Mn3O4 are shown in Fig. 4a. As the concentration of Mn3O4 nanoparticles increase, the numbers of living 4T1 cells decrease and that of the dead cells obviously increase, showing an outstanding antitumor effect. The treated 4T1 cells were analyzed using flow cytometry, and the results are shown in Fig. 4b, which confirms the good antitumor effect of Mn3O4 nanoparticles. The CCK-8 test was utilized to evaluate the biocompatibility of ultrasmall Mn3O4 nanoparticles (Fig. 4c and d). With an increase in Mn3O4 concentration, the cell viability of endothelial cells remains unchanged, but the cell viability of 4T1 cells dramatically decreases, indicating the excellent biocompatibility of ultrasmall Mn3O4 nanoparticles with normal cells and distinct growth inhibition and a toxicity effect towards tumor cells. Cleaved caspase-3 is the typical marker of apoptosis, and the expression level of cleaved caspase-3 indicates the associated apoptosis state of cells. As shown in Fig. 4e, the treatment of Mn3O4 nanoparticles could induce elevated expression of cleaved caspase-3, and the expression level was promoted by increased Mn3O4 concentration. The cell viability assays confirm that ultrasmall Mn3O4 nanoparticles possess obvious cytotoxicity toward tumor cells and an intense antitumor effect.To classify the ferroptosis antitumor mechanism of ultrasmall Mn3O4 nanoparticles, the ROS staining of 4T1 cells treated with Mn3O4 (6.25, 12.5, and 25 μg mL−1) was performed, and the results are shown in Fig. 5a. The corresponding relative fluorescence intensity is shown in Fig. 5c. The ROS level in 4T1 cells after treatment with ultrasmall Mn3O4 nanoparticles is considerably promoted, and the promotion degree rises with the increasing of Mn3O4 concentration. The ultrasmall Mn3O4 nanoparticles could react with GSH and H2O2. Therefore, the increased ROS level is induced using the GSH consumption ability and Fenton-like reaction between ultrasmall Mn3O4 nanoparticles and the high level of intracellular H2O2. For the ferroptosis pathway, the elevated ROS level could induce lipid peroxidation in tumor cells. Therefore, the BODIPY 581/591 C11 of the lipid peroxidation sensor was applied to detect the lipid status in 4T1 cells. The staining result is shown in Fig. 5b, and the corresponding relative fluorescence intensity is shown in Fig. 5d. These statistical data indicate that the ultrasmall Mn3O4 nanoparticles enhance lipid peroxidation in tumor cells. GPX4 in tumor cells could effectively decrease the ROS and lipid peroxidation levels, which could be considered an important marker of ferroptosis. The GPX4 expression level in 4T1 tumor cells after incubation with ultrasmall Mn3O4 nanoparticles (6.25, 12.5, and 25 μg mL−1) is shown in Fig. 5e. With an increase in Mn3O4 concentration, the GPX4 expression level remarkedly decreases, which is induced by an increased ROS level and reduced GSH concentration. These results confirm the efficient ferroptosis antitumor effect of ultrasmall Mn3O4 nanoparticles.
3.3 T1 and T2 MRI signal variation for ultrasmall Mn3O4 nanoparticles in vivo
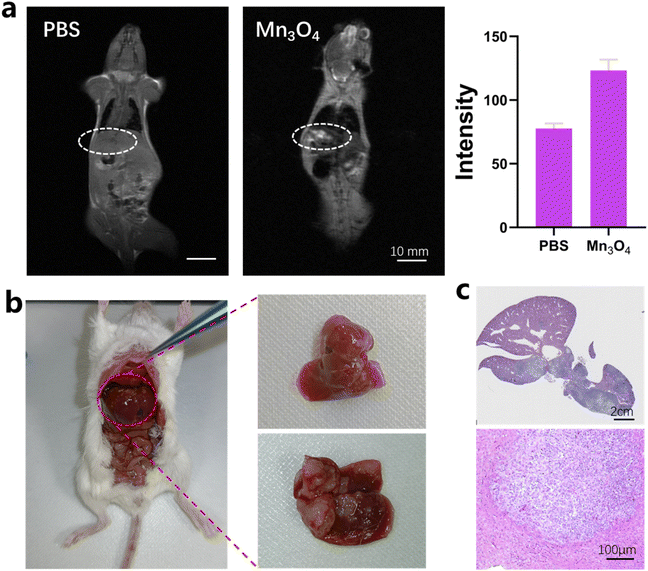
The MRI imaging of 4T1 tumors both in vitro and in vivo using ultrasmall Mn3O4 nanoparticles was characterized in detail. The T1 and T2 MRI imaging properties of 4T1 cells in vitro are shown in Fig. 6a and b. After incubation of 4T1 cells with Mn3O4 nanoparticles for 2, 4, 8 and 12 h, the lightness intensity of T1 MRI image, as shown in Fig. 6a, gradually elevates with increase in incubation time, which is due to the enhanced accumulation of Mn3O4 nanoparticles in 4T1 tumor cells. The darkness of the T2 MRI image in Fig. 6b is distinctly promoted together with the incubation time scale, which could be caused by the reaction with high-level GSH in 4T1 cells. The MRI imaging of ultrasmall Mn3O4 nanoparticles for 4T1 tumor cells identified T1 and T2 MRI variation at the cellular level. The ultrasmall Mn3O4 nanoparticles for in vivo tumor MRI imaging were then detected in the 4T1 subcutaneous tumor. The T1 and T2 MRI imaging and signal variation results of tumors after intravenous injection of Mn3O4 (5 mg kg−1) for 0, 2 and 4 h are shown in Fig. 6c and d, respectively. The corresponding T1 and T2 MRI imaging signal intensity variations are shown in Fig. 6e and f, respectively. After the treatment of Mn3O4 for 2 h and 4 h, the T1 signal intensity increases to 127.6% and 189.6%, respectively, compared with the control group, indicating the effectively enhanced T1 MRI imaging ability. In addition, the T2 signal intensity decreases to 77.5% and 86.1%, respectively, compared with the control group, showing a promoted T2 MRI imaging effect, which could be induced by the high level of GSH in the tumor microenvironment. The in vitro tumor microenvironment mimic condition (5 and 10 mM GSH in Fig. 3) is static without a continued blood flow. After the tail vein injection of Mn3O4, Mn3O4 gradually accumulated in the tumor site and induced the T1 MRI effect. Furthermore, GSH in the tumor environment induced the T1 turn-off and T2 turn-on effect. The cooperative results endow both the T1 turn-on and T2 turn-on effects. In the in vitro mimic condition, no Mn3O4 accumulation process occurs, which directly induces the T1 turn-off and T2 turn-on effects. The MRI imaging results of tumors both in vitro and in vivo collaboratively illustrate the variable T1 and T2 MRI imaging capability of ultrasmall Mn3O4 nanoparticles.Tumor metastasis is the main reason of recurrence and low cure rate of cancer. To excavate the MRI imaging capability of ultrasmall Mn3O4 nanoparticles for tumors, the liver metastatic tumor was applied to perform the evaluation. MRI imaging results after the construction of the liver metastatic tumor model and the intravenous injection of Mn3O4 (5 mg kg−1) are shown in Fig. 7a. The lightness in the liver part shows graininess, and the intensity is significantly enhanced (inside the white circle). Compared with the PBS group, the signal intensity increases 159.7%, which conveys effective MRI detection ability for the metastatic tumor. The real image of the liver metastatic tumor (Fig. 7b) and the corresponding histological tissue sections of the liver and liver metastatic tumor (Fig. 7c) are consistent with the MRI image results, thus positioning ultrasmall Mn3O4 nanoparticles as a promising candidate for overcoming the obstacle of accurate diagnosis for tumor metastasis.
3.4 Biosafety assessment of ultrasmall Mn3O4 nanoparticles
The in vivo biosafety of ultrasmall Mn3O4 nanoparticles is evaluated using the hemolysis ratio and HE staining of main organs. The hemolysis ratio (Fig. 8a and b) of Mn3O4 nanoparticles (6.25, 12.5, 25, 50, and 100 μg mL−1) remains smaller than 4%, revealing a good hemocompatibility for in vivo application. As shown in Fig. 8c, after treatment with Mn3O4 nanoparticles in vivo, the sections from the main organ and tissues have no histological difference compared with the PBS group. Moreover, no histopathological damage, including necrosis and inflammatory response, is observed. These biosafety results demonstrate that the designed ultrasmall Mn3O4 nanoparticles possess excellent biocompatibility in vivo and could be used for further biomedical applications.4. Conclusion
In summary, an effective and novel design of ultrasmall Mn3O4 nanoparticles with an integrated multifunction is proposed. Ultrasmall Mn3O4 nanoparticles with excellent uniformity and stability could be produced on a large scale. The designed Mn3O4 nanoparticles could react and be decomposed by GSH owing to the existence of high valence Mn in the nanocrystals, which endow the responsive capability in the tumor microenvironment. Moreover, the GSH-responsive property enable Mn3O4 with the T1 turn-off and T2 turn-on MRI imaging variation effects and effectively enhance the imaging intensity and quality. The unique T1/T2 MRI imaging could be applied to subcutaneous tumors and liver metastases tumors for promoting accurate tumor diagnosis. Moreover, the ultrasmall Mn3O4 nanoparticles possess an excellent ferroptosis therapy effect toward tumor cells, which presents superb prospects for tumor treatment. The well-designed integrated multifunction in individual ultrasmall Mn3O4 nanoparticles demonstrates an innovative strategy for effective tumor treatment under MRI guidance and holds considerable potential for cancer treatment in the clinic.Data availability
Data will be made available upon reasonable request.Author contributions
Q. H. X. and J. Z. D completed most of the experiments and manuscript. G. R. Z. and D. W. Z. performed partial experiments, including the MRI test and cell staining. H. L. and D. X Y. provided careful guidance and adequate experimental support for this work.Conflicts of interest
The authors declare no known competing financial interests or personal relationships.Acknowledgements
This work was supported by the Key Research and Development Program of Shandong Province (2021CXGC010603) and Shandong Provincial Natural Science Foundation (ZR2023QE146). National Key Research and Development Program of China (2023YFB3210400)References
- Q. He, H. Hu, Q. Zhang, T. Wu, Y. Zhang and K. Li, et al., Chem. Eng. J., 2020, 397, 125478 CrossRef.
- G. Yang, L. Xu, Y. Chao, J. Xu, X. Sun and Y. Wu, et al., Nat. Commun., 2017, 8(1), 902 CrossRef PubMed.
- W. Yang, C. Xiang, Y. Xu, S. Chen, W. Zeng and K. Liu, et al., Biomaterials, 2020, 255, 120186 Search PubMed.
- H. B. Na, J. H. Lee, K. An, Y. I. Park, M. Park and I. S. Lee, et al., Angew. Chem., Int. Ed., 2007, 46(28), 5397–5401 CrossRef PubMed.
- T.-H. Shin, P. K. Kim, S. Kang, J. Cheong, S. Kim and Y. Lim, et al., Nat. Biomed. Eng., 2021, 5(3), 252–263 CrossRef PubMed.
- Y. Luo, J. Yang, J. Li, Z. Yu, G. Zhang and X. Shi, et al., Colloids Surf., B, 2015, 136, 506–513 CrossRef.
- B. H. Kim, N. Lee, H. Kim, K. An, Y. I. Park and Y. Choi, et al., J. Am. Chem. Soc., 2011, 133(32), 12624–12631 CrossRef PubMed.
- S. Zhao, J. Duan, Y. Lou, R. Gao, S. Yang and P. Wang, et al., Nanoscale, 2021, 13(45), 19109–19122 RSC.
- Q. Xie, X. Wang, G. Zhang, D. Zhou, Y. Zhao and H. Liu, et al., Sci. Rep., 2024, 14(1), 10646 CrossRef PubMed.
- Q. Jia, J. Ge, W. Liu, X. Zheng, S. Chen and Y. Wen, et al., Adv. Mater., 2018, 30(13), 1706090 CrossRef.
- D. Wang, H. Wu, W. Q. Lim, S. Z. F. Phua, P. Xu and Q. Chen, et al., Adv. Mater., 2019, 31(27), 1901893 CrossRef.
- L. Gao, Y. Zhang, L. Zhao, W. Niu, Y. Tang and F. Gao, et al., Sci. Adv., 2020, 6(29), eabb1421 CrossRef.
- L. Feng, B. Liu, R. Xie, D. Wang, C. Qian and W. Zhou, et al., Adv. Funct. Mater., 2020, 31(5), 2006216 CrossRef.
- S. I. Han, Sw Lee, M. G. Cho, J. M. Yoo, M. H. Oh and B. Jeong, et al., Adv. Mater., 2020, 32(31), 2001566 CrossRef.
- Y. Chen, Q. Yin, X. Ji, S. Zhang, H. Chen and Y. Zheng, et al., Biomaterials, 2012, 33(29), 7126–7137 CrossRef.
- J. Xiao, X. M. Tian, C. Yang, P. Liu, N. Q. Luo and Y. Liang, et al., Sci. Rep., 2013, 3(1), 2045 CrossRef.
- R. Wei, X. Gong, H. Lin, K. Zhang, A. Li and K. Liu, et al., Nano Lett., 2019, 19(8), 5394–5402 CrossRef.
- Z. Yi, Z. Luo, N. D. Barth, X. Meng, H. Liu and W. Bu, et al., Adv. Mater., 2019, 31(37), 1901851 CrossRef.
- X. Li, S. Lu, Z. Xiong, Y. Hu, D. Ma and W. Lou, et al., Adv. Sci., 2019, 6(19), 1901800 CrossRef.
- S. Bai, N. Yang, X. Wang, F. Gong, Z. Dong and Y. Gong, et al., ACS Nano, 2020, 14(11), 15119–15130 CrossRef PubMed.
- X. Xu, X. Zhou, B. Xiao, H. Xu, D. Hu and Y. Qian, et al., Nano Lett., 2021, 21(5), 2199–2206 CrossRef PubMed.
- J. Shi, W. Yu, L. Xu, N. Yin, W. Liu and K. Zhang, et al., Nano Lett., 2019, 20(1), 780–789 CrossRef.
- H. J. Kwon, K. Shin, M. Soh, H. Chang, J. Kim and J. Lee, et al., Adv. Mater., 2018, 30(42), 1704290 CrossRef PubMed.
- B. Ding, P. Zheng, Pa Ma and J. Lin, Adv. Mater., 2020, 32(10), 1905823 CrossRef.
- Y. Zhan, S. Shi, E. B. Ehlerding, S. A. Graves, S. Goel and J. W. Engle, et al., ACS Appl. Mater. Interfaces, 2017, 9(44), 38304–38312 CrossRef CAS.
- J. Duan, S. Zhao, Y. Duan, D. Sun, G. Zhang and D. Yu, et al., Adv. Healthc. Mater., 2024, 2303963 CrossRef CAS.
- N. Singh, M. A. Savanur, S. Srivastava, P. D'Silva and G. Mugesh, Angew. Chem., Int. Ed., 2017, 129(45), 14455–14459 CrossRef.
- Y. Liu, J. Yang, B. Liu, W. Cao, J. Zhang and Y. Yang, et al., Nano-Micro Lett., 2020, 12(1), 127 Search PubMed.
- X. Zeng, S. Yan, P. Chen, W. Du and B.-F. Liu, Nano Res., 2020, 13(6), 1527–1535 Search PubMed.
- W. Wang, J. Duan, W. Ma, B. Xia, F. Liu and Y. Kong, et al., Adv. Sci., 2023, 10(17), 2205859 Search PubMed.
| This journal is © The Royal Society of Chemistry 2025 |

