 Open Access Article
Multiplex one-step direct asymmetric PCR of blood and dual-labelled probe-mediated melting curve for genotyping of MTHFR and MTRR polymorphisms†
Zhang Zhang *a,
Lian Lib and
Juan Yao
 *b
*b
aDepartment of Neurosurgery, Neurology Center, The First Affiliated Hospital of Hainan Medical University, Haikou, Hainan 571199, PR China. E-mail: cqzhangzhang@gmail.com
bNanobiosensing and Microfluidic Point-of-Care Testing, Key Laboratory of Luzhou, Department of Clinical Laboratory, The Affiliated Traditional Chinese Medicine Hospital, Southwest Medical University, Luzhou, Sichuan 646000, PR China. E-mail: 396497795@qq.com
First published on 2nd January 2025
Abstract
Accurate, rapid, and multiplex SNP analysis holds significant clinical value. However, the inevitable nucleic acid extraction, involving centrifugation, heating, and magnetic separation, is often time-consuming. In this study, direct blood PCR was combined with dual-labelled probe-mediated melting curves to identify SNPs corresponding to MTHFR (C677T, rs#1801133 and A1298C, rs#1801131) and MTRR (A66G, rs#1801394) in a single tube. Our results indicated that nucleic acid extraction does not enhance gDNA concentrations. The results of the gDNA and whole blood samples were perfectly aligned with each other. The maximum volume tolerance for whole blood is 10%. Our method demonstrated robustness to hemolysis and temperature variations. The turnaround time of the test is <100 min with great potential value in clinical settings. Furthermore, this approach eliminates the need for complex preprocessing steps, simplifies the workflow and reduces potential sources of error. The efficiency and accuracy of this method make it a promising tool for routine clinical diagnostics and personalized medical applications. Additionally, the method's reliability and speed are crucial for effective patient management. The ability to obtain results quickly and accurately supports timely treatment decisions, which can be critical in many clinical scenarios. As a result, this technique has the potential to be widely adopted in clinical laboratories due to its practicality and effectiveness.
1. Introduction
Blood is the most readily available and commonly used sample for germline mutation testing in clinical settings. However, hemoglobin and immunoglobulin G in the blood can affect DNA polymerase activity and fluorescence signal intensity.1–3 The factors mentioned above have necessitated sample preparation to obtain pure DNA for nucleic acid analysis for a long time.4–6 However, DNA is typically lost, and multiple manual handling steps and instrument dependence make this approach unideal for forensic evidence with low levels of DNA and point-of-care testing (POCT). To reduce working time, labor costs, the use of plastic materials, and the risk of contamination during nucleic acid extraction, many automatic nucleic acid extraction methods based on magnetic beads and rapid nucleic acid extraction methods, such as direct nucleic acid release, have been applied.7,8 However, these methods require specialized centrifuges and magnetic separation-based automated nucleic acid extraction systems. Therefore, there is a demand for developing a direct PCR for genotyping of blood samples.9–12Due to the unique advantages of real-time kinetic monitoring, closed-tube operation, well-established workflow and a quality control system, real-time PCR-based methods, including TaqMan probe13 and melting curve analysis,14,15 are the main methods used for germline mutation analysis in clinical settings. For instance, a pair of TaqMan probes labelled with different fluorophores that were intended to hybridize with wild or mutated sites were used for an allele. However, using direct probe hybridization to detect SNPs usually requires strict control of the annealing temperatures and other extensive optimizations. Melting analysis-based SNP genotyping utilizes the difference in the melting curve between various SNP sites, typically involving intercalating fluorescent dye (such as Eva Green,16 LC Green17) to saturate double-stranded DNA and dual-labelled probe methods (such as molecular beacon,18 TaqMan probe,19 hybridization probe20 and LNA21). For the dye-based method, the length of PCR products should be short to magnify the thermodynamic effects generated from the SNP sites. Additionally, natural polymorphisms near the target region might influence the Tm value and cause false positive or negative results. The probe-based method uses ∼20 nt-long dual-labelled probes for hybridization to the target region, leading to a difference of 5 to 10 °C in the Tm values of the matched and mismatched probes. This merit makes it more compatible and comparable with different PCR instruments and wells. Plasmid DNA containing the target sequences is widely used as a positive control. However, due to the extremely high concentrations, it may cause aerosol pollution in diluent operations. Considering this, plasmids were abandoned, and blood samples were directly used for PCR.
Folic acid metabolism22 has a strong correlation with homocysteine metabolism as it affects the concentration of homocysteine in vivo. Hyperhomocysteinemia has been associated with an increased risk of cleft palate, neural tube defects in newborns, hypertensive disorders, preterm birth, and increased severity of stroke with H-type hypertension.23,24 The enzymes, methylenetetrahydrofolate reductase (MTHFR) and methionine synthase reductase (MTRR), play an important role in folate metabolism.25 Simultaneous detection of SNPs corresponding to MTHFR (C677T, rs#1801133 and A1298C, rs#1801131) and MTRR (A66G, rs#1801394) provides a comprehensive screening method for deficiencies in folic acid metabolism.
SNP analysis methods mainly include sequencing,26 hybridization-based microarray,27 and real-time fluorescence PCR.28 Sequencing and microarray approaches require expensive equipment and specialized data interpretation, as well as a complicated post-analysis of the PCR products, which may lead to contamination. PCR is the commonly used method in clinical practice, mainly due to the recognition of SNP sites by labelled probes. Information on mutated, wild, or heterozygous SNPs is usually judged based on the Ct values and melting curves. The detection method based on the Ct value requires two probes labelled with two fluorophores, which is not suitable for the detection of multiple sites. For the melting curve, our published work demonstrated that only a single probe is needed for each SNP site.29 Therefore, probe-based melting analysis is more suitable for multiplex SNP analysis.
In this work, we have developed multiplex dual-labelled probes to mediate real-time fluorescence PCR and performed a melting curve analysis of C677T, A1298C, and A66G polymorphisms. EDTA-K2 anticoagulant blood was directly added to the PCR system without pretreatment. By using integrated probes labelled HEX, ROX, Cy5 and melting curve analysis in this channel, we successfully analyzed C677T, A1298C and A66G polymorphisms.
2. Experimental
2.1. Materials and reagents
Primers and dual-labelled probes were synthesized and purified using PAGE or HPLC from Sangon Biotech (Shanghai, China). They were further diluted to 10 μM. Their sequences are listed in Table S1.† SLAN 96 S (HONGSHI, China) real-time PCR instrument and version 8.2.2 software was applied in this study. All experiments were performed in a standard PCR laboratory using standard precautions to prevent contamination. Air-Dryable™ Direct DNA qPCR Blood mix (Meridian Bioscience, USA), 2× Hieff® Blood Direct TaqMan qPCR Master Mix (Yeasen Biotech Co., China), 2× Blood SuperDirect™ PCR Kit (UNG)-EDTA (FOREGENE, Biotech Co., China), HPLC purified water and 8-strip PCR tubes (0.2 mL) were used in the experiments. All PCR experiments were performed in standard PCR laboratory areas for reagent preparation, sample preparation and PCR amplification. Graphical representation is obtained using Origin 2021 software.2.2. Blood sample collection
Fifty blood samples were collected using EDTA-K2 anticoagulant in strict compliance with relevant laws and guidelines. All experiments adhered to the institutional guidelines of The Affiliated Traditional Chinese Medicine Hospital of Southwest Medical University. The experiments were approved by the research ethics committees of this institution. The ethics declaration was in full accordance with the Declaration of Helsinki. gDNA was extracted using the automated magnetic bead method (Zeesan Biotech Co.), and the concentration of gDNA ranged from 33.6 to 63.5 ng μL−1. Blood samples were analyzed in an automated hematology analyzer (Sysmex XN-1000, Japan), and leukocyte numbers were recorded (yield from 2.51 to 12.19 × 10³ μL−1, Table S4†).2.3. Primers and probes design
Primers were designed using the Primer-BLAST NCBI server (https://www.ncbi.nlm.nih.gov/tools/primer-blast/). Four hundred nucleotides were inserted on either side of the mutations of interest, namely C677T, A1298C, and A66G, as input. The amplicon size was set to be between 100 and 300 nucleotides. The primer melting temperatures (Tm) ranged from 59 to 61 °C. The NUPACK Web Server was employed for the prediction of nucleic acid folding and hybridization. Probe design is of crucial importance for the detection of SNP alleles. The length of the probe should be neither too long nor too short. A longer probe may lead to no difference in the melting curve for alleles, while a short probe may not hybridize to the target containing the SNP sites. Considering these factors and to ensure hybridization with the template at the annealing temperature and identify the SNPs with high accuracy, probes were designed to be ∼20 nt-long, where the SNP loci were located in the middle of the probe.2.4. Real-time PCR conditions
Multiplex asymmetric PCRs were performed with 20 μL volumes. The reactions contained 5 μL of 4× Air-Dryable Direct DNA qPCR Blood (Meridian Bioscience, USA), three pairs of 100 nM limited primers, 400 nM excess primers, 200 nM dual-labelled probes, 1.5 μL of blood, and HPLC water. All these materials were combined and the final volume was raised to 20 μL. The thermal program included an initial denaturation at 95 °C for 3 min, followed by 50 cycles of amplification at 95 °C for 15 s (denaturation step) and then 60 °C for 30 s (primer annealing and elongation). Fluorescence intensities were recorded in HEX, ROX, and Cy5 at the end of the annealing/elongation step in each cycle. Melting curve analysis of the PCR products was performed from 45 to 80 °C with 0.06 °C s−1 increment.2.5. Sanger sequencing conditions
To verify the genotyping results of the multiplex melting curve analysis, PCR products were subjected to Sanger sequencing. PCR was conducted in a total of 20 μL mixtures containing 10 μL of 2× Taq master mix (Vazyme Biotech Co., Nanjing), 0.4 μL of 10 μM primers, 1 μL of gDNA, and 8 μL of water. The PCR products were sequenced in both directions using the ABI BigDye Terminator Cycle Kit (Applied Biosystems, Foster City, USA) and were visualized using an ABI Prism 3130 Automated DNA Sequencer (Applied Biosystems). Sequencing data were analyzed using SnapGene 5.2 software (https://www.snapgene.com/).3. Results and discussions
3.1. Working procedures and principle
The working procedures were as follows: first, the PCR mixes were prepared in the reagent preparation area. Next, the blood samples were added directly to 8-strip PCR tubes and sealed in the sample preparation area. PCR was run and analyzed in the PCR amplification area. The working principle of multiplex asymmetric PCR melting curve analysis for C677T, A1298C, and A66G is shown in Scheme 1. Multiplex asymmetric PCR was conducted to generate 199, 149, and 161 nt ssDNA products containing rs#1801133, rs#1801131, and rs#1801394 polymorphism sites for probe hybridization. Simultaneously, dual-labelled probes were hybridized with the template, hydrolysed by the polymerase, and their fluorescence signal was recorded in each cycle. When 50 cycles of PCR were finished, the excess un-hydrolyzed dual-labelled probes were hybridized with ssDNA. Additional melting curve analysis was performed in the HEX, ROX, and Cy5 channels. For instance, for C677T analysis in the HEX channel, a melting curve with a single peak at a higher temperature represents the homozygous wild genotype (677CC); a melting curve with a single peak at a lower temperature represents the homozygous mutation genotype (677TT), and a double peak indicates a heterozygous genotype (677CT).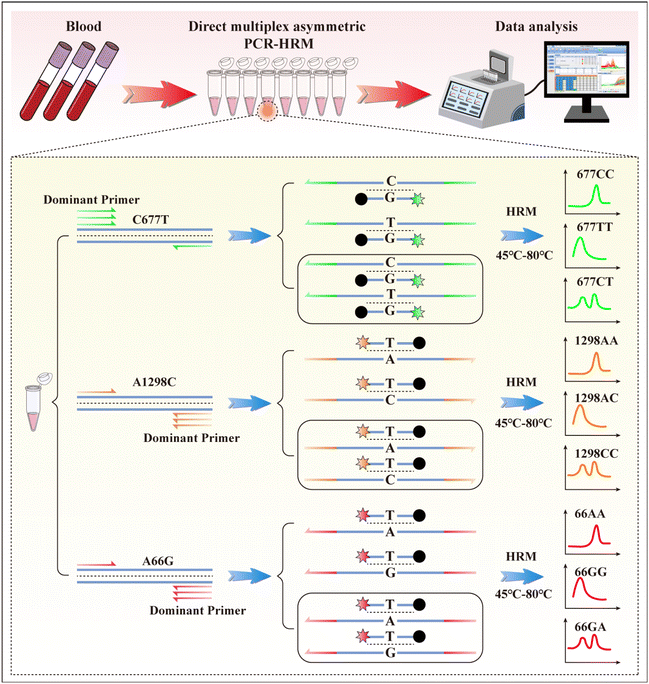 | ||
| Scheme 1 Schematic illustration of direct multiplex PCR of blood samples and dual-labelled probe-based melting curves analysis for genotyping of C677T, A1298T, and A66G. | ||
3.2. Optimization of the PCR mix
Direct blood PCR mix must have strong resistance and adaptability, effectively preventing interference with the background fluorescence and enabling antagonism to endogenous fluorescence quenchers. In addition, polymerase and PCR mixes in various reaction systems should have excellent resistance and adaptability to ensure accurate replication and enzyme activity under complex conditions. Therefore, three types of direct PCR mixes for blood samples from different manufacturers and No. 1 to 6 blood samples were tested for optimization. Fig. 1A and B illustrate the superior performance of the PCR mixture from Meridian Bioscience, with notable excellence in both amplification and melting curves. Table S2† lists the average Tm values and standard deviations for all homozygous samples: the peaks for wild and mutated genotypes of C677T (HEX channel) are at 66.1 °C and 56.1 °C, for A1298G (ROX channel) at 62.1 °C and 54.5 °C, and for A66G (Cy5 channel) at 62.4 °C and 55.1 °C. In contrast, as depicted in Fig. 1C and D, the PCR mixture from Yeasen Biotech. Demonstrated relatively lower melting temperatures (61.0 °C/51.4 °C for HEX, 59.2 °C/49.8 °C for ROX, and 57.8 °C/51.0 °C for Cy5) as compared to those in Fig. 1A and B. The fluorescence intensity for PCR amplification was recorded to be 60 °C, indicating a reduction in hybridization efficiency between the dual-labelled probes and ssDNA targets. As a result, the fluorescence signals in Fig. 1A and B are stronger than those in Fig. 1C and D. Fig. 1E and F show that the PCR mixture from FOREGENE Biotech yields less favorable results as compared to those in Fig. 1A to D. These findings suggest that the choice of PCR mix significantly affects the melting curve profiles and the design of PCR annealing temperatures. Throughout all experiments, the PCR mix from Meridian Bioscience was consistently utilized for genotyping C677T, A1298T, and A66G.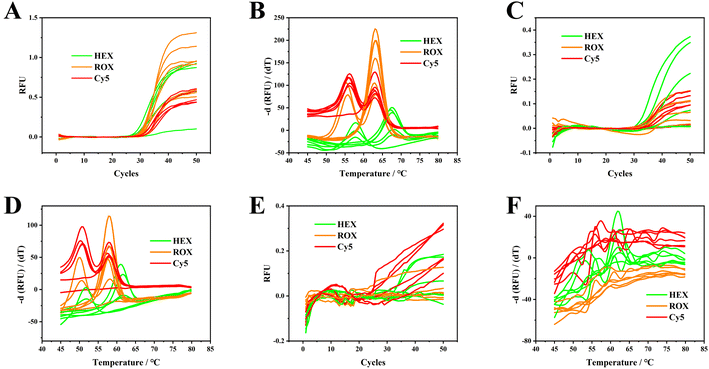 | ||
| Fig. 1 Amplification curves and melting curves for No. 1 to 6 EDTA anticoagulated blood samples. The PCR mixes used here were from Meridian Bioscience (A and B), Yeasen Biotech Co. (C and D) and FOREGENE Biotech Co. (E and F). Original screenshots of the commercial SLAN software for blood and gDNA are shown in Fig. S1 and S2.† | ||
3.3. Typical results of C677T, A1298C, and A66G genotyping
We analyzed samples with typical homozygous mutations, homozygous wild-types, and heterozygous mutations for the C677T (Fig. 2A), A1298C (Fig. 2B), and A66G (Fig. 2C) loci, as confirmed by sequencing. Given that our probe is designed to hybridize with the wild-type sequence, samples with homozygous wild-type and heterozygous mutations exhibited sigmoidal amplification curves. In contrast, samples with homozygous mutations did not show any significant amplification curves. During melting curve analysis, the peak at the higher temperature represented the wild-type genotype, the peak at the lower temperature indicated the mutated genotype, and the presence of two peaks signified a heterozygous genotype. The differences in the Tm of the wild-type and mutated genotypes ranged from 7.3 to 10.0 °C (Table S2†). The significant disparity between the Tm of the wild-type and mutated genotypes validates that our proposed strategy is robust and adaptable, enabling it to seamlessly accommodate the inherent temperature fluctuations that may occur among various PCR machines and across different wells within the same instrument. This high degree of compatibility not only enhances the reliability and consistency of the assay results but also simplifies the process of standardizing protocols across diverse laboratory settings, thereby promoting the generalizability and widespread application of our method in both research and clinical settings.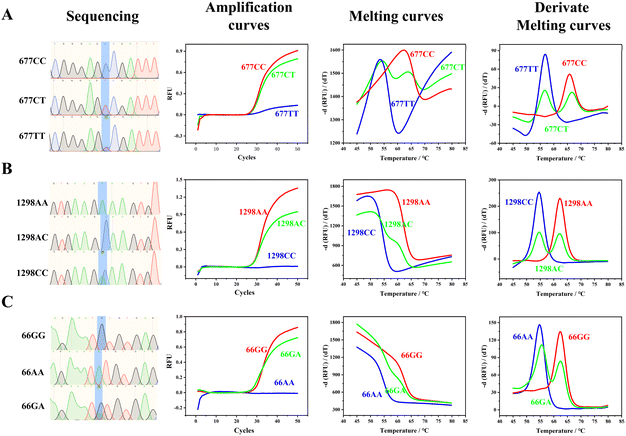 | ||
| Fig. 2 Sanger sequencing, PCR amplification curves, melting curves, and derived melting curves of homozygous mutations, homozygous wild-type, and heterozygous mutations of C677T, A1298C, and A66G. Original screenshots of the commercial SLAN software are shown in Fig. S3.† Typical sequencing results of C677T, A1298C, and A66G loci are shown in Fig. S4 to S12.† | ||
3.4. Verification of gDNA and EDTA-K2 anticoagulant blood clinical specimens
We analyzed 1.5 μL of gDNA and whole blood samples (No. 1–50), as shown in Fig. 3; detailed results are provided in Fig. S4 to S7 and Tables S3 to S5.† Notably, the genotyping results for the C677T, A1298C, and A66G polymorphisms were determined by melting curve analysis, and they demonstrated 100% concordance between gDNA and whole blood samples, underscoring the reliability of using whole blood for genotyping. This perfect alignment in the results is critical because it validates the use of blood samples for genotyping without compromising accuracy. However, we observed that the Ct values for the blood samples were generally lower than those for gDNA, suggesting a difference in amplification efficiency. This variation is likely due to two factors: (1) the nucleic acid extraction process, which purifies gDNA, but may reduce its concentration, and (2) the presence of substances, such as hemoglobin and IgG in the whole blood, which could interfere with amplification efficiency. Furthermore, direct PCR of blood samples allows the direct amplification of target DNA sequences, thereby streamlining the overall process and enhancing detection efficiency. This approach eliminates the need for DNA extraction or pre-treatment of blood samples, which significantly reduces procedural complexity and turnaround time. In clinical diagnostics, direct PCR of blood holds considerable promise for a variety of applications, including genetic disease screening, infectious disease diagnosis, and tumor biomarker detection. The ability to work directly with whole blood samples makes it a powerful tool for real-time, non-invasive diagnostics, offering a rapid and reliable method to detect specific genetic and pathogenic markers.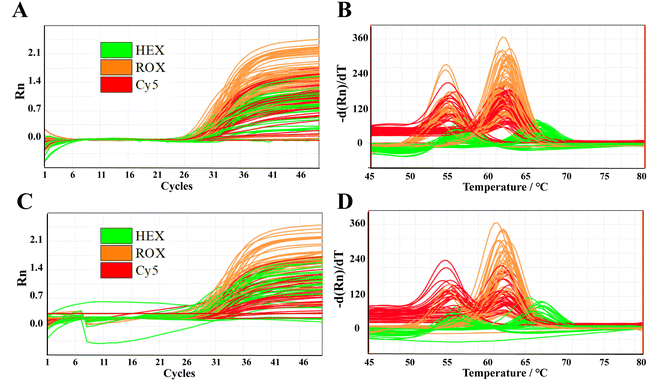 | ||
| Fig. 3 Amplification curves (A and C) and melting curves (B and D) of 50 clinical gDNA and blood samples. Individual results are shown in Fig. S13 to S16.† | ||
3.5. Limit of detection
EDTA-K2 anticoagulated blood was serially diluted to obtain ratios of 1![[thin space (1/6-em)]](https://www.rsc.org/images/entities/char_2009.gif) :
:![[thin space (1/6-em)]](https://www.rsc.org/images/entities/char_2009.gif) 10, 1
10, 1![[thin space (1/6-em)]](https://www.rsc.org/images/entities/char_2009.gif) :
:![[thin space (1/6-em)]](https://www.rsc.org/images/entities/char_2009.gif) 40, 1
40, 1![[thin space (1/6-em)]](https://www.rsc.org/images/entities/char_2009.gif) :
:![[thin space (1/6-em)]](https://www.rsc.org/images/entities/char_2009.gif) 160, and 1
160, and 1![[thin space (1/6-em)]](https://www.rsc.org/images/entities/char_2009.gif) :
:![[thin space (1/6-em)]](https://www.rsc.org/images/entities/char_2009.gif) 320 using sample No. 1 to assess the limit of detection (LOD) of the proposed PCR method. Fig. 4 illustrates that whole blood exhibits reduced amplification efficiency in contrast to the diluted specimens. The use of diluted samples led to an observed delay in obtaining the Ct values. The LOD was established and confirmed through the calculation of positive outcomes from 20 replicate tests at the 1
320 using sample No. 1 to assess the limit of detection (LOD) of the proposed PCR method. Fig. 4 illustrates that whole blood exhibits reduced amplification efficiency in contrast to the diluted specimens. The use of diluted samples led to an observed delay in obtaining the Ct values. The LOD was established and confirmed through the calculation of positive outcomes from 20 replicate tests at the 1![[thin space (1/6-em)]](https://www.rsc.org/images/entities/char_2009.gif) :
:![[thin space (1/6-em)]](https://www.rsc.org/images/entities/char_2009.gif) 320 dilution ratio. The LOD signifies the minimum quantity of original whole blood that can be detected with ≥95% confidence level. Consequently, we contend that a 1
320 dilution ratio. The LOD signifies the minimum quantity of original whole blood that can be detected with ≥95% confidence level. Consequently, we contend that a 1![[thin space (1/6-em)]](https://www.rsc.org/images/entities/char_2009.gif) :
:![[thin space (1/6-em)]](https://www.rsc.org/images/entities/char_2009.gif) 320 dilution of EDTA-K2 anticoagulated blood is detectable with reliability, indicating that approximately 30 leukocytes can be identified per reaction.
320 dilution of EDTA-K2 anticoagulated blood is detectable with reliability, indicating that approximately 30 leukocytes can be identified per reaction.
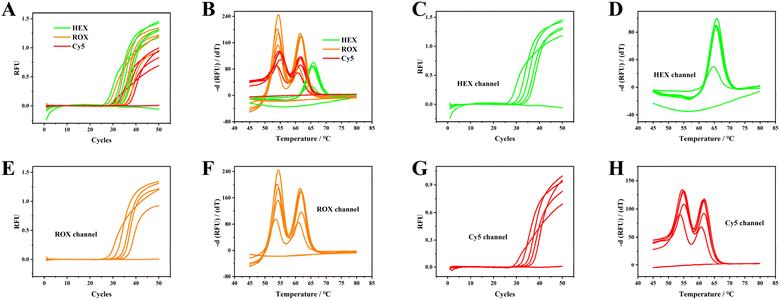 | ||
Fig. 4 Multiplex and individual amplification curves (A, C, E, G) and melting curves (B, D, F, H) of EDTA-K2 anti-coagulated blood with gradients of 1![[thin space (1/6-em)]](https://www.rsc.org/images/entities/char_2009.gif) : :![[thin space (1/6-em)]](https://www.rsc.org/images/entities/char_2009.gif) 10, 1 10, 1![[thin space (1/6-em)]](https://www.rsc.org/images/entities/char_2009.gif) : :![[thin space (1/6-em)]](https://www.rsc.org/images/entities/char_2009.gif) 40, 1 40, 1![[thin space (1/6-em)]](https://www.rsc.org/images/entities/char_2009.gif) : :![[thin space (1/6-em)]](https://www.rsc.org/images/entities/char_2009.gif) 160, and 1 160, and 1![[thin space (1/6-em)]](https://www.rsc.org/images/entities/char_2009.gif) : :![[thin space (1/6-em)]](https://www.rsc.org/images/entities/char_2009.gif) 320 dilutions of EDTA-K2-treated blood. Original screenshots of the commercial SLAN software are shown in Fig. S17.† 320 dilutions of EDTA-K2-treated blood. Original screenshots of the commercial SLAN software are shown in Fig. S17.† | ||
3.6. Sample volume and storage robustness
To test the maximum volume blood resistance of our proposed strategy, 1, 2 and 4 μL of No. 1 blood samples were added and further analyzed. One and two μL of blood sample inputs were successfully amplified and genotyped by melting curve analysis (Fig. 5A–D). When 4 μL of blood samples were injected, amplification curves were absent and melting curves were observed in the ROX channel only. These results indicate that roughly only 10% blood samples could be successfully analyzed using our proposed method, and blood samples of concentrations >10% may inhibit PCR amplification. We recognize that the current tolerance for blood volume concentrations can be restrictive, especially for analyses that require larger quantities. However, for standard PCR protocols, which usually involve 20–50 μL, adding 2–5 μL of whole blood is feasible. This volume is easily handled with a 10 μL pipette, ensuring accurate and convenient pipetting. This approach maintains the tolerance limits while streamlining sample handling in the lab.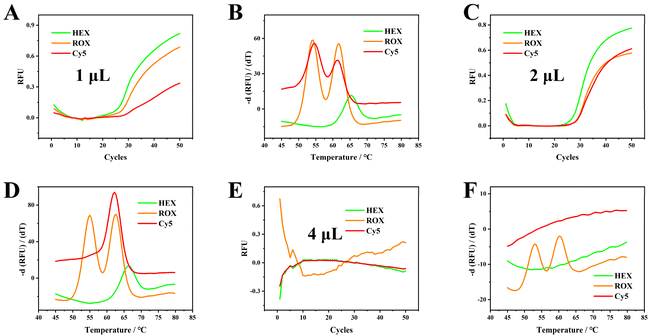 | ||
| Fig. 5 PCR amplification curves and melting curves for 1 μL (A and B), 2 μL (C and D), and 4 μL (E and F) of blood sample. The total reaction volume is 20 μL. Original screenshots of the commercial SLAN software are shown in Fig. S18.† | ||
Fresh blood specimens were then tested after frozen specimen storage at −20 °C (sample no. 1) for 1, 2, 3, and 4 weeks. All frozen blood samples were hemolyzed, forming a uniform liquid and further centrifugation did not yield plasma. As shown in Fig. S19,† both fresh and frozen specimens were all amplificated and genotyped by melting curve analysis successfully. These results indicated this proposed direct PCR strategy for blood samples is compatible with the detection of blood samples stored for up to a month.
3.7. Analysis of plasma
Plasma cell-free DNA (cfDNA) fragments of approximately 160 base pairs are commonly utilized in non-invasive prenatal testing (NIPT) and for tumor surveillance. To assess the efficacy of our proposed direct PCR approach for plasma analysis, plasma samples numbered 1 through 8 were subjected to examination. As depicted in Fig. S20,† most of the samples exhibited no amplification or melting curves. The few positive outcomes displayed a decrease in the Ct values, predominantly in the ROX and Cy5 channels, which may be due to leukocyte lysis or the presence of trace amounts of cfDNA. Conversely, all results in the HEX channel were negative, likely because the PCR product size was 199 base pairs. In contrast, the product sizes for the ROX and Cy5 channels are 149 and 161 base pairs, respectively. Therefore, it can be inferred that our direct PCR strategy primarily analyzes genomic DNA from leukocytes, while cfDNA is unsuitable for genotyping purposes.4. Conclusion
In this work, we constructed a direct blood multiplex asymmetric PCR and dual-labelled probe-based melting curve analysis for genotyping of MTHFR (C677T, rs#1801133 and A1298C, rs#1801131) and MTRR (A66G, rs#1801394) without DNA extraction. This proposed strategy has several advantages, including the elimination of the need for nucleic acid extraction and open tubes, which simplifies the procedure and minimizes contamination risks. The method involves one-step operations, allowing for real-time multiplex monitoring and demonstrating robustness to temperature variations. The direct PCR of blood samples significantly reduces the use of nucleic acid extraction reagents and equipment, thereby decreasing the operator workload and shortening test turnaround times (TAT). By combining dual-labelled probe-based melting curves analysis, TAT can be reduced to within 100 min, enhancing the efficiency of the process. Moreover, this technique is particularly beneficial in clinical settings due to its simplicity, speed, and reliability. It offers a promising strategy for SNP analysis with substantial potential for clinical applications, including personalized medicine, where rapid and accurate genotyping is crucial for patient management and treatment decisions. This innovation has the potential to improve diagnostic workflows and patient outcomes significantly.Data availability
All data generated or analyzed during this study are included in this published article and its ESI.† The datasets used and/or analyzed during the current study are available from the corresponding author upon reasonable request. No restrictions apply to the data, and all data can be made available to the scientific community for future research upon request.Author contributions
Zhang Zhang: conceptualization, methodology, writing original draft. Lian Li: writing – review & editing. Juan Yao: conceptualization, data curation, and funding acquisition.Conflicts of interest
The authors declare that they have no known competing financial interests or personal relationships that could have appeared to influence the work reported in this paper.Acknowledgements
We thank all the patients and their families for their kind cooperation. We thank Chong Deng and Youqiang Wang (The Affiliated Traditional Chinese Medicine Hospital of Southwest Medical University) for their insight and technical assistance. This research was supported by the Sichuan Science and Technology Program (2023NSFSC1478), National Natural Science Foundation of China (82460414) and Science and Technology strategic cooperation Project of Luzhou Municipal People's Government-Southwest Medical University (2024LZXNYDJ103).References
- M. Sidstedt, P. Rådström and J. J. A. Hedman, Anal. Bioanal. Chem., 2020, 412, 2009–2023 CrossRef CAS PubMed.
- T. A. Coulther, H. R. Stern and P. J. Beuning, Trends Biotechnol., 2019, 37, 1091–1103 CrossRef CAS PubMed.
- C. Schrader, A. Schielke, L. Ellerbroek and R. Johne, J. Appl. Microbiol., 2012, 113, 1014–1026 CrossRef CAS PubMed.
- L. Koshy, A. Anju, S. Harikrishnan, V. Kutty, V. Jissa, I. Kurikesu, P. Jayachandran, A. Jayakumaran Nair, A. Gangaprasad and G. M. Nair, Mol. Biol. Rep., 2017, 44, 97–108 CrossRef CAS PubMed.
- M. Ghaheri, D. Kahrizi, K. Yari, A. Babaie, R. Suthar and E. J. C. Kazemi, Mol. Biol., 2016, 62, 120–124 CAS.
- K. Riemann, M. Adamzik, S. Frauenrath, R. Egensperger, K. W. Schmid, N. H. Brockmeyer and W. Siffert, J. Clin. Lab. Anal., 2007, 21, 244–248 CrossRef CAS.
- S. Zhang, Y. Cai, J. Zhang, X. Liu, L. He, L. Cheng, K. Hua, W. Hui, J. Zhu and Y. Wan, Nanoscale, 2020, 12, 10098–10105 RSC.
- D. Zhang, Y. Hu, R. Gao, S. Ge, J. Zhang, X. Zhang and N. Xia, Anal. Chim. Acta, 2024, 1288, 342176 CrossRef CAS PubMed.
- D. E. Hall and R. Roy, Croat. Med. J., 2014, 55, 655 CrossRef CAS PubMed.
- N. Nishimura, T. Nakayama, H. Tonoike, K. Kojima, Y. Shirasaki, K. Kondoh and T. Yamada, Clin. Lab., 2002, 48, 377–384 CAS.
- M. Miura, C. Tanigawa, Y. Fujii and S. Kaneko, Rev. Inst. Med. Trop. Sao Paulo, 2013, 55, 401–406 CrossRef PubMed.
- N. J. van Dijk, D. G. Hagos, D. M. Huggins, E. Carrillo, S. Ajala, C. Chicharro, D. Kiptanui, J. C. Solana, E. Abner and D. Wolday, PLoS Neglected Trop. Dis., 2024, 18, e0011637 CrossRef CAS PubMed.
- H. Li, Y. Fang, Y. Chen, Y. Lin, Z. Fang, Z. Lin, H. Xie and Z. Zhang, Sci. Rep., 2024, 14, 2358 CrossRef CAS.
- C. P. Yenice, N. Chahin, M. Jauset-Rubio, M. Hall, P. Biggs, H.-P. Dimai, B. Obermayer-Pietsch, M. Ortiz and C. O’Sullivan, Anal. Chem., 2023, 95, 14192–14202 CrossRef CAS PubMed.
- F. W. Liu, S. T. Ding, E. C. Lin, Y. W. Lu and J. S. Jang, RSC Adv., 2017, 7, 4646–4655 RSC.
- P. Rao, H. Wu, Y. Jiang, T. Opriessnig, X. Zheng, Y. Mo and Z. Yang, J. Virol. Methods, 2014, 208, 56–62 CrossRef CAS.
- C. T. Wittwer, G. H. Reed, C. N. Gundry, J. G. Vandersteen and R. J. Pryor, Clin. Chem., 2003, 49, 853–860 CrossRef CAS.
- R. J. Dikdan, S. A. Marras, A. P. Field, A. Brownlee, A. Cironi, D. A. Hill and S. Tyagi, J. Mol. Diagn., 2022, 24, 309–319 CrossRef CAS.
- L. Zhang, D. Liu, B. Li, J. Xie, J. Liu and Z. Zhang, Anal. Biochem., 2022, 642, 114509 CrossRef CAS PubMed.
- H. S. Kou, H. Lin, R. Sebuyoya, K. S. Chueh, C. W. Cheng and C. C. Wang, Microchim. Acta, 2023, 190, 375 CrossRef CAS PubMed.
- H. Lahiri, S. Banerjee and R. Mukhopadhyay, ACS Sens., 2019, 4, 2688–2696 CrossRef CAS PubMed.
- Y. Shulpekova, V. Nechaev, S. Kardasheva, A. Sedova, A. Kurbatova, E. Bueverova, A. Kopylov, K. Malsagova, J. C. Dlamini and V. Ivashkin, Molecules, 2021, 26, 3731 CrossRef CAS.
- S. Hernández-Díaz, M. M. Werler, A. M. Walker and A. A. Mitchell, N. Engl. J. Med., 2000, 343, 1608–1614 CrossRef.
- L. A. Magee, A. Pels, M. Helewa, E. Rey and P. von Dadelszen, Pregnancy Hypertens., 2014, 4, 105–145 CrossRef.
- M. S. Field, E. Kamynina, J. Chon and P. J. Stover, Annu. Rev. Nutr., 2018, 38, 219–243 CrossRef CAS PubMed.
- S. A. Jeon, J. L. Park, S.-J. Park, J. H. Kim, S.-H. Goh, J.-Y. Han and S.-Y. Kim, Genes Genomics, 2021, 43, 713–724 CrossRef CAS PubMed.
- S. Ding, X. Yu, Y. Zhao and C. Zhao, Anal. Chim. Acta, 2023, 340810 CrossRef CAS PubMed.
- K. P. Lai, Y. C. Su, B. S. Fu, K. H. Lin, H. S. Kou and C. C. Wang, Analyst, 2022, 147, 5732–5738 RSC.
- W. Yu, J. Yao and Z. Zhang, Anal. Chem., 2022, 94, 13052–13060 CrossRef CAS.
Footnote |
| † Electronic supplementary information (ESI) available: Sequences of the designed oligonucleotides, Tm values and SDs of homozygous genotypes, melting curves for the genotyping results of 50 blood samples and gDNA samples. Results from fresh and frozen blood specimens and plasma samples as melting curves. See DOI: https://doi.org/10.1039/d4ra07286c |
| This journal is © The Royal Society of Chemistry 2025 |
