 Open Access Article
Creative Commons Attribution 3.0 Unported Licence
Unlocking new possibility of Fe3O4@C@Ag nanostructures as an advanced SERS substrate for ultrasensitive detection of low-cross-section urea biomolecules†
Quan-Doan Mai‡
 *a,
Dang Thi Hanh Trang‡a,
Dong Thi Linha,
Nguyen Trung Thanhb,
Bui Hanh Nhungab,
Ong Van Hoangca,
Ta Ngoc Bachd,
Nguyen Quang Hoae,
Anh-Tuan Phamaf and
Anh-Tuan Le
 *ab
*ab
aPhenikaa University Nano Institute (PHENA), Phenikaa University, Hanoi 12116, Vietnam. E-mail: doan.maiquan@phenikaa-uni.edu.vn
bFaculty of Materials Science and Engineering, Phenikaa University, Hanoi 12116, Vietnam. E-mail: tuan.leanh@phenikaa-uni.edu.vn
cUniversity of Transport Technology, Trieu Khuc, Thanh Xuan District, Hanoi, Vietnam
dInstitute of Materials Science (IMS), Vietnam Academy of Science and Technology, 18 Hoang Quoc Viet, Hanoi 10000, Vietnam
eFaculty of Physics, VNU University of Science, Vietnam National University, Hanoi, Thanh Xuan, Hanoi, Vietnam
fFaculty of Biotechnology, Chemistry and Environmental Engineering, Hanoi 12116, Vietnam
First published on 6th January 2025
Abstract
Surface-enhanced Raman spectroscopy (SERS) is widely recognized as a powerful analytical technique, offering molecular identification by amplifying characteristic vibrational signals, even at the single-molecule level. While SERS has been successfully applied for a wide range of targets including pesticides, dyes, bacteria, and pharmaceuticals, it has struggled with the detection of molecules with inherently low Raman scattering cross-sections. Urea, a key nitrogen-containing biomolecule and the diamide of carbonic acid, is a prime example of such a challenging target. Found in human urine and blood, urea serves as an essential biomarker for diagnosing kidney dysfunction, liver disease, and heart failure, while its residue in water poses significant health risks. However, due to its low Raman cross-section, SERS has faced challenges in achieving high sensitivity for urea detection, limiting its potential in diagnosis and residual analysis. In this study, we present Fe3O4@C@Ag nanostructures as an advanced SERS substrate engineered for ultrasensitive urea detection. Our results reveal that Fe3O4@C@Ag nanostructures enable the detection of urea with a good limit of 5.68 × 10⁻⁹ M and a high enhancement factor of 3.67 × 10⁶. In addition, the substrate demonstrated high reliability, with repeatability and reproducibility showing relative standard deviations below 10%. Furthermore, the practicality of the Fe3O4@C@Ag nanostructures was evaluated in real-world scenarios using artificial urine and tap water samples as representative matrices for early disease diagnosis and water quality monitoring. The sensor successfully detected urea across concentrations as low as 10−8 M, with excellent recovery rates ranging from 90% to 99%, even in complex sample environments. These results highlight the remarkable sensitivity and versatility of Fe3O4@C@Ag nanostructures, overcoming SERS's traditional limitations in urea detection and unlocking new possibilities for clinical diagnostics and environmental monitoring.
1. Introduction
Surface-enhanced Raman spectroscopy (SERS) is a pivotal technique in chemical and biological analysis, offering the ability to provide molecular fingerprint information with ultrasensitive detection (10−13 M to 10−15 M), even at the single-molecule level.1–4 Owing to its ultra-high sensitivity, label-free analysis, and rapid detection capabilities, SERS has found applications in critical fields such as food safety,5 environmental monitoring,6 surface and interface chemistry,7 biomedicine,8 and early disease diagnosis.9 At the heart of SERS are nanostructured materials based on noble metals such as Ag, Au, and Cu, where the Raman signals of target molecules are enormously amplified through two widely accepted mechanisms: electromagnetic and chemical.1,2,10 In recent decades, a vast amount of research has been dedicated to designing and developing nanomaterials for SERS, yielding significant breakthroughs. Nanomaterials ranging from simple colloidal11,12 and self-assembled nanoparticles13,14 to more sophisticated structures like composites15,16 and core–shell nanostructures17,18 have been engineered to maximize sensitivity across various analytes. These materials have demonstrated high SERS sensing efficiency in diverse applications, including detecting pesticides in food safety,5 organic dyes in environmental monitoring,6 and bacteria in biomedical studies.8 Despite these advances, a major challenge remains: the detection of molecules with inherently low Raman cross-sections.19 The Raman cross-section quantifies the probability of a molecule scattering light inelastically, with its magnitude reflecting the strength of the Raman signal.20 This is expressed in cm2 per sr per molecule. Molecules with high Raman cross-sections, such as rhodamine 6G, produce strong Raman signals, making them easier to detect, with typical values around 10−25 cm2 per sr.21,22 In contrast, molecules with low Raman cross-sections, such as small molecules (e.g., gases and urea, with typical values around 10−30 cm2 per sr), exhibit weak Raman scattering, presenting significant challenges for detection.23,24 The nature of these molecules results in minimal Raman scattering enhancement under SERS conditions, which severely limits detection sensitivity, typically around 10−3 M to 10−4 M.19,25 Therefore, developing strategies to achieve high sensitivity for low Raman cross-section molecules is highly desirable, as it could significantly broaden the scope of SERS applications in critical fields.Urea, the diamide of carbonic acid, is a key nitrogen-containing compound and an essential biomarker found in human urine and blood, with typical concentrations ranging from 2.5 × 10⁻³ M to 7.5 × 10⁻³ M in blood and 170 × 10−3 M to 590 × 10−3 M in urine, playing a crucial role in diagnosing kidney, liver, and heart diseases.26,27 Elevated blood urea levels exceeding 7.5 × 10⁻³ M (hyperuremia) may indicate kidney dysfunction, while levels below 2.0 × 10⁻³ M can be associated with severe liver damage or malnutrition. In urine, abnormally low urea concentrations below 100 × 10−3 M may suggest impaired renal function, whereas levels exceeding 600 × 10−3 M could indicate excessive protein metabolism or metabolic disorders. Beyond its significance in diagnostics, the analysis of urea residues in water or food also holds important health implications.28,29 Urea contamination in water and food often results from agricultural practices involving fertilizers or the illicit use of urea as an additive in food processing, posing risks to human health even at trace concentrations. Such urea residue concentration can increase the burden on the kidneys, potentially leading to kidney failure, or transform into nitrosamines in the body, particularly when combined with other pollutants, thereby elevating the risk of gastrointestinal cancers. Current techniques for detecting urea include enzymatic assays, colorimetric methods, and chromatographic techniques such as high-performance liquid chromatography (HPLC).29,30 These methods, while effective in specific scenarios, often suffer from limitations such as low sensitivity, interference from complex sample matrices, labor-intensive procedures, and the need for sophisticated instrumentation. In contrast, SERS offers ultra-high sensitivity, down to the single-molecule level, label-free detection, and the ability to detect urea in complex biological and environmental matrices with minimal preparation, making them particularly valuable for applications in clinical diagnostics, food safety and water quality monitoring. These distinctive benefits position SERS as a transformative approach compared to traditional methods. Unfortunately, the detection of urea using SERS remains challenging due to its inherently low Raman cross-section, resulting in weak signal enhancement. However, the ultra-high sensitivity and versatility of SERS drive efforts to address this limitation. Recent advancements have focused on enhancing the Raman signal through designed nanomaterial, enabling more effective detection of urea even in complex biological and environmental matrices. These developments hold significant promise for leveraging SERS as a practical tool in diverse applications, bridging the gap left by conventional methods. Chen et al. designed highly ordered Au/Cu hybrid nanostructure arrays with a high density of hotspots – areas between noble metal nanoparticles where strong electromagnetic fields are generated. This dense hotspot distribution enabled the SERS substrate to detect urea at concentrations as low as 1.0 × 10⁻³ M with excellent reproducibility.25 However, despite the high hotspot density, the detection sensitivity remains limited. Li and colleagues took a different approach by increasing the porosity of the SERS substrate to enhance the adsorption of urea molecules, bringing them closer to the nanostructured surface, which in turn improved the SERS signal. They fabricated a novel SERS substrate composed of silver and porous gold nanoparticles, providing additional enhancement from the gold's porous structure.31 This substrate achieved a detection limit of 1.0 × 10⁻³ M under biophysical conditions. In 2022, we introduced a photo-induced enhanced Raman scattering (PIERS) technique applied to Ag/TiO2 nanocomposite SERS substrates to improve urea detection by pre-irradiating the substrate with UV light.32 This pre-irradiation step significantly improved the performance of the Ag/TiO2 nanocomposite, enabling urea detection down to 4.6 × 10⁻⁶ M. This technique also enables the detection of urea residues in food (milk samples) at concentrations down to 10−5 M. Nevertheless, for an ultrasensitive sensing platform like SERS, there is still significant potential to further enhance and optimize the detection sensitivity for urea.
To achieve strong SERS enhancement for urea detection, it is essential that the design of the SERS substrate ensures a high density of hotspots. More importantly, urea molecules need to be effectively drawn to these hotspot regions to maximize the enhancement of Raman scattering – a feature we describe as “accessible hotspots”. However, this is challenging due to spatial constraints at the hotspots, where analyte molecules tend to accumulate on the outer surface of the material instead of at the hotspot sites. Thus, designing a SERS substrate that simultaneously provides both “dense hotspot density” and “accessible hotspots” is crucial for enhancing the sensitivity towards urea. In this study, we successfully designed and fabricated Fe3O4@C@Ag nanostructures as an advanced SERS substrate, combining both “dense hotspot density” and “accessible hotspots”. By reducing AgNO3 directly onto the surface of Fe3O4@C, Ag nanoparticles (NPs) were uniformly deposited, forming evenly distributed interparticle gaps around the Fe3O4@C spheres. This generated a dense three-dimensional network of hotspots within the Fe3O4@C@Ag structure. Furthermore, the adsorption ability of the carbon layer allows urea molecules to be efficiently adsorbed. Notably, the regions where the carbon layer adsorbs urea are precisely at the interparticle gaps formed by the Ag NPs – these are the hotspots, enabling the “accessible hotspots” feature of the Fe3O4@C@Ag nanostructures. As a result of these combined features, the Fe3O4@C@Ag nanostructures exhibit ultra-sensitive detection of urea, achieving a low detection limit of 5.68 × 10⁻⁹ M and an enhancement factor of 3.67 × 10⁶. The reliability of the Fe3O4@C@Ag nanostructures was demonstrated through repeatability and reproducibility tests, both yielding relative standard deviation (RSD) values below 10%, indicating high reliability. Additionally, the Fe3O4@C@Ag nanostructures demonstrated their practical applicability in real-world scenarios, with successful urea detection in artificial urine and tap water samples. As a proof of concept, the Fe3O4@C@Ag nanostructures effectively address the limitations of SERS in identifying and quantifying the urea, opening new avenues for research in disease diagnostics and environmental monitoring related to this critical biomarker.
2. Materials and methods
2.1. Materials
Ferrocene (Fe(C5H5)2, 98 wt%), hydrogen peroxide solution (H2O2, 30 v/v%), urea (CH4N2O, 99 wt%) and creatinine (C4H7N3O, ≥98%) were sourced from Sigma Aldrich (United Kingdom). Silver nitrate (AgNO3, ≥99.0 wt%), sodiumborohydride (NaBH4, 99 wt%), polyhexamethylene biguanide (PHMB, 99 wt%), potassium hydroxide (KOH, 96 wt%), ammonium nitrate ((NH4)2SO4, ≥99 wt%), sodium citrate (Na3C6H5O7, 99 wt%), ethanol (C2H5OH, 98 v/v%) and acetone (C3H6O, 99 v/v%) were purchased from Shanghai Chemical Reagent (China). All chemicals were used directly without further purification. Double distilled water was used throughout the experiments.2.2. Synthesis of Fe3O4@C@Ag nanostructure materials and their characterizations
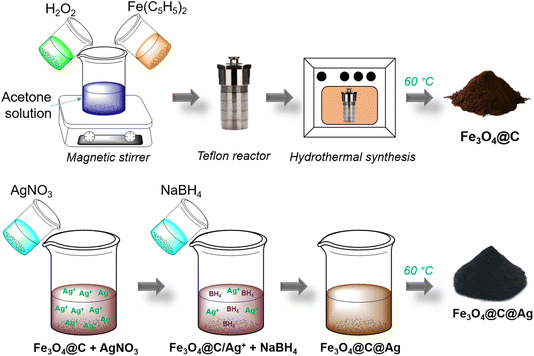
The Fe3O4@C material was synthesized via a hydrothermal method using Fe(C5H5)2 as the precursor and H2O2 as the reducing agent. First, 0.8 g of Fe(C5H5)2 were evenly dispersed in 30 mL of C3H6O by magnetic stirring for 15 minutes. Next, 5 mL of H2O2 was gradually added to the solution, which was continuously stirred for an additional 30 minutes. This mixture was then transferred to a Teflon container, and the hydrothermal process was conducted for 20 h at 200 °C. The resulting product was washed three times with acetone using a high-speed centrifuge. Finally, the product was dried at 60 °C for 2 h to obtain Fe3O4@C powder, which was prepared for subsequent steps (Scheme 1). The Ag layer in the Fe3O4@C@Ag structure was formed by the reduction of AgNO3 using NaBH4. First, 50 mg of the Fe3O4@C material was evenly dispersed in 100 mL of double-distilled water by ultrasonic shaking for 5 minutes. Subsequently, 50 mg of AgNO3 was added to this mixture and stirred for 1 h to ensure the Ag+ ions were adsorbed onto the surface of Fe3O4@C. The Fe3O4@C/Ag+ material (with Ag+ ions adsorbed onto the surface of Fe3O4@C) was then recovered, and any excess Ag+ ions were removed to prevent the formation of Ag materials outside the Fe3O4@C surface. 23 mg of NaBH4 dispersed in 10 mL of double-distilled water was gradually added to the Fe3O4@C/Ag+ mixture to directly reduce the Ag+ ions on the surface of Fe3O4@C, leading to the formation of the Fe3O4@C@Ag material. The product was washed three times with acetone using a high-speed centrifuge. Finally, the sample was dried at 60 °C for 2 h to obtain powdered Fe3O4@C@Ag nanostructures, ready for further experiments (Scheme 1). The SERS substrate based on bare Ag NPs was prepared using Ag materials synthesized by the reduction of AgNO3 with NaBH4. First, 50 mg of AgNO3 was dispersed in 100 mL of double-distilled water by uniform magnetic stirring for 30 minutes. Next, 5 mg of the surfactant polyhexamethylene biguanide (PHMB) was added to the mixture to stabilize the Ag nanoparticles during their formation. Finally, 23 mg of NaBH4, dispersed in 10 mL of double-distilled water, was gradually added to the mixture to reduce Ag+ ions into Ag NPs. The reaction proceeded for 3 h, resulting in Ag NPs in the form of a colloidal solution.The morphology of the Fe3O4@C, Fe3O4@C@Ag nanostructures and Ag NPs was examined using field emission scanning electron microscopy (FE-SEM, Hitachi S-4800) operating at an acceleration voltage of 5 kV. The elemental composition and distribution of the Fe3O4@C and Fe3O4@C@Ag materials were characterized using Energy-Dispersive X-ray (EDX) spectroscopy along with EDX mapping analysis. The crystalline properties of the Fe3O4@C and Fe3O4@C@Ag nanostructures were investigated using X-ray diffraction (Bruker D5005 X-ray diffractometer, Cu Kα, λ = 1.5406 Å) under a voltage of 40 kV and a current of 30 mA. The composition and chemical properties of the Fe3O4@C and Fe3O4@C@Ag nanostructures were analyzed using Raman spectroscopy (Horiba Macro-RAM™) with 785 nm laser excitation. The optical properties of Ag NPs, Fe3O4@C, and Fe3O4@C@Ag nanostructures were investigated using a JENWAY 6850 double-beam ultraviolet-visible (UV-Vis) spectrophotometer with 10 mm path length quartz cuvettes.
The UV-Vis spectra were used to evaluate the adsorption capacity of urea molecules on the surfaces of Ag NPs, Fe3O4@C, and Fe3O4@C@Ag materials. Initially, the UV-Vis spectrum of urea was recorded in the range of 200–800 nm to identify its characteristic absorption peaks. These characteristic peaks were then monitored over time during the adsorption process. The UV-Vis spectra were collected at various time intervals during the interaction between urea and the materials under uniform stirring, at time points such as 0, 5, 10, 15, and 20 minutes, with 0.1 g of material in 50 mL of solution containing urea at a concentration of 10−4 M. The adsorption efficiency was assessed at the time when the adsorption equilibrium state was reached, evidenced by no further decrease in the characteristic absorption peak of urea in the UV-Vis spectrum. This efficiency was calculated using the formula: adsorption capacity (%) = (1 − It/I0) × 100, where It represents the intensity of the characteristic absorption peak of urea at time t when equilibrium adsorption is achieved, and I0 is the initial intensity of the absorption peak of urea at a concentration of 10−4 M.
2.3. Substrate preparation, SERS measurements
Aluminum (Al) substrates, measuring 1 cm × 1 cm × 0.1 cm, were fabricated with a surface-active area having a diameter of 0.2 cm by creating a small hole of the same size on the Al substrate surface. This active surface area was designed to deposit materials onto it and to prevent uneven deposition of these materials within the designated area. The substrates were thoroughly cleaned with ethanol and allowed to air dry at room temperature. Next, a solution containing 1 mg mL−1 of bare Ag NPs and Fe3O4@C@Ag nanostructures was prepared deposited onto the active surface area of the Al substrates using a drop-casting method, which were then dried at room temperature to ensure natural evaporation and to prevent uneven material deposition. This process was repeated for all SERS substrates.Standard solutions of urea at various concentrations (10−3 to 10−9 M) were prepared using double-distilled water as the solvent. For each measurement, 5 μL of each urea concentration was directly applied to the prepared SERS substrates and allowed to evaporate under laboratory conditions. The SERS spectra of each substrate were collected immediately afterward using a MacroRaman™ Raman spectrometer (Horiba) with 785 nm laser excitation. Raman measurements were conducted using a 100× objective with a numerical aperture of 0.90. The laser power was set to 45 mW at a 45° contact angle, resulting in a diffraction-limited laser spot diameter of 1.1 μm (1.22λ/NA) and a focal length of 115 nm. Each measurement had an exposure time of 20 s with three accumulations, and the final spectrum was obtained after baseline calibration, which involves subtracting the elevated background signal to ensure the spectrum clearly displays the signal while maintaining the integrity of the recorded data.
2.4. Practicability evaluation experiment
The real samples used in this study were artificial urine and tap water, which were employed to evaluate the practicability of the Fe3O4@C@Ag nanostructure-based SERS sensor. The preparation of artificial urine was carried out as follows: to 1 liter of distilled water, the following reagents were added: 1 g of potassium hydroxide, 1 g of ammonium nitrate, 1 g of ammonium sulfate, 1 g of sodium citrate, and 0.5 g of creatinine. This artificial urine was prepared according to the procedure outlined in a previous study, with slight modifications.33 Urea was then added to achieve concentrations ranging from 10−5 to 10−8 M. Similar urea concentrations were also prepared in tap water samples collected from a residential area. These urea-containing samples were subsequently used directly for SERS signal detection without any further processing.3. Results and discussion
3.1. Characterizations of Fe3O4@C@Ag nanostructure materials
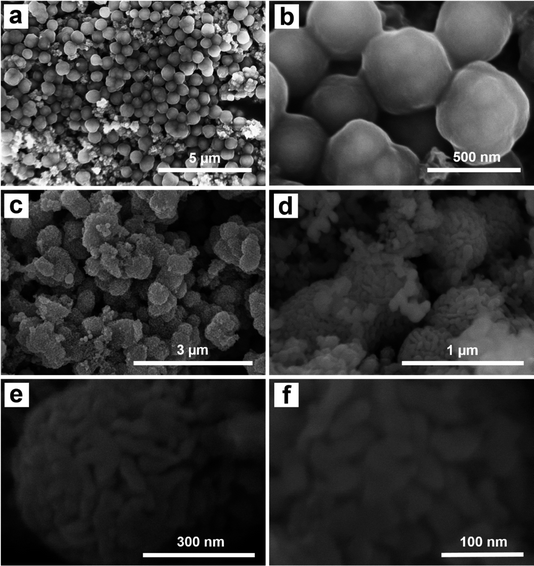
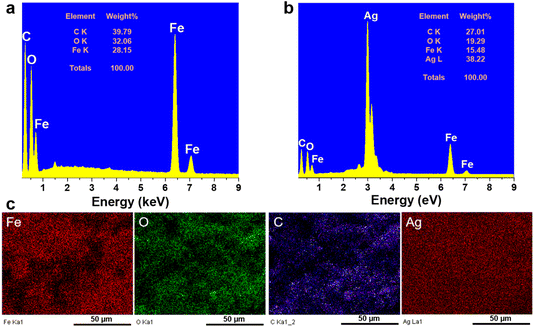
The morphology of the Fe3O4@C and Fe3O4@C@Ag materials was characterized using FE-SEM analysis, as illustrated in Fig. 1. Fig. 1a and b display FE-SEM images of Fe3O4@C at different resolutions. The successful synthesis of Fe3O4@C via a hydrothermal method utilizing ferrocene (Fe(C5H5)2) as a precursor has been established in previous studies.34,35 In this experiment, the hydrothermal process conducted at 200 °C for 20 hours resulted in spherical Fe3O4@C particles with an average diameter of 480 nm, demonstrating good uniformity (a detailed analysis of the distribution is provided in Fig. S1 of the ESI†). The surface is coated with a rough layer, likely composed of carbon, which facilitates the adsorption of Ag+ ions during synthesis. Furthermore, the Fe3O4@C particles show good dispersion without noticeable aggregation. This behavior is likely attributed to the magnetic properties of the Fe3O4 core, which assist in particle separation, stabilize the material, and effectively prevent aggregation. The separation of Fe3O4@C particles could facilitate a more uniform adsorption of Ag+ ions onto the surface of each particle, leading to the formation of a more uniform Ag layer in the Fe3O4@C@Ag structure. Fig. 1c and d show the FE-SEM images of the Fe3O4@C@Ag material. Notably, the overall size of the material appears to increase compared to Fe3O4@C with an average diameter of 610 nm (Fig. S2†). At lower magnification in Fig. 1c, the particle surfaces exhibit a significant transformation from a smooth to a porous texture. A closer examination in Fig. 1d reveals that a layer of nanoparticles envelops the Fe3O4@C surface. These nanoparticles are uniformly distributed and densely arranged in three dimensions around all the Fe3O4@C particles observed (such uniform formation on each particle may be due to the separation of the Fe3O4@C particles). This regular and compact arrangement creates gaps between the nanoparticles, which are extensively distributed throughout the sample. These particles are attributed to the Ag NP. Consequently, the Ag NP forms a protective layer around the Fe3O4@C, resulting in the Fe3O4@C@Ag nanostructure, characterized by a high density of interparticles (gaps between the Ag particles) that serve as “hotspots”. A closer examination of the single Fe3O4@C@Ag nanoparticle at higher resolution (Fig. 1e and f) provides clearer confirmation of the formation of numerous hotspot sites through the appearance of many interparticle positions between the Ag particles on the Fe3O4@C surface, where electromagnetic field interactions are strongest. Therefore, FE-SEM images confirm that the obtained Fe3O4@C@Ag nanostructure achieves the targeted feature of a “dense hotspot density”. For the bare Ag NPs materials, the FE-SEM images and size distribution histogram presented in Fig. S3† confirm that the synthesized Ag NPs have a spherical shape with relatively uniform sizes, and the average size was calculated to be 24 nm.Fig. 2 shows the results of EDX and EDX mapping measurements of the Fe3O4@C and Fe3O4@C@Ag samples to assess the presence and distribution of Fe3O4, C, and Ag components in the three-component Fe3O4@C@Ag nanostructure. Fig. 2a presents the EDX measurement results for the Fe3O4@C sample and confirms the presence of iron (Fe), oxygen (O), and carbon (C) elements, with respective contents of 28.15%, 32.06%, and 39.79%. Additionally, no foreign elements were observed in this sample. This result, combined with the FE-SEM image, indicates the formation of the Fe3O4@C material with high purity. The presence of Ag in the Fe3O4@C@Ag structure is confirmed through the EDX results shown in Fig. 2b. It can be observed that, in addition to the core Fe3O4@C elements of Fe, O, and C, there is also the presence of Ag with a content of 38.22%, and no foreign elements were observed, indicating the high purity of the Fe3O4@C@Ag sample formed. The EDX mapping analysis results in Fig. 2c confirm the distribution of the Fe3O4, C, and Ag components in the Fe3O4@C@Ag nanostructures. These four elements are evenly distributed within the observed area. Notably, the uniform distribution of the Ag element, observed in conjunction with the FE-SEM images, shows the formation and uniform distribution of the Ag layer within the Fe3O4@C@Ag structure.
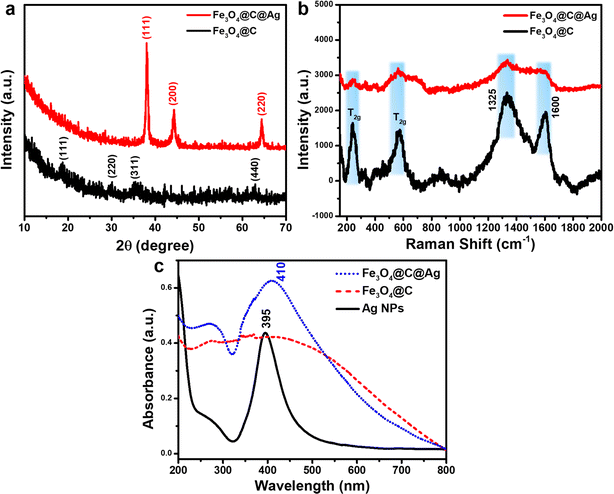
The crystalline properties and composition of Fe3O4@C and Fe3O4@C@Ag materials were evaluated using X-ray diffraction (XRD) to verify the formation and structure of these designed materials. Fig. 3a presents the XRD patterns for Fe3O4@C and Fe3O4@C@Ag. The diffraction peaks corresponding to the crystallographic planes (111), (220), (311), and (440) are observed at 2 theta values of 18.80°, 29.93°, 35.31°, and 62.76°, respectively, aligning well with the characteristic diffractions of the Fe3O4 inverse spinel structure (JCDPS File No. 89-0691). However, the intensity of these peaks is weak and indistinct, likely due to the carbon layer surrounding the Fe3O4 particles, which interferes with the diffraction process. In the XRD pattern of the Fe3O4@C@Ag material, distinct peaks attributable to metallic Ag appear. Three prominent peaks at 2θ = 38.05°, 44.25°, and 64.50° correspond to the (111), (200), and (220) reflections of metallic Ag (JCDPS File No. 04-0783). The sharpness and high intensity of these peaks indicate a high degree of crystallinity in the formed Ag layer. Notably, the characteristic diffraction peaks of Fe3O4 are absent in the XRD spectrum of Fe3O4@C@Ag, suggesting that the presence of the carbon and Ag layers has completely suppressed the diffraction signal from the Fe3O4 core. Furthermore, no anomalous diffraction peaks are observed, confirming the high purity of the resulting material.
The Raman spectra were analyzed to complement the results obtained from FE-SEM imaging and XRD patterns, as illustrated in Fig. 3b. The Fe3O4@C material displays two prominent and broad peaks centered at approximately 1325 cm−1 and 1600 cm−1, corresponding to the D band and G band, respectively. The D band is associated with defects and disordered regions in the carbon structure (sp3 bonded), while the G band indicates in-plane stretching of ordered graphitic crystallites (sp2 bonded).36 The pronounced intensities of these peaks confirm the presence of a carbon layer in the Fe3O4@C structure. Furthermore, the higher intensity of the D band relative to the G band suggests a significant presence of defects and disorder, which increases the number of active sites available for Ag+ ion adsorption, facilitating the formation of Ag nanoparticles on the surface of Fe3O4@C. In addition, the carbon layer beneath the Ag nanoparticles provides additional active sites for ion storage, playing a crucial role in SERS.37,38 The gaps between the Ag NPs, as observed in the FE-SEM images, function as hotspots. The underlying carbon layer can attract urea molecules to these hotspots, effectively guiding them to optimal adsorption locations. This configuration results in “accessible hotspots” within the Fe3O4@C@Ag nanostructures. Moreover, two additional strong peaks at 243 cm−1 and 570 cm−1 are attributed to the T2g vibrational mode of Fe3O4.39,40 The slight shift in the positions of these peaks compared to the characteristic scattering positions of uncoated Fe3O4 suggests a gravity interaction between the carbon shell and Fe3O4 core affecting in vibrational modes of the Fe3O4 material. Analysis of the Raman spectrum for Fe3O4@C@Ag reveals a reduction in the intensity of all peaks associated with both the Fe3O4 core and the carbon shell. This decrease may result from the shielding effect of the surrounding Ag NPs, which absorb or scatter the incident light, thereby reducing the signal from the Fe3O4@C core, as clearly seen in the FE-SEM images. Additionally, the absence of other scattering peaks indicates high sample purity. Notably, the weak appearance of scattering peaks from the substrate is advantageous for SERS applications, as it minimizes background noise and enhances the analysis during SERS measurements.
The UV-Vis spectra of Ag NPs, Fe3O4@C, and Fe3O4@C@Ag materials are shown in Fig. 3c to evaluate the optical properties of these samples. The absorption in the range of 350 nm to 450 nm, with a sharp peak at 395 nm for Ag NPs, is attributed to the resonant excitation of surface plasmons (SPR). In contrast, the Fe3O4@C material does not exhibit any characteristic absorption peaks but absorbs light over a broad range from 200 nm to 700 nm. The Fe3O4@C@Ag nanostructures display absorption behavior that combines the properties of both Fe3O4@C and Ag components. This material shows efficient absorption in the range from 350 nm to 500 nm, with a peak at 410 nm due to the SPR of the Ag layer. The peak shifts slightly to the red, broadens, and decays in intensity when compared to pure Ag NPs. This shift is attributed to the Fe3O4@C core, which increases the effective local dielectric constant of the Ag shell.41 Additionally, the Fe3O4@C@Ag nanostructures exhibit absorption in other regions from 200 nm to 700 nm due to the absorption of the Fe3O4@C core. The maintained SPR characteristics from the Ag NPs, combined with the enhanced local dielectric constant between the Ag and the Fe3O4@C core, promise strong SERS sensing capabilities for the Fe3O4@C@Ag nanostructures.
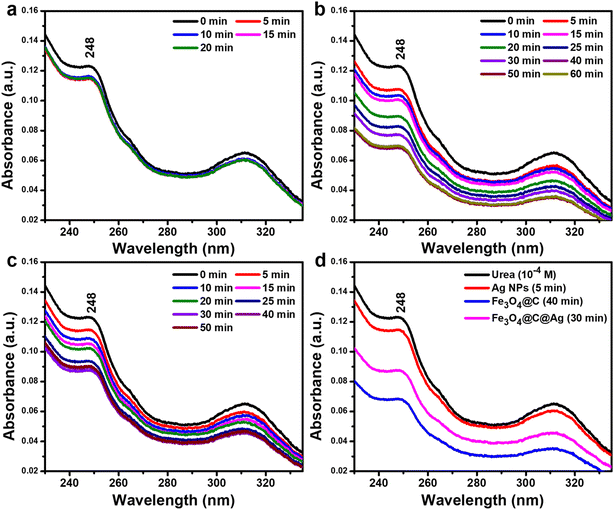
The adsorption efficiency of Ag NPs, Fe3O4@C, and Fe3O4@C@Ag nanostructures for urea molecules was evaluated to clarify their adsorption behaviors and demonstrate the “accessible hotspots” feature of Fe3O4@C@Ag. Detailed experimental conditions are provided in the ESI.† UV-Vis spectra of urea (10−4 M), presented in Fig. S4,† exhibit characteristic absorption peaks at 248 nm and 312 nm. The adsorption process was monitored within the wavelength range of 230–330 nm by observing changes in the 248 nm peak intensity. Ag NPs showed limited urea adsorption, achieving only 8% efficiency after 5 minutes, with no further reduction in peak intensity over time, indicating rapid equilibrium (Fig. 4a). In contrast, Fe3O4@C demonstrated significantly higher adsorption capacity, with the peak at 248 nm decreasing steadily and reaching 44% efficiency after 40 minutes, where equilibrium was achieved (Fig. 4b). Fe3O4@C@Ag nanostructures showed intermediate performance, with 30% adsorption efficiency achieved within 30 minutes (Fig. 4c). The comparison in Fig. 4d reveals Fe3O4@C as the most efficient material for urea adsorption (44%), followed by Fe3O4@C@Ag (30%) and Ag NPs (5%). The superior adsorption efficiency of Fe3O4@C and Fe3O4@C@Ag is attributed to the high adsorption activity of the carbon layer. For Fe3O4@C@Ag, the Ag layer partially shields the carbon, slightly reducing adsorption efficiency. However, gaps in the Ag layer, observed via FE-SEM, create “accessible hotspots”, which effectively attract urea molecules. These accessible hotspots, combined with the dense hotspot density inherent to Fe3O4@C@Ag, enhance its potential for urea sensing. This dual feature underscores the material's suitability for high-performance urea detection.
3.2. SERS sensing performance of Fe3O4@C@Ag nanostructure substrate to detect urea
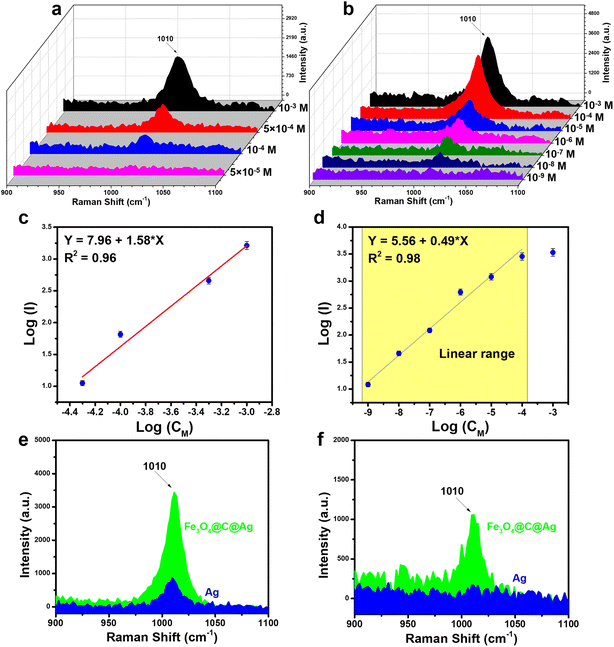
The SERS sensor efficiency for urea detection was evaluated using two types of SERS substrates: bare Ag NPs and Fe3O4@C@Ag nanostructures, aiming to compare their sensing performance. Urea, a simple organic molecule containing one carbonyl group (C![[double bond, length as m-dash]](https://www.rsc.org/images/entities/char_e001.gif) O) and two amino groups (–NH2), exhibits a Raman spectrum in its powdered state with a prominent scattering peak at 1020 cm−1, attributed to the C–N stretching mode vibrations in its molecular structure (Fig. S5†).42 The Raman spectrum of urea solution at a concentration of 10−3 M on a bare Ag substrate (without SERS materials) does not exhibit any characteristic peaks (Fig. S5†). Fig. 5a illustrates the SERS spectra of urea across a concentration range of 10−3 to 5 × 10⁻⁵ M on the bare Ag NPs. The SERS spectra of urea exhibits a single characteristic band at 1010 cm−1, slightly shifted from the Raman spectrum of the powder, and corresponding to the C–N stretching mode.25,43 This characteristic peak was clearly observed at a concentration of 10−3 M, with decreasing intensity at concentrations of 5 × 10⁻⁴ M and 10−4 M, ultimately disappearing entirely at 5 × 10⁻⁵ M. A linear relationship between the intensity of the peak at 1010 cm−1 and the corresponding concentrations was established through logarithmic transformation, as shown in Fig. 5c. The linear range obtained was from 10−3 M to 10−6 M, with the linear equation represented as y = 7.96 + 1.58 × x, yielding a linear correlation coefficient (R2) of 0.96. Based on the derived linear equation, the limit of detection (LOD) was calculated to be 7.68 × 10⁻⁵ M (details of the LOD calculation are provided in the ESI†).
O) and two amino groups (–NH2), exhibits a Raman spectrum in its powdered state with a prominent scattering peak at 1020 cm−1, attributed to the C–N stretching mode vibrations in its molecular structure (Fig. S5†).42 The Raman spectrum of urea solution at a concentration of 10−3 M on a bare Ag substrate (without SERS materials) does not exhibit any characteristic peaks (Fig. S5†). Fig. 5a illustrates the SERS spectra of urea across a concentration range of 10−3 to 5 × 10⁻⁵ M on the bare Ag NPs. The SERS spectra of urea exhibits a single characteristic band at 1010 cm−1, slightly shifted from the Raman spectrum of the powder, and corresponding to the C–N stretching mode.25,43 This characteristic peak was clearly observed at a concentration of 10−3 M, with decreasing intensity at concentrations of 5 × 10⁻⁴ M and 10−4 M, ultimately disappearing entirely at 5 × 10⁻⁵ M. A linear relationship between the intensity of the peak at 1010 cm−1 and the corresponding concentrations was established through logarithmic transformation, as shown in Fig. 5c. The linear range obtained was from 10−3 M to 10−6 M, with the linear equation represented as y = 7.96 + 1.58 × x, yielding a linear correlation coefficient (R2) of 0.96. Based on the derived linear equation, the limit of detection (LOD) was calculated to be 7.68 × 10⁻⁵ M (details of the LOD calculation are provided in the ESI†).
The combination of two features – “dense hotspots density” and “accessible hotspots” – in the Fe3O4@C@Ag nanostructures substrate promises to enhance the sensor performance of this SERS substrate. Fig. 5b illustrates the SERS detection efficiency for urea using the Fe3O4@C@Ag nanostructures across a concentration range of 10−3 M to 10−9 M. The superior detection capability of the Fe3O4@C@Ag material is evident. Specifically, at concentrations of 10−3, 10−4, and 10−5 M, the peak at 1010 cm−1 is distinctly visible with high intensity and sharpness. In contrast, for the bare Ag NPs substrate, the signal for this peak completely disappears at a concentration of 5 × 10⁻⁵ M. The peak at 1010 cm−1 remains detectable even at a urea concentration of 10−8 M and only vanishes at an extremely low concentration of 10−9 M (see Fig. S6† to better observe the intensity decrease at these two concentrations, compared with the Raman spectrum of the bare Fe3O4@C@Ag substrate). A linear relationship between the logarithmic function of intensity and concentration was established, resulting in a wide linear range from 10−4 M to 10−9 M, described by the equation y = 5.56 + 0.49 × x, with a high R2 value of 0.98 (Fig. 5d). Based on this equation, the LOD was determined to be as low as 5.68 × 10⁻⁹ M. This detection limit for a molecule with a low Raman cross-section like urea, coupled with the extensive linear range from 10−4 M to 10−9 M and a high R2 value, underscores the excellent sensing capabilities of the Fe3O4@C@Ag SERS substrate. The SERS intensities of urea on the bare Ag NPs and Fe3O4@C@Ag substrates are compared in Fig. 5e and f at concentrations of 10−4 M and 10−6 M. It is evident that the Fe3O4@C@Ag substrate exhibits superior sensing performance compared to the bare Ag NPs. Additionally, the EF value was calculated to further highlight the sensitivity of the Fe3O4@C@Ag substrate towards urea (detailed methods for calculating EF are presented in the ESI†). The results indicate that the Fe3O4@C@Ag SERS substrate achieves an EF of up to 3.67 × 10⁶ times, while the bare Ag NPs substrate demonstrates a modest EF of only 984 times. The combination of two key features – “dense hotspot density” and “accessible hotspots” – in Fe3O4@C@Ag likely plays a pivotal role in its superior performance compared to bare Ag NPs. The limited interaction of bare Ag NPs with urea, as demonstrated through adsorption experiments, results in urea molecules struggling to reach the Ag surface and hotspots, thus yielding lower sensor efficiency. In contrast, the carbon layer beneath the Ag layer in Fe3O4@C@Ag helps attract urea molecules to the hotspots generated by Ag on the surface. This, combined with the dense hotspot density not only on a single Fe3O4@C@Ag particle but also on a large area of the Fe3O4@C@Ag material, results in a significantly enhanced urea signal.
Table 1 compares the urea detection performance of Fe3O4@C@Ag nanostructures with that of recently published SERS substrates. The designed Fe3O4@C@Ag nanostructures exhibit superior sensing capabilities due to the synergistic combination of two key features: “dense hotspots density” and “accessible hotspots”. They achieve a LOD as low as 10−9 M, in stark contrast to other nanostructures, which only reach LODs between 10−3 and 10−6 M. Additionally, the EF value of up to 106 times for the challenging-to-detect molecule urea highlights the remarkable SERS enhancement potential of this designed SERS substrate.
| Substrate material | LOD | EF | Reliability | Ref. |
|---|---|---|---|---|
| Au/Cu hybrid nanostructure arrays | 1.0 × 10⁻³ M | — | 9.5% | 25 |
| Ag–Au compound | 1.0 × 10⁻³ M | — | — | 31 |
| Ag dendrite | 3.3 × 10⁻³ M | 44 | ||
| TiO2 nanofilms | 4.23 × 10⁻³ M | — | 4.51% | 45 |
| Au@Ag NPs | 0.83 × 10⁻⁵ M | — | — | 46 |
| Ag/TiO2 | 4.6 × 10⁻⁶ M | — | 8.53% | 32 |
| Fe3O4@C@Ag | 5.68 × 10⁻⁹ M | 3.67 × 10⁶ | 9.20% | This work |
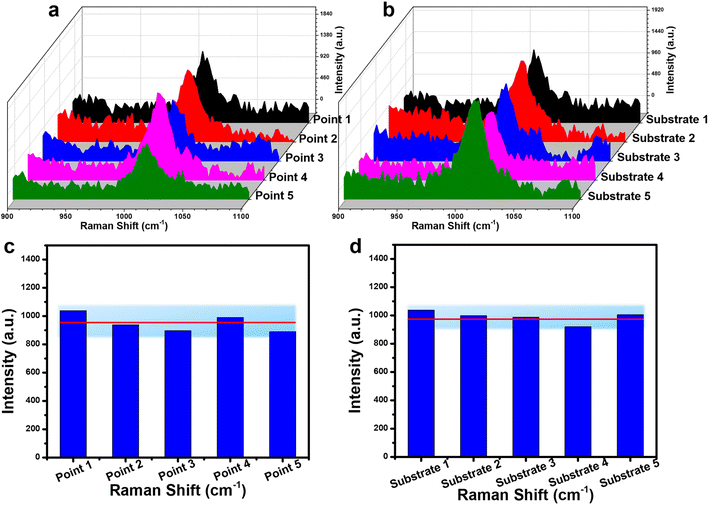
The reliability of the Fe3O4@C@Ag substrate for urea detection was evaluated through two key parameters: repeatability and reproducibility. Repeatability was assessed by collecting SERS spectra from five different points on a single SERS substrate at a urea concentration of 10−6 M. The results, depicted in Fig. 6a and c, demonstrate that the SERS signals from these five distinct points are remarkably consistent. Quantitatively, the RSD value was calculated to be 9.20% (detailed calculations are provided in the ESI†). Reproducibility was examined by measuring the SERS spectra on five separate substrates across five different preparations at the same concentration of 10−6 M (Fig. 6b and d). The results indicate that the Fe3O4@C@Ag substrate exhibits strong reproducibility, with an RSD value of 9.58%. Consequently, with both repeatability and reproducibility RSD values significantly below 10%, the Fe3O4@C@Ag nanostructures not only demonstrate ultra-high sensitivity but also provide excellent reliability in detecting urea.
3.3. Practicability of a Fe3O4@C@Ag nanostructure-based SERS sensor for urea detection
To investigate the practicability of a Fe3O4@C@Ag nanostructure-based SERS sensor for urea detection, we analyzed the presence of urea in two representative real sample environments corresponding to two important applications: early diagnosis and water quality analysis. These included artificial urine and tap water samples, with the preparation details outlined in Section 2.4. Four concentrations within the linear detection range (10−5, 10−6, 10−7, and 10−8 M) were selected for this experiment. Artificial urine and tap water samples containing urea at these concentrations were prepared. These real samples were used directly for SERS signal acquisition without any additional preprocessing steps. The SERS substrates were prepared in the same manner as for the standard solution experiments. For the artificial urine, droplets containing urea at different concentrations were directly deposited onto the SERS substrate and dried at room temperature. Subsequently, SERS signals were collected from these substrates, and the results are presented in Fig. 7, showing a comparison with the signal intensity obtained from standard solutions. Overall, urea signals from artificial urine samples at the prepared concentrations were still observed, with a slight reduction in intensity compared to standard solutions. At a concentration of 10−5 M (Fig. 7a), the characteristic peak of urea in the artificial urine sample was clearly observed, albeit with a slightly reduced intensity compared to the standard solution. This reduction could be attributed to the presence of other components in the artificial urine sample. However, these interfering factors did not significantly affect the urea signals obtained. At lower concentrations of 10−6, 10−7, and 10−8 M (shown in Fig. 7b–d, respectively), the characteristic urea peaks remained detectable. This demonstrates the Fe3O4@C@Ag nanostructure-based SERS sensor's excellent capability for detecting urea even in complex environments like artificial urine. The detected urea concentrations were calculated based on the intensity of the 1010 cm−1 peak and the linear equation y = 5.56 + 0.49x obtained from the standard solution experiments. The results are shown in Table 2, and the recovery values were calculated, showing excellent results ranging from 90% to 98%. These findings highlight the good practicality of the Fe3O4@C@Ag nanostructure-based SERS sensor for detecting urea in artificial urine. With its ultrasensitive sensing performance and demonstrated practicality for detecting urea in artificial urine, the Fe3O4@C@Ag nanostructure-based SERS sensor shows great potential for applications in early diagnosis or trace-level urea detection.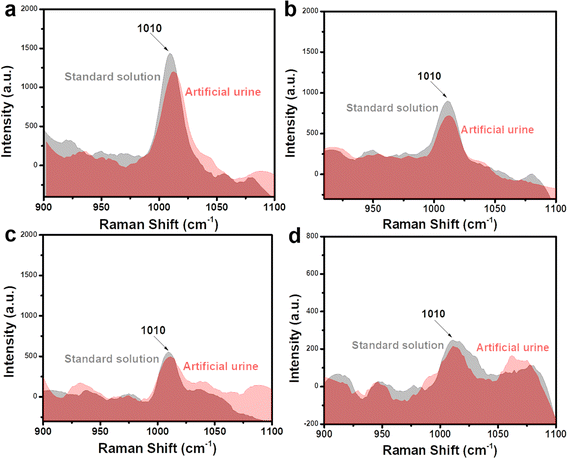 | ||
| Fig. 7 Comparison of SERS signals of urea obtained from artificial urine sample with the standard solution at concentrations of 10−5 M (a), 10−6 M (b), 10−7 M (c), and 10−8 M (d). | ||
| Samples | Spiked (M) | Detected at 1010 cm−1 (M) | Recovery (%) |
|---|---|---|---|
| Artificial urine | 10−5 | 9.20 × 10⁻⁶ | 94 |
| 10−6 | 9.05 × 10⁻⁷ | 90 | |
| 10−7 | 9.80 × 10⁻⁸ | 98 | |
| 10−8 | 9.55 × 10⁻⁹ | 95 | |
| Tap water | 10−5 | 9.40 × 10⁻⁶ | 94 |
| 10−6 | 9.60 × 10⁻⁷ | 96 | |
| 10−7 | 9.90 × 10⁻⁸ | 99 | |
| 10−8 | 9.70 × 10⁻⁹ | 97 |
The ultrasensitive sensing performance of Fe3O4@C@Ag nanostructures was further leveraged to analyze trace-level urea residues in tap water used for daily consumption. Similar to the artificial urine sample, the SERS sensing results are presented in Fig. 8, with four concentration points: 10−5 M (Fig. 8a), 10−6 M (Fig. 8b), 10−7 M (Fig. 8c), and 10−8 M (Fig. 8d). The characteristic peak of urea is clearly observed at all four concentrations. The recovery values (Table 2) ranged from 94% to 99%, indicating the good practicality of the Fe3O4@C@Ag nanostructure-based SERS substrate. Such ultrasensitive detection performance and high practicality highlight the value of this SERS sensor for water quality monitoring, particularly regarding urea residues. The daily consumption of water containing even low levels of urea poses significant health risks, emphasizing the importance of effective monitoring.
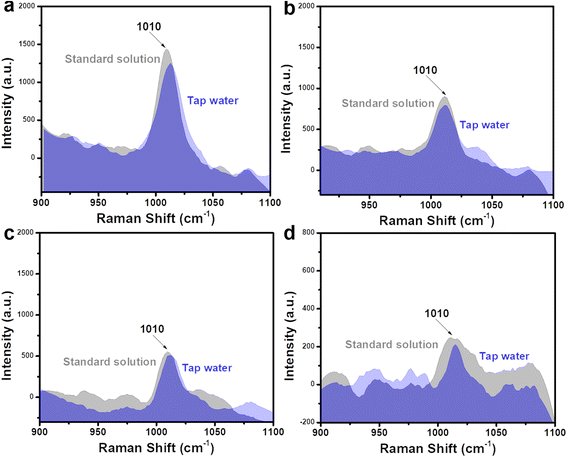 | ||
| Fig. 8 Comparison of SERS signals of urea obtained from tap water sample with the standard solution at concentrations of 10−5 M (a), 10−6 M (b), 10−7 M (c), and 10−8 M (d). | ||
4. Conclusions
This study successfully synthesized Fe3O4@C@Ag as a SERS substrate to address the challenges posed by urea, a low-Raman cross-section molecule crucial for disease diagnosis and residual analysis. The substrate integrates two key features: “dense hotspot density” and “accessible hotspots”, enabling exceptional performance in detecting urea. The achievement include (i) a limit of detection of 5.68 × 10⁻⁹ M, (ii) a broad linear detection range from 10−4 to 10−9 M, (iii) a high linearity coefficient of 0.98, (iv) a high enhancement factor of 3.67 × 10⁶, and (v) high reliability. Compared to conventional techniques like enzymatic assays and HPLC, which struggle with low sensitivity and matrix interference, the SERS-based approach in this study offers higher sensitivity, a broader detection range, and rapid, label-free analysis with minimal sample preparation. The Fe3O4@C@Ag substrate outperforms traditional SERS materials like Ag and Au composites by combining dense hotspots and efficient urea molecule attraction, enabling superior sensing performance. Additionally, the practicability of the Fe3O4@C@Ag substrate was demonstrated using artificial urine and tap water samples. The substrate reliably detected urea across concentrations as low as 10−8 M, achieving good recovery rates between 90% and 99%, even in complex sample matrices. However, the multi-step fabrication process may hinder scalability, and further studies are needed to evaluate its effectiveness for other low Raman cross-section molecules. The SERS Fe3O4@C@Ag nanostructures have further expanded the application potential of the SERS technique for low Raman cross-section molecules like urea. These findings also pave the way for new SERS-based analyses and diagnostics related to this important molecule, urea.Data availability
The data that support the findings of this study are available from the corresponding author upon reasonable request. All experimental data, including the characterization of the Fe3O4@C@Ag nanostructures and the detection results of urea biomolecules, are included within the manuscript and its ESI.†Author contributions
Q. D. Mai: conceptualization, methodology, investigation, formal analysis, data curation, supervision, writing – original draft; D. T. H. Trang: formal analysis, investigation, validation; N. T. Loan: validation, investigation; D. T. Linh: validation, formal analysis, investigation; N. T. Thanh: validation, investigation; B. H. Nhung: validation, investigation; O. V. Hoang: validation, investigation; N. X. Quang: validation, investigation; T. N. Bach: validation, investigation; A. T. Pham: methodology, supervision; A. T. Le: conceptualization, methodology, supervision, project administration, writing – review & editing.Conflicts of interest
The authors declare that they have no known competing financial interests or personal relationships that could have appeared to influence the work reported in this paper.Acknowledgements
This research was acknowledged to the Phenikaa University under grant number PU2023-2-A-03 & A&A Green Phoenix Group JSC through financial supports for Key Research Group (NEB Lab). The authors would like to acknowledge the supports for Raman measurements from NEB Lab (Phenikaa University) and FE-SEM measurement from IMS-VAST.References
- X. X. Han, R. S. Rodriguez, C. L. Haynes, Y. Ozaki and B. Zhao, Surface-enhanced Raman spectroscopy, Nat. Rev. Methods Primers, 2021, 1(1), 87 CrossRef CAS.
- J. Langer, D. Jimenez de Aberasturi, J. Aizpurua, R. A. Alvarez-Puebla, B. Auguié and J. J. Baumberg, et al., Present and future of surface-enhanced Raman scattering, ACS Nano, 2019, 14(1), 28–117 CrossRef PubMed.
- S. Zeng, D. Baillargeat, H.-P. Ho and K.-T. Yong, Nanomaterials enhanced surface plasmon resonance for biological and chemical sensing applications, Chem. Soc. Rev., 2014, 43(10), 3426–3452 RSC.
- S. Nie and S. R. Emory, Probing single molecules and single nanoparticles by surface-enhanced Raman scattering, Science, 1997, 275(5303), 1102–1106 CrossRef CAS PubMed.
- L. Jiang, M. M. Hassan, S. Ali, H. Li, R. Sheng and Q. Chen, Evolving trends in SERS-based techniques for food quality and safety: a review, Trends Food Sci. Technol., 2021, 112, 225–240 CrossRef CAS.
- R. A. Halvorson and P. J. Vikesland, Surface-enhanced Raman spectroscopy (SERS) for environmental analyses, Environ. Sci. Technol., 2010, 44(20), 7749–7755 CrossRef CAS PubMed.
- S.-Y. Ding, J. Yi, J.-F. Li, B. Ren, D.-Y. Wu and R. Panneerselvam, et al., Nanostructure-based plasmon-enhanced Raman spectroscopy for surface analysis of materials, Nat. Rev. Mater., 2016, 1(6), 1–16 Search PubMed.
- D. Cialla-May, A. Bonifacio, T. Bocklitz, A. Markin, N. Markina and S. Fornasaro, et al., Biomedical SERS–the current state and future trends, Chem. Soc. Rev., 2024, 53, 8957–8979 RSC.
- R. A. Alvarez-Puebla and L. M. Liz-Marzán, SERS-based diagnosis and biodetection, Small, 2010, 6(5), 604–610 CrossRef CAS PubMed.
- M. F. Cardinal, E. Vander Ende, R. A. Hackler, M. O. McAnally, P. C. Stair and G. C. Schatz, et al., Expanding applications of SERS through versatile nanomaterials engineering, Chem. Soc. Rev., 2017, 46(13), 3886–3903 RSC.
- O. Siiman, L. Bumm, R. Callaghan, C. Blatchford and M. Kerker, Surface-enhanced Raman scattering by citrate on colloidal silver, J. Phys. Chem., 1983, 87(6), 1014–1023 CrossRef CAS.
- S. E. Bell and M. R. McCourt, SERS enhancement by aggregated Au colloids: effect of particle size, Phys. Chem. Chem. Phys., 2009, 11(34), 7455–7462 RSC.
- R. G. Freeman, K. C. Grabar, K. J. Allison, R. M. Bright, J. A. Davis and A. P. Guthrie, et al., Self-assembled metal colloid monolayers: an approach to SERS substrates, Science, 1995, 267(5204), 1629–1632 CrossRef CAS PubMed.
- Q.-D. Mai, D. C. Thanh, N. T. Anh, T. Van Manh, T. N. Bach and H.-A. Nguyen, et al., Smart 3D Ag-decorated TiO2 Nanostructure: An Advanced Synergistic SERS Substrate for Trace Detection of Analytes with Diverse Natures, Sens. Actuators, B, 2024, 135651 CrossRef CAS.
- M. J. Banholzer, J. E. Millstone, L. Qin and C. A. Mirkin, Rationally designed nanostructures for surface-enhanced Raman spectroscopy, Chem. Soc. Rev., 2008, 37(5), 885–897 RSC.
- S. Fateixa, H. I. Nogueira and T. Trindade, Hybrid nanostructures for SERS: materials development and chemical detection, Phys. Chem. Chem. Phys., 2015, 17(33), 21046–21071 RSC.
- T. Wang, S. Wang, Z. Cheng, J. Wei, L. Yang and Z. Zhong, et al., Emerging core–shell nanostructures for surface-enhanced Raman scattering (SERS) detection of pesticide residues, Chem. Eng. J., 2021, 424, 130323 CrossRef CAS.
- J. F. Li, Y. F. Huang, Y. Ding, Z. L. Yang, S. B. Li and X. S. Zhou, et al., Shell-isolated nanoparticle-enhanced Raman spectroscopy, Nature, 2010, 464(7287), 392–395 CrossRef CAS PubMed.
- R. A. Alvarez-Puebla and L. M. Liz-Marzán, SERS detection of small inorganic molecules and ions, Angew. Chem., Int. Ed., 2012, 51(45), 11214–11223 CrossRef CAS PubMed.
- C. Penney, L. Goldman and M. Lapp, Raman scattering cross sections, Nat. Phys. Sci., 1972, 235(58), 110–112 CrossRef CAS.
- S. Shim, C. M. Stuart and R. A. Mathies, Resonance Raman cross-sections and vibronic analysis of Rhodamine 6G from broadband stimulated Raman spectroscopy, ChemPhysChem, 2008, 9(5), 697–699 CrossRef CAS PubMed.
- C. D. Tschannen, G. Gordeev, S. Reich, L. Shi, T. Pichler and M. Frimmer, et al., Raman scattering cross section of confined carbyne, Nano Lett., 2020, 20(9), 6750–6755 CrossRef CAS PubMed.
- R. Aggarwal, L. Farrar, S. Di Cecca and T. Jeys, Raman spectra and cross sections of ammonia, chlorine, hydrogen sulfide, phosgene, and sulfur dioxide toxic gases in the fingerprint region 400–1400 cm−1, AIP Adv., 2016, 6(2), 025310 CrossRef.
- D. Fouche and R. Chang, Relative Raman cross section for O3, CH4, C3H8, NO, N2O, and H2, Appl. Phys. Lett., 1972, 20(7), 256–257 CrossRef CAS.
- K. Chen, X. Zhang and D. R. MacFarlane, Ultrasensitive surface-enhanced Raman scattering detection of urea by highly ordered Au/Cu hybrid nanostructure arrays, Chem. Commun., 2017, 53(56), 7949–7952 RSC.
- S. N. Botewad, D. K. Gaikwad, N. B. Girhe, H. N. Thorat and P. P. Pawar, Urea biosensors: a comprehensive review, Biotechnol. Appl. Biochem., 2023, 70(2), 485–501 CrossRef CAS PubMed.
- C. Bai, H. Wang, D. Dong, T. Li, Z. Yu and J. Guo, et al., Urea as a by-product of ammonia metabolism can be a potential serum biomarker of hepatocellular carcinoma, Front. Cell Dev. Biol., 2021, 9, 650748 CrossRef PubMed.
- D. Weerakoon, B. Bansal, L. P. Padhye, A. Rachmani, L. J. Wright and G. S. Roberts, et al., A critical review on current urea removal technologies from water: an approach for pollution prevention and resource recovery, Sep. Purif. Technol., 2023, 314, 123652 CrossRef CAS.
- F. Shalileh, H. Sabahi, M. Dadmehr and M. Hosseini, Sensing approaches toward detection of urea adulteration in milk, Microchem. J., 2023, 193, 108990 CrossRef CAS.
- M. Krämer, H. Fry and O. Kappenstein, Development and validation of two analytical methods for urea determination in compound feed, including pet food, and yeast using high-performance liquid chromatography coupled with fluorescence detection and tandem mass spectrometry, Food Addit. Contam.,:Part A, 2021, 38(6), 931–942 CrossRef PubMed.
- Y. Li, Q. Li, C. Sun, S. Jin, Y. Park and T. Zhou, et al., Fabrication of novel compound SERS substrates composed of silver nanoparticles and porous gold nanoclusters: a study on enrichment detection of urea, Appl. Surf. Sci., 2018, 427, 328–333 CrossRef CAS.
- Q. D. Mai, H. A. Nguyen, T. L. H. Phung, N. Xuan Dinh, Q. H. Tran and T. Q. Doan, et al., Photoinduced Enhanced Raman Spectroscopy for the Ultrasensitive Detection of a Low-Cross-Section Chemical, Urea, Using Silver–Titanium Dioxide Nanostructures, ACS Appl. Nano Mater., 2022, 5(10), 15518–15530 CrossRef CAS.
- N. Sarigul, F. Korkmaz and İ. Kurultak, A new artificial urine protocol to better imitate human urine, Sci. Rep., 2019, 9(1), 20159 CrossRef CAS PubMed.
- W. Xie, L. Gu, X. Sun, M. Liu, S. Li and Q. Wang, et al., Ferrocene derived core-shell structural Fe3O4@C nanospheres for superior lithium storage properties, Electrochim. Acta, 2016, 220, 107–113 CrossRef CAS.
- J. Zheng, Z. Liu, X. Zhao, M. Liu, X. Liu and W. Chu, One-step solvothermal synthesis of Fe3O4@C core–shell nanoparticles with tunable sizes, Nanotechnology, 2012, 23(16), 165601 CrossRef CAS PubMed.
- Z. Li, L. Deng, I. A. Kinloch and R. J. Young, Raman spectroscopy of carbon materials and their composites: graphene, nanotubes and fibres, Prog. Mater. Sci., 2023, 135, 101089 CrossRef CAS.
- X. Liang, N. Li, R. Zhang, P. Yin, C. Zhang and N. Yang, et al., Carbon-based SERS biosensor: from substrate design to sensing and bioapplication, NPG Asia Mater., 2021, 13(1), 8 CrossRef CAS.
- M. M. Sabzehmeidani, S. Mahnaee, M. Ghaedi, H. Heidari and V. A. Roy, Carbon based materials: a review of adsorbents for inorganic and organic compounds, Mater. Adv., 2021, 2(2), 598–627 RSC.
- Á. de Jesús Ruíz-Baltazar, S. Y. Reyes-López, M. de Lourdes Mondragón-Sánchez, A. I. Robles-Cortés and R. Pérez, Eco-friendly synthesis of Fe3O4 nanoparticles: evaluation of their catalytic activity in methylene blue degradation by kinetic adsorption models, Results Phys., 2019, 12, 989–995 CrossRef.
- S. Tiwari, R. Prakash, R. Choudhary and D. Phase, Oriented growth of Fe3O4 thin film on crystalline and amorphous substrates by pulsed laser deposition, J. Phys. D: Appl. Phys., 2007, 40(16), 4943 CrossRef CAS.
- Y. Wei, R. Klajn, A. O. Pinchuk and B. A. Grzybowski, Synthesis, shape control, and optical properties of hybrid Au/Fe3O4 nanoflowers, Small, 2008, 4, 1635–1639 CrossRef CAS PubMed.
- R. L. Frost, J. Kristof, L. Rintoul and J. T. Kloprogge, Raman spectroscopy of urea and urea-intercalated kaolinites at 77 K, Spectrochim. Acta, Part A, 2000, 56(9), 1681–1691 CrossRef PubMed.
- A. Culka and J. Jehlička, Raman microspectrometric investigation of urea in calcite and gypsum powder matrices, J. Raman Spectrosc., 2010, 41(12), 1743–1747 CrossRef.
- Dendritic silver microstructures as highly sensitive SERS platform for the detection of trace urea, IOP Conference Series: Materials Science and Engineering, ed. Wen J., Song F., Du Y., Yu W. and Qiang R., 2019, vol. 688033040 Search PubMed.
- Z. Meng, L. Zhu, J. Wang, T. Li, C. He and R. Liu, et al., TiO2 nanofilms for surface-enhanced Raman scattering analysis of urea, Talanta, 2024, 279, 126664 CrossRef CAS PubMed.
- A. Hussain, D.-W. Sun and H. Pu, SERS detection of urea and ammonium sulfate adulterants in milk with coffee ring effect, Food Addit. Contam.,:Part A, 2019, 36(6), 851–862 CrossRef CAS PubMed.
Footnotes |
| † Electronic supplementary information (ESI) available: All experimental data, including the characterization of the Fe3O4@C@Ag nanostructures and the detection results of urea biomolecules. See DOI: https://doi.org/10.1039/d4ra07487d |
| ‡ Q. D. Mai and D. T. H. Trang contributed equally to this work. |
| This journal is © The Royal Society of Chemistry 2025 |

