
 Open Access Article
 This Open Access Article is licensed under a Creative Commons Attribution-Non Commercial 3.0 Unported Licence
Green one-pot synthesis of quinoxaline derivatives using sulfo-anthranilic acid functionalized alginate-MCFe2O4 nanostructures: a novel superparamagnetic catalyst with antiproliferative potential†
Ying Lai * and
Ruoyu Zhang*
* and
Ruoyu Zhang*
Department of Life Science and Agriculture, Zhoukou Normal University, Zhoukou, Henan 466001, China. E-mail: 20041026@zknu.edu.cn; ruoyzh@163.com
First published on 20th January 2025
Abstract
This study reports a green, multi-component synthesis of 2-aminoimidazole–linked quinoxaline Schiff bases using a novel superparamagnetic acid catalyst. The catalyst consists of sulfo-anthranilic acid (SAA) immobilized on MnCoFe2O4@alginate magnetic nanorods (MNRs), achieving high SAA loading (1.8 mmol g−1) and product yields (91–97%). Characterization of the MCFe2O4@Alginate@SAA MNR catalyst revealed an inverse spinel structure (XRD), a saturation magnetization of 31 emu g−1 (VSM), 17.5% organic content (TGA), and a rod-like morphology with diameters of 30–60 nm and lengths of 150–250 nm (SEM). Elemental composition confirmed by EDX analysis indicated successful SAA immobilization and high catalyst purity. The synthesized quinoxaline derivatives were evaluated for antiproliferative activity against SKOV3 and HCT-116 cancer cell lines using the MTT assay. Several compounds, notably 4a, 4s, 4t, 4w, and 4x, exhibited potent activity, inhibiting HCT-116 proliferation by >50% at 50 μg mL−1. Compound 4a demonstrated the most significant inhibition, with 82.3% against SKOV3 cells after 48 h and 69.0% against HCT-116 cells after 24 h, both at 50 μg mL−1. These results suggest the potential of 2-aminoimidazole–linked quinoxaline Schiff bases, particularly 4a, as promising multi-target chemotherapy agents.
1 Introduction
Cancer is a grave ailment that presently affects people of all ages and has contributed to the escalation of mortality rates worldwide.1,2 Despite the vast array of anti-cancer medications available, the creation of novel chemotherapeutic agents has persistently posed a remarkable challenge due to their non-selectivity and the propensity of cancerous cells to develop resistance towards existing anti-cancer compounds. Consequently, there is an incessant need to explore better alternatives to cope with these impending challenges.3 Our research is actively searching for chemical substances that could be developed into novel antitumor agents.1 Among the compounds of particular interest are imidazole and quinoxaline derivatives.4–7 These derivatives have recently emerged as a new class of cancer chemotherapeutic agents, demonstrating remarkable efficacy in treating solid tumors.7,8 It is well-known that imidazole derivatives are potent inhibitors of the epidermal growth factor receptor (EGFR).9,10 The EGFR is a cellular transmembrane tyrosine kinase overexpressed in many human tumors, such as breast, ovarian, colon, and prostate.11–13 The expression levels of EGFR often correlate with vascularity and are associated with poor prognosis in patients.12 Therefore, inhibitors of EGFR PTK are expected to have tremendous therapeutic potential in treating both malignant and non-malignant epithelial diseases.14 Several different structural classes of tyrosine kinase inhibitors have been reported and reviewed.15 Among them, the most promising small-molecule selective EGFR-TK inhibitors include imidazole and quinoxaline.16,17One such example is dacarbazine, an antineoplastic drug containing a 2-aminoimidazole nucleus, which has been utilized for treating cancers such as malignant melanoma, Hodgkin lymphoma, sarcoma, and carcinoma of the pancreas.17,18 Marine sources have also yielded several 2-aminoimidazole alkaloids, including Namine A, Naamine G, Girolline, and Preclathridine A, that exhibit exceptional anti-cancer properties (Fig. 1).19,20 Extensive exploration in the field of tyrosine kinase inhibitors has resulted in the discovery of a plethora of active compounds. In addition to aminoimidazole, quinoxaline have shown effectiveness as selective ATP competitive inhibitors.17,21 Specifically, AG 1295 and AG 1385 (Fig. 1) are quinoxaline derivatives that block EGFR kinase activity selectively.22,23 This particular molecule has effectively reversed the transformed characteristics of sis-transformed NIH 3T3 cells and has demonstrated the ability to slow the growth of C6 glioma-induced tumors in nude mice.24
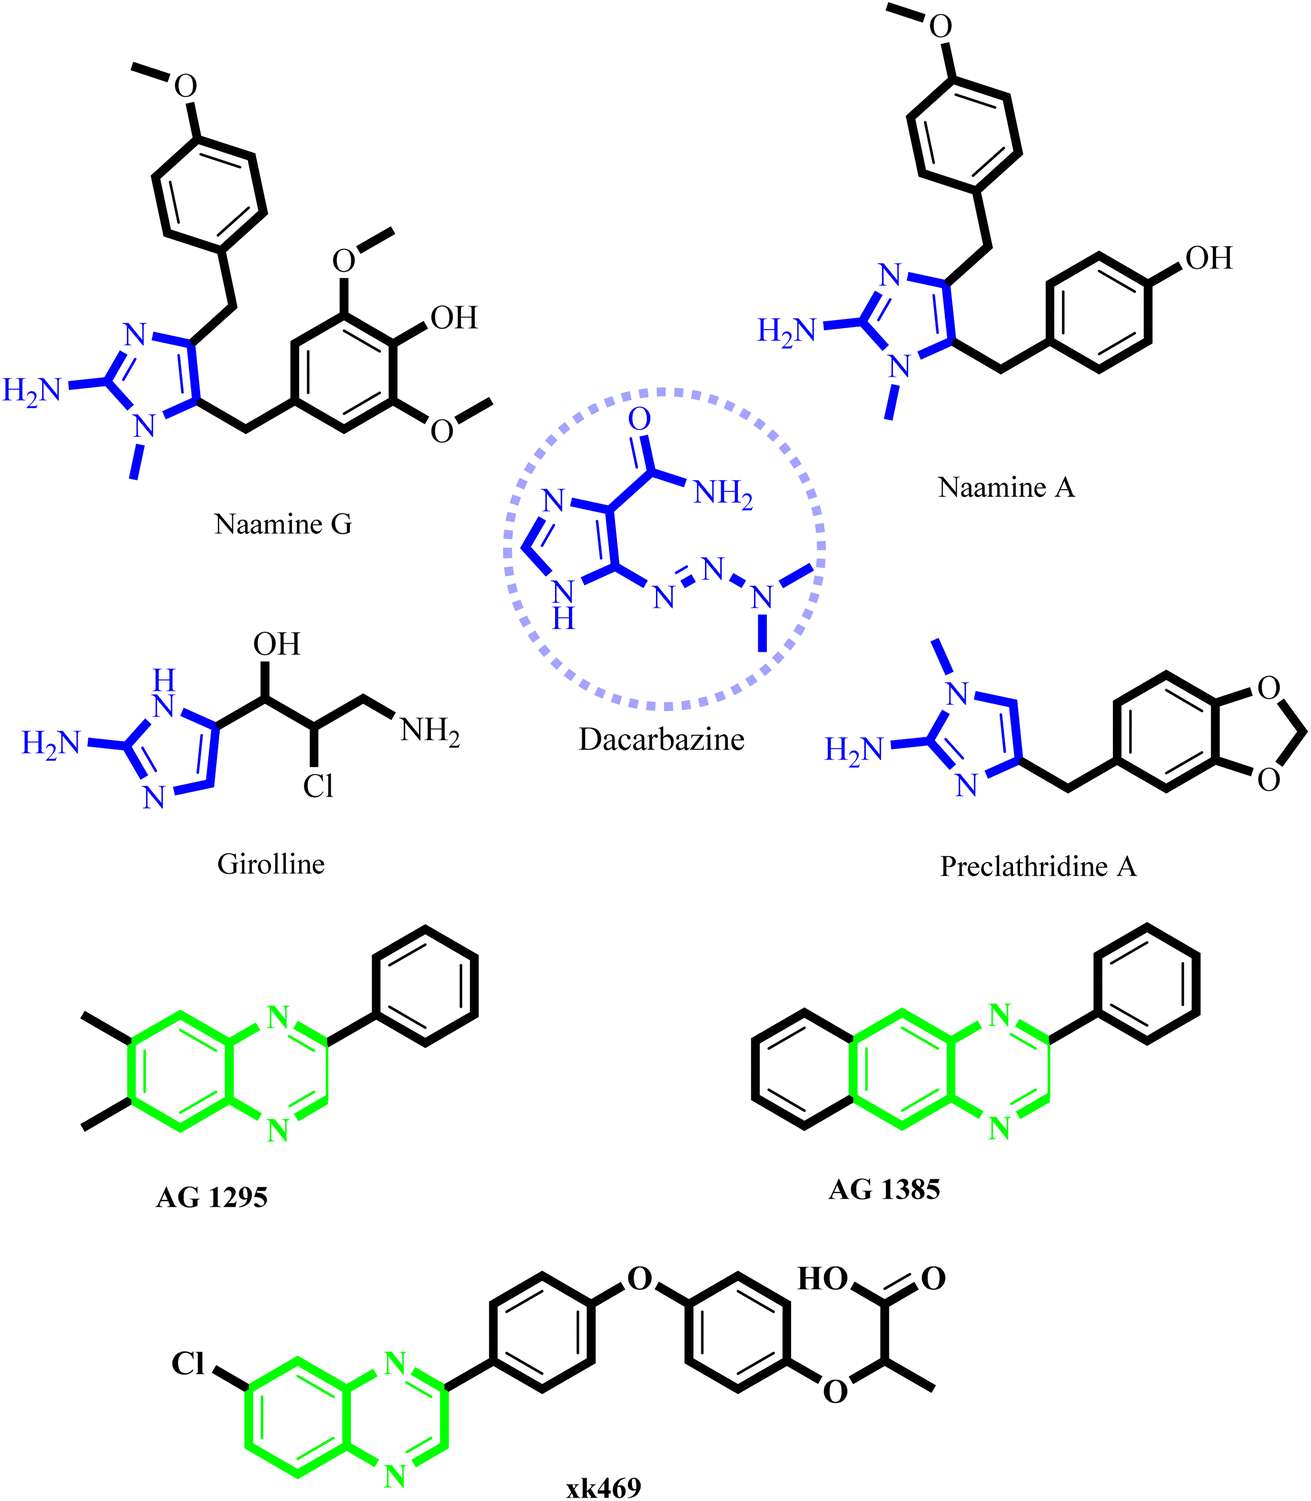 | ||
| Fig. 1 Some naturally occurring 2-aminoimidazoles and quinoxalines with anti-proliferative activity. | ||
In recent years, there has been an intensified focus on green and sustainable chemistry in the development of novel therapeutic agents. The principles of green chemistry emphasize minimizing hazardous substances and reducing environmental impact during the synthesis of bioactive compounds. Recent studies have highlighted the importance of designing environmentally friendly synthetic routes for producing biologically active molecules, including imidazole and quinoxaline derivatives, which exhibit significant anticancer potential.25,26 For example, the use of efficient and sustainable catalytic systems for synthesizing quinoxaline derivatives has been reported to yield compounds with enhanced biological activities.27 Similarly, the integration of green chemistry approaches, such as solvent-free reactions and the utilization of recyclable catalysts, has been demonstrated to improve the overall efficiency and sustainability of the synthesis process.28,29 These advancements underscore the potential of green synthetic methodologies in addressing the challenges associated with traditional drug development.
A promising strategy for effectively combating cancer, alongside the clinical approach of developing polychemotherapy, involves synthesizing hybrid molecules with multiple functional components targeting various biological aspects.30 In our recent research, we have introduced a novel environmentally friendly synthesis technique and conducted a thorough biological assessment of hybrid molecules consisting of diverse imidazole-based Schiff bases combined with a quinoxaline core.31 These molecules have significant potential as anti-cancer agents.10,12
To evaluate the biological activity of these compounds, we selected two cancer cell lines, HCT-116 and SKOV3, as in vitro models. The HCT-116 cell line, derived from human colorectal carcinoma, is widely used in cancer research due to its well-characterized genetic profile, including mutations in key oncogenes such as p53 and K-ras. These genetic alterations make HCT-116 an ideal model for studying the molecular mechanisms of colorectal cancer and assessing the efficacy of anticancer agents.32 Colorectal cancer is one of the most common and deadly cancers worldwide, further emphasizing the importance of this model in drug discovery studies.
Similarly, the SKOV3 cell line, derived from human ovarian carcinoma, is a well-established model for ovarian cancer research. This cell line is particularly valuable due to its aggressive phenotype, resistance to platinum-based chemotherapy, and ability to mimic the advanced stages of ovarian cancer.33 Ovarian cancer remains a significant clinical challenge due to its poor prognosis and high mortality rates, making SKOV3 an essential model for evaluating the therapeutic potential of novel compounds. To ensure the selectivity and safety of the synthesized compounds, the HFF (Human Foreskin Fibroblast) cell line was employed as a model for normal, non-cancerous cells. This cell line provides a reliable control for comparing the cytotoxic effects of the compounds on cancerous versus healthy cells, thereby enabling the identification of compounds with selective anticancer activity.
What adds to the importance of our research is describing a green synthesis route for producing a highly efficient and leak-free multifunctional heterogeneous magnetic nanocatalyst via grafting sulfonic groups onto the surface of MCFe2O4 MNPs coated with biopolymer layer (alginate) as an efficacious bridge.34–37 The alginate layer possesses two functional heads: an OH moiety that strongly binds to the MCFe2O4 surface hydroxyl groups and COOH groups that bind to the NH group of Sulpho Anthranilic Acid (Scheme 1). Subsequently, we investigated the effectiveness of the newly synthesized organic–inorganic hybrid (MCFe2O4@Alginate@SAA) as a nanocatalyst with a core–shell structure for synthesizing innovative compounds containing quinoxaline via a one-pot cascade reaction. Based on the structural design of these hybrid ligands, significant anti-proliferative activities were observed against tumor cell lines derived from human ovaries and colon. The integration of green chemistry principles in this research highlights the potential of sustainable synthetic methodologies in the development of novel anticancer agents.38–40
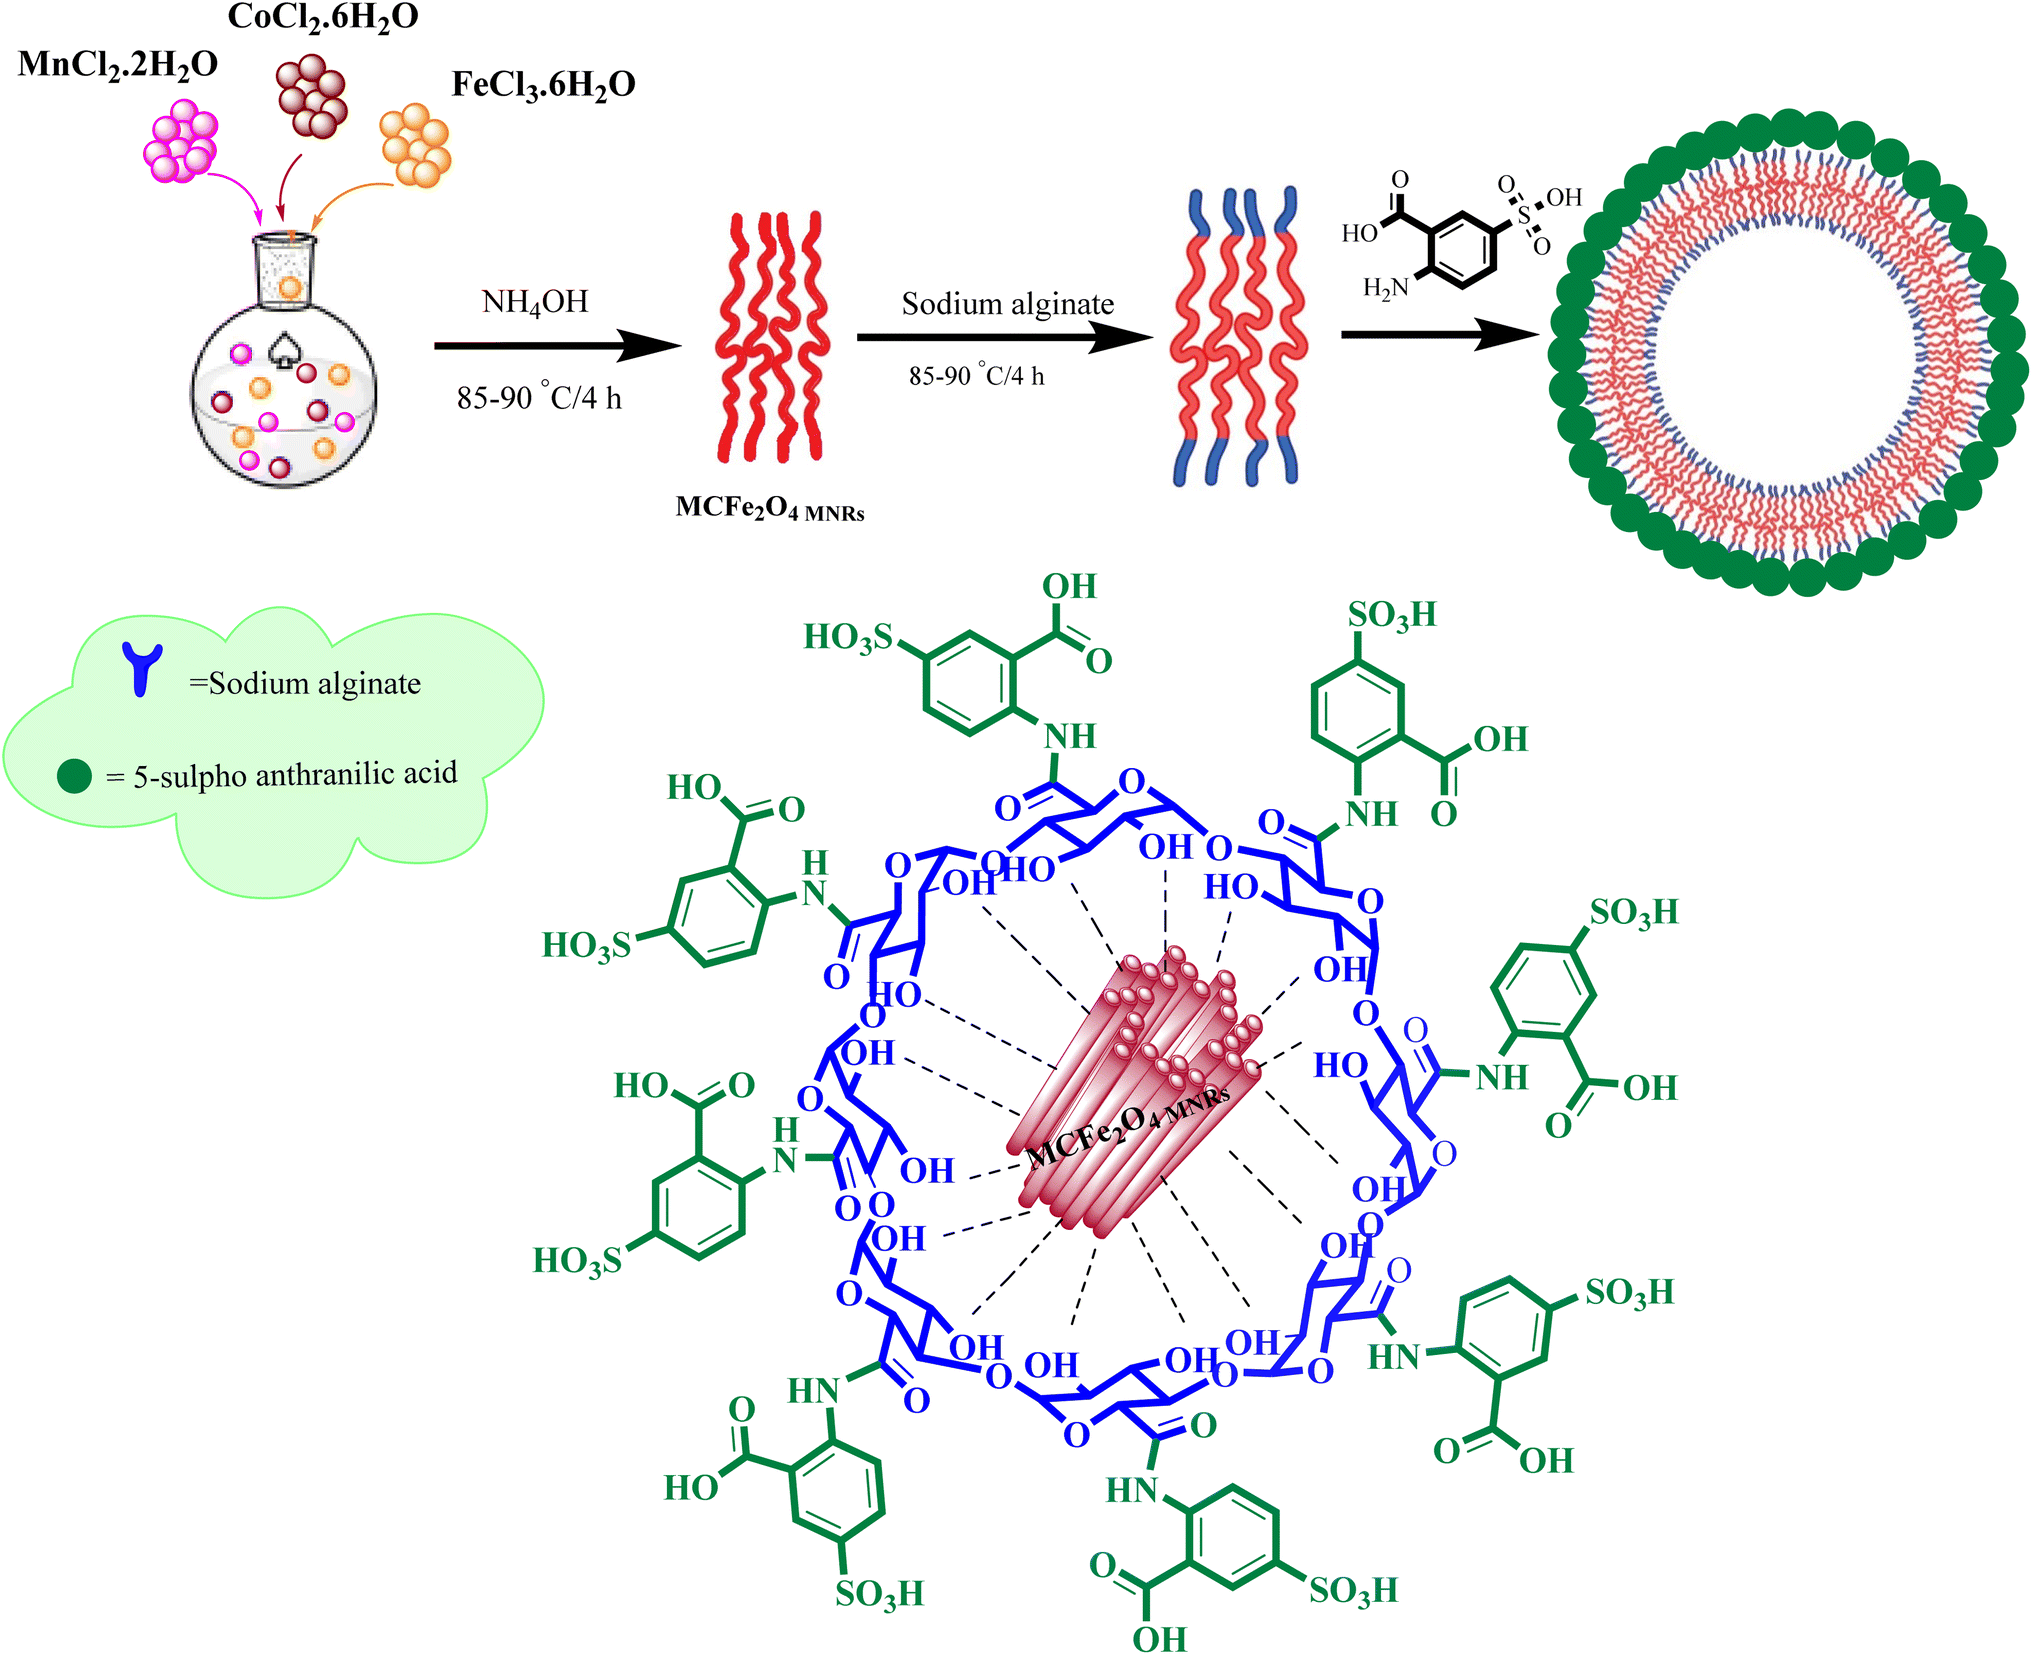 | ||
| Scheme 1 Synthesis of MCFe2O4@Alginate@SAA. | ||
In the current investigation, through the implementation of green synthesis, the substitution pattern was chosen for the disubstituted quinoxaline pharmacophore to create distinct electronic environments that could influence the lipophilicity of the target molecules and, ultimately, their activity. The main aim of generating these hybrids is to strive for the production of an efficient antitumor agent with amplified activity and selectivity, specifically towards cancerous cells.
2 Experimental section
2.1 Chemistry
2.2 MTT assay
We investigated the potential anti-proliferative effects of 2-aminoimidazole derivatives (compounds 4a–x) on two human cancer cell lines: HCT-116 (colon cancer) and SK-OV-3 (ovarian cancer). The evaluation was performed using an in vitro MTT assay to assess cell viability after treatment with the synthesized compounds. HCT-116 and SK-OV-3 cells were cultured in Dulbecco's Modified Eagle Medium (DMEM) supplemented with 10% fetal bovine serum (FBS) and penicillin–streptomycin (100 U per mL penicillin, 100 μg per mL streptomycin). Cells were maintained at 37 °C in a humidified atmosphere containing 5% CO2. Once the cells reached approximately 70–80% confluence, they were washed with phosphate-buffered saline (PBS, pH 7.4) to remove residual media and detached using 0.25% trypsin–EDTA solution by incubating for 2–5 minutes until cells detached. The trypsinization process was halted by adding complete DMEM, and the cell suspension was centrifuged at 1000 rpm for 5 minutes. The supernatant was discarded, and the cell pellet was resuspended in fresh complete medium. Cell density was determined using a hemocytometer to ensure accurate seeding.Cells were seeded into 96-well plates at a density of 1 × 10⁴ cells per well in 100 μL of complete DMEM and incubated overnight (approximately 18–24 hours) to allow for cell attachment and recovery. After incubation, the medium was carefully aspirated, and cells were gently washed with PBS to remove any residual FBS. The medium was then replaced with 100 μL of serum-free DMEM to minimize the effects of FBS on drug activity. The 2-aminoimidazole derivatives (compounds 4a–x) were dissolved in dimethyl sulfoxide (DMSO) to prepare stock solutions. These stock solutions were serially diluted with serum-free DMEM to achieve final concentrations of 5, 10, 50, 100, and 200 μg mL−1. The final concentration of DMSO in any well did not exceed 0.1% (v/v) to avoid solvent-induced cytotoxicity. Imatinib was used as a positive control at equivalent concentrations, and cells treated with 0.1% DMSO in serum-free DMEM served as a negative control. Each concentration of the derivatives was tested in triplicate to ensure statistical reliability. Cells were treated with the compounds for 48 hours at 37 °C in a humidified atmosphere containing 5% CO2.
Following the treatment period, cell viability was assessed using the MTT assay. A fresh MTT solution was prepared at a concentration of 5 mg mL−1 in PBS and sterilized by filtration through a 0.22 μm filter to remove any insoluble particles. Twenty microliters of the MTT solution were added to each well, resulting in a final MTT concentration of 0.5 mg mL−1. The plates were incubated for an additional 4 hours at 37 °C in the dark to allow viable cells to reduce MTT to insoluble purple formazan crystals. After incubation, the supernatant was carefully aspirated without disturbing the formazan crystals. To solubilize the formed crystals, 150 μL of DMSO was added to each well. The plates were gently shaken on an orbital shaker for 10 minutes to ensure complete dissolution of the formazan crystals. The absorbance of each well was then measured at 570 nm using an ELISA plate reader, with a reference wavelength of 630 nm to correct for any background absorbance.
To evaluate the cytotoxic effects of the compounds on normal cells, human foreskin fibroblast (HFF) cells were cultured and treated under identical conditions as described above for the cancer cell lines. This allowed for a comparative analysis of the selectivity of the compounds towards cancer cells over normal cells. Cell viability was calculated as a percentage of the control using the formula:
| cell viability (%) = (absorbance of treated cells/absorbance of control cells) × 100. |
Dose–response curves were generated using GraphPad Prism software, and the half-maximal inhibitory concentration (IC50) was determined by nonlinear regression analysis using a sigmoidal dose–response (variable slope) model. All experiments were performed in triplicate, and data were presented as mean ± standard deviation (SD).41,42
3 Results and discussion
3.1 Characterization of MCFe2O4@Alginate@SAA catalyst
The structure of the magnetic ferrite nanocatalyst was characterized using various techniques such as Fourier transform infrared (FT-IR) spectroscopy, X-ray diffraction (XRD), scanning electron microscopy (SEM), transmission electron microscopy (TEM), vibrating sample magnetometry (VSM), energy-dispersive X-ray spectroscopy (EDS) and thermogravimetric analysis (TGA).The FT-IR spectrum of MCFe2O4 confirms the formation of MCFe2O4 nanoparticles, with absorption bands at 3441 cm−1 and 746 cm−1 corresponding to O–H and metal–oxygen stretching vibrations, respectively. When MCFe2O4 is decorated with alginate, new peaks appear at 3448 cm−1 and 1727 cm−1 regions, attributed to the stretching vibrations of O–H and C![[double bond, length as m-dash]](https://www.rsc.org/images/entities/char_e001.gif) O, respectively. Further, the FT-IR spectrum of MCFe2O4@Alginate@SAA shows peaks at 1754 cm−1 and 1650 cm−1, indicating stretching vibrations of CO, while a band at 1101 cm−1 suggests the presence of SO. These observations provide evidence of the complexation between the carboxylate moiety of alginate and the NH2 functional group on the structure of sulfur anthranilic acid (Fig. 2). The X-ray powder diffraction pattern was used to analyze the crystalline structure of the MC Fe2O4 and MCFe2O4@Alginate@SAA MNRs. The diffraction peaks in the XRD spectra confirmed the presence of inverse spinel structures in the nanoparticles. MCFe2O4 and MCFe2O4@Alginate@SAA showed characteristic peaks at specific positions, suggesting a robust crystalline spinel ferrite core structure (Fig. 3).
O, respectively. Further, the FT-IR spectrum of MCFe2O4@Alginate@SAA shows peaks at 1754 cm−1 and 1650 cm−1, indicating stretching vibrations of CO, while a band at 1101 cm−1 suggests the presence of SO. These observations provide evidence of the complexation between the carboxylate moiety of alginate and the NH2 functional group on the structure of sulfur anthranilic acid (Fig. 2). The X-ray powder diffraction pattern was used to analyze the crystalline structure of the MC Fe2O4 and MCFe2O4@Alginate@SAA MNRs. The diffraction peaks in the XRD spectra confirmed the presence of inverse spinel structures in the nanoparticles. MCFe2O4 and MCFe2O4@Alginate@SAA showed characteristic peaks at specific positions, suggesting a robust crystalline spinel ferrite core structure (Fig. 3).
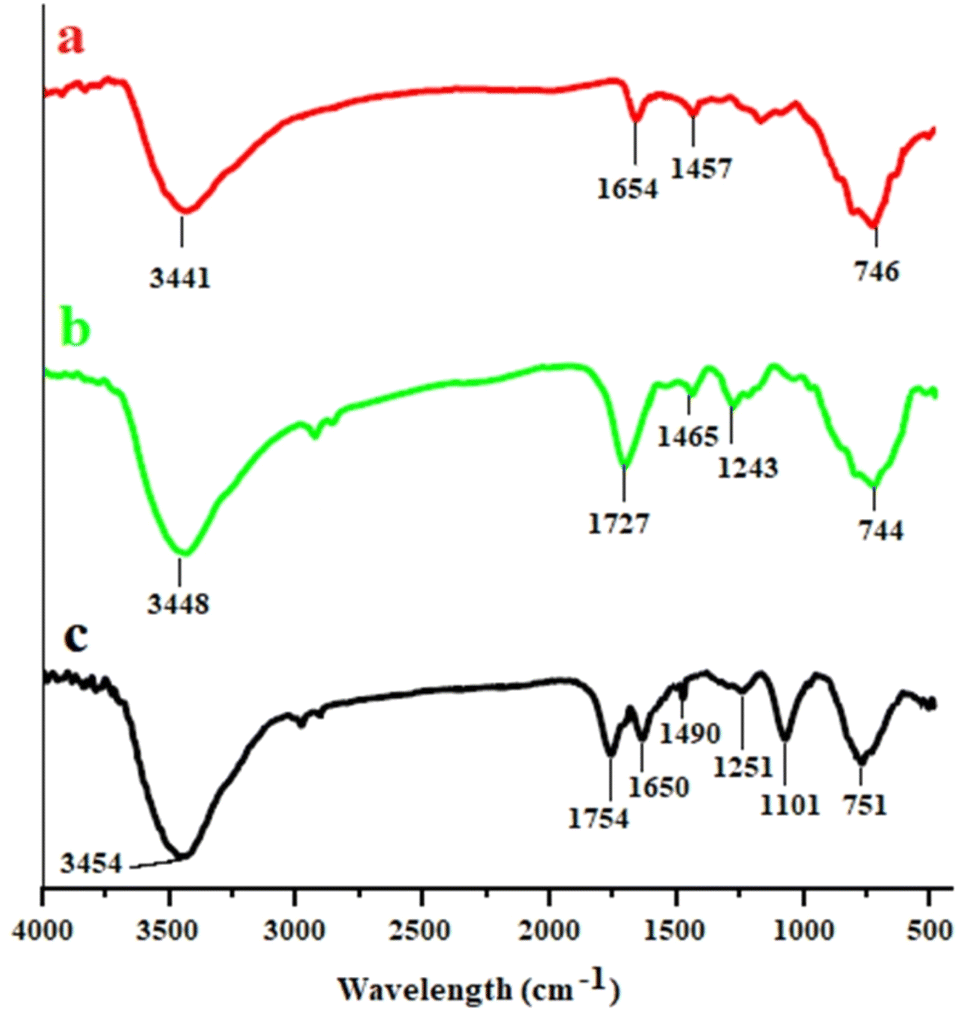 | ||
| Fig. 2 FT-IR spectra: (a) MCFe2O4, (b) MCFe2O4@Alginate and (c) MCFe2O4@Alginate@SAA, and XRD spectra of MCFe2O4 and MCFe2O4@Alginate@SAA. | ||
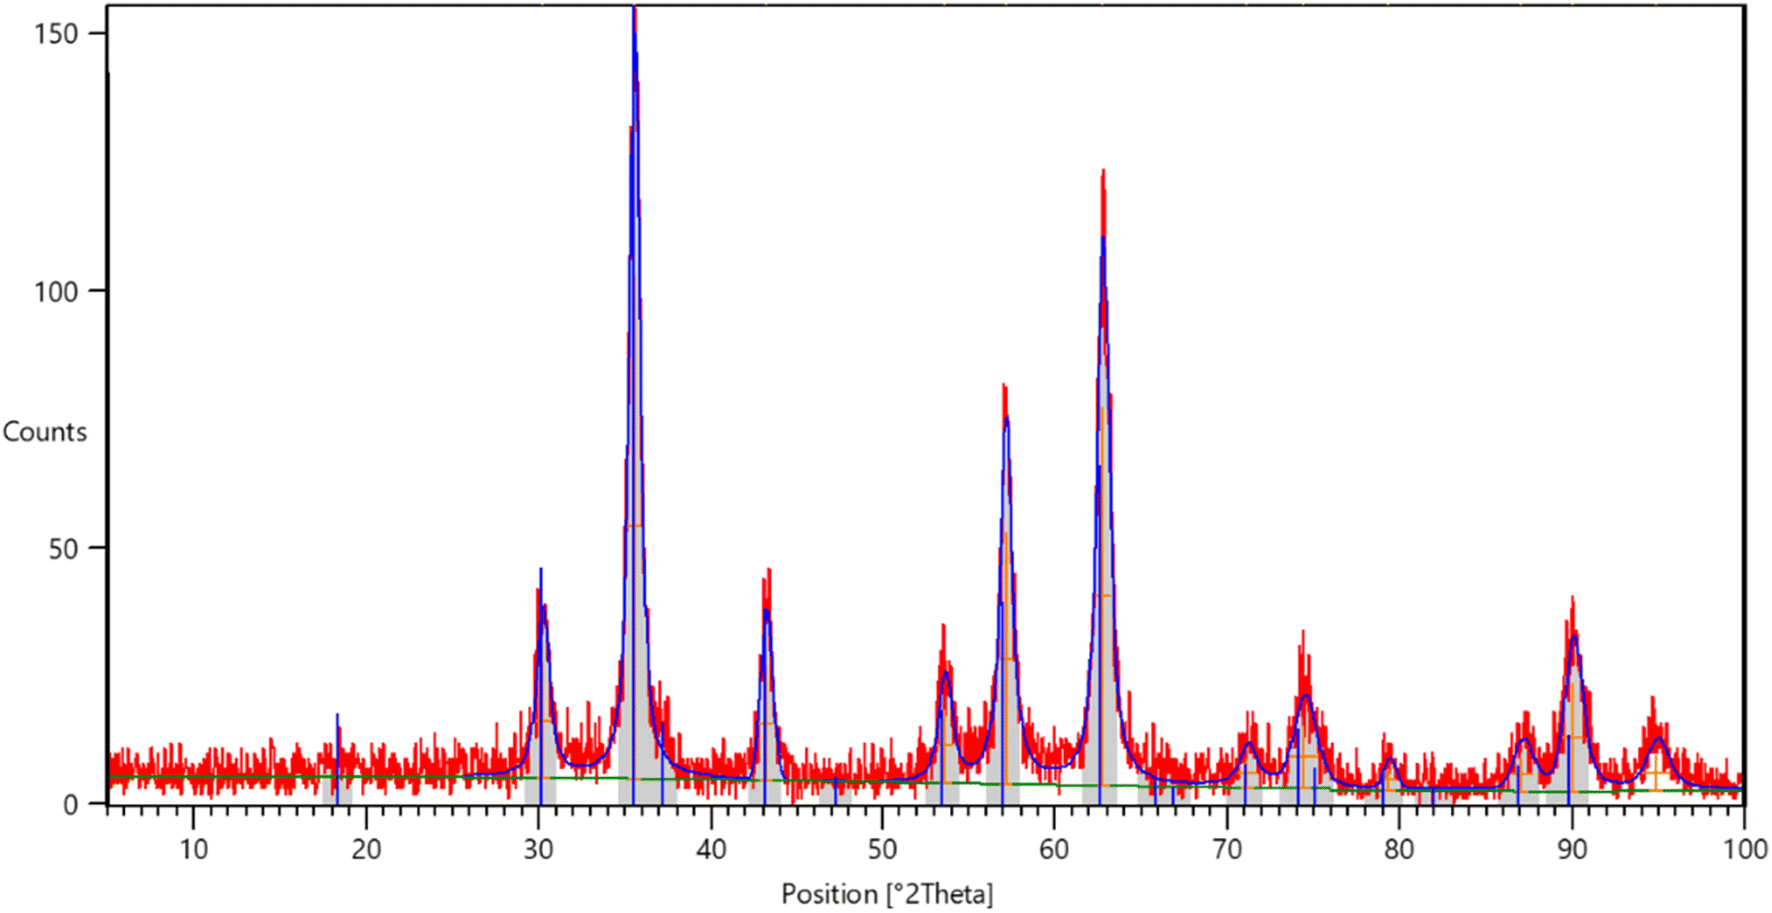 | ||
| Fig. 3 XRD spectra of MCFe2O4@Alginate@SAA. | ||
Magnetic properties of MCFe2O4 and MCFe2O4 decorated with alginate and SAA were studied using a vibration sample magnetometer (VSM) at room temperature (Fig. 4). Based on the magnetization curve, the saturation magnetization quantity of the MCFe2O4 MNRs and MCFe2O4@Alginate@SAA catalyst were measured at approximately 38 emu g−1 and 31 emu g−1, respectively. Notably, a decrease in saturation magnetization of MCFe2O4@Alginate@SAA catalyst is related to the organic compounds (alginate and sulpho anthranilic acid) on the surface of MCFe2O4 MNRs.
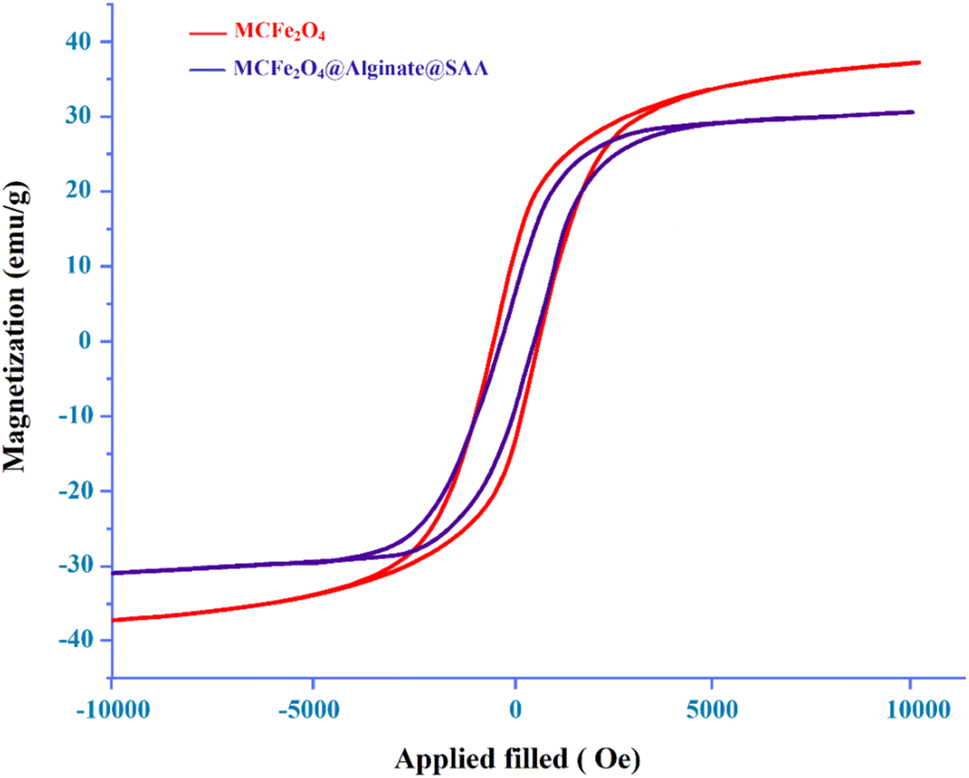 | ||
| Fig. 4 VSM diagrams of MCFe2O4 and MCFe2O4@Alginate@SAA. | ||
Thermal gravimetric analysis (TGA) was used to investigate the stability and content of coated organic groups on the surface of MCFe2O4@Alginate@SAA MNRs. The TGA curve showed two weight changes for the nanoparticles. The initial weight loss up to 200 °C was attributed to removing adsorbed solvents and water. The second weight loss at 200–700 °C was due to eliminating grafted organic groups (alginate and sulpho anthranilic acid) from the surface of MCFe2O4 MNRs. From the TGA curve, it was determined that the amount of organic moiety on the MCFe2O4@Alginate@SAA MNRs was about 17.5%. Based on this, it was calculated that a high quantity of Alginate@SAA (1.8 mmol g−1) was loaded onto the surface of the MCFe2O4 magnetic nanoparticles (Fig. 5).
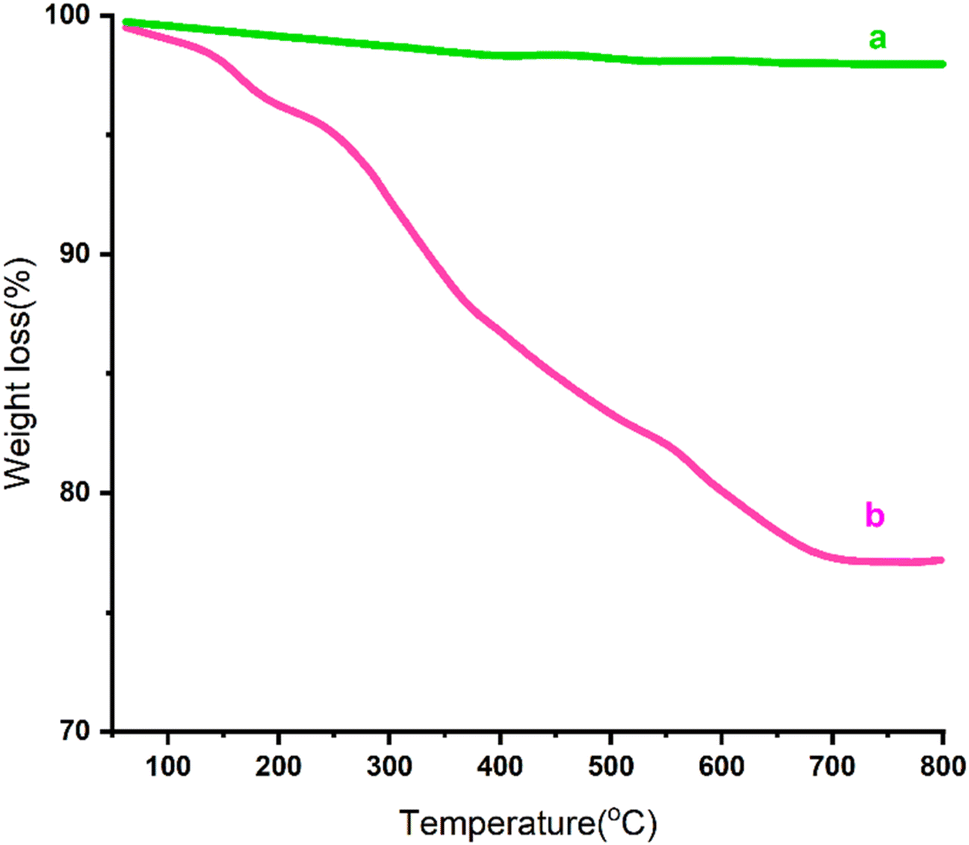 | ||
| Fig. 5 TGA spectra of (a) MCFe2O4 and (b) MCFe2O4@Alginate@SAA. | ||
Scanning electron microscopy was applied to evaluate the surface morphology and size of the MCFe2O4-decorated alginate-functionalized Sulpho Anthranilic Acid ferrite nanoparticles (Fig. 6). As can be seen from SEM images, the morphology of the nanoparticles is rod-like, with a diameter of approximately 30–60 nm and a length of 150–250 nm. It can be concluded that MCFe2O4@Alginate@SAA is nanorods.
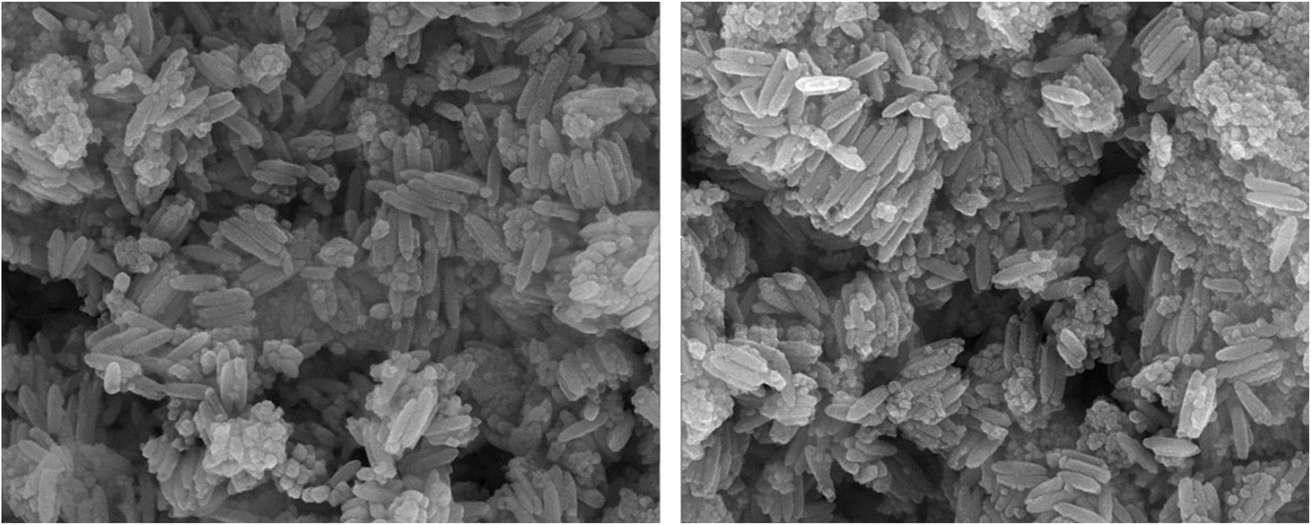 | ||
| Fig. 6 SEM image of MCFe2O4@Alginate@ SAA. | ||
The EDX analysis of the MCFe2O4@Alginate@SAA magnetic nanocomposite confirmed the presence of Fe, Mn, Co, O, C, N, and S signals and indicates that the MCFe2O4 structure has been successfully decorated with alginate and sulpho anthranilic acid groups. Also, the EDX elemental mapping analysis conforms to the attendance of Mn, Co, S, N, C, O, and Fe in MCFe2O4@Alginate@SAA MNPs. Also, the absence of other elements indicates that MCFe2O4@Alginate@SAA has a high purity level (Fig. 7).
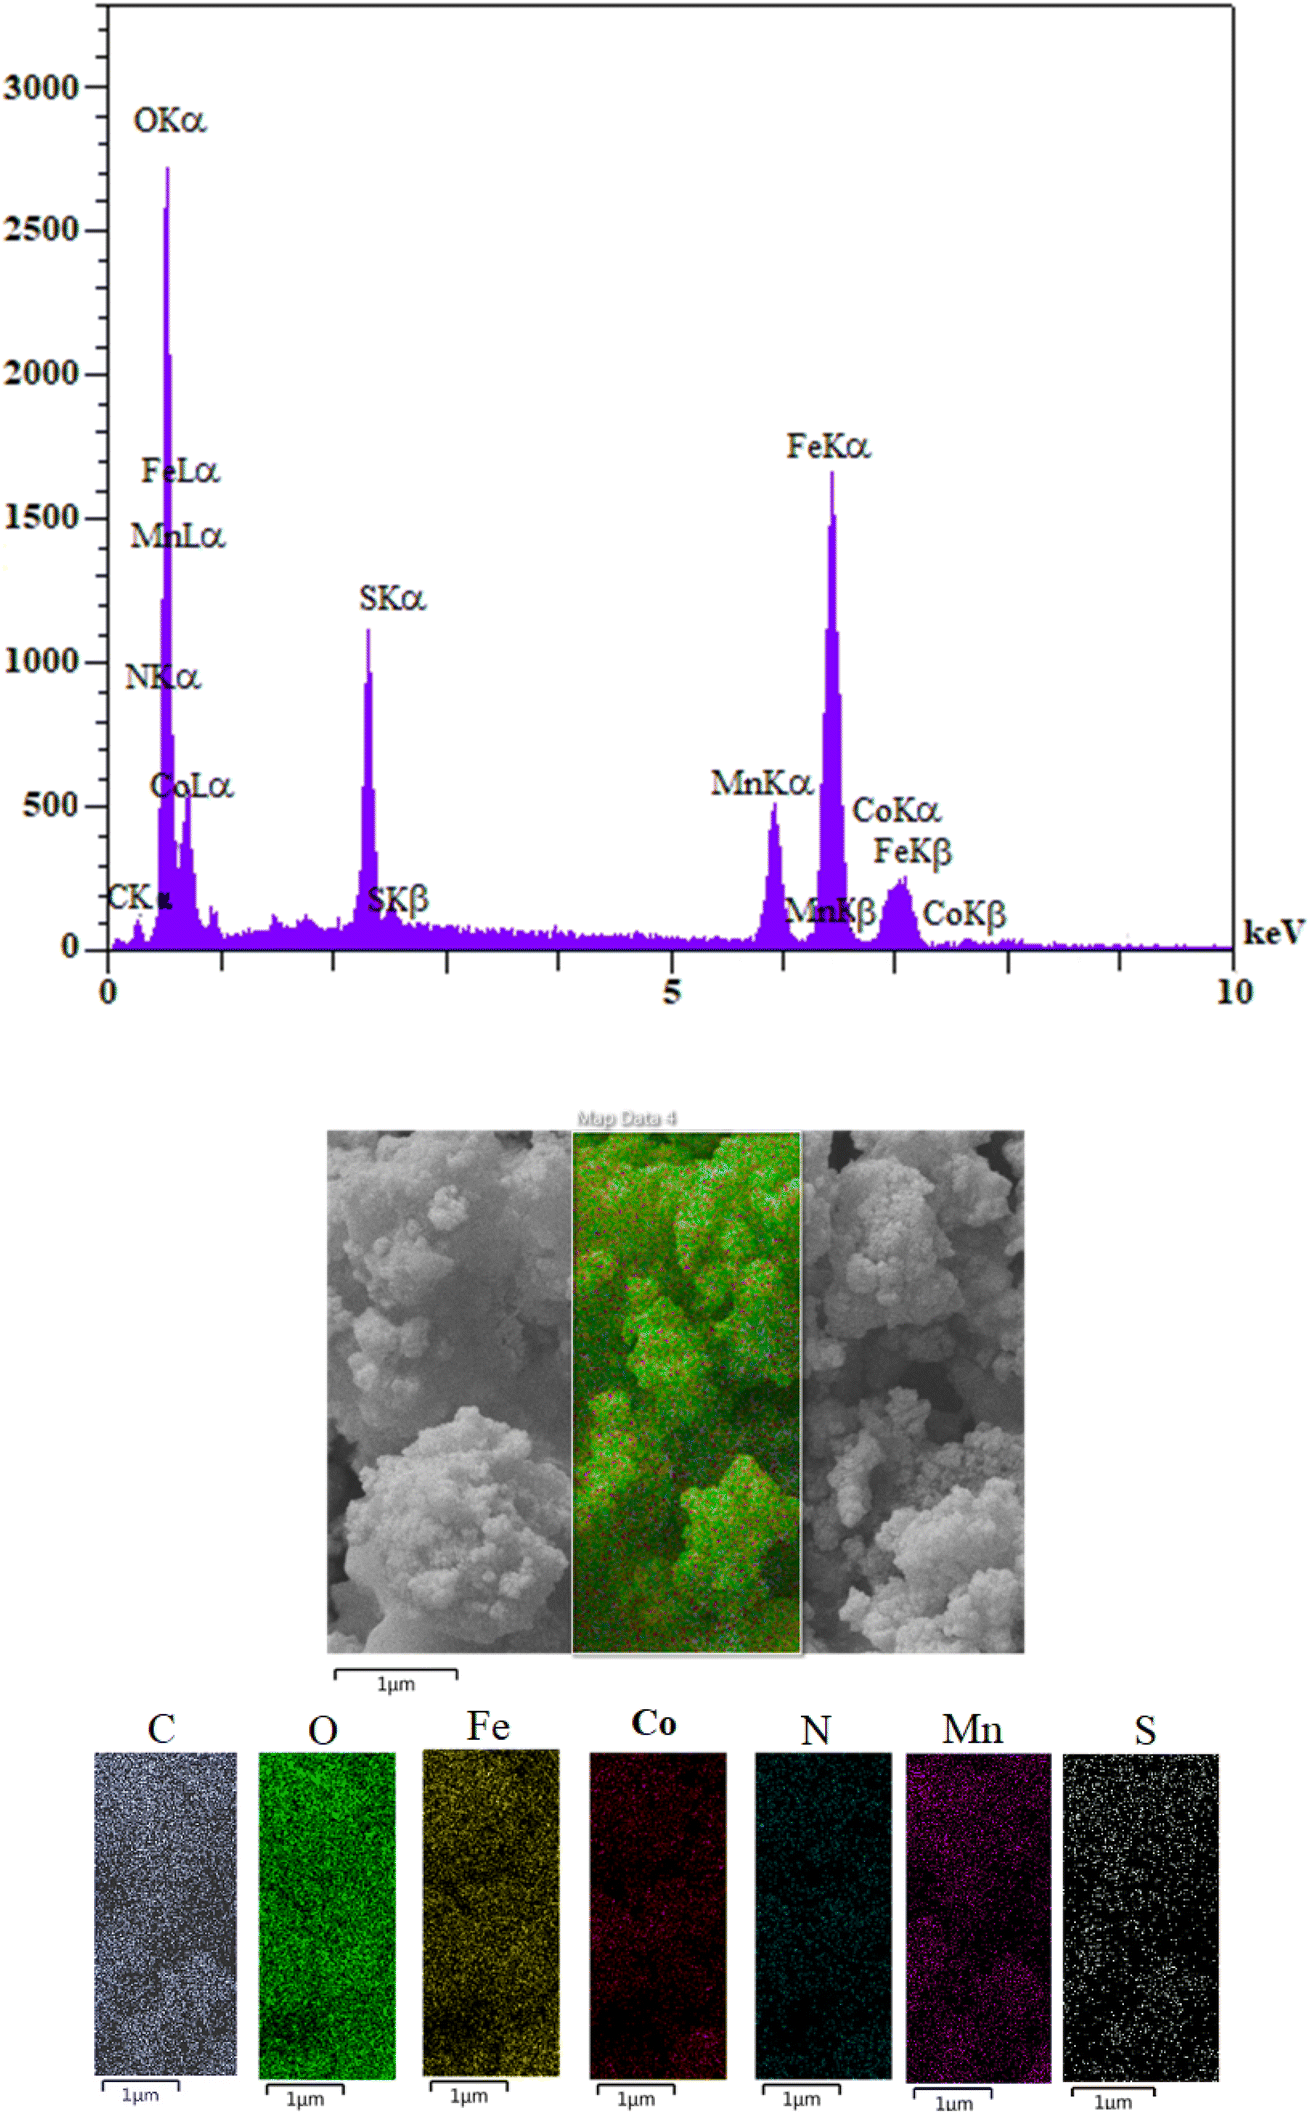 | ||
| Fig. 7 EDAX spectra of MCFe2O4@Alginate@SAA and the corresponding EDX elemental mapping pattern of the MCFe2O4@Alginate@SAA MNRs. | ||
TEM images of the catalyst show that MCFe2O4@Alginate@SAA composite was synthesized in nanorods with an average diameter of about 25 nm and length range of 100–250 nm. Significantly, the TEM result is smaller than the SEM result (Fig. 8).
 | ||
| Fig. 8 TEM image of MCFe2O4@Alginate@SAA. | ||
After characterization of the MCFe2O4@Alginate@SAA catalyst, we have evaluated the catalytic acting of the MCFe2O4@Alginate@SAA in multicomponent reaction for the preparation of functionalized 2-aminoimidazole–quinoxaline hybrids derivatives (Scheme 2).
 | ||
| Scheme 2 Synthesis of functionalized 2-aminoimidazole–quinoxaline hybrids derivatives (4a–x). | ||
To explore the optimal reaction conditions for the synthesis of functionalized 2-aminoimidazole–quinoxaline hybrids derivatives, we carried out the three-component coupling quinoxaline-3-bromo-2-carbaldehyde (1 mmol), aminoguanidine bicarbonate (1 mmol), bromo acetophenone (1 mmol) and catalyst (0.1 g) in attendance of ethanol at reflux condition for a specified time as needed to complete the reaction (25 min). Under the optimized condition, the reaction was accomplished by applying different solvents and catalysts, different amounts of catalysts, and a diverse range of temperatures to produce a satisfactory product yield. In order to study the effect of different catalysts on the reaction, a diverse series of catalysts were applied. As can be seen from the results (Table 1), MCFe2O4-Alginate-SAA showed excellent catalytic activity. Evaluation of the reaction under the kind of solvents indicated that water is the most favored solvent because of its considerable efficiency and environmental compatibility. We also optimized the quantity of the catalyst. In nonattendance of MCFe2O4-Alginate-SAA, no product was detected, and starting materials were retrieved without alteration, but using a heterogeneous solid acid catalyst, the satisfactory yield of the favored product was achieved. According to Table 1 (entry 14), it is noticeable that increasing the quantity of catalyst did not have affirmative efficacy on the product yield. It was found that the 30 mg value of MCFe2O4-Alginate-SAA had the best result in the yield.
| Entry | Catalyst (g) | Solvent | Condition | Time (min) | Yielda (%) |
|---|---|---|---|---|---|
| a Isolated yields. | |||||
| 1 | SAA (0.1) | EtOH | Reflux | 400 | 74 |
| 2 | MCFe2O4 (0.1) | EtOH | Reflux | 120 | 37 |
| 3 | MCFe2O4-Alginate (0.1) | EtOH | Reflux | 120 | 69 |
| 4 | MCFe2O4-Alginate-SAA (0.1) | EtOH | Reflux | 25 | 86 |
| 5 | — | EtOH | Reflux | 400 | 0 |
| 6 | MCFe2O4-Alginate-SAA (0.1) | CH3CN | Reflux | 25 | 73 |
| 7 | MCFe2O4-Alginate-SAA (0.1) | MeOH | Reflux | 25 | 84 |
| 8 | MCFe2O4-Alginate-SAA (0.1) | Water | Reflux | 25 | 92 |
| 9 | MCFe2O4-Alginate-SAA (0.1) | EtOH–H2O (1![[thin space (1/6-em)]](https://www.rsc.org/images/entities/char_2009.gif) :1) :1) |
Reflux | 25 | 89 |
| 10 | MCFe2O4-Alginate-SAA (0.075) | Water | Reflux | 25 | 92 |
| 11 | MCFe2O4-Alginate-SAA (0.05) | Water | Reflux | 25 | 92 |
| 12 | MCFe2O4-Alginate-SAA (0.03) | Water | Reflux | 25 | 92 |
| 13 | MCFe2O4-Alginate-SAA (0.02) | Water | Reflux | 35 | 81 |
| 14 | MCFe2O4-Alginate-SAA (0.125) | Water | Reflux | 25 | 92 |
| 15 | MCFe2O4-Alginate-SAA (0.03) | Water | 120 °C | 25 | 97 |
| 16 | MCFe2O4-Alginate-SAA (0.03) | Water | 70 °C | 25 | 97 |
| 17 | MCFe2O4-Alginate-SAA (0.03) | Water | 60 °C | 40 | 84 |
Moreover, the effect of diverse temperatures was tested on the improvement of the reaction in evidence of a 30 mg quantity of MCFe2O4-Alginate-SAA and H2O as a solvent (Table 1). The best temperature to progress the reaction was selected to be 70 °C. As a final result from Table 1, the best yield and reaction time were obtained when the reaction was carried out in the presence of 0.03 g of MCFe2O4@Alginate@SAA in H2O at 70 °C (97.0%).
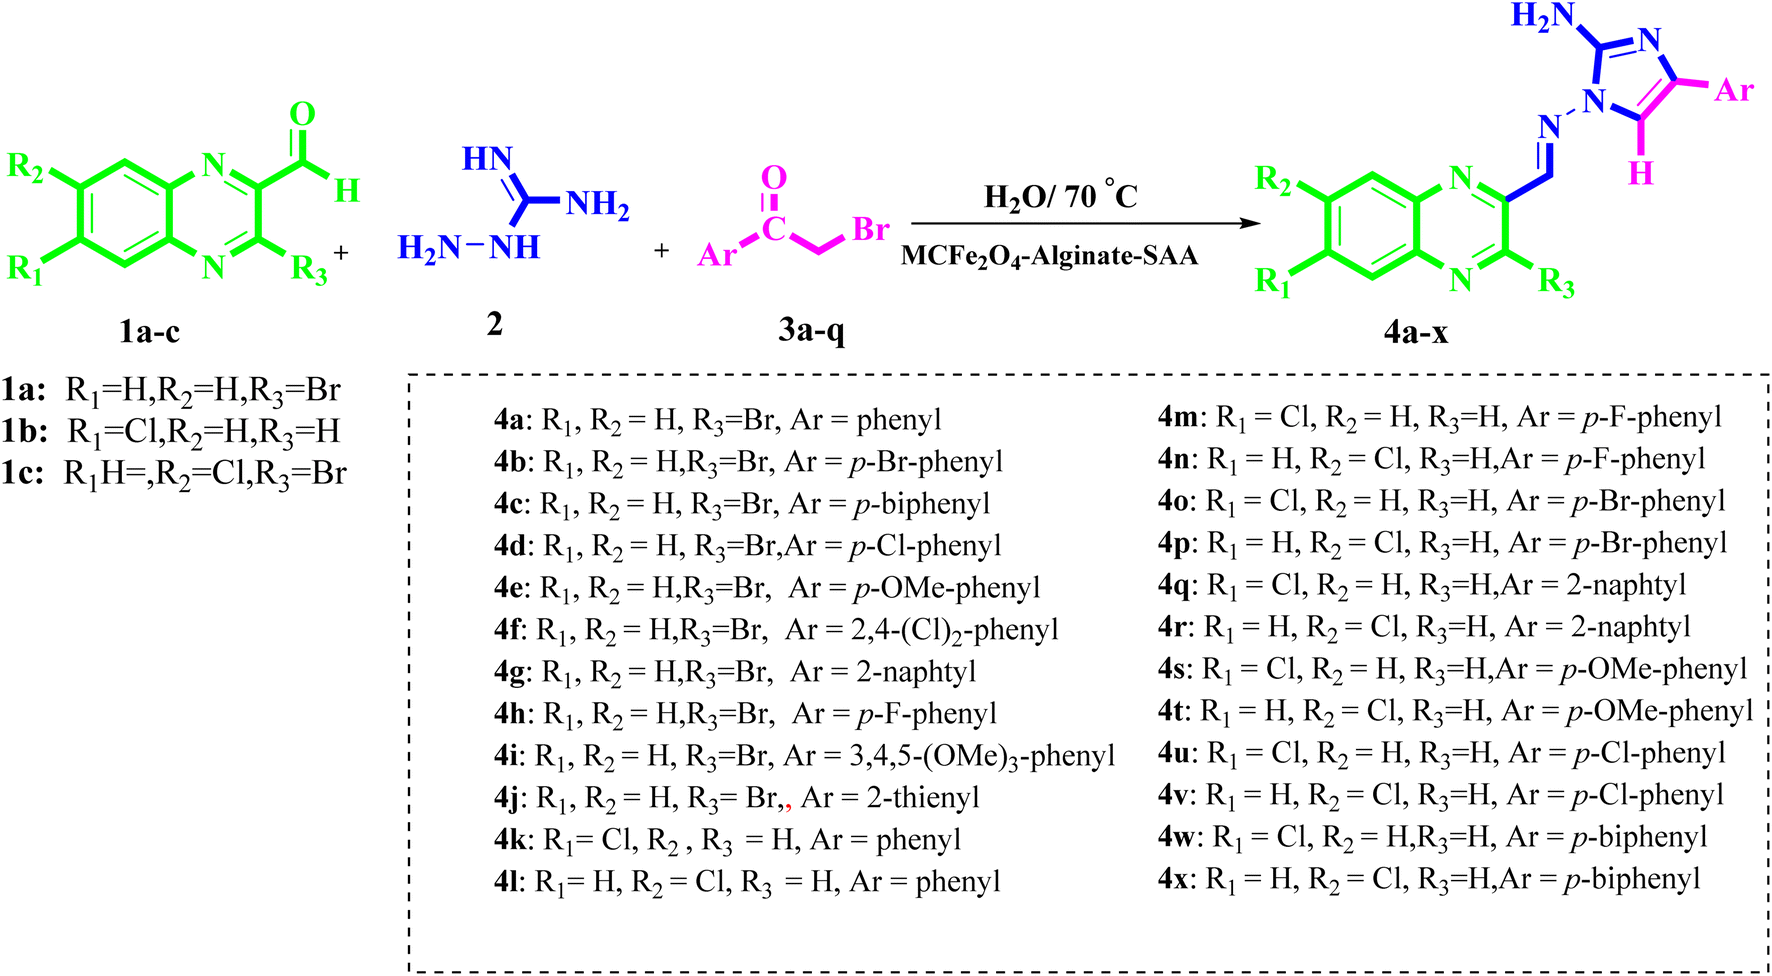
Based on optimized reaction conditions, a variety of substituted quinoxaline-2-carbaldehyde was applied to react with aminoguanidine bicarbonate, and an extensive range of substituted α-bromoketones derivatives in the presence of MCFe2O4-Alginate-SAA as a recoverable nanocatalyst at 70 °C to the synthesis of 2-aminoimidazole–quinoxaline hybrids derivatives (Table 2). The recoverability and reusability of the catalysts are essential advantages in green chemistry and industrial in large-scale operations and commercial applications. In this regard, we also investigated the recyclability of the MCFe2O4@Alginate@SAA in H2O at 70 °C using a selected model reaction of quinoxaline-3-bromo-2-carbaldehyde, aminoguanidine bicarbonate, bromo acetophenone in the presence of MCFe2O4@Alginate@SAA (Table 2, entry 1). After completion of the reaction, the catalyst was easily separated from the reaction mixture using an external magnetic field, washed with hot ethanol, dried at 50 °C for 1 h, and reused in a subsequent similar reaction. The recovered catalyst was reused for seven consecutive cycles without significant loss in its catalytic activity (Fig. 9).
| Entry | R1 | R2 | R3 | Ar | Compound | Time (min) | M.P. (°C) | Yield % |
|---|---|---|---|---|---|---|---|---|
| 1 | H | H | Br | Phenyl | 4a | 25 | 212–215 | 97 |
| 2 | H | H | Br | p-Br-phenyl | 4b | 25 | 262–267 | 93 |
| 3 | H | H | Br | p-biphenyl | 4c | 25 | 201–203 | 91 |
| 4 | H | H | Br | p-Cl-phenyl | 4d | 26 | 261–263 | 94 |
| 5 | H | H | Br | p-OMe-phenyl | 4e | 26 | 226–227 | 93 |
| 6 | H | H | Br | 2,4-(Cl)2-phenyl | 4f | 24 | 283–285 | 93 |
| 7 | H | H | Br | 2-Naphtyl | 4g | 25 | 239–241 | 91 |
| 8 | H | H | Br | p-F-phenyl | 4h | 24 | 267–269 | 93 |
| 9 | H | H | Br | 3,4,5-(OMe)3-phenyl | 4i | 25 | 253–255 | 92 |
| 10 | H | H | Br | 2-Thienyl | 4j | 26 | 240–242 | 93 |
| 11 | Cl | H | H | Phenyl | 4k | 25 | 261–263 | 91 |
| 12 | H | Cl | H | Phenyl | 4l | 25 | 258–260 | 94 |
| 13 | Cl | H | H | p-F-phenyl | 4m | 24 | 265–268 | 91 |
| 14 | H | Cl | H | p-F-phenyl | 4n | 24 | 262–265 | 93 |
| 15 | Cl | H | H | p-Br-phenyl | 4o | 25 | 238–240 | 91 |
| 16 | H | Cl | H | p-Br-phenyl | 4p | 27 | 241–243 | 92 |
| 17 | Cl | H | H | 2-Naphtyl | 4q | 25 | 272–275 | 97 |
| 18 | H | Cl | H | 2-Naphtyl | 4r | 25 | 276–278 | 94 |
| 19 | Cl | H | H | p-OMe-phenyl | 4s | 26 | 241–243 | 91 |
| 20 | H | Cl | H | p-OMe-phenyl | 4t | 27 | 238–240 | 94 |
| 21 | Cl | H | H | p-Cl-phenyl | 4u | 30 | 216–218 | 91 |
| 22 | H | Cl | H | p-Cl-phenyl | 4v | 30 | 222–224 | 93 |
| 23 | Cl | H | H | p-Biphenyl | 4w | 25 | 199–201 | 97 |
| 24 | H | Cl | H | p-Biphenyl | 4x | 25 | 202–204 | 94 |
 | ||
| Fig. 9 Reusability of MCFe2O4@Alginate@SAA nanocatalyst. | ||
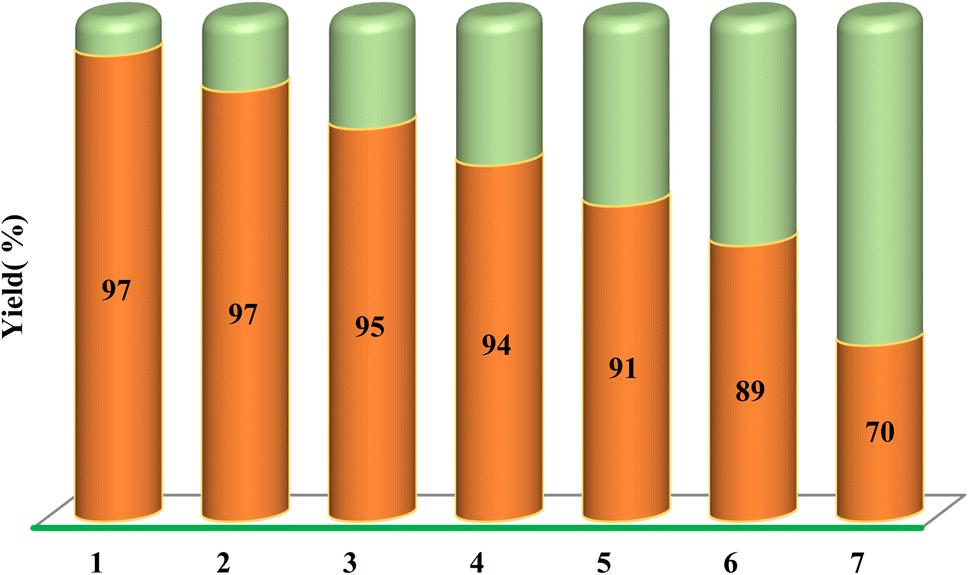
The stability and reusability of the MCFe2O4@Alginate@SAA magnetic nanocatalyst were extensively evaluated through multiple catalytic cycles for the synthesis of the benzopyrazine–aminoimidazole hybrid compounds. After each catalytic reaction, the nanocatalyst was magnetically separated, washed, and reused in the subsequent cycle. The catalytic activity of the recovered catalyst remained consistently high even after seven consecutive cycles, demonstrating its excellent stability and recyclability. XRD analysis confirmed that the inverse spinel crystal structure of the MCFe2O4 nanoparticles was maintained even after the multiple reaction cycles, with no additional peaks observed in the diffraction patterns (Fig. 10A). This suggests the catalyst retained its phase purity and crystallinity.
 | ||
| Fig. 10 (A) XRD, (B) FT-IR, (C) VSM, (D) EDX and, (E) SEM analysis of the recovered MCFe2O4@Alginate@SAA. | ||
FT-IR spectroscopy analysis showed no significant changes in the characteristic absorption bands, indicating the preservation of the alginate matrix, metal–oxygen bonds, and immobilized sulfo-anthranilic acid (SAA) moiety (Fig. 10B). VSM studies revealed that the magnetic properties of the nanocatalyst, including the saturation magnetization, remained largely unchanged over the course of the repeated uses. This superparamagnetic behavior enabled the efficient separation and recovery of the catalyst using an external magnetic field (Fig. 10C).
EDX spectroscopy of the recovered catalyst confirmed the presence of all the expected elements, including Mn, Co, Fe, O, C, and S, in comparable ratios to the original catalyst. This observation indicates the stability of the chemical composition of the nanocatalyst after the multiple reaction cycles (Fig. 10D). SEM analyses of the recovered catalyst demonstrated the preservation of the distinctive rod-like morphology of the MCFe2O4@Alginate@SAA system (Fig. 10E). This observation further substantiates the structural stability of the nanocatalyst under the reaction conditions. The comprehensive characterization of the recovered catalyst confirms the exceptional structural, compositional, and magnetic stability of the MCFe2O4@Alginate@SAA system, highlighting its potential for efficient and sustainable reuse in multiple catalytic cycles.
The structures of the desired compounds were analyzed through various spectroscopic techniques, including FTIR spectroscopy, 1H NMR, 13C NMR, two-dimensional nuclear magnetic resonance spectroscopy (2D NMR) using heteronuclear single quantum coherence (HSQC), correlation spectroscopy (COSY), heteronuclear multiple bond correlation (HMBC), and rotating-frame Overhauser effect spectroscopy (ROESY) as well as mass spectrometry. The 2D NMR spectra were particularly informative for several synthesized final compounds, namely 4d, 4m, and 4n. In particular, the ROESY spectrum obtained for compound 4d in 2D NMR explicitly confirmed the final derivatives' E-geometry. More specifically, correlations between the hydrogen on HCN (imine) with H-5 imidazole, NH2, and H-3′ in the quinoxaline ring were observed in this spectrum, confirming the compound's E-geometry. Notably, only within the E-geometry of this compound could interpretations be made regarding the correlations between the hydrogen of the imine, imidazole H-5, and NH2—a selective long-range HMBC correlation of compound 4x.
We successfully employed plate chromatography to obtain high-purity samples of 24 compounds (4a–x) and confirmed their geometries using a range of spectroscopic techniques, including 1H-NMR, 13C-NMR, HSQC, COSY, ROESY, and HMBC. The COSY spectra of compounds 4m and 4nrevealed two signals at δ 7.74 and 8.15 ppm in both cases, indicating the presence of protons 2′′ and 6′′ at δ 7.74 ppm that correlated with H3′′ and H5′′ at δ 7.20 ppm for the first signal, and H8′ at 8.15 ppm that correlated with H7′ at 7.95 ppm for the second signal (Fig. 8s†). These findings confirmed the presence of a chlorine atom at the H6′-position in the quinoxaline ring of compound 4m and at the H7′-position in compound 4n. Additionally, we presented selective long-range HMBC correlations for compound 4a in Fig. S1 and S2.†
| Compounds | HCT-116a | SKOV3 | HFF | |||
|---|---|---|---|---|---|---|
| 50 μg mL−1 | 10 μg mL−1 | 50 μg mL−1 | 10 μg mL−1 | 50 μg mL−1 | 10 μg mL−1 | |
| a Percent inhibition of cell proliferation at different concentrations.b Not tested. | ||||||
| 4a | 69.0 ± 7.4 | 45.6 ± 3.4 | 62.8 ± 4.1 | 40.3 ± 6.5 | 34.7 ± 1.6 | 5.2 ± 2.3 |
| 4e | 24.0 ± 3.6 | 8.2 ± 2.0 | 33.0 ± 3.0 | 8.2 ± 1.2 | 7.13 ± 1.5 | — |
| 4j | 46.8 ± 4.5 | 32.0 ± 6.1 | — | — | ntb | nt |
| 4k | 30.0 ± 1.2 | 13.3 ± 1.2 | 28.1 ±2.1 | 7.0 ± 0.2 | 31.3 ± 3.6 | — |
| 4l | 31.6 ± 2.8 | 13.7 ± 1.9 | 27.2 ± 4.2 | 8.2 ± 0.8 | 28.4 ± 7.6 | — |
| 4m | 29.0 ± 8.2 | 16.3 ± 5.1 | — | — | 40.66 ± 11.2 | — |
| 4n | 30.7 ± 3.0 | 14.2 ± 9.5 | — | — | 38.0 ± 5.3 | — |
| 4s | 70.6 ± 7.5 | 35.4 ± 6.1 | 59.0 ± 4.1 | 20.0 ± 6.7 | 51.0 ± 14.2 | — |
| 4t | 69.2 ± 6.0 | 36.5 ± 2.7 | 61.3 ± 1.3 | 21.1 ± 5.2 | 49.5 ± 6.8 | — |
| 4w | 32.0 ± 1.8 | 21.8 ± 5.2 | 43.3 ± 3.8 | 7.5 ± 0.9 | — | — |
| 4x | 31.3 ± 71 | 21.0 ± 2.3 | 44.1 ± 6.2 | 8.1 ± 3.7 | — | — |
| Imatinib | 83.0 ± 6.1 | 50.0 ± 14.1 | 85.2 ± 7.4 | 42.5 ± 7.1 | 87.7 ± 7.4 | 25.2 ± 0.9 |
| Compounds | HCT-116 | SKOV3 | HFF | |||
|---|---|---|---|---|---|---|
| 50 μg mL−1 | 10 μg mL−1 | 50 μg mL−1 | 10 μg mL−1 | 50 μg mL−1 | 10 μg mL−1 | |
| 4a | 64.3 ± 1.3 | 51.0 ± 3.2 | 82.3 ± 7.8 | 47.3 ± 5.4 | 36.6 ± 6.5 | 32.5 ± 2.9 |
| 4k | 34.0 ± 2.1 | 4.1 ± 0.8 | 32.3 ± 1.6 | — | 18.5 ± 7.3 | 9.2 ± 3.6 |
| 4l | 35.7 ± 2.8 | 6.1 ± 4.1 | 31.5 ± 5.2 | — | 15.5 ± 5.1 | 8.5 ± 2.5 |
| 4s | 77.2 ± 4.2 | 3.2 ± 5.2 | 57.3 ± 8.9 | 16.6 ± 4.8 | 15.3 ± 4.2 | 8.0 ± 1.7 |
| 4t | 76.5 ± 12.4 | 3.7 ± 1.9 | 55.6 ± 3.4 | 17.5 ± 2.5 | 14.9 ± 1.9 | 9.1 ± 2.4 |
| 4w | 51.0 ± 3.5 | 37.7 ± 8.2 | 33.3 ± 3.9 | 16.6 ± 1.5 | 23.0 ± 3.2 | 14.0 ± 4.2 |
| 4x | 52.0 ± 7.2 | 39.4 ± 1.2 | 32.1 ± 6.4 | 18.0 ± 4.8 | 21.9 ± 1.5 | 17.1 ± 5.3 |
| Imatinib | 96.5 ± 6.2 | 73.5 ± 9.2 | 93.5 ± 14.5 | 66.5 ± 8.2 | 81.2 ± 9.2 | 63.4 ± 7.3 |
The provided data offers valuable insights into the effectiveness and potency of the tested compounds. The values presented represent the mean value plus or minus the standard deviation derived from at least three independent experiments with consistent results. A control group of DMSO (n = 2 ± SEM) was incorporated for each cell line under examination. GraphPad Prism 8 generated a standard graph, plotting the drug concentration on the X-axis and relative cell viability on the Y-axis (Fig. 11). Cell viability (%) was calculated based on the Mean OD/Control OD ratio multiplied by 100%.
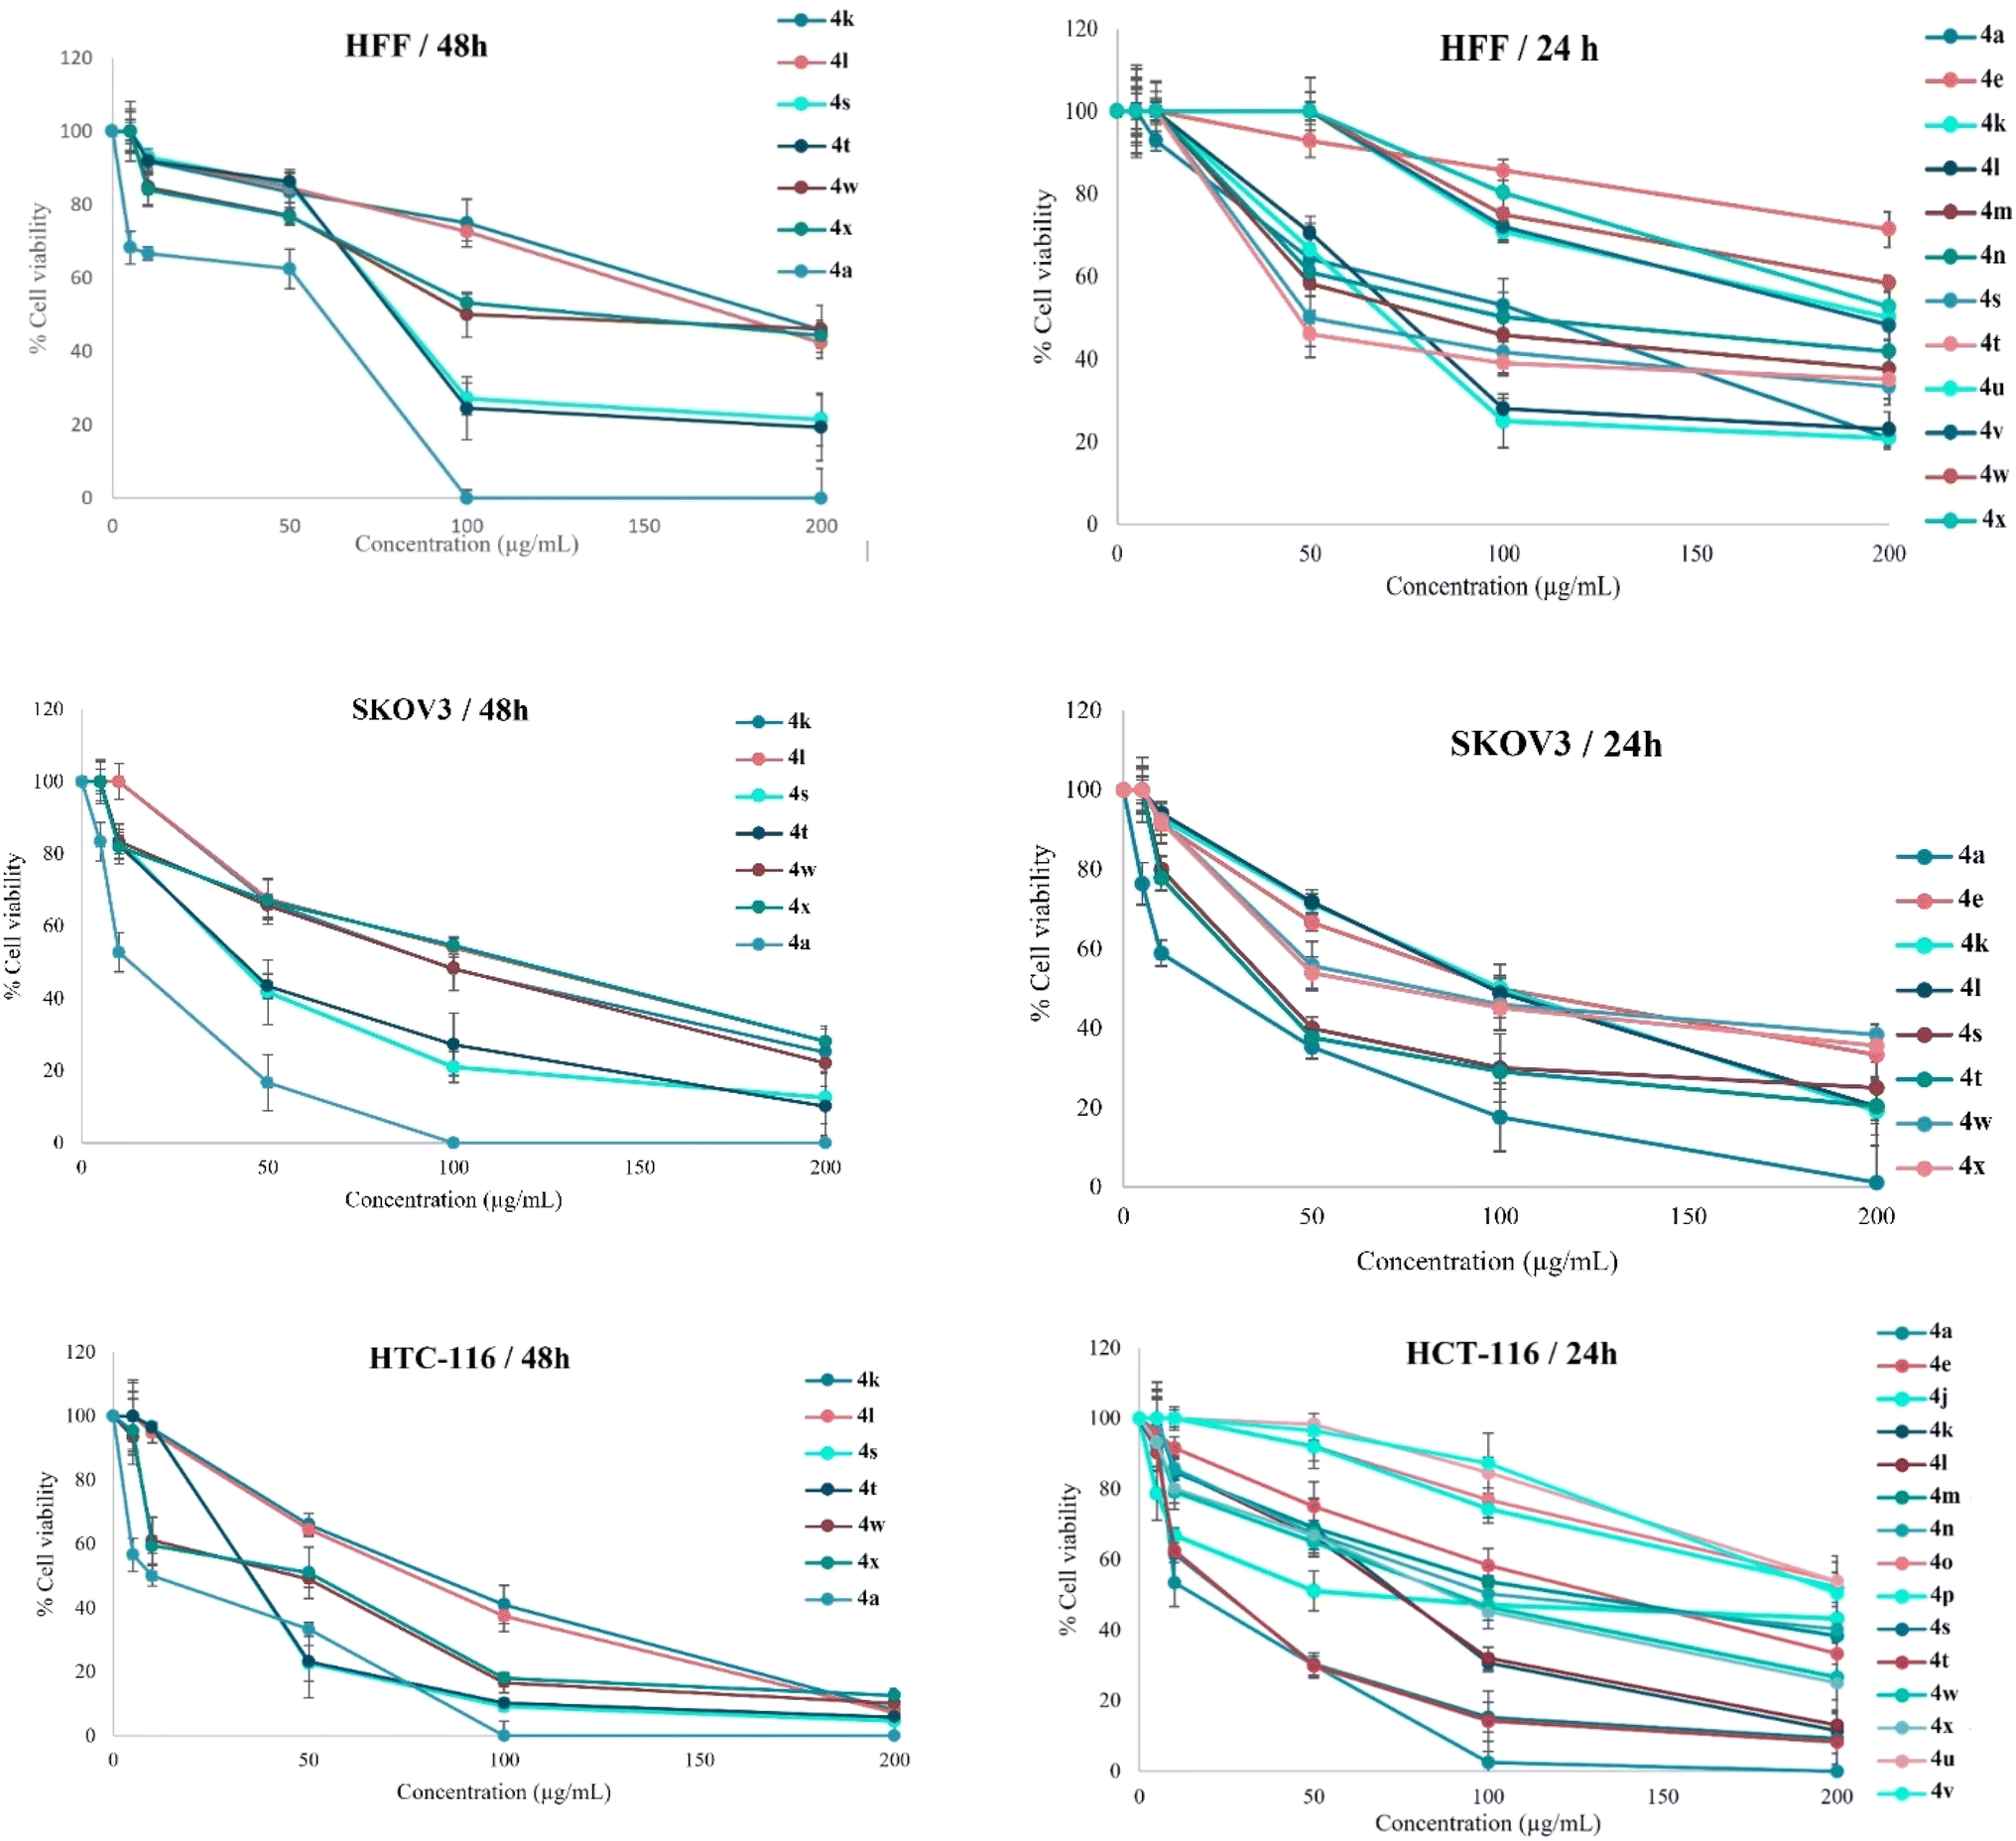 | ||
| Fig. 11 Anti-proliferative activity of the compounds in SKOV3, HCT-116, and HFF cell lines, at the concentrations of 5, 10, 50, 100, and 200 μg mL−1 after 24 h and 48 h. | ||
 | ||
| Fig. 12 A visual depiction illustrating the relationship between the chemical structure and biological activity of quinoxaline derivatives. | ||
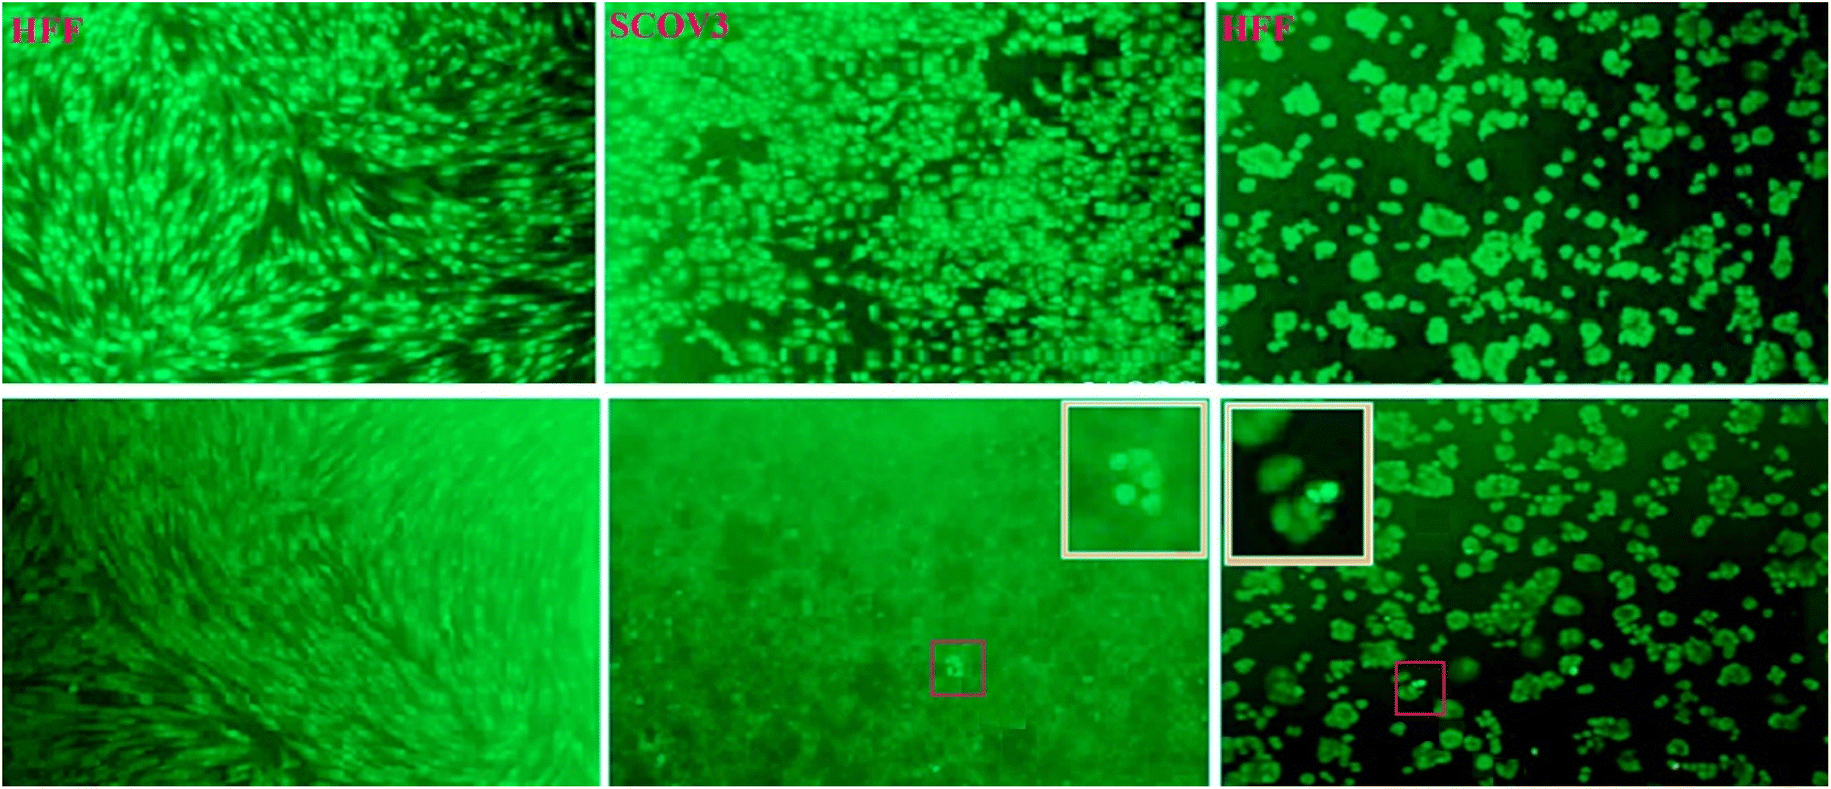 | ||
| Fig. 13 Compound 4a was subjected to AO/EB staining under different conditions: DMSO 1% as a negative control, and treatment with 5 μg mL−1 after 24 hours. | ||
4 Conclusions
A novel magnetic core–shell nanorod catalyst, MCFe2O4@Alginate@SAA, was developed and successfully employed in a green, multi-component synthesis of 2-aminoimidazole–quinoxaline hybrids. This sustainable approach circumvents the limitations of conventional methods, offering a cost-effective, non-toxic, and easily recoverable catalyst with reusable catalytic activity. Evaluation of the synthesized compounds against HCT-116 and SKOV3 cancer cell lines revealed promising antiproliferative activity, particularly for compound 4a, which induced apoptosis in both cell lines. These findings highlight the potential of these quinoxaline derivatives, especially 4a, as lead compounds for anticancer drug development.Data availability
All data generated or analyzed during this study are included in this published article and data will be made available on request.Authors contribution
Ruoyu Zhang: supervision – Ruoyu Zhang played a pivotal role in overseeing the research project, providing strategic direction, guidance, and insight throughout the course of the study. His contributions included defining the key objectives, designing the study methodology, and maintaining the project timeline. Ying Lai: draft preparation – Ying Lai was instrumental in drafting the manuscript, articulating the findings from the research, and presenting the data in a clear, coherent manner. This role involved extensive literature review, data analysis, and interpretation of the results within the context of the research objectives.Conflicts of interest
The authors declare that they have no known competing financial interests or personal relationships that could have appeared to influence the work reported in this paper.References
- C. Fitzmaurice, C. Allen, R. M. Barber, L. Barregard, Z. A. Bhutta, H. Brenner, D. J. Dicker, O. Chimed-Orchir and R. Dandona, JAMA Oncol., 2017, 3, 524–548 CrossRef PubMed.
- A. G. Waks and E. P. Winer, JAMA, 2019, 321, 288–300 CrossRef CAS PubMed.
- J. Zugazagoitia, C. Guedes, S. Ponce, I. Ferrer, S. Molina-Pinelo and L. Paz-Ares, Clin. Ther., 2016, 38, 1551–1566 CrossRef PubMed.
- M. N. Noolvi, H. M. Patel, V. Bhardwaj and A. Chauhan, Eur. J. Med. Chem., 2011, 46, 2327–2346 CrossRef CAS PubMed.
- M. Iradyan, N. Iradyan, G. Stepanyan, F. Arsenyan and B. Garibdzhanyan, Pharm. Chem. J., 2010, 44, 175–182 CrossRef CAS.
- K. Shalini, P. K. Sharma and N. Kumar, Chem. Sin., 2010, 1, 36–47 CAS.
- S. T. Al-Rashood, I. A. Aboldahab, M. N. Nagi, L. A. Abouzeid, A. A. Abdel-Aziz, S. G. Abdel-Hamide, K. M. Youssef, A. M. Al-Obaid and H. I. El-Subbagh, Bioorg. Med. Chem., 2006, 14, 8608–8621 CrossRef CAS PubMed.
- F. A. Al-Omary, L. A. Abou-Zeid, M. N. Nagi, E.-S. E. Habib, A.-M. Alaa, A. S. El-Azab, S. G. Abdel-Hamide, M. A. Al-Omar, A. M. Al-Obaid and H. I. El-Subbagh, Bioorg. Med. Chem., 2010, 18, 2849–2863 CrossRef CAS PubMed.
- S. Kalra, G. Joshi, M. Kumar, S. Arora, H. Kaur, S. Singh, A. Munshi and R. Kumar, RSC Med. Chem., 2020, 11, 923–939 RSC.
- A. Ayati, S. Moghimi, S. Salarinejad, M. Safavi, B. Pouramiri and A. Foroumadi, Bioorg. Chem., 2020, 99, 103811 CrossRef CAS PubMed.
- S.-C. Wang and M.-C. Hung, Clin. Cancer Res., 2009, 15, 6484–6489 CrossRef CAS PubMed.
- E. S. Kim, J. Natl. Compr. Cancer Network, 2003, 1, S87–S95 CAS.
- A. E. Maennling, M. K. Tur, M. Niebert, T. Klockenbring, F. Zeppernick, S. Gattenlöhner, I. Meinhold-Heerlein and A. F. Hussain, Cancers, 2019, 11, 1826 CrossRef CAS PubMed.
- F. Dehnavi, M. Akhavan and A. Bekhradnia, RSC Adv., 2024, 14, 35400–35423 RSC.
- S. Yadav, D. Sinha, S. K. Singh and V. K. Singh, Chem. Biol. Drug Des., 2012, 80, 625–630 CrossRef CAS PubMed.
- R. Pal, G. Teli, G. S. P. Matada and P. S. Dhiwar, J. Mol. Struct., 2023, 136021 CrossRef CAS.
- R. Pal, G. Teli, G. S. P. Matada and P. S. Dhiwar, ChemistrySelect, 2023, 8, e202301200 CrossRef CAS.
- G. Chawla, O. Gupta and T. Pradhan, ChemistrySelect, 2023, 8, e202301401 CrossRef CAS.
- P. B. Koswatta and C. J. Lovely, Nat. Prod. Rep., 2011, 28, 511–528 RSC.
- D. S. Ermolat'ev, J. B. Bariwal, H. P. Steenackers, S. C. De Keersmaecker and E. V. Van der Eycken, Angew. Chem., 2010, 122, 9655–9658 CrossRef.
- T. Kaushal, G. Srivastava, A. Sharma and A. S. Negi, Bioorg. Med. Chem., 2019, 27, 16–35 CrossRef CAS PubMed.
- R. R. E. Eldin, A. A. Al-Karmalawy, M. H. Alotaibi and M. A. Saleh, New J. Chem., 2022, 46, 9975–9984 RSC.
- F. Ciardiello, Drugs, 2000, 60, 25–32 CrossRef CAS PubMed.
- K. Sugita, K. Koizumi and H. Yoshida, Cancer Res., 1992, 52, 168–172 CAS.
- A. Das and A. K. Das, New J. Chem., 2023, 47, 5347–5355 RSC.
- A. K. Das, S. Nandy and S. Bhar, RSC Adv., 2022, 12, 4605–4614 RSC.
- F. Maryani and A. W. Septama, Biomater. Adv., 2022, 3, 8267–8275 CAS.
- A. Das, D. Chavda, M. Manna and A. K. Das, New J. Chem., 2024, 48, 18249–18260 RSC.
- A. K. Das, M. S. Ali, A. Misra, S. Islam, B. Kar, S. Biswas, G. Ghatak, D. Mal, M. Shit and M. Dolai, Appl. Organomet. Chem., 2024, e7796 Search PubMed.
- E. Boggio, C. L. Gigliotti, I. Stoppa, D. Pantham, S. Sacchetti, R. Rolla, M. Grattarola, C. Monge, S. Pizzimenti and U. Dianzani, Pharmaceutics, 2023, 15, 937 CrossRef CAS PubMed.
- M. Akhavan, N. Foroughifar, H. Pasdar and A. Bekhradnia, J. Mazandaran Univ. Med. Sci., 2020, 29, 82–90 Search PubMed.
- S. Cruz, S. E. Gomes, P. M. Borralho, C. M. Rodrigues, S. P. Gaudêncio and F. Pereira, Biomolecules, 2018, 8, 56 CrossRef PubMed.
- A. Hallas-Potts, J. C. Dawson and C. S. Herrington, Sci. Rep., 2019, 9, 5515 CrossRef PubMed.
- M. Akhavan and A. Bekhradnia, RSC Adv., 2021, 11, 14755–14768 RSC.
- M. Akhavan, N. Foroughifar, H. Pasdar and A. Bekhradnia, Comb. Chem. High Throughput Screening, 2019, 22, 716–727 CrossRef CAS PubMed.
- Z. Esam, M. Akhavan, A. Bekhradnia, M. Mohammadi and S. Tourani, Catal. Lett., 2020, 150, 3112–3131 CrossRef CAS.
- M. Akhavan, N. Foroughifar, H. Pasdar, A. Khajeh-Amiri and A. Bekhradnia, Transition Met. Chem., 2017, 42, 543–552 CrossRef CAS.
- A. Rana, S. Pathak, K. Kumar, A. Kumari, S. Chopra, M. Kumar, D. Kamil, R. Srivastava, S.-K. Kim and R. Verma, Biomater. Adv., 2024, 5, 2767–2784 CAS.
- A. K. Das, N. Sepay, S. Nandy, A. Ghatak and S. Bhar, Tetrahedron Lett., 2020, 61, 152231 CrossRef CAS.
- M. Akhavan, Z. Esam, A. Mirshafa, M. Lotfi, S. Pourmand, F. Ashori, M. Rabani, G. Ekbatani, S. Tourani and R. Beheshti, RSC Adv., 2024, 14, 22916–22938 RSC.
- D. Gerlier and N. Thomasset, J. Immunol. Methods, 1986, 94, 57–63 CrossRef CAS PubMed.
- P. W. Sylvester, Drug Design and Discovery: Methods and Protocols, 2011, pp. 157–168 Search PubMed.
Footnote |
| † Electronic supplementary information (ESI) available. See DOI: https://doi.org/10.1039/d4ra07892f |
| This journal is © The Royal Society of Chemistry 2025 |