DOI:
10.1039/D4RA07957D
(Paper)
RSC Adv., 2025,
15, 674-687
Highly porous activated carbon derived from the papaya plant (stems and leaves) for superior adsorption of alizarin red s and methylene blue dyes from wastewater†
Received
8th November 2024
, Accepted 4th January 2025
First published on 8th January 2025
Abstract
In this study, stems and leaves of the papaya plant were employed to prepare a high-quality porous adsorbent via carbonization and chemical activation using phosphoric acid. This adsorbent demonstrates superior adsorption capabilities for the efficient removal of hazardous alizarin red s (ARS) and methylene blue (MB) dyes. Thus, it contributes to waste reduction and promotes sustainable practices in environmental remediation, aligning with global efforts to develop sustainable materials that address water pollution while supporting circular economy principles. The structural properties of the activated carbon were characterized through various techniques, including BET surface area, FTIR, SEM, XPS, zeta potential measurements, and determination of the zero-point charge. The characterization results confirmed the preparation of highly porous activated carbon from papaya stems with a high surface area of 1053.52 m2 g−1. The batch experiments revealed that the maximum adsorption capacities for the stem-activated carbon (SAC) were 931 mg g−1 for ARS and 990 mg g−1 for MB. For the leave-activated carbon (LAC), the capacities were 410 mg g−1 for ARS and 642 mg g−1 for MB. SAC exhibited 100% removal of MB or ARS with concentrations lower than 150 ppm in 15 min. The data fitted well with the Langmuir model and pseudo-second-order model. Moreover, the reusability revealed that the SAC can be reused over 5 cycles without significant change in the removal efficiency. Overall, SAC and LAC derived from papaya plants exhibited excellent dye adsorption performance, suggesting potential for large-scale applications.
1. Introduction
Water contamination is a critical issue today, posing a significant threat to humans and ecosystems. The rising anthropogenic activity and population growth have worsened the situation.1 Moreover, all environmental resources are significantly contaminated, particularly synthetic dyes, which have gained much attention because of the severe harm they cause to humans and the ecology.2 Various industries such as leather, textile, printing, cosmetics, and pharmaceuticals manufacture synthetic dyes, which are significant causes of water pollution.3 These dyes have complicated molecular structures containing substituted chromophoric groups such as azo, triarylmethane, and anthraquinone, as well as others, making them difficult to biodegrade. Under anaerobic conditions, these pigments can degrade forming hazardous aromatic amines. When dye-containing effluents enter waterways, they can cause cancer, mutations, allergic dermatitis, skin irritation, and difficulties with the kidneys, reproductive system, liver, brain, and central nervous system.4
Alizarin red s (ARS), an anthraquinone dye, is regarded as among the most resilient dyes and has been applied in numerous industries. These dyes are typically not destroyed by existing chemical, physical, and biological processes.5,6 Alizarin red s (3,4-dihydroxy-9,10-dioxo-9,10-dihydroanthracene-2-sulfonic acid) is an anionic dye that has a reputation for being poisonous, having cancer-causing effects, and maybe causing other health issues like dermatitis. Its water-soluble dye with a pKa of (4.6–6.5) is mainly found in the effluents of food, textile, and dye industries.7 Methylene blue (MB), an azo dye, is frequently utilized in the textile industry to dye various materials such as paper, cotton, silk, and wool. However, it is not easily biodegradable and can cause harm to aquatic photosynthetic life by blocking light absorption when present in water bodies. Methylene blue ([7-(dimethylamino)phenothiazin-3-ylidene]-dimethylazanium chloride) is water soluble cationic dye that has been linked to several health problems for people, including conditions that impact the digestive, respiratory, ocular, nausea, vomiting, cyanosis and mental systems,2,8,9 see ESI (Table S1)† for further information on MB and ARS dyes. Studies have been carried out to reduce pollution and its impact on ecosystems by removing dyes from contaminated water sources. Several techniques have been employed for extracting dyes such as biodegradation, advanced oxidation process, coagulation, membrane separation, adsorption, ion exchange, precipitation, activated sludge, electrochemical conversion, photocatalytic degradation, and catalytic ozonation.10–13
Regarding wastewater treatment, adsorption technology is popular due to its versatility, affordability, high efficiency, effective regeneration, and eco-friendly characteristics. It is a great option for those seeking a low-cost, easy-to-use, and effective treatment. Various adsorbent materials are frequently utilized to remove organic pollutants and colorants. These materials include activated carbons, metal–organic frameworks (MOFs), biochar, and compounds produced from agricultural waste. Due to its exceptional qualities, activated carbon (AC) is highly effective in eliminating colors from sewage water due to its highly developed porous structure, wide range of oxygen-functional groups, superior thermal and mechanical resistance, substantial adsorption capacity, and extensive surface area.14,15 The papaya plant, also known as Carica papaya, is tropical and subtropical originally from Mexico and northern South America but has now spread to many parts of the world.16 Carica papaya represents a valuable resource in environmental remediation efforts, particularly in wastewater treatment. Its effectiveness as a natural coagulant addresses pollution challenges and supports sustainable practices by utilizing agricultural waste. The ongoing exploration of its applications may further solidify its role as an essential component in environmentally friendly technologies to improve water quality and mitigate environmental impacts.17 Papaya contains cellulose (58.7%), hemicellulose (11.8%), and lignin (14.3%),8,18,19 which makes it high in hydroxyl (OH) functional and carbonyl. This property makes papaya a suitable material for ammonium ion binding, and therefore, it has a huge potential to be transformed into an effective adsorbent.8 The growing need for specialized activated carbon, particularly for specific applications, has resulted in the heightened importance of using phosphoric acid. It offers numerous advantages, such as increased porosity, improved yield, greater chemical stability, and enhanced adsorption characteristics. Phosphoric acid is essential for facilitating pyrolytic processes and incorporating beneficial surface functional groups, making it crucial for producing high-quality activated carbons suitable for wastewater treatment and various environmental applications.20,21 Experimental investigations were carried out to elucidate the adsorption mechanisms and assess the efficacy of a completely new adsorbent. These investigations included adsorption isotherms, kinetic studies, and characterization analyses. It is worth noting that this distinct adsorbent has not been documented in scientific literature before. The novelty of producing activated carbon from the papaya plant (Carica papaya) is underscored by several key factors, including its sustainable sourcing, innovative activation methodologies, advanced characterization techniques, functional properties conducive to effective adsorption, and significant environmental benefits. These attributes position papaya-derived activated carbon as a promising material for diverse industrial applications. To elucidate its innovative potential, this study evaluates the feasibility and practicality of utilizing activated carbon derived from the papaya plant specifically for removing alizarin red s dye and methylene blue dye from wastewater. The research focuses on assessing the effectiveness of this activated carbon in treating dye-laden effluents, thereby highlighting its applicability in environmental remediation efforts. The general procedure for the synthesis of activated carbon from the papaya plant is described in Scheme 1.
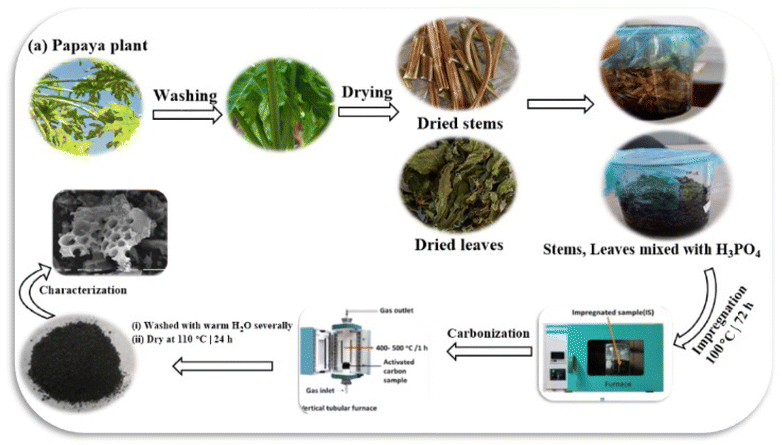 |
| | Scheme 1 The general procedure for the synthesis of chemically modified activated carbon derived from papaya plant. | |
2. Experimental section
2.1. Materials
Papaya plants (including stems and leaves) were gathered from Mansoura, Egypt. All the chemicals used in this study were obtained from Sigma Chemical Co., including HCl (37%), NaOH (99%), and phosphoric acid, which served as a chemical activating agent. Additionally, MB and ARS dyes were used as model adsorbates to evaluate the effectiveness of the adsorbents.
2.2. Synthesis of chemically modified activated carbon derived from papaya plants
The stems and leaves of the papaya plants were separated and thoroughly rinsed several times with both water and deionized water to eliminate any surface contaminants. Following this, the plant materials were desiccated in an oven at 80 °C for three days. To produce activated carbon, 30 g of the dried papaya plants were soaked in a solution of H3PO4 at a concentration of 50.0 ± 0.5% (v/v). This specific concentration was selected based on preliminary experiments to ensure effective activation while minimizing the degradation of the organic material. The volume ratio of the acid solution to the solid mass was set at 2![[thin space (1/6-em)]](https://www.rsc.org/images/entities/char_2009.gif) :
:![[thin space (1/6-em)]](https://www.rsc.org/images/entities/char_2009.gif) 1. This ratio was optimized to enhance the penetration of the activating agent into the plant material, ensuring uniform activation throughout at 25 °C. The soaking time of 72 hours was determined through experimentation, allowing sufficient time for the chemical reaction between H3PO4 and the cellulose structure in the papaya plant. This reaction effectively leads to carbonization and the development of porosity. After soaking, the mixture was dehydrated in an oven at 110 °C for 48 hours to remove moisture. The samples were then gradually activated under an inert nitrogen atmosphere in a horizontal pyrolysis reactor at temperatures between 550 °C and 600 °C for three hours. The reactor was purged with nitrogen gas before activation to ensure the environment was free of oxygen. This prevents combustion and allows for effective carbonization, which could compromise the quality of the activated carbon. A heating rate of approximately 5 °C per minute was maintained to ensure uniform thermal decomposition. After the chemical activation process, the samples were rinsed with distilled water until they reached a neutral pH and then dried overnight in the oven at 120 °C.
1. This ratio was optimized to enhance the penetration of the activating agent into the plant material, ensuring uniform activation throughout at 25 °C. The soaking time of 72 hours was determined through experimentation, allowing sufficient time for the chemical reaction between H3PO4 and the cellulose structure in the papaya plant. This reaction effectively leads to carbonization and the development of porosity. After soaking, the mixture was dehydrated in an oven at 110 °C for 48 hours to remove moisture. The samples were then gradually activated under an inert nitrogen atmosphere in a horizontal pyrolysis reactor at temperatures between 550 °C and 600 °C for three hours. The reactor was purged with nitrogen gas before activation to ensure the environment was free of oxygen. This prevents combustion and allows for effective carbonization, which could compromise the quality of the activated carbon. A heating rate of approximately 5 °C per minute was maintained to ensure uniform thermal decomposition. After the chemical activation process, the samples were rinsed with distilled water until they reached a neutral pH and then dried overnight in the oven at 120 °C.
2.3. Characterization
The materials' textures, structures, and characteristics were analyzed using various methodologies. The scanning electron microscope (SEM, Jeol JSM 6510LV) was used to examine the elemental analysis and morphology of the produced activated carbon. To identify and characterize the functional groups on the adsorbent surface, Fourier transform infrared spectroscopy (FTIR) was utilized. The FTIR spectra, covering the range of 4000 to 400 cm−1, were collected using Fourier transform infrared spectrometry (FT-IR, Thermo Nicolet iS10, USA).22 The specific surface area, total pore volume, mean pore diameter and pore size distribution of the synthesized activated carbon were analyzed utilizing the Brunauer–Emmett–Teller (BET) nitrogen adsorption technique at 77.35 K, employing the Quantachrome/NOVA apparatus. X-ray photoelectron spectroscopy (XPS, Escalab 250Xi) was employed to analyze activated carbon's properties and crystal structures, including elemental composition and surface chemical state before and after dye adsorption. The zeta potential approach was utilized to identify the surface charge of activated carbon particles.
2.4. Adsorption kinetics and isotherms
The adsorption capacity of LAC/SAC for ARS and MB dyes, two model dye pollutants, was evaluated using batch mode. For the kinetics study, 5 mg of SAC and LAC were added to 10 mL of dye solution in glass vials at 50 to 900 ppm concentrations. The initial pH of the solutions ranged from 2 to 8 and was adjusted using either 0.1 mol L−1 HCl or 0.1 mol L−1 NaOH solutions (500 ppm ARS, 300 ppm MB (STEM) and 200 ppm MB (leaves)). The study investigated the impact of contact times between 5 and 240 minutes on initial dye concentrations of (700 ppm ARS (STEM), 500 ppm ARS (leaves), 800 ppm MB (STEM), and 700 ppm MB (leaves)) with an adsorbent dose of 5 mg. The effect of varying adsorbent doses (2.5–30 mg) was examined at a constant initial dye concentration (700 ppm ARS (STEM), 500 ppm ARS (leaves), 800 ppm MB (STEM) and 700 ppm MB (leaves)) and agitation time of 90 min. The vials were flipped in a uniform-temperature air bath agitator for 90 minutes at temperatures ranging from 298 to 328 K. The dye concentrations in the supernatant solutions were measured. ARS and MB were measured using a spectrophotometer with an ultraviolet-visible spectrum at the maximum wavelength of 520 nm and 664 nm, respectively. The dye removal efficiency (% removal) and the adsorbed amounts of dyes at equilibrium qe (in mg g−1) were determined via the subsequent eqn (1) and (2):23| |
 | (1) |
| |
 | (2) |
The initial concentration of the dye in the solution is represented by C0 (in mg L−1), and the residual concentration at the equilibrium state after adsorption is represented by Ce (in mg L−1). The amount of the dry adsorbent is denoted by W (mg), and the volume of the solution is represented by V (mL).
3. Results and discussion
3.1. Characterizations
3.1.1. Brunauer–Emmett–Teller (BET) surface area. The Brunauer–Emmett–Teller (BET) surface area analysis of SAC and LAC adsorbents, derived from nitrogen (N2) adsorption–desorption isotherms (as shown in Fig. 1 and Table S2†), reveals that SAC possesses a substantially larger surface area of 1053.52 m2 g−1, in contrast to LAC's 441.67 m2 g−1. According to the International Union of Pure and Applied Chemistry (IUPAC) classification, SAC's and LAC's physisorption isotherms are categorized as Type II, indicative of macro-porous structures.24 These isotherms display an H4-type hysteresis loop at relative pressures (p/p0) exceeding 0.4.25 The pore size distribution for both adsorbents, as depicted in Fig. S1,† substantiates the existence of a hierarchical porous structure. This structure comprises micropores with diameters less than 2 nm, and mesopores, ranging from 2 to 50 nm.26 Consequently, the SAC exhibits a markedly greater surface area and pore volume (1053.52 m2 g−1 and 1.158 cm3 g−1, respectively) compared to the LAC, which has a surface area of 441.67 m2 g−1 and a pore volume of 0.4858 cm3 g−1 (Table S2 and Fig. S1†). The adsorbents used in this study demonstrated a significant specific surface area and a highly developed internal pore structure. This indicates that the primary mechanism for removing methylene blue (MB) and alizarin red s dye (ARS) is surface adsorption.
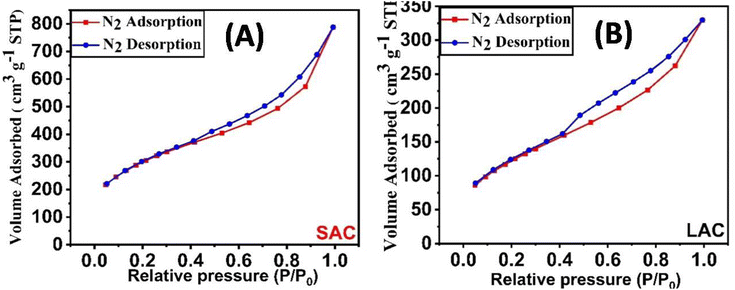 |
| | Fig. 1 The liquid nitrogen adsorption–desorption isotherms of SAC (A), and LAC (B). | |
3.1.2. Fourier-transform infrared spectroscopy. The FTIR spectra are shown in Fig. 2. Activation and carbonization had an impact on all the prepared activated carbons. The changes in peak intensity compared to the raw material spectrum suggest chemical modifications. The results reveal that the band gap at 3295–3362 cm−1 is ascribed to (O–H) hydroxyl groups bound to the surface of the carbon material.27,28 The peak intensity decreased after activation due to increased hydrogen elimination from the plant. These functional groups play a crucial role in surface interactions and adsorption processes. The graphs also show a loss of aliphaticity, confirmed by the complete disappearance of the C–H stretching bands observed around 2900 cm−1 in dried plants.29 Additionally, the bands observed at around 2279 cm−1 can be attributed to the isocyanate group (–N![[double bond, length as m-dash]](https://www.rsc.org/images/entities/char_e001.gif) C
C![[double bond, length as m-dash]](https://www.rsc.org/images/entities/char_e001.gif) O), and the peak intensity increased after activation with H3PO4. The band gap at 2100 cm−1 corresponds to the frequency of alkyne (C
O), and the peak intensity increased after activation with H3PO4. The band gap at 2100 cm−1 corresponds to the frequency of alkyne (C![[triple bond, length as m-dash]](https://www.rsc.org/images/entities/char_e002.gif) C) or cyano group (C
C) or cyano group (C![[triple bond, length as m-dash]](https://www.rsc.org/images/entities/char_e002.gif) N) stretching vibrations.30 In the ACs, the bands observed at approximately 1563–1600 cm−1 unequivocally correspond to the stretching vibrations of the aromatic rings (C
N) stretching vibrations.30 In the ACs, the bands observed at approximately 1563–1600 cm−1 unequivocally correspond to the stretching vibrations of the aromatic rings (C![[double bond, length as m-dash]](https://www.rsc.org/images/entities/char_e001.gif) C) and the carbonyl group (C
C) and the carbonyl group (C![[double bond, length as m-dash]](https://www.rsc.org/images/entities/char_e001.gif) O).6 The peak observed in raw material at 1408 cm−1 is related to (C–C) stretching in aromatics and this peak disappears in ACs. Certain peaks in the 1000–1250 cm−1 range correspond to the C–O and C–O–C bond stretching of aliphatic ether, carboxylic acid, epoxide, anhydride, and lactones.31 Meanwhile, the band at 676 cm−1 is attributed to alkyl halides32 and the band at 489 cm−1 is related to n → π* of the (C–O) bond.33
O).6 The peak observed in raw material at 1408 cm−1 is related to (C–C) stretching in aromatics and this peak disappears in ACs. Certain peaks in the 1000–1250 cm−1 range correspond to the C–O and C–O–C bond stretching of aliphatic ether, carboxylic acid, epoxide, anhydride, and lactones.31 Meanwhile, the band at 676 cm−1 is attributed to alkyl halides32 and the band at 489 cm−1 is related to n → π* of the (C–O) bond.33
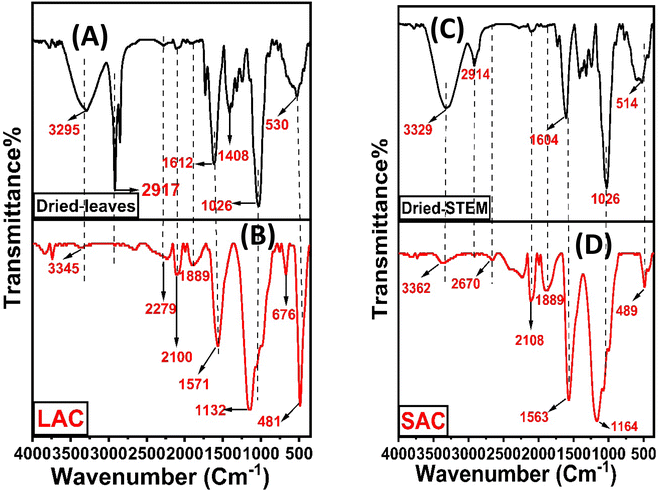 |
| | Fig. 2 FTIR spectra of the prepared adsorbents. | |
3.1.3. Determination of pHpzc. The point of zero charge (pHpzc) for activated carbon material is pivotal in controlling its adsorption efficacy towards contaminants in aquatic environments. Specifically, the pHpzc directly impacts the activated carbon's surface charge characteristics. The zeta potential value was −10.4 mV ± 1.5 for SAC (Fig. S2†). pHpzc was determined and confirmed to be 4.3 for LAC and about 4.1 for SAC, as depicted in Fig. 3. When the pH surpasses the point of zero charge (pHpzc), the adsorbent surface exhibits heightened negative charge density. Consequently, this facilitates the adsorption of cationic dyes (methylene blue) through electrostatic interactions.34 Conversely, when the pH falls below the pHpzc, hydronium ions (H+) dominate the surface, promoting the preferential replacement of anionic dye species (alizarin red s).35
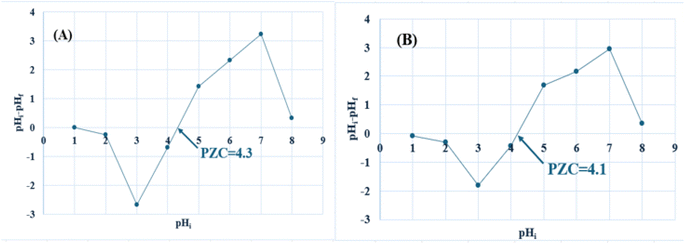 |
| | Fig. 3 Determination of pHpzc for (A) LAC, and (B) SAC (measurements were made at 25 ± 1 °C). | |
3.1.4. XPS. X-ray photoelectron spectroscopy (XPS) is a qualitative technique that provides surface-sensitive analysis of functional groups and surface composition of prepared activated carbon. Fig. 4A shows the XPS survey spectra of activated carbon prepared from the papaya plant. All peaks are observed at C 1s, O 1s, N 1s, and P 2p, indicating the basic components of activated carbon. The high-resolution C 1s spectra (Fig. 4B) displayed five distinct peaks at binding energies of 284.52, 285.53, 287.15, and 289.48 eV. These peaks were unequivocally assigned to specific chemical bonds: graphitic C–C/C![[double bond, length as m-dash]](https://www.rsc.org/images/entities/char_e001.gif) C, C–O, C
C, C–O, C![[double bond, length as m-dash]](https://www.rsc.org/images/entities/char_e001.gif) O, and O–C
O, and O–C![[double bond, length as m-dash]](https://www.rsc.org/images/entities/char_e001.gif) O. The C–O bond was attributed to the presence of functional groups such as aldehydes, ketones, aliphatic ether, and carboxylic acid.36–38 The O 1s spectra of activated carbon (Fig. 4C) displayed four distinct peaks at binding energies 530.95, 532.66, 533.94, 534.61 eV. These peaks correspond to specific oxygen functionalities on the carbon surface to (C
O. The C–O bond was attributed to the presence of functional groups such as aldehydes, ketones, aliphatic ether, and carboxylic acid.36–38 The O 1s spectra of activated carbon (Fig. 4C) displayed four distinct peaks at binding energies 530.95, 532.66, 533.94, 534.61 eV. These peaks correspond to specific oxygen functionalities on the carbon surface to (C![[double bond, length as m-dash]](https://www.rsc.org/images/entities/char_e001.gif) O/O
O/O![[double bond, length as m-dash]](https://www.rsc.org/images/entities/char_e001.gif) P), single bonded oxygen in (C–OH, C–O–C, and C–O–P) linkages, oxygen atoms in ester and anhydrides39 and chemisorbed O/H2O.40 The nitrogen content in SAC is quantified at 1.69 wt%. The high-resolution N 1s XPS spectrum of SAC (Fig. 4D) reveals three distinct sub-peaks at energy levels of 399.38 eV for pyrrolic-N (N-5), 401.02 eV for quaternary-N, and 403.26 eV for oxidized nitrogen (N-X).41 The XPS spectrum of P 2p (Fig. 4E) revealed two distinct peaks at 133.2 and 134.77 eV, which correspond to phosphates and pyrophosphates (PO4 or P2O7) commonly found on the surface of activated carbon, as well as metaphosphates (C–O–PO3). These are less common and indicate the presence of P–O–P linkage.42 The activation method used phosphoric acid, resulting in these functional groups on the activated carbons.
P), single bonded oxygen in (C–OH, C–O–C, and C–O–P) linkages, oxygen atoms in ester and anhydrides39 and chemisorbed O/H2O.40 The nitrogen content in SAC is quantified at 1.69 wt%. The high-resolution N 1s XPS spectrum of SAC (Fig. 4D) reveals three distinct sub-peaks at energy levels of 399.38 eV for pyrrolic-N (N-5), 401.02 eV for quaternary-N, and 403.26 eV for oxidized nitrogen (N-X).41 The XPS spectrum of P 2p (Fig. 4E) revealed two distinct peaks at 133.2 and 134.77 eV, which correspond to phosphates and pyrophosphates (PO4 or P2O7) commonly found on the surface of activated carbon, as well as metaphosphates (C–O–PO3). These are less common and indicate the presence of P–O–P linkage.42 The activation method used phosphoric acid, resulting in these functional groups on the activated carbons.
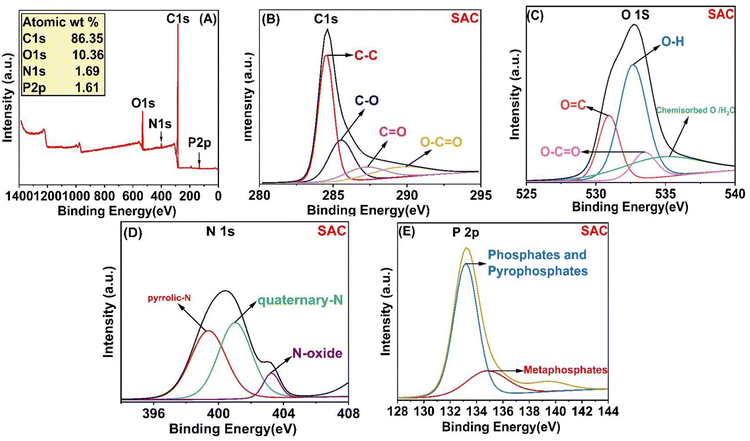 |
| | Fig. 4 XPS spectra of SAC (A); high resolution XPS spectra of (B) C 1s, (C) O 1s, (D) N 1s, and (E) P 2p. | |
3.1.5. SEM. The morphological characteristics of the dried stems of the papaya plant, SAC, and LAC were analyzed using scanning electron microscopy (SEM) images, as depicted in Fig. 5. The SEM images of the precursor (Fig. 5A and B) reveal a rough surface with parallel lines running along the stem and multiple protrusions. After activation, the SEM images of SAC (Fig. 5C, D and S3A–C†) and LAC (Fig. 5E and F) demonstrate notable alterations in surface morphology, including increased particle heterogeneity and the emergence of channels associated with internal pores. The observed porosity in the carbon material is attributed to the thermal decomposition of lignin, cellulose, and hemicellulose during carbonization, which promotes the formation of both micropores and mesopores.35
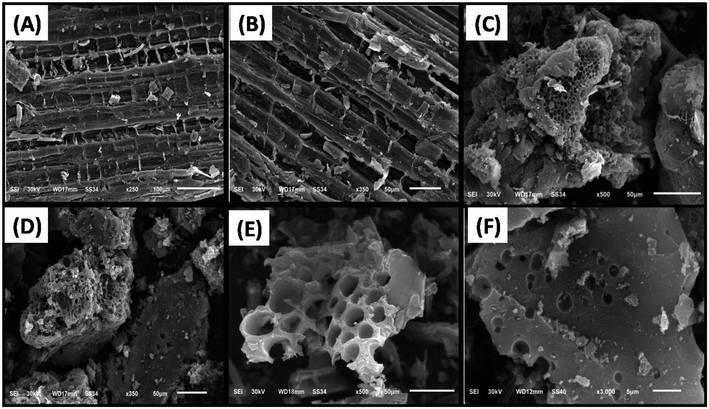 |
| | Fig. 5 SEM images of the dried stems of the papaya plant (A and B), SAC (C and D), and LAC (E and F). | |
3.2. Batch adsorption investigations for ARS and MB dyes
3.2.1. Influence of solution pH. The pH of a water-based system significantly impacts the adsorption process. It affects the shape of the adsorbed molecules and the distribution of surface charges on adsorbents. This influence is critical in wastewater treatment processes that rely on adsorption. In our study, we conducted batch adsorption experiments at different pH levels (2–8) to see how the adsorption capacity of the prepared SAC and LAC would be affected and how it would affect the removal efficiency of ARS and MB. As depicted in Fig. 6A, the maximum removal efficiency for MB occurred at pH 8.0, achieving 99.61% for SAC and 84.5% for LAC. Additionally, the highest adsorption capacity for ARS was observed at pH 4.0, 81.47%, and 20.16% for SAC and LAC explained in Fig. 6A, respectively. The removal efficiency of methylene blue dye increases at higher pH but the adsorption capacity experienced a significant reduction with decreasing pH values. This can be explained by the strong electrostatic repulsion between the positively charged MB![[double bond, length as m-dash]](https://www.rsc.org/images/entities/char_e001.gif) N+ dye ions and the positively charged ions on the surface of prepared activated carbon. Consequently, the adsorption capacity experienced a significant reduction with decreasing pH values.23 In contrast, the efficiency of removing ARS dye is significantly improved at low pH values. This is because an excess of H+ ions around the surface of the activated carbon enhances the electrostatic attraction between the negatively charged oxygen bound to the dye's sulphonic groups and the protonated sites grafted on the activated carbon, leading to increased dye uptake. However, the reduction in removal efficiency as the pH value increases can be attributed to the electrostatic repulsion between similarly charged groups.43
N+ dye ions and the positively charged ions on the surface of prepared activated carbon. Consequently, the adsorption capacity experienced a significant reduction with decreasing pH values.23 In contrast, the efficiency of removing ARS dye is significantly improved at low pH values. This is because an excess of H+ ions around the surface of the activated carbon enhances the electrostatic attraction between the negatively charged oxygen bound to the dye's sulphonic groups and the protonated sites grafted on the activated carbon, leading to increased dye uptake. However, the reduction in removal efficiency as the pH value increases can be attributed to the electrostatic repulsion between similarly charged groups.43
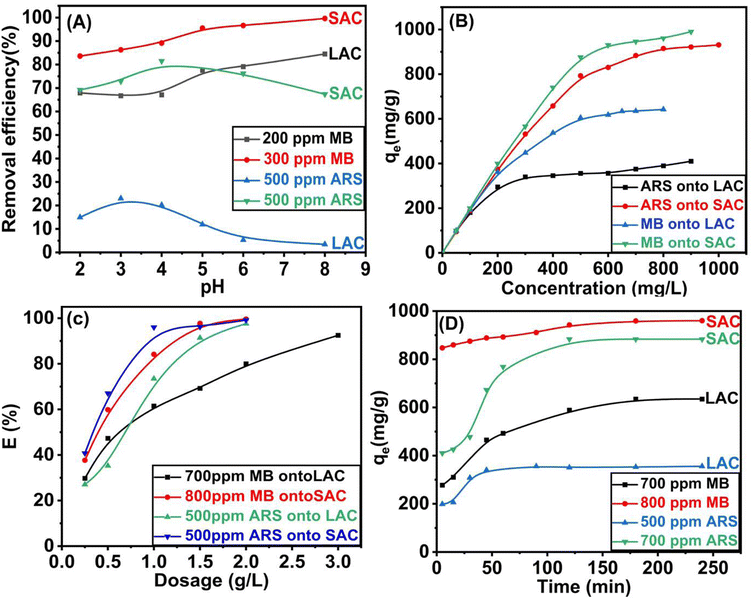 |
| | Fig. 6 The adsorption efficiency of SAC, and LAC as a function of (A) pH; (B) concentration; (C) dosage and (D) contact time. | |
3.2.2. Influence of MB/ARS concentration and temperature. The impact of removing methylene blue and alizarin red s dye using SAC and LAC was studied by varying the dye concentration from 5.0 to 900.0 ppm for both ARS and MB at a constant concentration of 0.5 g L−1. The agitation time was set at 90 minutes, and the pH was 4 and 8 for ARS and MB, respectively. As illustrated in Fig. 6B, the SAC effectively removed entire dye molecules (MB or ARS) from an initial aqueous concentration ranging from 5.0 to 150.0 ppm, indicating that SAC could be used as an effective adsorbent to treat polluted water with a low concentration of dyes. This outcome is attributed to the availability of numerous unoccupied adsorption sites, facilitating stronger interactions between the dye molecules and the adsorbent.44,45 Additionally, as the initial concentration went up from 5.0 to 900.0 ppm, the equilibrium adsorption capacity of MB for SAC rose from 5.0 to 990.0 mg g−1. For LAC, it enhanced from 5.0 to 642.0 mg g−1. Likewise, when the initial concentration of ARS dye was elevated from 5.0 to 900.0 ppm, the equilibrium adsorption capacities for SAC and LAC heightened from 5.0 to 930.96 mg g−1 and from 5.0 to 410.0 mg g−1, respectively. This occurs because of an elevated concentration disparity between the fluid and solid phases, making more dye available at the adsorbent interface. This can reduce the spreading of dye particles to potential adsorption locations on the activated carbon surface, thus increasing its adsorption capacity.46 The influence of varying temperatures on the adsorption characteristics of MB and ARS was investigated (Fig. S4†). The experimental data consistently indicated an enhancement in the adsorption capacity of activated carbons (ACs) with increasing temperature, suggesting an endothermic adsorption process.47 However, a decrease in adsorption efficiency was observed at 55 °C, this aligns with the exothermic characteristics inherent to the adsorption procedures.48 This demonstrates that lower temperatures are more appropriate for adsorption, while higher temperatures facilitate desorption.49
3.2.3. Effect of adsorbent dosage. Adsorbent quantity intricately correlates with total adsorption procedure cost and active site availability, a critical behavior variable that affects adsorption. Understanding this interplay is essential for designing efficient and sustainable adsorption systems. By altering the adsorbent dosages from 2.5 to 20 g L−1, the ARS dye removal increased from 40.74% to 99.15% and from 27.04% to 97.59% for SAC and LAC, respectively (Fig. 6C). Similarly, as seen in Fig. 6C, MB elimination gradually increases from 37.65% to 99.58% and from 29.73% to 92.47% for SAC and LAC, respectively. Consequently, administering higher doses may lead to the potential overlap or aggregation of adsorption sites, resulting in inefficient expenditure and adsorbent mass loss.50
3.2.4. Influence of duration and adsorption kinetics. Duration is an important aspect of the adsorption mechanism of methylene blue (MB) and alizarin red s (ARS) dyes by both SAC and LAC. Fig. 6D demonstrates how stirring duration affects the adsorption of the MB (800 ppm for SAC and 700 ppm for LAC, pH = 8) and ARS (700 ppm for SAC and 500 ppm for LAC, pH = 4). The adsorption capacity rapidly increases within 15 minutes, followed by a gradual approach to equilibrium. The equilibrium uptake capacities for methylene blue and alizarin red s were achieved at 180 and 120 minutes for SAC, and at 180 and 90 minutes for LAC, respectively. The initial adsorption rate was accelerated due to the abundance of numerous active sites for dye adsorption, while the subsequent adsorption rate diminishes as equilibrium is approached, surface molecules on activated carbon repel the bulk solution, making it challenging for the remaining effective adsorption sites to be occupied.45,51 Subsequently, to further elucidate the adsorption kinetics of the synthesized activated carbon, we utilized pseudo-first-order and pseudo-second-order kinetic models to gain a deeper understanding of the adsorption characteristics for methylene blue (MB) and alizarin red s (ARS), see ESI (S1)† for further information on the two models and their corresponding equations. The results, including the kinetic parameters, are shown in Table 1, Fig. 7A, B and S5A and B.† The pseudo-second-order kinetic model was more suitable for describing the dynamic behavior of MB and ARS adsorption on the activated carbons, as indicated by a higher correlation coefficient (R2 = 0.989). Compared to the experimentally determined values for PFO and its adsorption capability align more consistently with those calculated using the PSO. As a result, the pseudo-second-order kinetic model precisely delineates the adsorption mechanism, which is regulated by a chemical adsorption process involving electron sharing or transfer between the adsorbent and adsorbate.7,52,53
Table 1 Kinetic variables for the removal of ARS and MB by SAC and LAC
| Dye |
Adsorbent |
Qexp |
PFO |
PSO |
| qe,cal. (mg g−1) |
K1 (min−1) |
R2 |
qe,cal. (mg g−1) |
K2 (min g mol−1) |
R2 |
| ARS |
SAC |
931.0 |
281.60 |
0.05 |
0.58 |
892.86 |
0.0001 |
0.989 |
| LAC |
410.0 |
35.80 |
0.03 |
0.34 |
357.14 |
0.0005 |
0.998 |
| MB |
SAC |
990.0 |
83.26 |
0.02 |
0.44 |
961.54 |
0.0004 |
0.999 |
| LAC |
642.0 |
225.85 |
0.03 |
0.45 |
645.16 |
0.0001 |
0.984 |
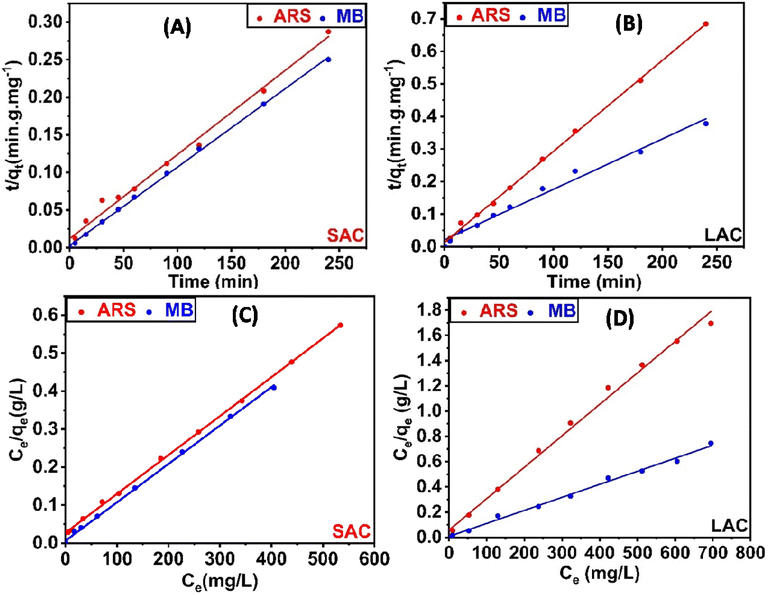 |
| | Fig. 7 PSO kinetic models for the adsorption of MB and ARS onto SAC (A) and LAC (B); Langmuir isotherm model for the adsorption of MB and ARS onto SAC (C) and LAC (D). | |
3.2.5. Isotherm studies. The adsorption isotherm studies are important because they show how adsorbed molecules are distributed between SAC, LAC, and the MB and ARS dyes in equilibrium solutions. These studies are vital for designing adsorption processes by evaluating the effectiveness of the adsorbent. The study examined the adsorption equilibrium data for MB and ARS dyes on SAC and LAC utilizing the Langmuir and Freundlich isotherm models.54,55 The findings are presented in Fig. 7C, D, S5C and D.† As indicated in Table 2, the Langmuir correlation coefficient (R2) for both MB and ARS surpasses 0.999, which has the best matching correlation signifying the presence of monolayer adsorption. The Langmuir model was employed to calculate the maximum adsorption capacity of activated carbons for MB and ARS, closely aligning with the experimental adsorption data, as shown in Table 2. Adsorption is deemed favorable when the RL value ranges between 0 and 1. Furthermore, an (n) value exceeding 1 signifies highly favorable adsorption of dyes onto ACs, indicating robust chemical interactions.56
Table 2 Adsorption isotherm parameters for the removal of MB and ARS by SAC and LAC
| Dye |
Adsorbent |
Qexp |
Langmuir |
Freundlich |
| qm (mg g−1) |
RL |
R2 |
KF (mg−1 L) |
1/n |
R2 |
| ARS |
SAC |
931.0 |
980.4 |
0.026 |
0.999 |
100.72 |
0.39 |
0.887 |
| LAC |
410.0 |
401.6 |
0.02 |
0.992 |
109.06 |
0.21 |
0.953 |
| MB |
SAC |
990.0 |
990.1 |
0.007 |
0.998 |
296.10 |
0.22 |
0.798 |
| LAC |
642.0 |
657.9 |
0.021 |
0.996 |
153.65 |
0.246 |
0.986 |
The Langmuir and Freundlich models were utilized to examine adsorption further, as depicted in the equations below.
Langmuir isotherm model:
| |
 | (3) |
Freundlich isotherm model:
| |
 | (4) |
where
qe (mg g
−1) and
Ce (mg L
−1) represent the amount of adsorbate per unit mass of adsorbent at equilibrium and the equilibrium concentration of the dye in the solution, respectively, the maximum adsorption capacity is represented by
Qm (mg g
−1) and
Qexp (mg g
−1) experimental equilibrium biosorption capacity. The equilibrium adsorption constant is denoted as
KL (mg
−1 L) in the Langmuir isotherm model. The parameter
KF (mg
−1 L) denotes the Freundlich constant related to adsorption capacity, and
n represents the heterogeneity factor.
3.3. Comparison with literature
Table 3 includes a comparison of the (qmax/exp) values for the adsorption of ARS and MB onto SAC and LAC adsorbents and other materials reported literature. The SAC and LAC exhibited impressive adsorption capacities to eliminate ARS and MB water-based solutions.
Table 3 Comparison of the sorption capacities of various adsorbents for MB and ARS
| Pollutant |
Adsorbent |
qm (mg g−1) |
Surface area (m2 g−1) |
pH |
Regeneration |
References |
| ARS |
Zr-CS/Fe3O4-NPS@PH-AC |
374.3 |
546.8 |
4 |
4 |
31 |
| Ox-MWCNT-PER composite |
257.73 |
139.58 |
6.5 |
— |
57 |
| MAC nanocomposite |
108.69 |
347.8 |
2 |
4 |
58 |
| Chicken feather-based functionalized activated carbon |
157 |
856 |
3–4 |
6 |
59 |
| SWCNT |
312.5 |
415.3 |
2 |
— |
60 |
| Au-NP-AC |
123.45 |
1229 |
4.2 |
— |
61 |
| SAC |
931.0 |
1053.52 |
4 |
5 |
This study |
| LAC |
410.0 |
441.671 |
4 |
5 |
This study |
| MB |
PS-AC |
828 |
560.6 |
9 |
5 |
62 |
| PSAC |
225.8 |
868.750 |
6–8 |
— |
63 |
| PNAC |
274.8 |
1070 |
9 |
— |
34 |
| Pd NPs-AC |
75.4 |
— |
7 |
— |
64 |
| SAC |
990.0 |
1053.52 |
8 |
5 |
This study |
| LAC |
642.0 |
441.671 |
8 |
5 |
This study |
3.4. Mechanism of adsorption
Scheme 2 illustrates the potential adsorption mechanism of SAC and LAC for ARS and MB dyes. The uptake of dye molecules onto the surface of activated carbon can be regulated through electrostatic forces and non-electrostatic interactions based on FTIR, XPS, zeta potential, and BET surface area analyses. ARS dye is an anionic dye of the anthraquinone type, which carries a positive charge in acidic conditions. The adsorption of ARS occurred at a pH of 4.0, indicating that at that point, the SAC and LAC were positively charged (–OH2+), attracting the negatively charged (–SO3−) in the ARS dye electrostatically. The oxygen in the ARS dye's sulfonic groups directly interacts with the functional groups present on the activated carbon surface through hydrogen bonding. Furthermore, the aromatic rings of ARS facilitate adsorption by establishing π–π interactions between the dye's aromatic ring and other functional groups on the activated carbon's surface.43 Methylene blue (MB) is a cationic dye characterized by an azo-type structure, which carries a positive charge in basic conditions. The adsorption of MB occurs at pH 8.0 through electrostatic interactions between the positively charged MB molecules and the negatively charged surface of activated carbon. Our research suggests that adsorption entails chemical interactions, particularly by forming hydrogen bonds between the nitrogen and sulfur atoms in MB molecules and the carboxylic and hydroxyl groups in SAC and LAC. Additionally, π–π interactions further enhance the capture of MB, contributing to the overall adsorption effect.65 Hydrogen bonding, electrostatic interactions, and π–π interactions collectively enhance the adsorption process between activated carbon and dyes, thereby contributing to its exceptional efficacy in dye elimination. This proposed mechanism was confirmed by the FTIR spectra of SAC before and after MB and ARS dyes adsorption, as depicted in Fig. S6A and B,† it is obvious that after dye adsorption the stretching vibration bands at 1563 cm−1, 1164 cm−1, and 489 cm−1 are shifted to 1578 cm−1, 1164 cm−1, and 527 cm−1, respectively, suggesting the involvement of the oxygen-containing functional groups in the removal process. Moreover, the mechanism of methylene blue removal on the surface of the SAC was elucidated by comparing the XPS survey spectra of the SAC adsorbent before and after the adsorption process (Fig. 4 and 8). The results revealed new peaks at 164.61 eV and 166.71 eV following methylene blue adsorption. These peaks correspond to C–S–C (S 2p3/2) and SO32−, indicating the presence of methylene blue on the surface of the activated carbon.62,66 After the adsorption of methylene blue, the N 1s peaks shifted to 399.73, 402.37, and 404.07 eV. This shift suggests an electronic transfer between the oxygen-containing groups in the activated carbon and the ![[double bond, length as m-dash]](https://www.rsc.org/images/entities/char_e001.gif) N+ groups in methylene blue. These sub-peaks are essential for identifying the bonding configurations of the nitrogen species. Furthermore, the observed peaks in the C 1s spectra shifted to 284.66, 285.68, 287.14, and 289.34 eV. This spectral shift implies an electrostatic attraction between the negatively charged oxygen-containing groups on the SAC surface and the positively charged dimethylammonium moieties associated with methylene blue. Additionally, the O 1s peaks shifted to 530.86, 532.9, 533.34, and 536.06 eV, indicating an interaction between the oxygen-containing groups in the activated carbon and methylene blue. These results revealed that adsorption via hydrogen bonding, electrostatic interactions, and π–π interactions are the primary factors in a successful adsorption process, as shown in Scheme 2.
N+ groups in methylene blue. These sub-peaks are essential for identifying the bonding configurations of the nitrogen species. Furthermore, the observed peaks in the C 1s spectra shifted to 284.66, 285.68, 287.14, and 289.34 eV. This spectral shift implies an electrostatic attraction between the negatively charged oxygen-containing groups on the SAC surface and the positively charged dimethylammonium moieties associated with methylene blue. Additionally, the O 1s peaks shifted to 530.86, 532.9, 533.34, and 536.06 eV, indicating an interaction between the oxygen-containing groups in the activated carbon and methylene blue. These results revealed that adsorption via hydrogen bonding, electrostatic interactions, and π–π interactions are the primary factors in a successful adsorption process, as shown in Scheme 2.
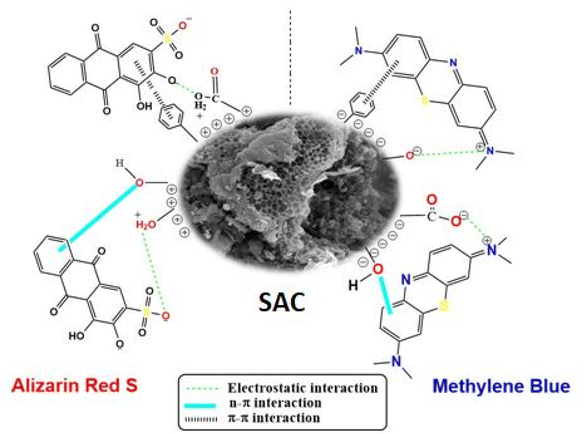 |
| | Scheme 2 Possible mechanisms for the adsorption of MB and ARS dyes onto SAC. | |
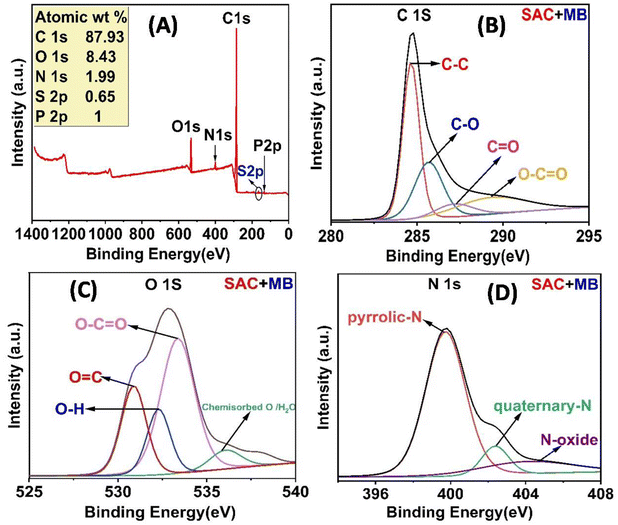 |
| | Fig. 8 XPS spectra of SAC after MB adsorption (A); high-resolution XPS spectra of (B) C 1s, (C) O 1s, and (D) N 1s. | |
3.5. Application in real water samples
Three wastewater samples were obtained from different locations across Mansoura, Egypt. These samples served as the basis for assessing the practical efficacy of SAC and LAC. The objective was to evaluate their cost-effectiveness in removing MB or ARS at an initial concentration of 100 mg L−1. Before the adsorption experiments, all samples underwent filtration using 0.45 μm filters to eliminate suspended particles. The removal efficiency consistently surpassed 97%. Nevertheless, wastewater comprises various heavy metals and diverse organic pollutants (Fig. 9A). Both SAC and LAC demonstrated promising adsorption capacities under controlled laboratory settings and in actual environmental water samples.
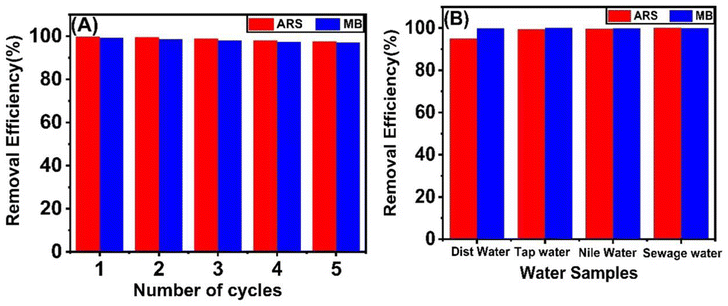 |
| | Fig. 9 (A) The reusability of SAC adsorbent for MB and ARS dyes; (B) removal of MB and ARS from real water samples using SAC adsorbent. | |
3.6. Reusability studies
We assessed the industrial applicability of adsorbents by investigating the reusability of both SAC and LAC. This study involved five cycles of adsorption and elution using the optimal sample. After each cycle, we quantified the adsorption capacity to evaluate the viability and reusability of the adsorbent. We tested the adsorbent's reusability by conducting desorption tests of the dye from the SAC and LAC adsorbent using 0.1 M NaOH for ARS and 0.1 M HCl for MB. In the first five cycles, the adsorbent demonstrated good stability and reusability in removing anionic and cationic dyes, but after that, its performance rapidly declined (Fig. 9B).
4. Conclusion
In this investigation, we synthesized cost-effective and environmentally sustainable SAC and LAC via chemical activation with phosphoric acid. This method yielded substantial specific surface areas of 1053.52 m2 g−1 for SAC and 441.671 m2 g−1 for LAC. Batch sorption experiments were conducted to assess the efficacy of SAC and LAC in adsorbing the anionic ARS dye and cationic MB dye. The maximum adsorption capacities for SAC were determined to be 931 mg g−1 for ARS and 990 mg g−1 for MB, while for LAC, the capacities were 410 mg g−1 for ARS and 642 mg g−1 for MB. Kinetic investigations revealed that the adsorption process is well-suited to the pseudo-second-order kinetics model, and the experimental data align more accurately with the Langmuir isotherm model (R2 = 0.999). Additionally, the adsorbed materials demonstrated easy regeneration with no significant loss in efficiency for up to five cycles. The industrial applications of activated carbon derived from papaya plants are noteworthy. Its integration into large-scale wastewater treatment facilities could provide more sustainable and cost-effective solutions for managing industrial effluents. By incorporating this bio-sorbent into existing treatment processes, industries may reduce their dependence on synthetic adsorbents, which are often associated with higher costs and environmental concerns.
Data availability
All data generated or analyzed during this study are included in the main article and ESI.†
Conflicts of interest
There are no conflicts to declare.
References
- A. Aboussabek, L. Boukarma, S. El Qdhy, A. Ousaa, M. Zerbet and M. Chiban, Case Stud. Chem. Environ. Eng., 2024, 9, 100580 CrossRef CAS.
- L. Ceroni, S. Benazzato, S. Pressi, L. Calvillo, E. Marotta and E. Menna, Nanomaterials, 2024, 14, 522 CrossRef CAS.
- N. S. M. Sayed, A. S. A. Ahmed, M. H. Abdallah and G. A. Gouda, Sci. Rep., 2024, 14, 5384 CrossRef CAS PubMed.
- W. T. Al-Rubayee, O. F. Abdul-Rasheed and N. M. Ali, J. Chem., 2016, 2016, 4683859 CrossRef.
- P. C. Bhomick, A. Supong, M. Baruah, C. Pongener and D. Sinha, Sustainable Chem. Pharm., 2018, 10, 41–49 CrossRef.
- W. Zhou, K. Carlson, Q. Wu, X. Wang, S. Xu and Z. Li, Crystals, 2023, 13, 664 CrossRef CAS.
- A. R. K. Gollakota, V. S. Munagapati, V. Volli, S. Gautam, J.-C. Wen and C.-M. Shu, J. Hazard. Mater., 2021, 416, 125925 CrossRef CAS PubMed.
- S. T. Nipa, N. R. Shefa, S. Parvin, M. A. Khatun, M. J. Alam, S. Chowdhury, M. A. R. Khan, S. M. A. Z. Shawon, B. K. Biswas and M. W. Rahman, Results Eng., 2023, 17, 100857 CrossRef CAS.
- J. Cheng, C. Zhan, J. Wu, Z. Cui, J. Si, Q. Wang, X. Peng and L.-S. Turng, ACS Omega, 2020, 5, 5389–5400 CrossRef CAS PubMed.
- M. Bellaj, H. Yazid, K. Aziz, A. Regti, M. El Haddad, M. El Achaby, A. Abourriche, L. Gebrati, T. A. Kurniawan and F. Aziz, Environ. Res., 2024, 247, 118352 Search PubMed.
- S. Deniz, Mater. Today Commun., 2023, 35, 106433 Search PubMed.
- R. S. Salama, E.-S. M. El-Sayed, S. M. El-Bahy and F. S. Awad, Colloids Surf., A, 2021, 626, 127089 CrossRef CAS.
- W. M. Alamier, M. D. Y. Oteef, A. M. Bakry, N. Hasan, K. S. Ismail and F. S. Awad, ACS Omega, 2023, 8, 18901–18914 CrossRef CAS PubMed.
- D. Dimbo, M. Abewaa, E. Adino, A. Mengistu, T. Takele, A. Oro and M. Rangaraju, Results Eng., 2024, 21, 101910 CrossRef CAS.
- K. Azam, N. Shezad, I. Shafiq, P. Akhter, F. Akhtar, F. Jamil, S. Shafique, Y.-K. Park and M. Hussain, Chemosphere, 2022, 306, 135566 Search PubMed.
- A. H. Amran, N. S. Zaidi, A. Syafiuddin, L. Z. Zhan, M. B. Bahrodin, M. A. Mehmood and R. Boopathy, Appl. Sci., 2021, 11, 5715 CrossRef CAS.
- S. A. N. Vezar, Z. T. Belinda, M. Rendana, T. E. Agustina, S. Nasir, L. Hanum and D. Andarini, J. Eng. Appl. Sci., 2024, 71, 99 CrossRef CAS.
- A. Saravana Kumaar, A. Senthilkumar, T. Sornakumar, S. S. Saravanakumar and V. P. Arthanariesewaran, J. Nat. Fibers, 2019, 16, 175–184 CrossRef CAS.
- A. Kempe, A. Göhre, T. Lautenschläger, A. Rudolf, M. Eder and C. Neinhuis, Annu. Res. Rev. Biol., 2015, 6, 245–252 CrossRef.
- W. Xu, J. Liu, K. Sun, Y. Liu, C. Chen, A. Wang and H. Sun, BioResources, 2021, 16, 4007–4020 CAS.
- I. Moulefera, F. J. García-Mateos, A. Benyoucef, J. M. Rosas, J. Rodríguez-Mirasol and T. Cordero, Front. Mater., 2020, 7, 153 CrossRef.
- M. N. El-Haddad, Int. J. Biol. Macromol., 2013, 55, 142–149 CrossRef CAS PubMed.
- H. M. Hashem, M. El-Maghrabey and R. El-Shaheny, Sci. Rep., 2024, 14, 13515 Search PubMed.
- C. Bläker, J. Muthmann, C. Pasel and D. Bathen, ChemBioEng Rev., 2019, 6, 119–138 CrossRef.
- P. I. Dikobe, M. Tekere, V. Masindi and S. Foteinis, J. Water Process Eng., 2024, 68, 106313 CrossRef.
- B. N. S. Al-dhawi, S. R. M. Kutty, A. M. Alawag, N. M. Y. Almahbashi, F. A. H. Al-Towayti, A. Algamili, N. Aminu, A.-B. A. Al-Mekhlafi, A. H. Birniwa and A. H. Jagaba, Case Stud. Chem. Environ. Eng., 2023, 8, 100508 CrossRef CAS.
- J. K. Fatombi, S. A. Osseni, E. A. Idohou, I. Agani, D. Neumeyer, M. Verelst, R. Mauricot and T. Aminou, J. Environ. Chem. Eng., 2019, 7, 103343 CrossRef CAS.
- A. M. Bakry, F. S. Awad, J. A. Bobb and M. S. El-Shall, ACS Omega, 2020, 5, 33090–33100 CrossRef CAS PubMed.
- N. Bouchelkia, K. Benazouz, A. Mameri, L. Belkhiri, N. Hamri, H. Belkacemi, A. Zoukel, A. Amrane, F. Aoulmi and L. Mouni, Processes, 2023, 11, 2694 CrossRef CAS.
- M. Husaini, B. Usman and M. Ibrahim, J. Turk. Chem. Soc., Sect. A, 2024, 11, 655–664 CrossRef CAS.
- Y. Liu, H. Gao, Z. Li and R. Han, Int. J. Biol. Macromol., 2024, 132995 Search PubMed.
- O. A. Hussain, A. S. Hathout, Y. E. Abdel-Mobdy, M. M. Rashed, E. A. A. Rahim and A. S. M. Fouzy, Toxicol Rep, 2023, 10, 146–154 CrossRef CAS PubMed.
- M. A. Bhatti, E. Dawi, A. Tahira, K. F. Almani, S. S. Medany, A. Nafady, Z. A. Solangi, U. Aftab and Z. H. Ibhupoto, Catalysts, 2023, 13, 886 CrossRef CAS.
- A. Hapiz, A. H. Jawad, L. D. Wilson and Z. A. Alothman, Int. J. Phytorem., 2024, 26, 324–338 CrossRef CAS PubMed.
- B. G. Alhogbi, S. Altayeb, E. A. Bahaidarah and M. F. Zawrah, Processes, 2021, 9, 416 CrossRef CAS.
- B. Boukoussa, K. R. Cherdouane, R. Zegai, A. Mokhtar, M. Hachemaoui, I. Issam, J. Iqbal, S. P. Patole, F. Z. Zeggai and R. Hamacha, Surf. Interfaces, 2024, 44, 103622 CrossRef CAS.
- S. M. Waly, A. M. El-Wakil, W. M. Abou El-Maaty and F. S. Awad, RSC Adv., 2024, 14, 15281–15292 RSC.
- H. D. Kiriarachchi, A. A. Hassan, F. S. Awad and M. S. El-Shall, RSC Adv., 2022, 12, 1043–1050 RSC.
- N. Qin, C. Tian, L. Carter, D. Tao, Y. Zhou and F. Zhang, Next Sustainability, 2024, 4, 100057 CrossRef.
- J. M. González-Domínguez, C. Fernández-González, M. Alexandre-Franco and V. Gómez-Serrano, Processes, 2024, 12, 149 CrossRef.
- J. Wu, W. Chen, L. Chen and X. Jiang, J. Hazard. Mater., 2022, 424, 127648 CrossRef CAS PubMed.
- X. Gao, L. Wu, Z. Li, Q. Xu, W. Tian and R. Wang, J. Mater. Cycles Waste Manage., 2018, 20, 925–936 CrossRef CAS.
- S. Aravindhan, G. B. Kumar, M. Saravanan and A. Arumugam, Bioresour. Technol. Rep., 2024, 25, 101721 CrossRef CAS.
- M. Sillanpää, A. H. Mahvi, D. Balarak and A. D. Khatibi, Int. J. Environ. Anal. Chem., 2023, 103, 212–229 CrossRef.
- N. M. Ghazy, E. A. Ghaith, Y. Abou El-Reash, R. R. Zaky, W. M. Abou El-Maaty and F. S. Awad, RSC Adv., 2022, 12, 35587–35597 RSC.
- J. Wu, H. Annath, H. Chen and C. Mangwandi, Particuology, 2023, 80, 115–126 CrossRef CAS.
- M. G. El-Desouky, A. A. Alayyafi, G. A. A. M. Al-Hazmi and A. A. El-Bindary, J. Mol. Liq., 2024, 399, 124392 CrossRef CAS.
- C. V. S. Srinivas, A. D. Abhishay, A. Kusuma, Y. Gowthami, G. Sowgandh and M. Vangalapati, Mater. Today: Proc., 2023 DOI:10.1016/j.matpr.2023.04.035.
- A. Abuessawy, A. Fouda, A. A. H. Abdel-Rahman, M. A. Hawata and N. A. Hamad, J. Polym. Environ., 2024, 32, 826–841 CrossRef CAS.
- A. M. Alsuhaibani, A. A. Alayyafi, L. A. Albedair, M. G. El-Desouky and A. A. El-Bindary, J. Mol. Liq., 2024, 398, 124252 CrossRef.
- M. Danish, W. A. Khanday, R. Hashim, N. S. B. Sulaiman, M. N. Akhtar and M. Nizami, Ecotoxicol. Environ. Saf., 2017, 139, 280–290 CrossRef CAS.
- B. Yardımcı and N. Kanmaz, J. Environ. Chem. Eng., 2023, 11, 110254 CrossRef.
- S. M. Waly, A. M. El-Wakil, W. M. Abou El-Maaty and F. S. Awad, J. Saudi Chem. Soc., 2021, 25, 101296 CrossRef CAS.
- S. H. Alrefaee, M. Aljohani, K. Alkhamis, F. Shaaban, M. G. El-Desouky, A. A. El-Bindary and M. A. El-Bindary, J. Mol. Liq., 2023, 384, 122206 CrossRef CAS.
- F. S. Awad, K. M. AbouZeid, W. M. A. El-Maaty, A. M. El-Wakil and M. S. El-Shall, ACS Appl. Mater. Interfaces, 2017, 9, 34230–34242 CrossRef CAS PubMed.
- S. Imame, H. Atlas, J. Houssaini, M. Sadoq, M. Legsaier, K. Loukili, K. M. EL Bakkali, I. Kirm, A. Palsan Sannasi and F. Boukhlifi, Anal. Methods Environ. Chem. J., 2024, 7, 33–50 CrossRef.
- J.-Y. Yang, X.-Y. Jiang, F.-P. Jiao and J.-G. Yu, Appl. Surf. Sci., 2018, 436, 198–206 CrossRef CAS.
- M. Fayazi, M. Ghanei-Motlagh and M. A. Taher, Mater. Sci. Semicond. Process., 2015, 40, 35–43 CrossRef CAS.
- N. F. Attia, S. M. Shaltout, I. A. Salem, A. B. Zaki, M. H. El-Sadek and M. A. Salem, Biomass Convers. Biorefin., 2024, 14, 4989–5004 CrossRef CAS.
- F. M. Machado, S. A. Carmalin, E. C. Lima, S. L. P. Dias, L. D. T. Prola, C. Saucier, I. M. Jauris, I. Zanella and S. B. Fagan, J. Phys. Chem. C, 2016, 120, 18296–18306 CrossRef CAS.
- M. Roosta, M. Ghaedi and M. Mohammadi, Powder Technol., 2014, 267, 134–144 CrossRef CAS.
- X. Liu, C. He, X. Yu, Y. Bai, L. Ye, B. Wang and L. Zhang, Powder Technol., 2018, 326, 181–189 CrossRef CAS.
- M. Wu, Q. Guo and G. Fu, Powder Technol., 2013, 247, 188–196 CrossRef CAS.
- M. Ghaedi, S. Heidarpour, S. N. Kokhdan, R. Sahraie, A. Daneshfar and B. Brazesh, Powder Technol., 2012, 228, 18–25 CrossRef CAS.
- P. Yang, Y. Lu, H. Zhang, R. Li, X. Hu, A. Shahab, A. Y. Elnaggar, A. F. Alrefaei, M. H. AlmutairiI and E. Ali, Environ. Technol. Innovation, 2024, 33, 103459 CrossRef CAS.
- W. Chen, G. Zhang, D. Li, S. Ma, B. Wang and X. Jiang, Ind. Eng. Chem. Res., 2020, 59, 7447–7456 CrossRef CAS.
Footnote |
| † Electronic supplementary information (ESI) available: Properties of methylene blue and alizarin red s (Table S1). Surface characteristics of SAC and LAC (Table S2). Pore size distribution of SAC and LAC (Fig. S1). Zeta potential of SAC (Fig. S2). Effect of temperature on the removal of MB and ARS dyes using LAC and SAC (Fig. S4). The PSO and PFO kinetic model equations (S1). PFO kinetic models for the adsorption of MB and ARS onto SAC (Fig. S5A) and LAC (Fig. S5B). Freundlich isotherm model for the adsorption of MB and ARS onto SAC (Fig. S5C) and LAC (Fig. S5D). See DOI: https://doi.org/10.1039/d4ra07957d |
|
| This journal is © The Royal Society of Chemistry 2025 |
Click here to see how this site uses Cookies. View our privacy policy here.  Open Access Article
 *ab
*ab

![[thin space (1/6-em)]](https://www.rsc.org/images/entities/char_2009.gif) :
:![[thin space (1/6-em)]](https://www.rsc.org/images/entities/char_2009.gif) 1. This ratio was optimized to enhance the penetration of the activating agent into the plant material, ensuring uniform activation throughout at 25 °C. The soaking time of 72 hours was determined through experimentation, allowing sufficient time for the chemical reaction between H3PO4 and the cellulose structure in the papaya plant. This reaction effectively leads to carbonization and the development of porosity. After soaking, the mixture was dehydrated in an oven at 110 °C for 48 hours to remove moisture. The samples were then gradually activated under an inert nitrogen atmosphere in a horizontal pyrolysis reactor at temperatures between 550 °C and 600 °C for three hours. The reactor was purged with nitrogen gas before activation to ensure the environment was free of oxygen. This prevents combustion and allows for effective carbonization, which could compromise the quality of the activated carbon. A heating rate of approximately 5 °C per minute was maintained to ensure uniform thermal decomposition. After the chemical activation process, the samples were rinsed with distilled water until they reached a neutral pH and then dried overnight in the oven at 120 °C.
1. This ratio was optimized to enhance the penetration of the activating agent into the plant material, ensuring uniform activation throughout at 25 °C. The soaking time of 72 hours was determined through experimentation, allowing sufficient time for the chemical reaction between H3PO4 and the cellulose structure in the papaya plant. This reaction effectively leads to carbonization and the development of porosity. After soaking, the mixture was dehydrated in an oven at 110 °C for 48 hours to remove moisture. The samples were then gradually activated under an inert nitrogen atmosphere in a horizontal pyrolysis reactor at temperatures between 550 °C and 600 °C for three hours. The reactor was purged with nitrogen gas before activation to ensure the environment was free of oxygen. This prevents combustion and allows for effective carbonization, which could compromise the quality of the activated carbon. A heating rate of approximately 5 °C per minute was maintained to ensure uniform thermal decomposition. After the chemical activation process, the samples were rinsed with distilled water until they reached a neutral pH and then dried overnight in the oven at 120 °C.


![[double bond, length as m-dash]](https://www.rsc.org/images/entities/char_e001.gif) C
C![[double bond, length as m-dash]](https://www.rsc.org/images/entities/char_e001.gif) O), and the peak intensity increased after activation with H3PO4. The band gap at 2100 cm−1 corresponds to the frequency of alkyne (C
O), and the peak intensity increased after activation with H3PO4. The band gap at 2100 cm−1 corresponds to the frequency of alkyne (C![[triple bond, length as m-dash]](https://www.rsc.org/images/entities/char_e002.gif) C) or cyano group (C
C) or cyano group (C![[triple bond, length as m-dash]](https://www.rsc.org/images/entities/char_e002.gif) N) stretching vibrations.30 In the ACs, the bands observed at approximately 1563–1600 cm−1 unequivocally correspond to the stretching vibrations of the aromatic rings (C
N) stretching vibrations.30 In the ACs, the bands observed at approximately 1563–1600 cm−1 unequivocally correspond to the stretching vibrations of the aromatic rings (C![[double bond, length as m-dash]](https://www.rsc.org/images/entities/char_e001.gif) C) and the carbonyl group (C
C) and the carbonyl group (C![[double bond, length as m-dash]](https://www.rsc.org/images/entities/char_e001.gif) O).6 The peak observed in raw material at 1408 cm−1 is related to (C–C) stretching in aromatics and this peak disappears in ACs. Certain peaks in the 1000–1250 cm−1 range correspond to the C–O and C–O–C bond stretching of aliphatic ether, carboxylic acid, epoxide, anhydride, and lactones.31 Meanwhile, the band at 676 cm−1 is attributed to alkyl halides32 and the band at 489 cm−1 is related to n → π* of the (C–O) bond.33
O).6 The peak observed in raw material at 1408 cm−1 is related to (C–C) stretching in aromatics and this peak disappears in ACs. Certain peaks in the 1000–1250 cm−1 range correspond to the C–O and C–O–C bond stretching of aliphatic ether, carboxylic acid, epoxide, anhydride, and lactones.31 Meanwhile, the band at 676 cm−1 is attributed to alkyl halides32 and the band at 489 cm−1 is related to n → π* of the (C–O) bond.33
![[double bond, length as m-dash]](https://www.rsc.org/images/entities/char_e001.gif) C, C–O, C
C, C–O, C![[double bond, length as m-dash]](https://www.rsc.org/images/entities/char_e001.gif) O, and O–C
O, and O–C![[double bond, length as m-dash]](https://www.rsc.org/images/entities/char_e001.gif) O. The C–O bond was attributed to the presence of functional groups such as aldehydes, ketones, aliphatic ether, and carboxylic acid.36–38 The O 1s spectra of activated carbon (Fig. 4C) displayed four distinct peaks at binding energies 530.95, 532.66, 533.94, 534.61 eV. These peaks correspond to specific oxygen functionalities on the carbon surface to (C
O. The C–O bond was attributed to the presence of functional groups such as aldehydes, ketones, aliphatic ether, and carboxylic acid.36–38 The O 1s spectra of activated carbon (Fig. 4C) displayed four distinct peaks at binding energies 530.95, 532.66, 533.94, 534.61 eV. These peaks correspond to specific oxygen functionalities on the carbon surface to (C![[double bond, length as m-dash]](https://www.rsc.org/images/entities/char_e001.gif) O/O
O/O![[double bond, length as m-dash]](https://www.rsc.org/images/entities/char_e001.gif) P), single bonded oxygen in (C–OH, C–O–C, and C–O–P) linkages, oxygen atoms in ester and anhydrides39 and chemisorbed O/H2O.40 The nitrogen content in SAC is quantified at 1.69 wt%. The high-resolution N 1s XPS spectrum of SAC (Fig. 4D) reveals three distinct sub-peaks at energy levels of 399.38 eV for pyrrolic-N (N-5), 401.02 eV for quaternary-N, and 403.26 eV for oxidized nitrogen (N-X).41 The XPS spectrum of P 2p (Fig. 4E) revealed two distinct peaks at 133.2 and 134.77 eV, which correspond to phosphates and pyrophosphates (PO4 or P2O7) commonly found on the surface of activated carbon, as well as metaphosphates (C–O–PO3). These are less common and indicate the presence of P–O–P linkage.42 The activation method used phosphoric acid, resulting in these functional groups on the activated carbons.
P), single bonded oxygen in (C–OH, C–O–C, and C–O–P) linkages, oxygen atoms in ester and anhydrides39 and chemisorbed O/H2O.40 The nitrogen content in SAC is quantified at 1.69 wt%. The high-resolution N 1s XPS spectrum of SAC (Fig. 4D) reveals three distinct sub-peaks at energy levels of 399.38 eV for pyrrolic-N (N-5), 401.02 eV for quaternary-N, and 403.26 eV for oxidized nitrogen (N-X).41 The XPS spectrum of P 2p (Fig. 4E) revealed two distinct peaks at 133.2 and 134.77 eV, which correspond to phosphates and pyrophosphates (PO4 or P2O7) commonly found on the surface of activated carbon, as well as metaphosphates (C–O–PO3). These are less common and indicate the presence of P–O–P linkage.42 The activation method used phosphoric acid, resulting in these functional groups on the activated carbons.
![[double bond, length as m-dash]](https://www.rsc.org/images/entities/char_e001.gif) N+ dye ions and the positively charged ions on the surface of prepared activated carbon. Consequently, the adsorption capacity experienced a significant reduction with decreasing pH values.23 In contrast, the efficiency of removing ARS dye is significantly improved at low pH values. This is because an excess of H+ ions around the surface of the activated carbon enhances the electrostatic attraction between the negatively charged oxygen bound to the dye's sulphonic groups and the protonated sites grafted on the activated carbon, leading to increased dye uptake. However, the reduction in removal efficiency as the pH value increases can be attributed to the electrostatic repulsion between similarly charged groups.43
N+ dye ions and the positively charged ions on the surface of prepared activated carbon. Consequently, the adsorption capacity experienced a significant reduction with decreasing pH values.23 In contrast, the efficiency of removing ARS dye is significantly improved at low pH values. This is because an excess of H+ ions around the surface of the activated carbon enhances the electrostatic attraction between the negatively charged oxygen bound to the dye's sulphonic groups and the protonated sites grafted on the activated carbon, leading to increased dye uptake. However, the reduction in removal efficiency as the pH value increases can be attributed to the electrostatic repulsion between similarly charged groups.43


![[double bond, length as m-dash]](https://www.rsc.org/images/entities/char_e001.gif) N+ groups in methylene blue. These sub-peaks are essential for identifying the bonding configurations of the nitrogen species. Furthermore, the observed peaks in the C 1s spectra shifted to 284.66, 285.68, 287.14, and 289.34 eV. This spectral shift implies an electrostatic attraction between the negatively charged oxygen-containing groups on the SAC surface and the positively charged dimethylammonium moieties associated with methylene blue. Additionally, the O 1s peaks shifted to 530.86, 532.9, 533.34, and 536.06 eV, indicating an interaction between the oxygen-containing groups in the activated carbon and methylene blue. These results revealed that adsorption via hydrogen bonding, electrostatic interactions, and π–π interactions are the primary factors in a successful adsorption process, as shown in Scheme 2.
N+ groups in methylene blue. These sub-peaks are essential for identifying the bonding configurations of the nitrogen species. Furthermore, the observed peaks in the C 1s spectra shifted to 284.66, 285.68, 287.14, and 289.34 eV. This spectral shift implies an electrostatic attraction between the negatively charged oxygen-containing groups on the SAC surface and the positively charged dimethylammonium moieties associated with methylene blue. Additionally, the O 1s peaks shifted to 530.86, 532.9, 533.34, and 536.06 eV, indicating an interaction between the oxygen-containing groups in the activated carbon and methylene blue. These results revealed that adsorption via hydrogen bonding, electrostatic interactions, and π–π interactions are the primary factors in a successful adsorption process, as shown in Scheme 2.


