
 Open Access Article
 This Open Access Article is licensed under a Creative Commons Attribution-Non Commercial 3.0 Unported Licence
A biofuel cell of (methyl violet/AuNPs)25/FTO photoanode and bilirubin oxidase/CuCo2O4 bio-photocathode inspired by the photoelectrochemistry activities of fluorescent materials/molecules†
Chenglong Sunab,
Xingyu Zenga,
Mingjian Chena,
Yun Duac,
Yueyi Penga and
Qingji Xie *a
*a
aKey Laboratory of Chemical Biology & Traditional Chinese Medicine Research (Ministry of Education of China), College of Chemistry and Chemical Engineering, Hunan Normal University, Changsha 410081, China. E-mail: xieqj@hunnu.edu.cn
bSchool of Materials Science and Engineering, Peking University, Beijing 100871, China
cChangsha Center for Diseases Prevention and Control, Changsha 410004, China
First published on 8th January 2025
Abstract
Herein, we discuss the idea that fluorescent materials/molecules should logically show potential photoelectrochemistry (PEC) activity, and, in particular, the PEC of fluorescent small molecules (previously usually acting only as dye sensitizers for conventional semiconductors) is explored. After examining the PEC activities of some typical inorganic or organic fluorescent materials/molecules and by adopting methyl violet (MV) with the highest PEC activity among the examined fluorescent small molecules, a new and efficient (MV/Au nanoparticles (AuNPs))25/fluorine-doped tin oxide (FTO) photoanode without conventional semiconductor(s) is prepared by layer-by-layer alternating the electrodeposition of AuNPs and the adsorption of MV. A bilirubin oxidase (BOD)/CuCo2O4/FTO bio-photocathode is prepared by electrodeposition, calcination and cast-coating. Under optimal conditions, a new photoelectrochemical enzymatic biofuel cell (PEBFC) consisting of this photoanode in 0.1 M phosphate buffer solution (PBS) containing 0.1 M ascorbic acid, this bio-photocathode in 0.1 M PBS containing 0.5 mM 2,2′-azinobis(3-ethylbenzothiazoline-6-sulfonic acid) diammonium salt, and a Nafion membrane gives an open-circuit voltage of 0.73 V and a maximum power output density of 14.1 μW cm−2, outperforming many reported comparable enzymatic biofuel cells. This fluorescence-activity-based PEC research suggests that new PEC and photocatalysis materials/molecules may be found from the huge library of fluorescent substances, and such a fluorescence-based reference criterion is of some general reference value for exploring potential photoelectric materials/molecules and expanding the applications of fluorescent substances.
Introduction
Solar energy is the most widely available renewable resource and one of the cleanest energy sources on earth, and the utilization of solar energy has improved the survival and development status of human beings from ancient to modern times. The conversion of solar energy into chemical energy (liquid sunshine) and electrical energy by photocatalysis and photoelectrochemistry (or photoelectrocatalysis, PEC) has received a lot of attention for years,1–4 and it is widely recognized that the innovation and optimization of photoelectric materials are among the core scientific issues in the field. To date, energy band theory has been widely employed to elucidate light absorption, photo-excited charge separation, charge recombination, and charge transfer of semiconductors in photocatalysis and PEC,5–10 as discussed below according to the literature and our understanding. After a semiconductor absorbs light of an appropriate wavelength, the absorbed light energy can excite the electrons on the semiconductor valence band (VB) to jump to the semiconductor conduction band (CB), and thus electrons on the CB and holes of an equal quantity on the VB are produced simultaneously, implying the photo-excited separation of charges in/on the semiconductor.11 Obviously, the excited state with photogenerated CB electrons and VB holes tends to spontaneously de-excite to the ground state with no photogenerated charges. In our opinion, such de-excitation as an opposite process to the separation of photo-excited charges can on the whole be achieved physically and chemically in photocatalysis and PEC, namely, by two kinds of charge recombination (nonradiative recombination, from light energy to heat energy; radiative recombination = photoluminescence, e.g. fluorescence emission, from light energy to light energy), and by two kinds of charge transfer (redox chemistry, from light energy to chemical energy; electricity generation, from light energy to electrical energy). Obviously, the photocatalysis and PEC performance are determined by the charge transfer performance, as explained in the ESI.† In our opinion, there are kinetically parallel and competitive relationships among nonradiative recombination, radiative recombination (photoluminescence, e.g. fluorescence), and charge transfer (redox chemistry, and electricity generation) during the de-excitation of the photo-excited state, as shown in Scheme 1. The well-known fact that many materials/molecules can absorb ultraviolet-visible (UV-vis) light but cannot emit fluorescence should indicate that the nonradiative-recombination process is usually much faster than the fluorescence-emission (radiative-recombination) process; otherwise, an unreasonable conclusion that any light-absorbable materials/molecules must be fluorescent materials/molecules is reached. Fluorescent semiconductors must have kinetically comparable (actually relatively slow) fluorescence-emission and nonradiative-recombination processes, because a nonradiative-recombination process that is much faster than the fluorescence-emission (radiative-recombination) process will kinetically lead to an absolutely dominant nonradiative-recombination process and thus fluorescence-inactivity. In other words, compared to fluorescence-inactive semiconductors, fluorescent semiconductors with both relatively slow fluorescence-emission (radiative-recombination) and nonradiative-recombination processes should provide better time-allowance for the occurrence of redox chemistry and electricity generation. In fact, the occurrence of redox chemistry and electricity generation can also inhibit the fluorescence-emission (radiative-recombination) and nonradiative-recombination processes of photogenerated charges due to the aforementioned kinetically parallel and competitive relationships among the three processes. Therefore, as briefly shown in Scheme 1, we can develop a logical discussion and then reach a reasonable conclusion that fluorescent semiconductor materials should be potential photocatalysis and PEC materials, which could, to the best of our knowledge, provide some new insights into the field and add a new fluorescence-based reference criterion for the screening and seeking of appropriate photoelectric materials/molecules for photocatalysis and PEC applications.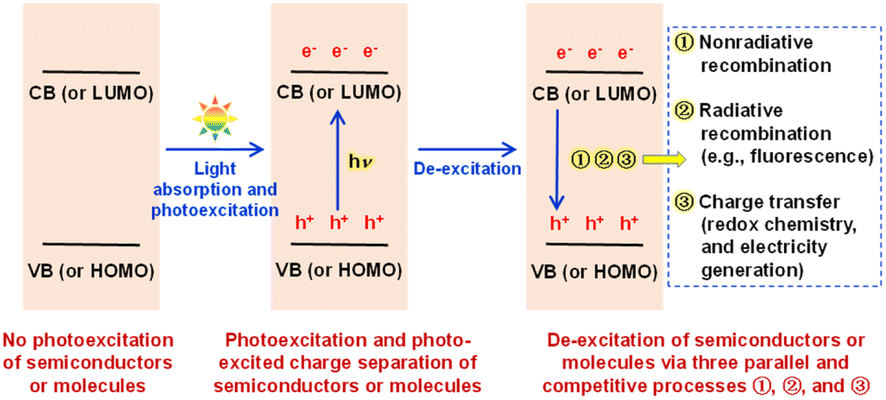 | ||
| Scheme 1 Schematic description of photoexcitation and photo-excited charge separation of semiconductors or molecules as well as physical and chemical de-excitation via three kinetically parallel and competitive processes ①, ②, and ③. In our opinion, as discussed in the text, fluorescent semiconductors/molecules must have both relatively slow fluorescence-emission (radiative-recombination) and nonradiative-recombination processes, allowing photogenerated charges to survive longer for improved charge transfer (redox chemistry, and electricity generation), and thus they should logically be potential photocatalysis and PEC materials/molecules. | ||
On the other hand, frontier molecular orbital theory has been widely used to elucidate the fluorescent emission mechanism of fluorescent molecules,12 as discussed in the ESI.† Logically, fluorescence-active molecules should also show relatively slow nonradiative-recombination (heat-release) processes to kinetically allow the occurrence of a competitive and relatively slow radiative-recombination (fluorescence-emission) process. Therefore, as also shown in Scheme 1, fluorescence-active molecules should logically be potential photocatalysis and PEC molecules, because as long as they are fluorescence-active molecules, they will have relatively slow fluorescence-emission (radiative-recombination) and nonradiative-recombination processes in terms of kinetics, allowing photogenerated charges to survive longer for better interfacial redox chemistry reactions and electricity generation. In other words, photoexcited fluorescent molecules/materials should show both radiative and nonradiative recombination, indicating more types of charge recombination than light-absorbing molecules/materials without fluorescence emission, but their nonradiative and radiative recombination should both be relatively slow, which is favorable for photocatalysis and PEC applications. However, uncovering the relationship between photocatalysis/PEC activity and fluorescence activity is still a rather new and interesting research topic, and in-depth research along these lines may lead to innovations in efficient photocatalysis/PEC materials/molecules and applications of fluorescent substances.
An enzymatic biofuel cell (EBFC) is a potential green energy device that can use redox enzymes as catalysts to obtain electricity from renewable and resource-rich biofuels.13,14 EBFC is expected to be a kind of next-generation alternative power source due to the use of renewable biocatalysts, the utilization of abundant green, safe, and high-energy-density fuels, together with the capability of working under moderate and biocompatible conditions.15 However, the energy conversion pathway from chemical energy to electrical energy in EBFC needs further innovation and optimization for improved power generation efficiency.16,17 In recent years, novel photoelectrochemical enzymatic biofuel cells (PEBFCs) combining solar cells and EBFCs have been reported,18,19 which can simultaneously realize the conversion of solar energy and chemical energy into electrical energy.20,21 Many photoelectric materials have been used as electrode materials in basic and applied research on photocatalysis and PEC, including PEBFCs, although the solar conversion efficiencies have still not been very high to date.22,23 A PEBFC usually uses PEC-active semiconductors, such as BiVO4,24 or dye-sensitized semiconductors, such as tetrakis(4-carboxyphenyl)porphyrin/TiO2,25 to fabricate a photoanode, and a PEC-inactive electrode substrate modified with biocatalysts as a biocathode, such as glassy carbon26 or carbon felt.27 Both the anode and cathode can be loaded with biocatalysts, such as enzymes or microorganisms. Obviously, the innovation and optimization of PEC-active materials are among the core scientific issues in the field, and as far as we are aware, the sole use of organic small molecules as PEC-active materials in PEBFC has not been reported to date. In addition, among various ternary cobalt-based spinel oxide electrode materials, spinel copper cobaltate (CuCo2O4) has been widely used as a promising electrode material for supercapacitors,28 catalysts,29 and Li–S batteries,30 because of its low cost, good availability and environmental compatibility.31,32 Furthermore, current research is developing enzyme-based cathodes instead of Pt-based electrodes in EBFCs.33 Bilirubin oxidase (BOD) can catalyze the four-electron reduction of oxygen to water in the presence of the redox mediator 2,2′-azinobis(3-ethylbenzothiazolin-6-sulfonic acid) diammonium salt (ABTS).34 Herein, a new BOD-loaded three-dimensional (3D) CuCo2O4/fluorine-doped tin oxide (BOD/CuCo2O4/FTO) bio-photocathode in PEBFC will be prepared for the catalyzed reduction of oxygen in an ABTS solution.
In this research, the PEC activities of some typical inorganic and organic fluorescent materials/molecules, NaYF4:Yb,Tm, CdS quantum dots (QDs), rhodamine 6G (Rh6G), polypyrrole (PPy), fluorescein (with similarly structured but fluorescence-inactive phenolphthalein as a control), neutral red (NR), and methyl violet (MV), are examined to experimentally discuss the idea that fluorescent materials/molecules could be potential PEC-active materials/molecules. Organic fluorescent small molecules as the only PEC-active material have been introduced into the PEBFC system for the first time, as shown in Scheme 2A. Due to the highest PEC activity of MV (Scheme 2B) among the examined organic fluorescent small molecules, layer-by-layer alternating electrodeposition of Au nanoparticles (AuNPs, for better utilization of the photo-excited LUMO electrons by an electron-transfer fluorescence quenching mechanism35) and adsorption of MV on a fluorine-doped tin oxide (FTO) electrode are performed to improve the PEC performance. A new PEBFC is constructed by using a (MV/AuNPs)25/FTO photoanode for oxidizing ascorbic acid (AA) as a biofuel (the subscript 25 on (MV/AuNPs) denotes 25 cycles of layer-by-layer alternating electrodeposition of AuNPs and adsorption of MV), a BOD/CuCo2O4/FTO bio-photocathode for enzymatically catalyzed four-electron reduction of oxygen in the presence of ABTS, and a Nafion ion-exchange membrane to separate the cathode and anode chambers. Under optimized conditions, the PEBFC works well under the excitation of light (300 nm to 1100 nm), with an open-circuit voltage (Voc) of ca. 0.73 V and a maximum power output density (Pmax) of 14.1 μW cm−2.
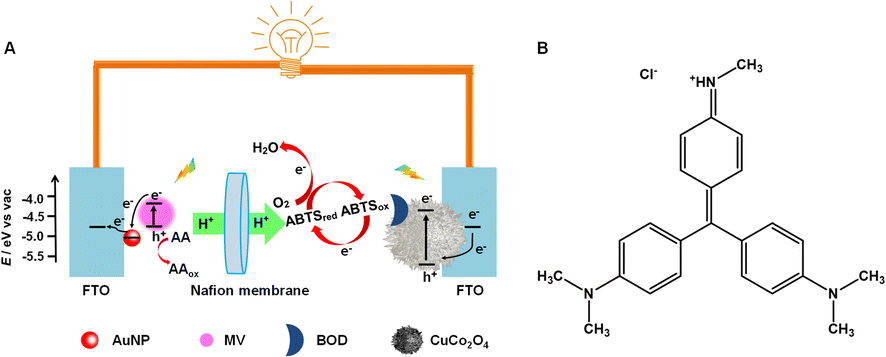 | ||
| Scheme 2 (A) Schematic drawing of the working principle of a PEBFC equipped with a (MV/AuNPs)25/FTO photoanode, a BOD/CuCo2O4/FTO bio-photocathode and a Nafion membrane. (B) The structural formula of MV, [4-[[4-(dimethylamino)phenyl]-[4-(methylamino)phenyl]methylidene]cyclohexa-2,5-dien-1-ylidene]-dimethylazanium chloride. | ||
Experimental
Preparation of the (MV/AuNPs)25/FTO photoanode
Before modifying the electrode, FTO conductive glass slices of 0.5 cm × 0.5 cm in size were ultrasonically cleaned for 10 min in acetone, ethanol and ultrapure water, consecutively, and dried in an oven. AuNPs were electrodeposited potentiostatically at −0.2 V vs. KCl-saturated calomel electrode (SCE) for 50 s on an FTO electrode in 0.1 M aqueous KCl containing 0.5 mM HAuCl4.36 The AuNPs/FTO electrode was immersed in 5 mM aqueous MV for 5 min, and MV could be connected to the electrode surface through the Au–N bond. The above process was repeated 25 times to obtain the (MV/AuNPs)25/FTO photoanode. Other fluorescent small molecules containing N or S can also be connected to the AuNPs/FTO electrode through the Au–S or Au–N bond by the above steps, and the formation of Au–S or Au–N bonds is due to the mutual attraction between metal atoms and sulfur/nitrogen atoms.37,38Preparation of the BOD/CuCo2O4/FTO bio-photocathode
The BOD/CuCo2O4/FTO bio-photocathode was prepared as follows. FTO immersed in 0.1 M aqueous CuSO4 and 0.2 M aqueous Co2(SO4)3 was potentiostatically treated at −1.5 V vs. SCE for 30 s, washed with water, and then calcined at 600 °C for 2 h to obtain the CuCo2O4/FTO electrode. The CuCo2O4/FTO electrode was immersed in ethanol to make the surface sufficiently hydrophilic, followed by washing with 10 mM 0.1 M phosphate buffer solution (PBS, pH 7.4, KH2PO4-K2HPO4) to remove excess ethanol. The BOD/CuCo2O4/FTO bio-photoelectrode was then obtained by cast-coating 20 μL of 5 mg per mL BOD aqueous solution on the CuCo2O4/FTO electrode.Design and test of the PEBFC
The PEBFC was constructed using a PEC quartz cell with dual electrolyzers, and a Nafion ion-exchange membrane was used to separate the anodic and cathodic chambers. Before the experiment, Nafion membranes were sequentially treated in 3 wt% H2O2 and 0.5 M aqueous H2SO4 at 80 °C for 1 h and washed with ultrapure water, then stored in ultrapure water for future use. 0.1 M AA was added to the anodic chamber containing 0.1 M PBS. The cathodic chamber contained 0.1 M PBS and 0.5 mM ABTS, which was saturated with O2 for 30 min. The light energy of PEBFC was provided by a 100 mW cm−2 xenon lamp (300 nm to 1100 nm), and both the photocathode and the photoanode were irradiated. The Voc values of the PEBFC were measured using a CHI660E electrochemical workstation (Shanghai Chenhua Instrument Co., Ltd). After reaching a stable Voc, the PEBFC was loaded with an external resistance varying from 100 Ω to 100 kΩ, and the polarization and power output density curves were also measured with the CHI660E electrochemical workstation. The PEBFC was operated at room temperature.Results and discussion
Examination of the PEC activities of fluorescent materials/molecules
In this research, the PEC activities of some typical inorganic (NaYF4:Yb,Tm and CdS QDs) or organic (fluorescein, Rh6G, RhB, NR, and MV as organic small molecules; PPy as an organic macromolecule) fluorescent materials/molecules were examined, and similarly structured but fluorescence-inactive phenolphthalein was selected as a control for fluorescein. The UV-vis absorption spectra, the fluorescence spectra of the selected materials/molecules, and the photocurrent responses of relevant electrodes were recorded, as shown in Fig. 1. In PEC experiments, the excellent electron-conducting AuNPs can be used as a kind of electron-transfer fluorescence quencher;39 thus AuNPs can successfully collect the photogenerated CB (or lowest unoccupied molecular orbital (LUMO)) electrons to improve the PEC performance. Meanwhile, AA can be used as an electron donor to clear photogenerated VB (or highest occupied molecular orbital (HOMO)) holes of fluorescent materials/molecules to improve the PEC performance, as reported in the literature.40–42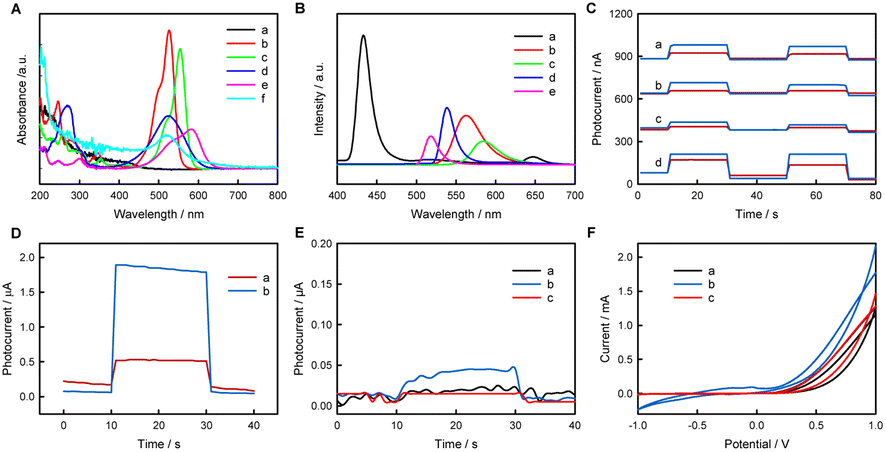 | ||
| Fig. 1 (A) UV-vis spectra of 0.1 mM CdS QDs (a), 0.05 mM Rh6G (b), 0.05 mM RhB (c), 0.05 mM NR (d), 0.05 mM MV (e) and AuNPs (f). (B) Fluorescence spectra of 0.1 mM CdS QDs (excitation at λex = 213 nm) (a), 0.05 mM Rh6G (λex = 285 nm) (b), 0.05 mM RhB (λex = 285 nm) (c), 0.05 mM NR (λex = 266 nm) (d), and 0.05 mM MV (λex = 256 nm) (e). (C) Photocurrent responses of FTO (red) and AuNPs/FTO (blue) electrodes in 0.1 M PBS (pH 7.4) containing 0.1 M AA plus 0.4 mM CdS QDs (a), 2 mM Rh6G (b), 2 mM RhB (c), or 2 mM NR (d) at 0 V vs. SCE. (D) Photocurrent responses of FTO (red) and AuNPs/FTO (blue) electrodes in 0.1 M PBS (pH 7.4) containing 2 mM MV at 0 V vs. SCE. Photocurrent responses (E) and CV curves (F) of bare FTO electrodes in 0.1 M PBS containing 0.1 M AA (a), 0.1 M AA + 2 mM fluorescein (b), or 0.1 M AA + 2 mM phenolphthalein (c). The photocurrents were measured at 0.02 V vs. SCE in 0.1 M PBS (pH 7.4) containing 0.1 M AA. Scan rate: 50 mV s−1. | ||
CdS QDs exhibit strong absorption in the range 200–460 nm, and the emission spectrum ranges from 410 nm to 580 nm and from 625 nm to 670 nm under 213 nm excitation. Rh6G exhibits strong absorption in the ranges 200–370 nm and 440–570 nm, and the emission spectrum ranges from 515 nm to 645 nm under 285 nm excitation. RhB exhibits absorption in the ranges 200–380 nm and 460–600 nm, and the emission spectrum ranges from 540 nm to 660 nm under 285 nm excitation. NR exhibits two different-intensity absorption peaks in the ranges 200–328 nm and 390–630 nm, and the emission spectrum ranges from 518 nm to 658 nm under 266 nm excitation. MV exhibits weak absorption from 200 nm to 320 nm and strong absorption from 440 nm to 650 nm, and the emission spectrum ranges from 500 nm to 552 nm under 256 nm excitation. AuNPs exhibit a wide absorption range from 200 nm to 700 nm, with an evident absorption peak at 520 nm and negligible fluorescence emission (not shown).
The photocurrent values on various electrodes follow the order MV/AuNPs/FTO (1.79 μA) > NR/AuNPs/FTO (130 nA) > CdS QDs/AuNPs/FTO (97 nA) > Rh6G/AuNPs/FTO (75 nA) > RhB/AuNPs/FTO (39 nA). The different PEC activities of different electrodes may be at least related to the overlapping degree of absorption spectra of AuNPs and emission spectra of fluorescent molecules. In addition to fluorescent small molecules, fluorescent inorganic materials and organic macromolecules also show PEC activity. The preparation and PEC-activity characterization of CdS QDs, NaYF4:Yb,Tm and PPy are shown in Fig. 1 and S1–S6.† To explore the possibility that materials without fluorescence show negligible PEC activity, the PEC investigations of fluorescein and phenolphthalein are shown in Fig. 1E. Fluorescein and phenolphthalein are similar in structure, as shown in Fig. S7,† but fluorescein shows strong fluorescence while phenolphthalein does not. Fluorescein has an obvious photocurrent in PBS containing AA at 0.02 V vs. SCE, while phenolphthalein and bare FTO show negligible photocurrent responses, indicating that only fluorescent substances may show PEC activity. It is worth noting here that electrochemical redox reactions of the materials cannot occur at 0.02 V vs. SCE, as shown in the CV curves.
Through the above experiments, inorganic (NaYF4:Yb,Tm and CdS QDs) and organic (fluorescein, Rh6G, RHB, NR, MV and PPy) fluorescent materials/molecules have been demonstrated to show PEC activity, whereas non-fluorescent phenolphthalein shows no PEC activity. Therefore, fluorescence-active molecules/materials are potential photocatalysis and PEC molecules/materials. MV, which has the highest PEC activity among the examined organic fluorescent small molecules, was selected as the photoanode material for a PEBFC.
Preparation, characterization and PEC performance of the (MV/AuNPs)25/FTO photoanode
Fig. S8† shows the CV curves of FTO electrodes in 0.1 M aqueous KCl containing HAuCl4 at different concentrations, indicating that AuNPs can be electrodeposited on FTO electrodes at a potential negative 0.4 V vs. SCE. Fig. S9† shows the potentiostatic preparation of AuNPs on the FTO electrode at −0.2 V vs. SCE for 50 s in 0.1 M aqueous KCl containing 0.5 mM HAuCl4, and a reasonable chronoamperometric (i–t) curve can be seen. The FTO-supported AuNPs were characterized by cyclic voltammetry (CV) and X-ray diffraction (XRD), as shown in Fig. S10 and S11.† The AuNPs/FTO electrode exhibits unique redox peaks of AuNPs in 0.5 M aqueous H2SO4, namely, the anodic peak at ca. 1.2 V vs. SCE due to the formation of gold oxides (AuOy), and the cathodic peak at ca. 0.88 V vs. SCE due to the reduction reaction of AuOy. In addition, the cathodic ramp of the AuNPs/FTO electrode at a negative potential of ca. −0.1 V vs. SCE is caused by the Au-catalyzed reduction of dissolved oxygen.36 As shown in Fig. S11,† the peaks at 38.2°, 44.4°, 64.6°, 77.5°, and 81.7° correspond to the (111), (200), (220), (311), and (222) crystal planes (JCPD: 04-0784) of the Au cubic phase, respectively,43 indicating that AuNPs were successfully electrodeposited on the FTO electrode.The CV technique was also performed to delve into the electrochemical behaviors of MV in 0.1 M PBS (Fig. S12†). MV shows good redox reversibility, with two reduction peaks at −0.46 V vs. SCE and −0.74 V vs. SCE, as well as an oxidation peak at 0.86 V vs. SCE, as previously reported.44 The HOMO and LUMO energy levels and the bandgap (Eg) can be estimated from eqn (1)–(3):19
| EHOMO (eV) = −e(Eox + 4.44) | (1) |
| ELUMO (eV) = −e(Ered + 4.44) | (2) |
| Eg (eV) = ELUMO − EHOMO | (3) |
The preparation of the (MV/AuNPs)25/FTO photoanode was characterized by SEM and EDX, as shown in Fig. 2. The bare FTO shows a scale-like rough surface due to the fluorine-doped SnO2 layer deposited on the glass surface, as reported previously.5 The electrodeposited AuNPs of ca. 180 nm size (after size analysis with Nano Measurer software) are evenly distributed on the electrode surface. After MV adsorption on AuNPs/FTO, the electrode morphology did not change significantly due to the very small size of the fluorescent small molecules. Gold nanoclusters can be seen on the (MV/AuNPs)25/FTO electrode, but small-sized MV cannot also be seen. However, the EDX spectra of the AuNPs/FTO, MV/AuNPs/FTO and (MV/AuNPs)25/FTO electrodes can confirm the successful step-by-step modification of AuNPs and MV (featuring the presence of N element) on the FTO electrode surface.
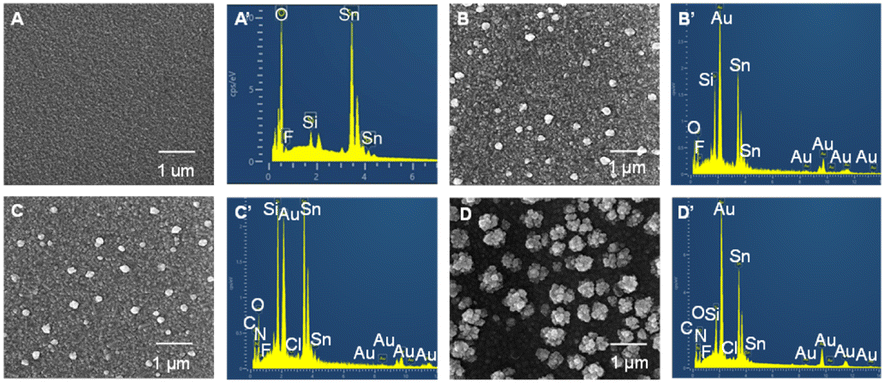 | ||
| Fig. 2 SEM and EDX images of FTO (A and A′), AuNPs/FTO (B and B′), MV/AuNPs/FTO (C and C′), and (MV/AuNPs)25/FTO (D and D′). The large white particles in the SEM images are AuNPs. | ||
We speculate that the small photocurrent measured by dissolving fluorescent materials into solution is due to the limited amount of fluorescent material that can come into contact with the electrode surface from solution, and it will be better if the fluorescent materials can be immobilized in large quantities on the electrode surface. Fig. 3A shows the photocurrent responses of (AuNPs)x/FTO, (NR/AuNPs)x/FTO, and (MV/AuNPs)x/FTO electrodes with different layers. It shows that with the increase of number of layers, the amount of fixed fluorescent materials should increase and thus the increase in photocurrent is obvious. Fig. S14† shows that the photocurrent response of layer-by-layer deposition and adsorption is much larger than that of a single deposition and adsorption cycle for a long time. The photocurrent-incident wavelength curves of (MV/AuNPs)5/FTO and (NR/AuNPs)5/FTO electrodes are roughly consistent with the UV-vis spectra of MV and NR, as shown in Fig. 1, S15 and S16.† An (MV/AuNPs)25/FTO electrode with the optimal number of layers is chosen as the photoanode of the PEBFC due to the higher photoelectric conversion efficiency of MV and the good stability of the (MV/AuNPs)25/FTO photoanode, as shown in Fig. 3B.
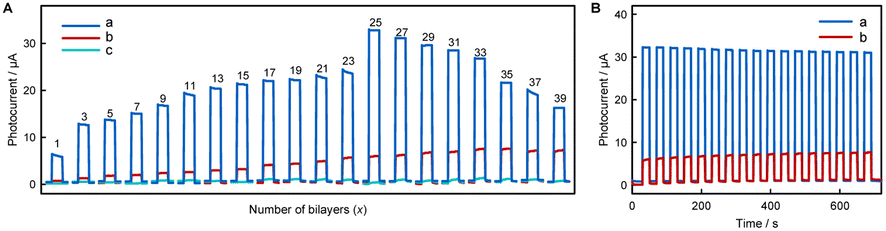 | ||
| Fig. 3 (A) Photocurrent responses of (MV/AuNPs)x/FTO (a), (NR/AuNPs)x/FTO (b), and (AuNPs)x/FTO (c) electrodes (x = 1, 3, 5…39). (B) Stability of (MV/AuNPs)25/FTO (a) and (NR/AuNPs)33/FTO (b) electrodes. The photocurrents were measured in 0.1 M PBS (pH 7.4) containing 0.1 M AA at 0 V vs. SCE. | ||
To illustrate the oxidation of AA at the photoanode, linear sweep voltammogram (LSV) and Voc tests were performed in PBS without or with 0.1 M AA. Fig. S17† shows the LSV curves of FTO, AuNPs/FTO, MV/AuNPs/FTO, and (MV/AuNPs)25/FTO electrodes in 0.1 M PBS containing 0.1 M AA under illumination. For comparison, an (MV/AuNPs)25/FTO electrode in AA-free PBS is also included. The oxidation currents of FTO, AuNPs/FTO, and MV/AuNPs/FTO electrodes with AA under illumination are significantly lower than those of the (MV/AuNPs)25/FTO photoanode with AA, as is the case with the (MV/AuNPs)25/FTO photoanode without AA. It can be observed that with the addition of AA, the open-circuit potential of the photoanode (EOCPa) drops to −0.33 V vs. Pt electrode (Fig. S18†), indicating that the (MV/AuNPs)25/FTO electrode successfully catalyzes the oxidation of AA under illumination. The Voc of the FTO and AuNPs/FTO electrodes are all close to 0 V vs. SCE, indicating that the two electrodes did not well utilize the light source.
Preparation, characterization and PEC performance of the BOD/CuCo2O4/FTO bio-photocathode
The CuCo2O4/FTO electrode was prepared by electroreduction of CuSO4 and Co2(SO4)3 aqueous solution to metal and hydroxide on the FTO electrode and calcination, followed by characterization by XRD and XPS. The XRD patterns of FTO and CuCo2O4/FTO were collected, as shown in Fig. S19.† After subtracting the XRD peaks of FTO substrate, the peaks appearing at 19.07° (111), 31.36° (220), 36.96° (311), 38.96° (222), 45.06° (400), 56.03° (422), and 59.60° (511) correspond to the characteristic peaks of CuCo2O4 (PDF#01-1155). To further clarify the surface characteristics and elemental valences of CuCo2O4, the XPS spectra of CuCo2O4 were investigated. Fig. S20† shows the survey scan spectrum of CuCo2O4 that also suggests the presence of Cu, Co, O, and Si elements on CuCo2O4/FTO. The high-resolution scans of Cu, Co, and O elements on CuCo2O4/FTO are exhibited in Fig. S21–S23,† respectively. As shown in Fig. S21,† two peaks located at 953.9 eV and 933.6 eV, accompanied by satellite peaks, are assigned to Cu 2p1/2 and Cu 2p3/2 peaks of Cu(II).46 The binding energy peaks at 794.7 eV and 779.5 eV with ca. 15 eV spin-energy separation belong to Co 2p1/2 and Co 2p3/2, respectively, indicating that the Co element in CuCo2O4 is +3 valence (Fig. S22†).47 According to Fig. S23,† the peak of –OH at 531.1 eV can prove that CuCo2O4 contains a large number of –OH on its surface. Furthermore, the peaks with binding energies of 529.2 eV and 533.1 eV belong to lattice oxygen and adsorbed H2O, respectively.48,49The fabrication of the BOD/CuCo2O4/FTO electrode was characterized by CV and electrochemical impedance spectroscopy (EIS) in 0.01 M PBS containing 2.0 mM K4Fe(CN)6 and 0.1 M Na2SO4, as shown in Fig. S24 and S25.† A pair of well-defined and rather reversible redox peaks are seen on a bare FTO electrode. The peak-to-peak separation values (ΔEP) on various electrodes follow the order 147 mV (BOD/CuCo2O4/FTO) > 103 mV (CuCo2O4/FTO) > 66 mV (FTO), while the peak currents follow the reverse order. After the CuCo2O4/FTO electrode was modified with electron-insulating BOD, the ΔEP increased and the peak current decreased due to the increased blocking of the electron transfer between the solution-state Fe(CN)63−/4− and the electrode surface, as expected. The EIS data of the electrodes were fitted to a modified Randles equivalent circuit,50,51 as shown in the inset to Fig. S25.† The charge-transfer resistance (Rct) follows the order 510 Ω (BOD/CuCo2O4/FTO) > 417 Ω (CuCo2O4/FTO) > 100 Ω (FTO), in good support of the conclusions drawn from the CV experiments.
UV-vis spectra and Mott–Schottky curves were used to characterize the bandgap and conduction–valence energy levels of CuCo2O4, as shown in Fig. S26–S28.† CuCo2O4 has strong absorption peaks in both UV and visible regions (Fig. S26†). The bandgap of CuCo2O4 is estimated to be 1.69 eV, from the plots of (αhν)2 versus photon energy (hν) (Fig. S27†) according to the equation (αhν)2 = C(hν − Eg), where α, h, ν, C and Eg are the absorption coefficient, Planck's constant (=6.63 × 10⁻³⁴ J s), incident photon frequency (s−1), a constant, and bandgap energy, respectively.36 The Mott–Schottky curve of CuCo2O4 exhibits a negative tangent direction (Fig. S28†), indicating that CuCo2O4 exhibits p-type semiconductor characteristics. The position of the flat band potential of the material can be estimated via the cross-sectional distance of the tangent, i.e., the position of the top of the valence band (EVB) for a p-type semiconductor.52 The EVB of CuCo2O4 is 1.69 V vs. SCE. Thus, the conduction band potential (ECB) of CuCo2O4 is 0 V vs. SCE, according to the equation Eg = EVB − ECB.53 The relationship between the vacuum level (Evac in eV) and ESCE at 298 K can be expressed as Evac = −ESCE − 4.68.54 The bandgap (1.69 eV), ECB (−4.68 eV vs. vac) and EVB (−6.37 eV vs. vac) of CuCo2O4 agree well with the reported results.55,56
The SEM and EDX characterizations of the BOD/CuCo2O4/FTO bio-photocathode are shown in Fig. 4. Fig. 4A shows that CuCo2O4 on the surface of the FTO electrode has nanocluster morphology. There is no obvious change in the electrode morphology after BOD modification. The EDX image confirms the presence of C, N, O, Cu, and Co elements, as shown in Fig. 4B′, indicating the successful modification of the BOD/CuCo2O4/FTO bio-photocathode. The water contact angles of the CuCo2O4/FTO photocathode before and after hydrophilic treatment were also tested, and the water contact angle on the CuCo2O4/FTO electrode surface was significantly reduced after ethanol treatment, conducive to the uniform coating of BOD on the electrode surface.
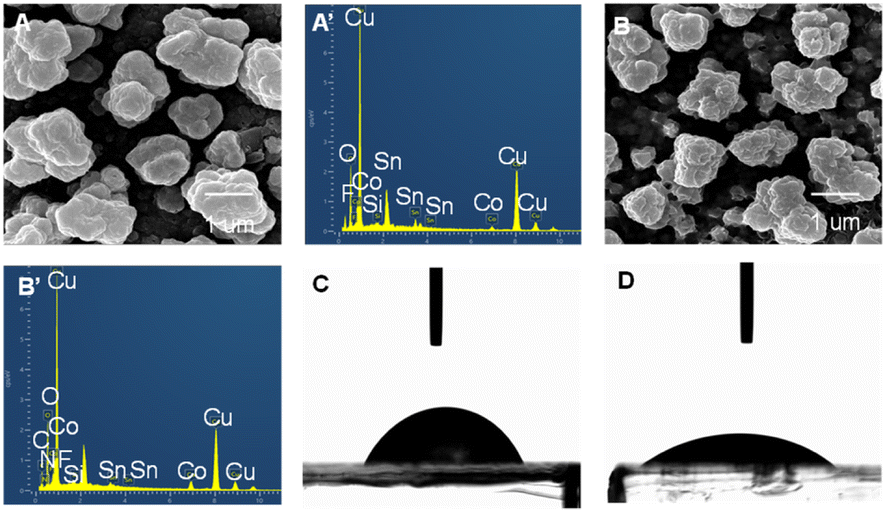 | ||
| Fig. 4 SEM and EDX images of CuCo2O4/FTO (A and A′) and BOD/CuCo2O4/FTO (B and B′). The water contact angles of CuCo2O4/FTO before (C) and after (D) hydrophilic treatment. | ||
To obtain the best photocurrent response of the CuCo2O4/FTO photocathode in oxygen-saturated PBS, the deposition potential and time for CuCo2O4 were optimized, as shown in Fig. S29 and S30.† The maximum photocurrent response can be obtained by electrodeposition at −1.5 V vs. SCE for 30 s. The CuCo2O4/FTO electrode prepared under these conditions continued to be modified step by step, and the working mechanism of the BOD/CuCo2O4/FTO bio-photocathode was explored by PEC, CV, and Voc tests. The CuCo2O4/FTO electrode exhibits a good cathodic photocurrent response in PBS containing oxygen due to the fact that oxygen can act as an electron acceptor for p-type semiconductors to accelerate carrier separation (Fig. S31†).57 After BOD was modified on the CuCo2O4/FTO photocathode, the photocurrent of the BOD/CuCo2O4/FTO bio-photocathode was significantly reduced because BOD reduces the conductivity of the electrode surface and blocks light absorption by CuCo2O4. ABTS can act as a redox mediator for BOD, and the combination of the two helps to promote the reduction of O2 on the BOD/CuCo2O4/FTO bio-photocathode;58 thus the photocurrent increases to −138 μA cm−2.
Fig. 5A shows the CV curves of the BOD/CuCo2O4/FTO bio-photocathode in argon and oxygen-saturated PBS containing 0.5 mM ABTS. The reduction currents of BOD/CuCo2O4/FTO electrodes in Ar-saturated PBS containing 0.5 mM ABTS and in O2-saturated 0.1 M PBS are significantly lower than that in O2-saturated 0.1 M PBS containing 0.5 mM ABTS. This observation is due to the fact that BOD is usually arranged directly on carbon materials59 or an electrode60 for direct electron transfer (DET), whereas BOD on the CuCo2O4/FTO electrode surface cannot effectively catalyze the reduction of O2 to achieve DET. After adding ABTS to O2-saturated 0.1 M PBS, the BOD/CuCo2O4/FTO electrode exhibits a steeper cathodic catalytic wave with an onset potential of 0.54 V vs. SCE, compatible with single-proton single-electron DET during oxygen reduction by BOD, indicating that ABTS can facilitate electron transfer between BOD active sites and electrode surfaces in the presence of O2.61 The half-wave potential of 0.38 V vs. SCE is slightly lower than the redox potential of the T1 copper active site of multicopper oxidase (E1/2(T1) = 0.48 V vs. SCE at pH 7.0)19 and the thermodynamic O2 reduction potential (0.572 V vs. SCE at pH 7.0),62 which may be due to the poor conductivity of CuCo2O4.
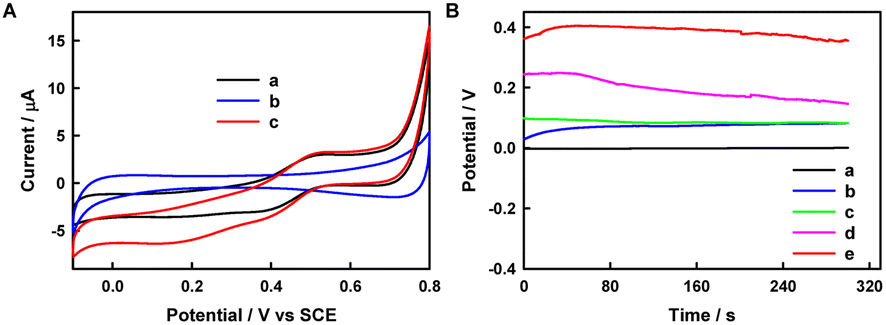 | ||
| Fig. 5 (A) CV curves of the BOD/CuCo2O4/FTO electrode in Ar-saturated PBS (pH 7.4) containing 0.5 mM ABTS (a), O2-saturated 0.1 M PBS (b), or O2-saturated 0.1 M PBS containing 0.5 mM ABTS (c). Scan rate: 10 mV s−1. (B) Voc curves of the BOD/CuCo2O4/FTO electrode in O2-saturated 0.1 M PBS containing 0.5 mM ABTS under dark conditions (a), Ar-saturated 0.1 M PBS (b), O2-saturated 0.1 M PBS (c), Ar-saturated 0.1 M PBS containing 0.5 mM ABTS (d), or O2-saturated 0.1 M PBS containing 0.5 mM ABTS (e) under illumination. | ||
The Voc of the biofuel cell can be boosted by using a biocathode with a large reduction potential.63 To illustrate the reduction of O2 at the biocathode, Voc tests were performed in PBS without or with O2, as shown in Fig. 5B. It can be observed that with the addition of O2 in PBS containing 0.5 mM ABTS, the open-circuit potential of the BOD/CuCo2O4/FTO photocathode (EOCPc) increases to 0.40 V vs. Pt electrode, indicating that the BOD/CuCo2O4/FTO electrode successfully catalyzes the reduction of O2 under illumination. The EOCPc values of the BOD/CuCo2O4/FTO electrode in various electrolytes and under different conditions follow the order 0.40 V (O2-saturated 0.1 M PBS containing 0.5 mM ABTS under illumination) > 0.25 V (Ar-saturated 0.1 M PBS containing 0.5 mM ABTS under illumination) > 0.096 V (O2-saturated 0.1 M PBS under illumination) > 0.063 V (Ar-saturated 0.1 M PBS under illumination) > 0 V (O2-saturated 0.1 M PBS containing 0.5 mM ABTS under dark conditions).
Performance of the PEBFC
The polarization and power output curves of the PEBFC with and without a light source are shown in Fig. 6. It can be seen that with an increase in the number of (MV/AuNPs)x layers, Voc increases first and then remains basically flat. A (MV/AuNPs)25/FTO photoanode of optimal layer-by-layer assembly and a BOD/CuCo2O4/FTO bio-photocathode were used to construct the PEBFC, in which the anode chamber contains 0.1 M PBS containing 0.1 M AA and the cathode chamber contains O2-saturated 0.1 M PBS. Under illumination, the as-prepared PEBFC can produce a Voc value of 0.73 V and a Pmax value of 14.1 μW cm−2; in the dark, the Voc of this PEBFC is only 0.52 V, and the Pmax is as low as 4.78 μW cm−2. This demonstrates the successful conversion of light and chemical energy into electricity using this PEBFC. The PEBFC outperforms many comparable reported EBFCs and dye-sensitization based PEBFCs (Table S1†), and its specific electron flow is shown in Scheme 2. In addition, an enzyme loaded on the photocathode may be more stable than an enzyme loaded on the photoanode, because photogenerated electrons transferred from the photoanode to the photocathode can consume a portion of the photogenerated holes that can oxidize the enzyme.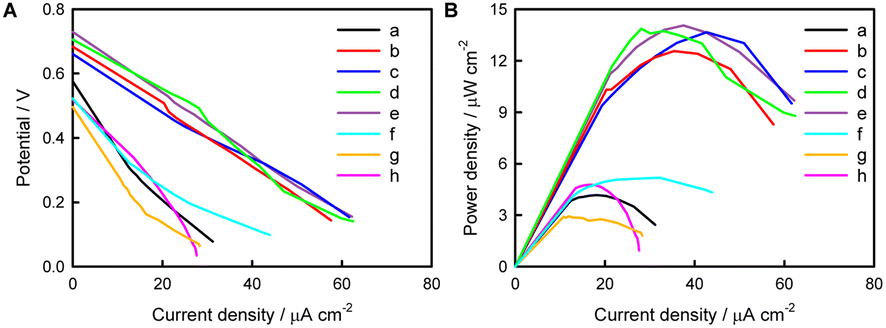 | ||
| Fig. 6 Polarization curves (A) and power output curves (B) of the PEBFC with (MV/AuNPs)5/FTO (a), (MV/AuNPs)10/FTO (b), (MV/AuNPs)15/FTO (c), (MV/AuNPs)20/FTO (d), or (MV/AuNPs)25/FTO (e) photoanode in 0.1 M PBS containing 0.1 M AA, and a CuCo2O4/FTO photocathode in O2-saturated 0.1 M PBS containing 0.5 mM ABTS (f), BOD/CuCo2O4/FTO photocathode in O2-saturated 0.1 M PBS (pH 7.4) under illumination (g) and BOD/CuCo2O4/FTO photocathode in O2-saturated 0.1 M PBS (pH 7.4) containing 0.5 mM ABTS under dark conditions (h). | ||
During operation of the PEBFC, the output voltage (Ecell) of the PEBFC can be expressed by the overpotentials associated with different fundamental phenomena, as shown the equation: Ecell = EOCPc − EOCPa − irohm = EOCVcell − irohm, where EOCVcell is the open-circuit voltage of the PEBFC.64 Under dark conditions, the internal resistance (rohm) of the PEBFC is calculated to be 73.6 kΩ based on the fitted linear region of the polarization curve in Fig. 6B (Ecell = −7.36 × 10⁴i + 0.537, R2 = 0.972). Under illumination, the rohm is calculated to be 37.2 kΩ (Ecell = −3.72 × 10⁴i + 0.725, R2 = 0.999). This phenomenon suggests that the excited (MV/AuNPs)25/FTO photoanode and BOD/CuCo2O4/FTO bio-photocathode can decrease the internal resistance of the PEBFC.
The PEBFC performance can also be determined by the light energy conversion efficiency (η) and fill factor (FF) values, which can be estimated as follows,19 η = (Jsc × Voc × FF)/Pin, FF = (Jm × Vm)/(Jsc × Voc), where Jsc is the short-circuit current density, Pin is the light intensity (=100 mW cm−2), and Jm and Vm are the maximum current and potential values, respectively. Thus, FF is calculated to be 0.25, and η is estimated as 0.014%. These results show that a new AA-O2 PEBFC based on simple organic small molecules (no need for conventional semiconductors) has been successfully developed using the (MV/AuNPs)25/FTO photoanode and the BOD/CuCo2O4/FTO bio-photocathode.
Conclusions
In conclusion, the PEC activities of a series of fluorescent materials/molecules were studied, and it can be concluded theoretically and experimentally that fluorescent materials/molecules are potential PEC materials. Accordingly, a novel PEBFC based on fluorescent small molecules was designed, equipped with a (MV/AuNPs)25/FTO photoanode and a BOD/CuCo2O4/FTO bio-photocathode, achieving a relatively high Voc (0.73 V) and power density (14.1 μW cm−2), and it exhibited an efficiency similar to dye-sensitized PEBFCs under illumination, even without semiconductors. It not only overcomes the problem that fluorescent small molecules cannot be fixed in large quantities to improve power generation, but also realizes the electron transfer of BOD on semiconductors by adding the redox mediator ABTS. This research may have started a new topic of fluorescent small-molecule-based PECs without conventional semiconductors. In particular, the fluorescence-based reference criterion that fluorescent materials/molecules are potential PEC/photocatalysis materials has been suggested, which may be of some general interest in screening/finding new photoelectric materials/molecules from the huge library of fluorescent substances and expanding the applications of fluorescent substances. Further investigation on the quantitative relationship between photocatalysis/PEC activity and fluorescence activity is underway in this laboratory.Data availability
The data supporting this article have been included as part of the ESI.†Author contributions
Chenglong Sun: conceptualization, writing – original draft. Xingyu Zeng: investigation. Mingjian Chen: investigation. Yun Du: investigation. Yueyi Peng: conceptualization, funding acquisition. Qingji Xie: conceptualization, funding acquisition, writing – review & editing.Conflicts of interest
There are no conflicts to declare.Acknowledgements
This work was supported by the National Natural Science Foundation of China (22074039, 22474035, 21675050, 22002042) and Project funded by China Postdoctoral Science Foundation (2024M760123).Notes and references
- J. Guan, Z. Duan, F. Zhang, S. D. Kelly, R. Si, M. Dupuis, Q. Huang, J. Q. Chen, C. Tang and C. Li, Nat. Catal., 2018, 1, 870–877 CrossRef CAS.
- Y. Ma, X. Wang, Y. Jia, X. Chen, H. Han and C. Li, Chem. Rev., 2014, 114, 9987–10043 CrossRef CAS PubMed.
- M. G. Sendeku, T. A. Shifa, F. T. Dajan, K. B. Ibrahim, B. Wu, Y. Yang, E. Moretti, A. Vomiero and F. Wang, Adv. Mater., 2024, 36, 2308101 CrossRef CAS PubMed.
- D. Du, Z. Zhu, K. Y. Chan, F. Li and J. Chen, Chem. Soc. Rev., 2022, 51, 1846–1860 RSC.
- C. Sun, J. Liu, L. Li, J. Cheng, Y. Peng and Q. Xie, Chem. Eng. J., 2023, 464, 142447 CrossRef CAS.
- X. Chen, S. Shen, L. Guo and S. S. Mao, Chem. Rev., 2010, 110, 6503–6570 CrossRef CAS PubMed.
- P. Zhou, M. Luo and S. Guo, Nat. Rev. Chem, 2022, 6, 823–838 CrossRef CAS PubMed.
- J. Cheng, C. Chen, X. Zeng, M. Chen, Y. Shen, Y. Peng and Q. Xie, J. Electroanal. Chem., 2024, 968, 118506 CrossRef CAS.
- F. Nazir, A. Razza, S. Sabahat, T. Sajjad, A. Rahim and Z. U. H. Khan, Mater. Chem. Phys., 2024, 323, 129668 CrossRef CAS.
- X. G. Yang, J. H. Qin, Y. D. Huang, Z. M. Zhai, L. F. Ma and D. Yan, J. Mater. Chem. C, 2020, 8, 17169–17175 RSC.
- M. C. M. Yau, M. Hayes and S. Kalathil, RSC Adv., 2022, 12, 16396–16411 RSC.
- L. Wu, M. Holzapfel, A. Schmiedel, F. Peng, M. Moos, P. Mentzel, J. Shi, T. Neubert, R. Bertermann, M. Finze, M. A. Fox, C. Lambert and L. Ji, Nat. Commun., 2024, 15, 3005 CrossRef CAS PubMed.
- D. Ohayon, G. Nikiforidis, A. Savva, A. Giugni, S. Wustoni, T. Palanisamy, X. Chen, I. P. Maria, E. Di Fabrizio, P. M. F. J. Costa, I. McCulloch and S. Inal, Nat. Mater., 2020, 19, 456–463 CrossRef CAS PubMed.
- X. Xiao, K. D. McGourty and E. Magner, J. Am. Chem. Soc., 2020, 142, 11602–11609 CrossRef CAS PubMed.
- X. Xiao, H. Q. Xia, R. Wu, L. Bai, L. Yan, E. Magner, S. Cosnier, E. Lojou, Z. Zhu and A. Liu, Chem. Rev., 2019, 119, 9509–9558 CrossRef CAS PubMed.
- L. L. Zhang, L. Bai, M. Xu, L. Han and S. J. Dong, Nano Energy, 2015, 11, 48–55 CrossRef CAS.
- C. E. Zhao, P. Gai, R. Song, Y. Chen, J. Zhang and J. J. Zhu, Chem. Soc. Rev., 2017, 46, 1545–1564 RSC.
- S. J. Lu, S. B. Ji, J. C. L. H. Li, H. Li and W. S. Li, J. Power Sources, 2015, 273, 142–148 CrossRef CAS.
- B. Cakiroglu, J. Chauvin, A. Le Goff, K. Gorgy, M. Ozacar and M. Holzinger, Biosens. Bioelectron., 2020, 169, 112601 CrossRef CAS PubMed.
- K. Q. Wang, J. Yang, L. G. Feng, Y. W. Zhang, L. Liang, W. Xing and C. P. Liu, Biosens. Bioelectron., 2012, 32, 177–182 CrossRef CAS PubMed.
- B. Çakıroğlu, N. Jabiyeva and M. Holzinger, Biosens. Bioelectron., 2023, 226, 115133 CrossRef PubMed.
- N. Ibrahim, S. K. Kamarudin and L. J. Minggu, J. Power Sources, 2014, 259, 33–42 CrossRef CAS.
- A. Ruff, F. Conzuelo and W. Schuhmann, Nat. Catal., 2020, 3, 214–224 CrossRef CAS.
- Z. Wang, Y. Guo, M. Liu, X. Liu, H. Zhang, W. Jiang, P. Wang, Z. Zheng, Y. Liu, H. Cheng, Y. Dai, Z. Wang and B. Huang, Adv. Mater., 2022, 34, 2201594 CrossRef CAS PubMed.
- K. Wang, J. Yang, L. Feng, Y. Zhang, L. Liang, W. Xing and C. Liu, Biosens. Bioelectron., 2012, 32, 177–182 CrossRef CAS PubMed.
- L. Han, L. Bai, C. Z. Zhu, Y. Z. Wang and S. J. Dong, Chem. Commun., 2012, 48, 6103–6105 RSC.
- M. Hambourger, M. Gervaldo, D. Svedruzic, P. W. King, D. Gust, M. Ghirardi, A. L. Moore and T. A. Moore, J. Am. Chem. Soc., 2008, 130, 2015–2022 CrossRef CAS PubMed.
- F. Xing, Z. Bi, F. Su, F. Liu and Z. S. Wu, Adv. Energy Mater., 2022, 12, 2200594 CrossRef CAS.
- X. Han, H. Sheng, C. Yu, T. W. Walker, G. W. Huber, J. Qiu and S. Jin, ACS Catal., 2020, 10, 6741–6752 CrossRef CAS.
- X. Zhu, T. Bian, X. Song, M. Zheng, Z. Shen, Z. Liu, Z. Guo, J. He, Z. Zeng, F. Bai, L. Wen, S. Zhang, J. Lu and Y. Zhao, Angew. Chem., Int. Ed., 2024, 63, e202315087 CrossRef CAS PubMed.
- A. Shanmugavani and R. K. Selvan, Electrochim. Acta, 2016, 188, 852–862 CrossRef CAS.
- M. Sun, Q. Fang, Z. Li, C. Cai, H. Li, B. Cao, W. Shen, T. X. Liu and Y. Fu, Electrochim. Acta, 2021, 397, 139306 CrossRef CAS.
- M. Yuan, S. Abdellaoui, H. Chen, M. J. Kummer, C. A. Malapit, C. You and S. D. Minteer, Angew. Chem., Int. Ed., 2020, 59, 8969–8973 CrossRef CAS PubMed.
- X. Wang, M. Falk, R. Ortiz, H. Matsumura, J. Bobacka, R. Ludwig, M. Bergelin, L. Gorton and S. Shleev, Biosens. Bioelectron., 2012, 31, 219–225 CrossRef CAS PubMed.
- G. K. Darbha, A. Ray and P. C. Ray, ACS Nano, 2007, 1, 208–214 CrossRef CAS PubMed.
- C. Sun, L. Liu, C. Guo, Y. Shen, Y. Peng and Q. Xie, Sens. Actuators, B, 2022, 362, 131795 CrossRef CAS.
- M. J. MacLeod, A. J. Goodman, H. Z. Ye, H. V. T. Nguyen, T. Van Voorhis and J. A. Johnson, Nat. Chem., 2019, 11, 57–63 CrossRef CAS PubMed.
- Y. Zang, A. Pinkard, Z. F. Liu, J. B. Neaton, M. L. Steigerwald, X. Roy and L. Venkataraman, J. Am. Chem. Soc., 2017, 139, 14845–14848 CrossRef CAS PubMed.
- Z. Jin, W. Sheng, L. Ren, D. Bai, M. Sun, S. Wang, T. Ya, X. Tang and Z. Wang, Chem. Eng. J., 2024, 480, 148247 CrossRef CAS.
- S. Chen, Y. Zhu, Q. Xu, Q. Jiang, D. Chen, T. Chen, X. Xu, Z. Jin and Q. He, Nat. Commun., 2022, 13, 5684 CrossRef CAS PubMed.
- D. Chen, X. Wang, K. Zhang, Y. Cao, J. Tu, D. Xiao and Q. Wu, Biosens. Bioelectron., 2020, 166, 112466 CrossRef CAS PubMed.
- H. Guo, X. Wang, S. Wang, H. Ma and J. Liu, RSC Adv., 2024, 14, 4556–4567 RSC.
- W. Zhang, T. Wang, X. Xing, H. Yin, J. Li, W. Xiong and H. Li, ACS Sustain. Chem. Eng., 2024, 12, 10313–10324 CrossRef CAS.
- C. DeBruler, B. Hu, J. Moss, X. Liu, J. Luo, Y. Sun and T. L. Liu, Chem, 2017, 3, 961–978 CAS.
- X. G. Yang, Y. J. Chen, P. P. Yin, Y. Li, S. Y. Yang, Y. M. Li and L. F. Ma, Chem. Sci., 2024, 15, 14202–14208 RSC.
- S. Lu, G. L. Wang, S. Chen, H. T. Yu, F. Ye and X. Quan, J. Hazard. Mater., 2018, 353, 401–409 CrossRef CAS PubMed.
- Z. Gao, H. Yang, Y. Cao, Q. Wu, L. Kang, J. Mao and J. Wu, Nanotechnology, 2019, 30, 255704 CrossRef CAS PubMed.
- J. Deng, S. F. Feng, K. J. Zhang, J. Li, H. Y. Wang, T. Q. Zhang and X. Y. Ma, Chem. Eng. J., 2017, 308, 505–515 CrossRef CAS.
- C. Q. Li, Z. M. Sun, A. K. Song, X. B. Dong, S. L. Zheng and D. D. Dionysiou, Appl. Catal., B, 2018, 236, 76–87 CrossRef CAS.
- C. Sun, Z. Shao, Y. Hu, Y. Peng and Q. Xie, ACS Appl. Mater. Interfaces, 2023, 15, 23085–23092 CrossRef CAS PubMed.
- X. G. Yang, J. R. Zhang, X. K. Tian, J. H. Qin, X. Y. Zhang and L. F. Ma, Angew. Chem., Int. Ed., 2023, 62, e202216699 CrossRef CAS PubMed.
- J. S. Zhang, X. F. Chen, K. Takanabe, K. Maeda, K. Domen, J. D. Epping, X. Z. Fu, M. Antonietti and X. C. Wang, Angew. Chem., Int. Ed., 2010, 49, 441–444 CrossRef CAS PubMed.
- Z. L. Qiu and D. P. Tang, J. Mater. Chem. B, 2020, 8, 2541–2561 RSC.
- G. Z. Fan, T. Fang, X. Wang, Y. D. Zhu, H. W. Fu, J. Y. Feng, Z. S. Li and Z. G. Zou, Iscience, 2019, 13, 432–439 CrossRef CAS PubMed.
- Q. Wang and L. Zhang, J. Mater. Chem. A, 2020, 8, 9077–9084 RSC.
- Q. Wang, M. C. Jiang and L. Zhang, Electrochim. Acta, 2021, 397, 139239 CrossRef CAS.
- J. H. Feng, L. Dai, X. Ren, H. M. Ma, X. Y. Wang, D. W. Fan, Q. Wei and R. D. Wu, Anal. Chem., 2021, 93, 7125–7132 CrossRef CAS PubMed.
- S. Tsujimura and K. Murata, Electrochim. Acta, 2015, 180, 555–559 CrossRef CAS.
- G. C. Sedenho, A. Hassan, L. J. A. Macedo and F. N. Crespilho, J. Power Sources, 2021, 482, 229035 CrossRef CAS.
- F. A. Al-Lolage, P. N. Bartlett, S. Gounel, P. Staigre and N. Mano, ACS Catal., 2019, 9, 2068–2078 CrossRef CAS.
- A. Niiyama, K. Murata, Y. Shigemori, A. Zebda and S. Tsujimura, J. Power Sources, 2019, 427, 49–55 CrossRef CAS.
- A. J. Gross, X. H. Chen, F. Giroud, C. Abreu, A. Le Goff, M. Holzinger and S. Cosnier, ACS Catal., 2017, 7, 4408–4416 CrossRef CAS.
- J. Yang, D. Hu, X. Zhang, K. Wang, B. Wang, B. Sun and Z. Qiu, J. Power Sources, 2014, 267, 617–621 CrossRef CAS.
- X. Z. Huang, L. Ren, C. Y. Jiang, X. X. Han, X. S. Yin, Y. Liu, W. Z. Yang and Y. Chen, Chem. Eng. J., 2022, 431, 134037 CrossRef CAS.
Footnote |
| † Electronic supplementary information (ESI) available: Materials and apparatus and additional information/figures. See DOI: https://doi.org/10.1039/d4ra08117j |
| This journal is © The Royal Society of Chemistry 2025 |