DOI:
10.1039/D4RA08085H
(Paper)
RSC Adv., 2025,
15, 832-843
A photocatalytic superhydrophobic coating with p–n type BiOBr/α-Fe2O3 heterojunctions applied in NO degradation†
Received
14th November 2024
, Accepted 30th December 2024
First published on 10th January 2025
Abstract
Coal combustion generates soot-type air pollution, and NO, as a typical pollutant, is the main haze-causing pollutant. The degradation of NO by means of photocatalytic superhydrophobic multifunctional coatings is both durable and economical. The precipitation method was employed to create a p–n type BiOBr/α-Fe2O3 photocatalytic binary system. BiOBr/α-Fe2O3 nanoparticles were combined with polydimethylsiloxane (PDMS) in a butyl acetate solution to produce a BiOBr/α-Fe2O3/PDMS/butyl acetate emulsion, and photocatalytic superhydrophobic coatings were then prepared using a one-step cold-spraying method. Photocatalytic oxidation experiments were conducted using a low concentration of NO as the targeted degradant. The results indicate that BiOBr/α-Fe2O3 photocatalytic heterojunctions were successfully prepared with NO removal up to 65%, indicating that the formation of p–n type heterojunctions enhances the light absorption range and improves the separation of photogenerated charge carriers. Furthermore, when the mass ratio of photocatalytic material to PDMS is 30![[thin space (1/6-em)]](https://www.rsc.org/images/entities/char_2009.gif) :1, the photocatalytic superhydrophobic coating exhibits optimal performance, attaining a contact angle of 159.55° and NO degradation rate of 70.9%. The study also found that the photocatalytic superhydrophobic coating remained stable after undergoing cyclic degradation, acid and alkali resistance tests, and self-cleaning tests. The mechanism of photocatalytic superhydrophobic coatings was further explored, which provided new insights and a theoretical foundation for the development of self-cleaning urban environments.
:1, the photocatalytic superhydrophobic coating exhibits optimal performance, attaining a contact angle of 159.55° and NO degradation rate of 70.9%. The study also found that the photocatalytic superhydrophobic coating remained stable after undergoing cyclic degradation, acid and alkali resistance tests, and self-cleaning tests. The mechanism of photocatalytic superhydrophobic coatings was further explored, which provided new insights and a theoretical foundation for the development of self-cleaning urban environments.
1 Introduction
Industrial coal combustion, biomass, and automobile exhausts emit a large amount of NOx (95% NO),1,2 which leads to the formation of secondary organic aerosols, triggering haze, acid rain, and photochemical smog, while exacerbating ozone levels and other secondary pollutants, and posing a serious threat to both the environment and human health.3 Photocatalytic oxidation is currently the most environmentally friendly, economical, and efficient technology for purifying low concentrations of NOx in the air.4,5 Which can convert NOx into non-toxic nitrate with low energy consumption, no need for reductants and fuel gas, and high economic benefits and treatment efficiency.6,7
The degradation of NO via TiO2 was first reported by Pichat and Courbon in 1982 and 1984.8,9 Although photocatalytic technology demonstrates potential for degrading NO, it still faces some challenges. Most photocatalytic materials are only responsive to UV light, have low utilisation of sunlight.10,11 Have low degradation efficiency for outdoor air pollutants, have short lifetimes, are difficult to regenerate, are difficult to recycle, require multiple coatings, and can be costly.12,13 Therefore, the development of efficient and stable visible light catalysts and the search for multifunctional materials with long-lasting performance, is both urgent and necessary.
In recent years, photocatalytic materials based on bismuth (Bi) have emerged as promising candidates for visible light response,14 including BiOBr, Bi2O3, BiVO4, Bi2O2CO3, etc., especially BiOBr, as a p-type semiconductor, has been favoured by researchers due to its nanosheet structure and high optical stability,15 nevertheless, upgrading the photocatalytic activity of BiOBr to meet practical applications remains a challenge. The construction of a heterojunction is an effective strategy to improve the photocatalytic activity of BiOBr. This further promotes the efficient transfer of photogenerated electron–hole pairs while preserving the strong oxidation capability of the pristine material. α-Fe2O3 is a narrow bandgap n-type semiconductor with sufficient stability and absorption in the visible spectrum. It is dericed from abundant and environmentally friendly raw materials and prossesses excellent conductivity, enabling high discharge and charging flow rates. Additionally, it features a high conduction band position and improves carrier separation and transport, indicating a strong reduction capability.16,17 Thus, a p–n heterojunction was established between BiOBr and α-Fe2O3 to improve the migration rate of photogenerated carriers within the composites and to enhance their photocatalytic activity.18
Technological advances have driven the development of multifunctional coatings, particularly photocatalytic superhydrophobic coatings, which offer lasting, economical and environmentally friendly advantages in degrading outdoor air pollutants.19,20 These coatings employ micro- and nano-structures and low surface energy to cause liquids to bead up into spheres, which are constructed with micro- and nano-particles of photocatalysts to form a structure that improves hydrophobicity and photocatalytic degradation of pollutants, and ultimately enabling self-cleaning through the ‘Lotus effect’.21–23 Liu et al.24 developed photocatalytic superdouble sparse coatings (FTS coatings) that respond to visible light by creating a surface roughness structure composed of WO3–TiO2 nanorods/SiO2, while also providing low surface energy with fluorosilane. The coating exhibited good photocatalytic activity for NO degradation, with a degradation efficiency of 47.8%. The coating's robustness was demonstrated through UV aging, rinsing, and immersion in acid, salt, and alkali solutions. However, the coating contains fluorine-containing substances that can cause secondary pollution during use. Liu et al.25 developed a superhydrophobic photocatalytic coating utilizing WO3/TiO2 photocatalytic particles and polydimethyl siloxane (PDMS) without the incorporation of fluorine. The contact angle of the coating reached 166.32°, and the WCA remained above 145° after 30 wear tests. The degradation efficiency of NO was up to 61.41% under visible light. Furthermore, the WO3/TiO2/PDMS coating exhibited a synergistic effect of self-cleaning and photocatalysis for NO degradation with good stability. During the preparation process, the coating was combined with WO3 and TiO2 to enhance the material's photoresponsive range. Additionally, it was modified with PDMS to reduce surface energy, making it more practical and environmentally friendly for applications.
Here, based on the above analysis, the p–n type BiOBr/α-Fe2O3 heterojunction photocatalytic superhydrophobic fluorine-free coatings were prepared by a one-step cold spraying method in this study, and the physicochemical properties of the photocatalytic materials as well as the mechanism of the formation of the heterostructures were investigated in depth. In addition, the stability, acid and alkali resistance, and self-cleaning properties of the photocatalytic superhydrophobic coatings were evaluated in this study, and their mechanisms of action was further explored.
2 Materials and methods
2.1 Preparation of BiOBr/α-Fe2O3 hydrophobic coating
Solution A was prepared by dispersing 6 mmol of Bi(NO3)3·5H2O in 44 mL of ethylene glycol solvent. Solution B was prepared by weighing an appropriate amount of α-Fe2O3 and stirring it with Solution A. Solution C was obtained by stirring 6 mmol of NaBr powder in 44 mL of deionised water. Solution C was then added to Solution B and stirred for 3 hours at room temperature. The BiOBr/α-Fe2O3 photocatalytic composites were obtained by filtering the mixed solution, washing it with anhydrous ethanol and deionised water, and drying it in an oven at 60 °C for 10 hours26 (the optimum ratio of BiOBr to α-Fe2O3 was obtained from the pre-experiments as 15:1).
A photocatalytic hydrophobic coating was produced using the cold spray method. To prepare the coating, 100 mg of PDMS and 10 mg of hardener were dissolved in 30 mL of butyl acetate and stirred for 15 minutes until complete dissolution was achieved. Subsequently, 1.5 g, 2 g, 2.5 g, 3 g, and 4 g of photocatalytic material were added to the solution in mass ratios of 15:1, 20:1, 25:1, 30:1, and 40:1, respectively. The mixture was stirred for 30 minutes. 3–4 mL of the well-mixed solution was sprayed uniformly on a clean metal plate using a spray gun. The plate was then cured in an oven at 80 °C for 1 hour to prepare the photocatalytic hydrophobic coating by cold spraying.
2.2 Characterization
The samples were analysed using a scanning electron microscope (SEM-EDS, JSM-IT500HR, Hitachi) at 10 kV to determine their microscopic morphology and elemental distribution characteristics. X-ray diffraction (XRD, Rigaku-Smartlab) was used to characterise and analyse the physical structure of the photocatalytic materials. The test conditions were as follows: Cu target rays were used at a wavelength of 0.15418 nm, with a test voltage of 50 kV and a current of 40 mA. The wide-angle scanning range was set to 2θ = 10°–80°. Surface characteristic groups of the photocatalytic materials were analysed using Fourier transform infrared spectroscopy (FT-IR, Bruker NVENIO-S) before and after the reaction. The samples were vacuum-dried and treated at 60 °C for 6 hours prior to testing. FT-IR testing was conducted in the wavelength range of 400–4000 cm−1. The BET ASAP 2460 type N2 physical adsorption and desorption apparatus tested the adsorption–desorption curves of the samples, pore size distributions, and compared the specific surface areas of the materials. X-ray photoelectron spectroscopy (XPS) was used to characterise the chemical state of various photocatalysts, with Al kα-rays (hν = 1486.6 eV) as the excitation source. Charge correction was performed using the C 1s (284.4 eV) binding energy as an energy standard. The absorbance and light absorption range of the samples were determined using an Agilent-Cary 4000 UV-vis spectrophotometer.
2.3 Photodegradation experiment
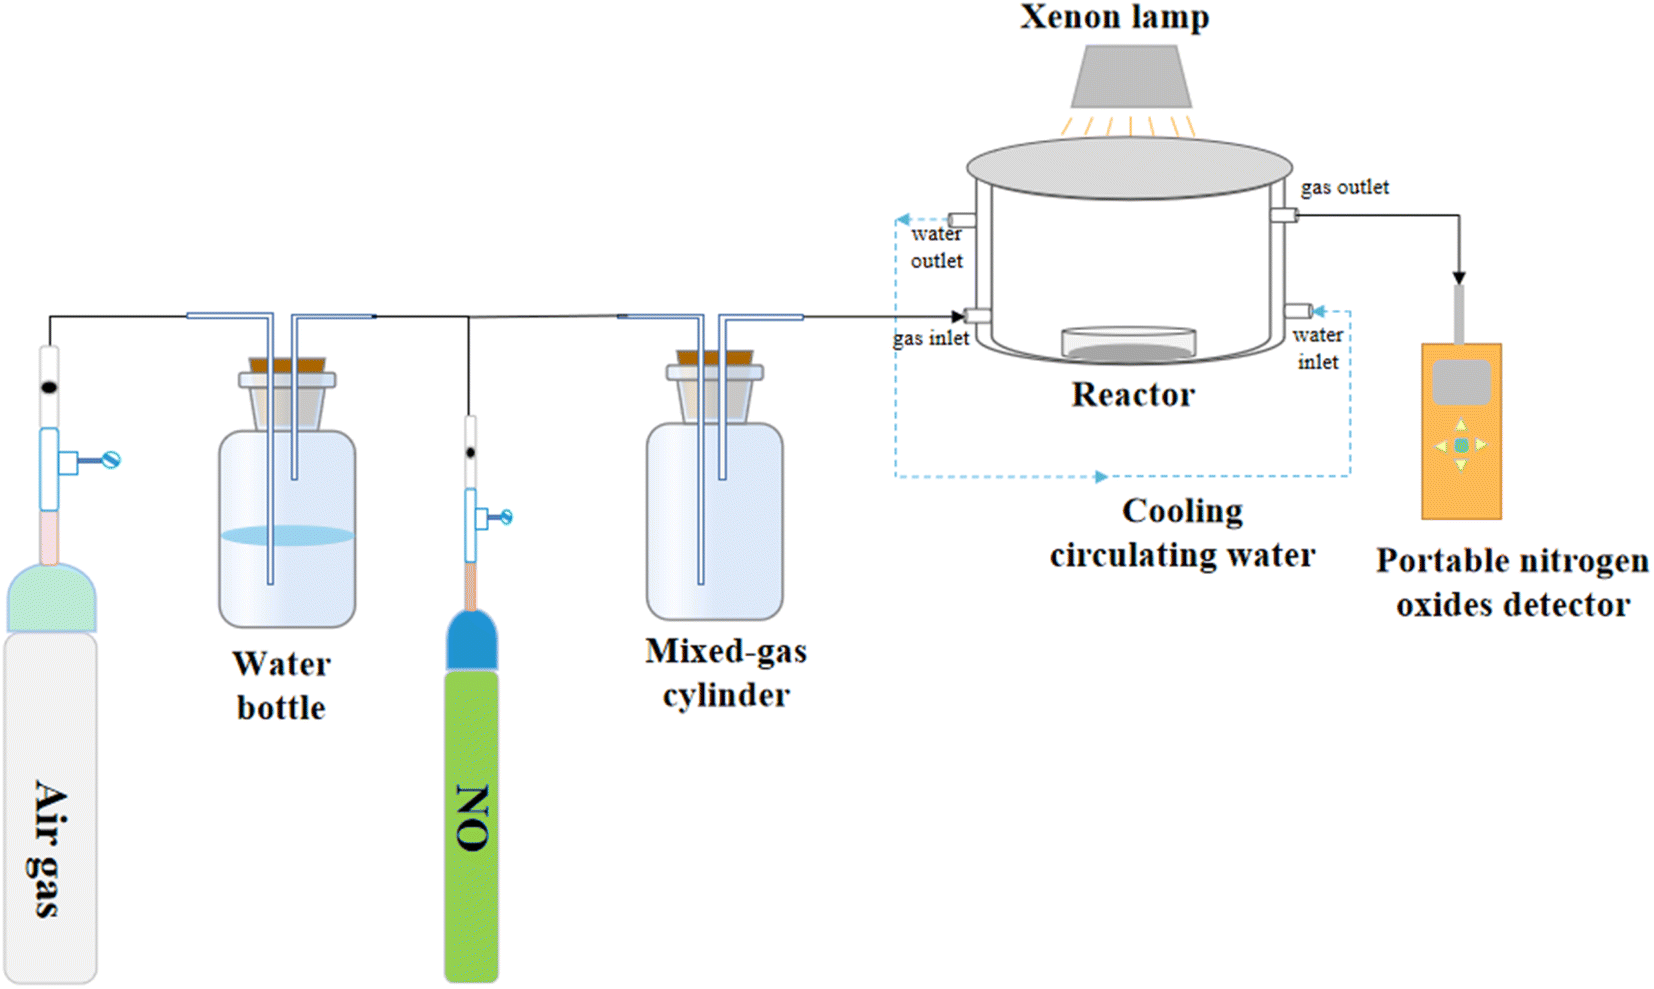
The NO degradation rate of the samples was evaluated using a continuous flow reactor to assess the performance of the photocatalytic materials, as shown in Fig. 1. The reactor, made of acrylic plate with a volume of 500 mL, was covered with quartz glass and featured a cooling circulating water layer on the outside. A xenon lamp (300 W) was placed above the quartz glass to simulate natural light. To conduct the photocatalytic reaction, we precisely weighed 50 mg of the sample and evenly spread it in a 35 mm diameter glass Petri dish. Next, we added 5 mL of ethanol and ultrasonicated the mixture for 5 minutes to ensure uniform dispersion. The processed sample was then dried in an oven at 60 °C and cooled to room temperature before conducting the degradation experiments. For the photocatalytic degradation of NO by superhydrophobic coatings, we directly placed the coating into the reaction for the degradation experiments. Air and NO at a concentration of 400 ppm were mixed in a gas-mixing cylinder at flow rates of 15 mL min−1 and 40 mL min−1, respectively, resulting in a final concentration of 83 ppm after dilution. The experiment began with a dark reaction phase to achieve adsorption equilibrium. Subsequently, the light was activated to initiate the reaction. The concentration of NO was continuously monitored in real-time using a portable NO detector and recorded every 2 minutes throughout the 40 minute reaction period. The NO removal rate subsequent to light exposure was calculated as follows:| |
 | (1) |
where C is the measured concentration of NO in the reactor after the light is turned on, and C0 is the equilibrium concentration of NO in the reactor before the light is turned on.
 |
| | Fig. 1 Schematic diagram of the reaction unit for photocatalytic degradation of NO. | |
3 Results and discussion
3.1 Performance testing of p–n type BiOBr/α-Fe2O3 heterojunction
3.1.1 Micro-morphological analysis. The morphology and microstructure of the prepared samples were examined using scanning electron microscopy (SEM). As illustrated in Fig. 2(a) and (b), the typical morphologies of α-Fe2O3 and BiOBr were observed. The α-Fe2O3 morphology exhibits cubic and sea urchin structures, with cube sizes of approximately 500 nm and sea urchin-like structures formed by several nano-axes, each with a size of about 110 nm.27 The pristine BiOBr is composed of stacked nano-sheet layer particles, with each nanosheet having a size of about 100 nm and having an average thickness of 20 nm. Fig. 2(c) demonstrates the topography of BiOBr/α-Fe2O3, emphasizing the deposition of a large number of BiOBr nanosheet structures on the surface of the nanoclusters formed by α-Fe2O3. This results in the creation of a heterogeneous structure that effectively inhibits the clustering phenomenon of nano-BiOBr. EDS and mapping analysis of the BiOBr/α-Fe2O3 material, as shown in Fig. 2(d and e), unequivocally demonstrate the presence of O, Fe, Bi, and Br elements.
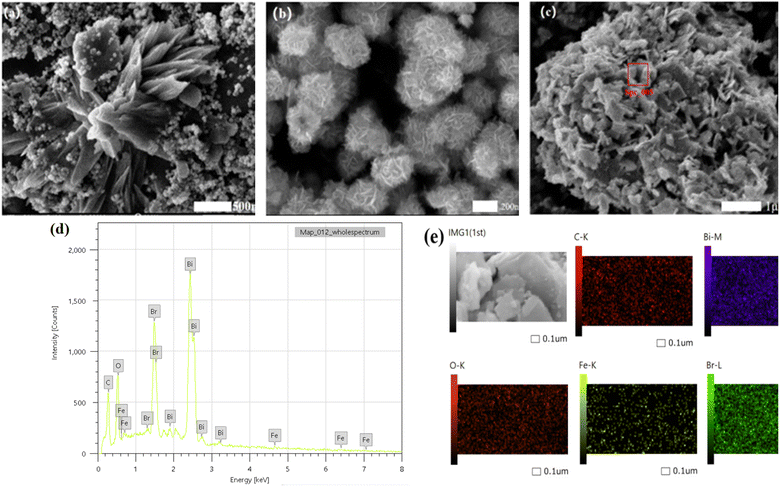 |
| | Fig. 2 SEM (a) α-Fe2O3; (b) BiOBr; (c) BiOBr/α-Fe2O3; (d) BiOBr/α-Fe2O3 EDS; (e) BiOBr/α-Fe2O3 mapping. | |
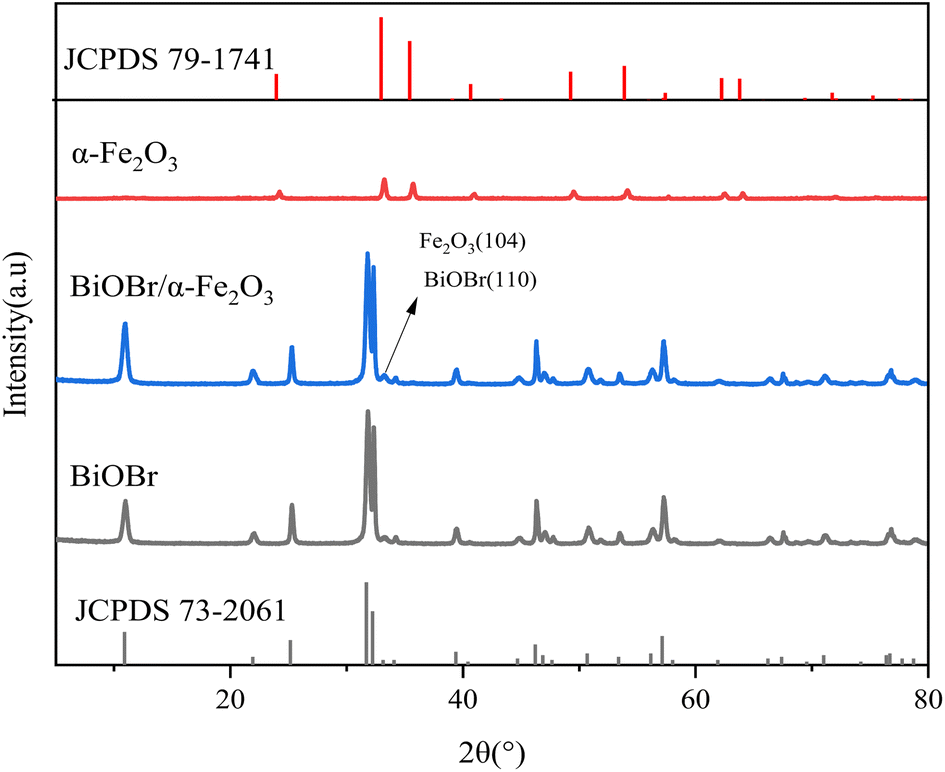
3.1.2 XRD analysis. X-ray diffraction (XRD) analysis was conducted to determine the crystal structures of the samples, as shown in Fig. 3. In comparison with the standard card for BiOBr (JCPDS 73-2061), pure BiOBr was identified at the 2θ positions of 10.9°, 21.9°, 25.2°, 31.7°, 32.2°, 34.1°, 39.4°, 46.2°, and 57.1°. The characteristic diffraction peaks of BiOBr, corresponding to the (001), (002), (101), (102), (110), (111), (112), (200), and (212) crystal planes of BiOBr, respectively. Comparing with the standard card for α-Fe2O3 (JCPDS 79-1741), the characteristic diffraction peaks of Fe2O3 were observed at 2θ positions of 24.08°, 33.19°, 35.67°, 40.84°, 49.47°, 53.97°, 57.46°, 62.39°, and 63.96° for a single α-Fe2O3, corresponding to the (012), (104), (110), (113), (024), (116), (122), (214), and (300) crystal planes of Fe2O3. This confirms that the prepared α-Fe2O3 exhibits a cubic structure. The diffraction peaks of BiOBr/α-Fe2O3 clearly indicate that the addition of α-Fe2O3 does not have any significant impact on the crystal and lattice structure of BiOBr, while maintaining a striking resemblance to that of pure BiOBr. The only notable difference is the increased intensity of the diffraction peak at the 32.2° position for BiOBr/α-Fe2O3, which is considerably stronger than that of BiOBr, which is primarily due to the incorporation of α-Fe2O3 and the overlap of its (104) crystallographic plane with the BiOBr (110) crystallographic plane, and thus the formation of the BiOBr/α-Fe2O3 composite can be inferred. Meanwhile, the absence of other diffraction peaks from α-Fe2O3 in the BiOBr/α-Fe2O3 is attributed to the weak intensity of the diffraction peaks of a single α-Fe2O3 and the small quantity added.
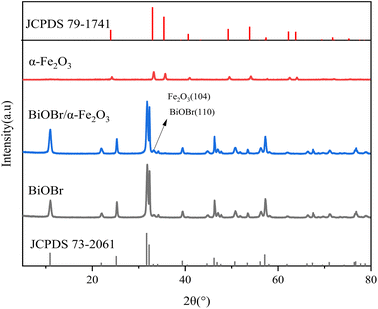 |
| | Fig. 3 XRD of BiOBr/α-Fe2O3. | |
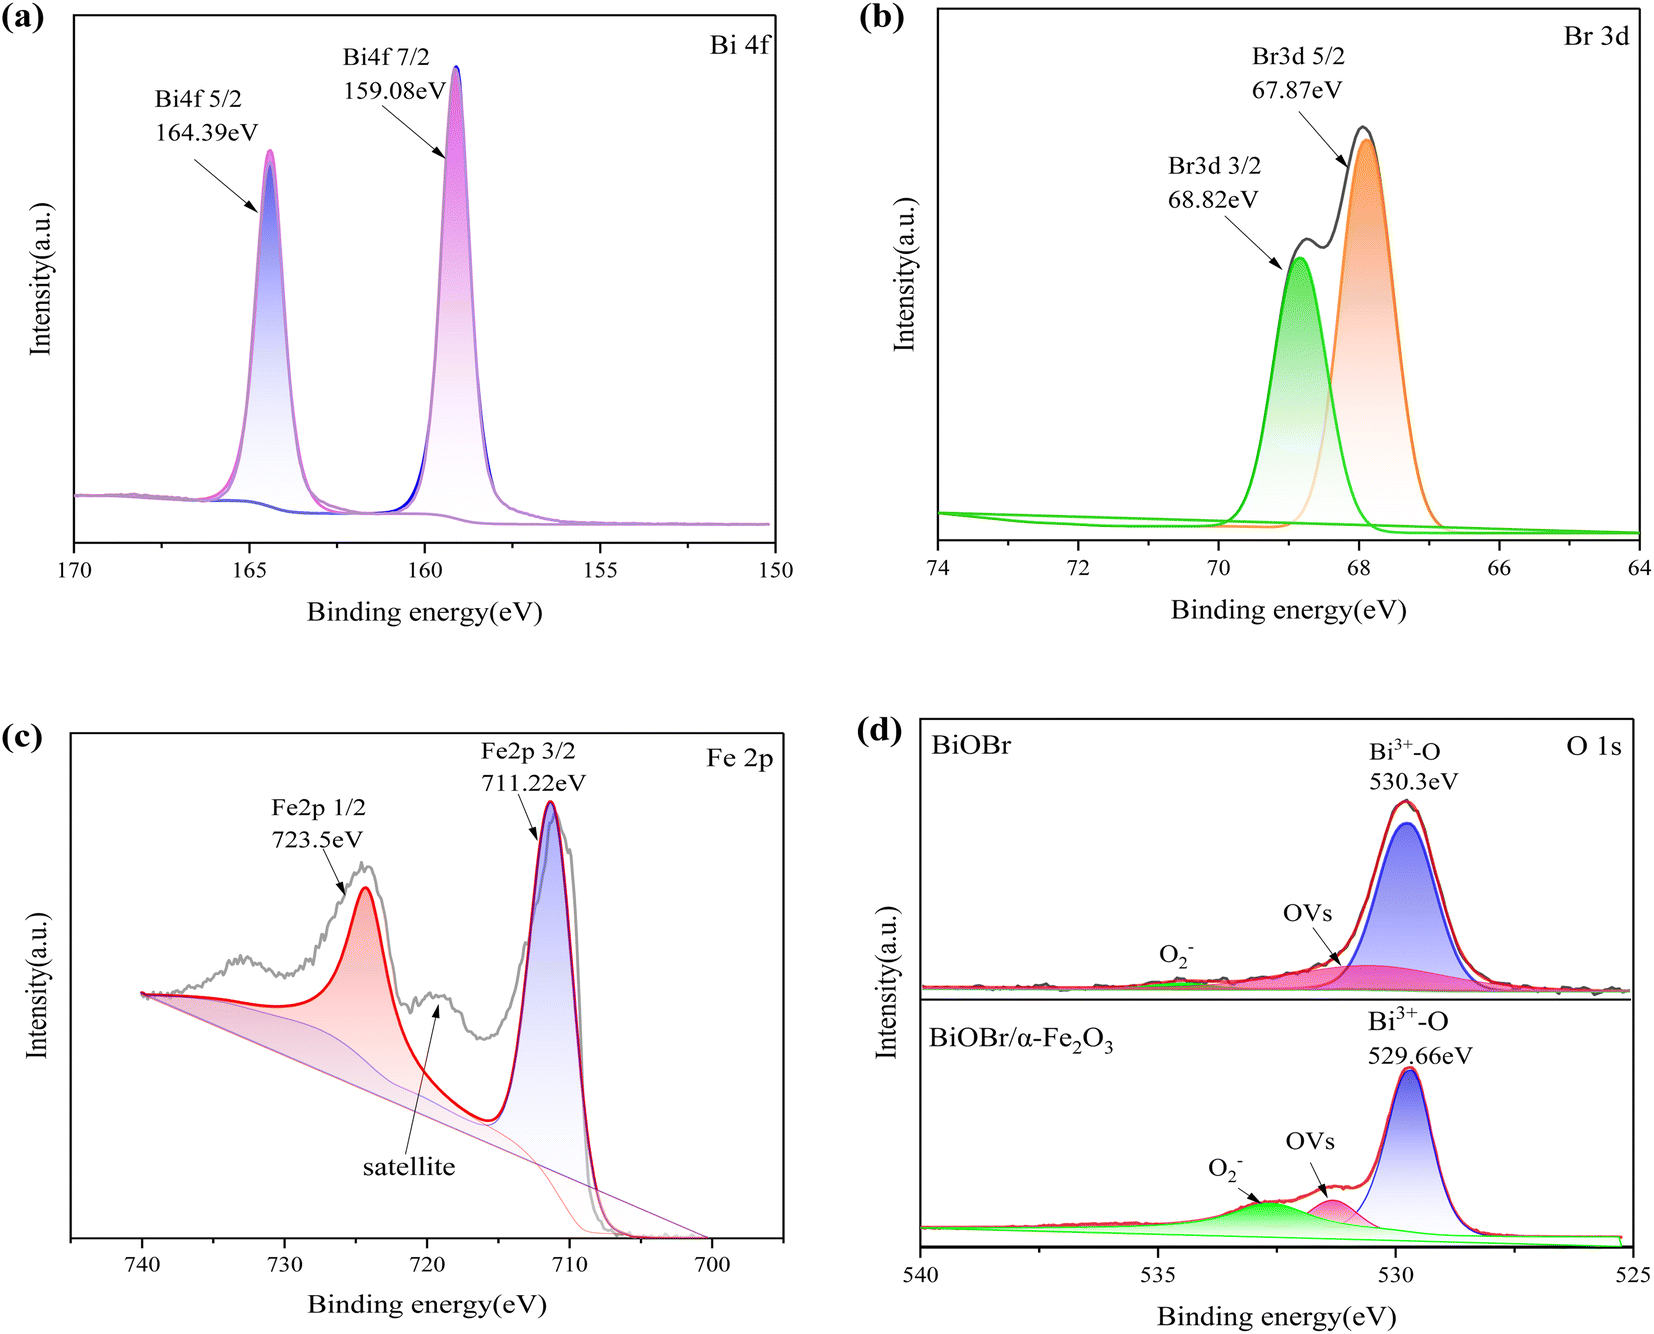
3.1.3 XPS analysis. X-ray photoelectron spectroscopy (XPS) was employed to accurately determine the chemical state and elemental composition of oxygen in the BiOBr/α-Fe2O3 composite. Fig. 4(a) presents the XPS spectrum of Bi 4f, which reveals two prominent peaks at 159.08 eV and 164.39 eV, corresponding to Bi 4f7/2 and Bi 4f5/2, respectively. This indicates that Bi is primarily present in its trivalent chemical state.28,29 The XPS spectrum of Br is shown in Fig. 4(b), where two strong peaks centred at 67.87 eV and 68.82 eV were observed, caused by Br 3d5/2 and Br 3d3/2, respectively, confirming the presence of Br−.30 The XPS spectra of Fe in Fig. 4(c) show the presence of Fe 2p3/2 and Fe 2p1/2 peaks at 711.22 eV and 723.5 eV, respectively. In addition, there is an oscillating satellite line in the map at 719 eV, which is a satellite peak of the Fe 2p3/2 peak and neither overlaps the Fe 2p3/2 peak nor the Fe 2p1/2 peak. In addition, there appears to be another satellite peak at 733 eV, which is speculated to be possibly the satellite peak of Fe 2p1/2. This is consistent with the peak observed in α-Fe2O3 and agrees with the XRD analysis.31–34 Fig. 4(d) clearly displays the XPS spectra of O for both BiOBr and BiOBr/α-Fe2O3. The fitted peak at 530.3 eV in the XPS spectrum of O for BiOBr unambiguously corresponds to Bi3+–O. The composite material exhibits a notable blueshift of 0.64 eV compared to BiOBr, which can be attributed to the higher electronegativity of oxygen attracting more electrons in the surrounding area. The peaks at 531.32 eV and 532.61 eV in the spectra correspond to the OVs and O2− in the adsorbed water molecules, respectively. These results confirm the simultaneous presence of BiOBr and α-Fe2O3 species in the composites, as supported by SEM, EDS, and XPS studies.
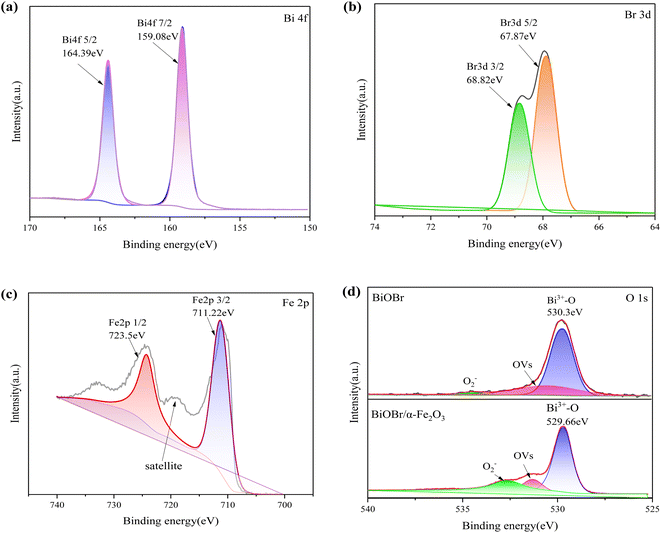 |
| | Fig. 4 XPS spectrum of BiOBr/α-Fe2O3 (a) Bi 4f; (b) Br 3d; (c) Fe 2p; (d) O 1s. | |
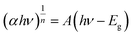
3.1.4 UV-vis DRs analysis. The optical properties of the photocatalytic materials were analysed by ultraviolet-visible diffuse reflectance spectroscopy (UV-vis DRs). The UV-vis diffuse reflectance spectra of the samples are presented in Fig. 5(a), which shows that the light absorption edges of α-Fe2O3 and BiOBr are approximately 450 nm and 650 nm, respectively, and the absorbance of α-Fe2O3 is significantly stronger than that of BiOBr in the visible range, whereas the absorption edges of the two composites are red-shifted, and the intensity of the photoresponsive signal is significantly increased in the range of 400–800 nm, indicating that electron–hole pairs are more readily generated under UV-visible irradiation due to the narrow band gap of α-Fe2O3. Through the Kubelka–Munk formula, as in eqn (2), the absorbance spectra can be converted into bandgap spectra based on the absorbance spectra, and since both α-Fe2O3 and BiOBr are indirect bandgap semiconductors, then n = 2. The energy band gaps of the materials are further calculated, as shown in Fig. 5(b), and the energy band gaps of α-Fe2O3, BiOBr, and BiOBr/α-Fe2O3 are 1.3 eV, 2.6 eV, and 2.2 eV, respectively.| |
 | (2) |
where, α—absorbance of UV-vis diffuse reflectance; h—Planck's constant; v—frequency of light; hv—1024/λ; A—constant, which has no effect on the forbidden bandwidth; n—determined by the type of optical jump of the semiconductor (1/2 for direct band gap semiconductors and 2 for indirect band gap semiconductors).
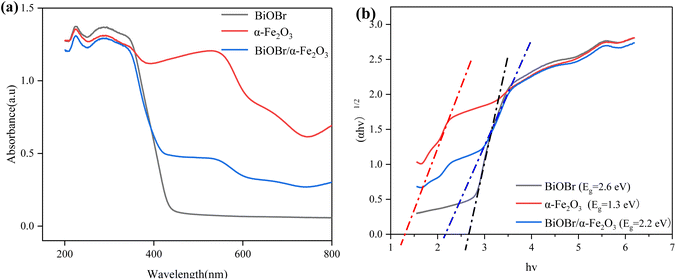 |
| | Fig. 5 (a) UV diffuse reflectance spectrum of BiOBr/α-Fe2O3; (b) band gap spectrum of BiOBr/α-Fe2O3. | |
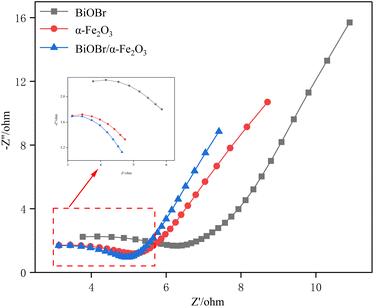
3.1.5 EIS analysis. Electrochemical impedance spectroscopy (EIS) is a commonly used photoelectrocatalytic method to study photoelectrocatalytic performance. The general Nyquist plot consists of ‘semicircle (high frequency) + tail (low frequency)’, in which the arc radius of the semicircle reflects the mobility of the photogenerated carriers, and the higher the mobility of the carriers, the smaller the arc radius.35 The Nyquist diagrams of BiOBr, α-Fe2O3 and BiOBr/α-Fe2O3 as shown in Fig. 6, are composed of incomplete semicircles and straight lines with slopes of 45°, and it can be seen in the inset that the radius of semicircle of the composite material BiOBr/α-Fe2O3 is obviously smaller than that of BiOBr and α-Fe2O3, which suggests that the construction of heterojunctions really improves the photogenerated carriers' separation efficiency.
 |
| | Fig. 6 Nyquist plots of BiOBr, α-Fe2O3 and BiOBr/α-Fe2O3. | |
3.2 Photocatalytic degradation of NO by p–n type BiOBr/α-Fe2O3
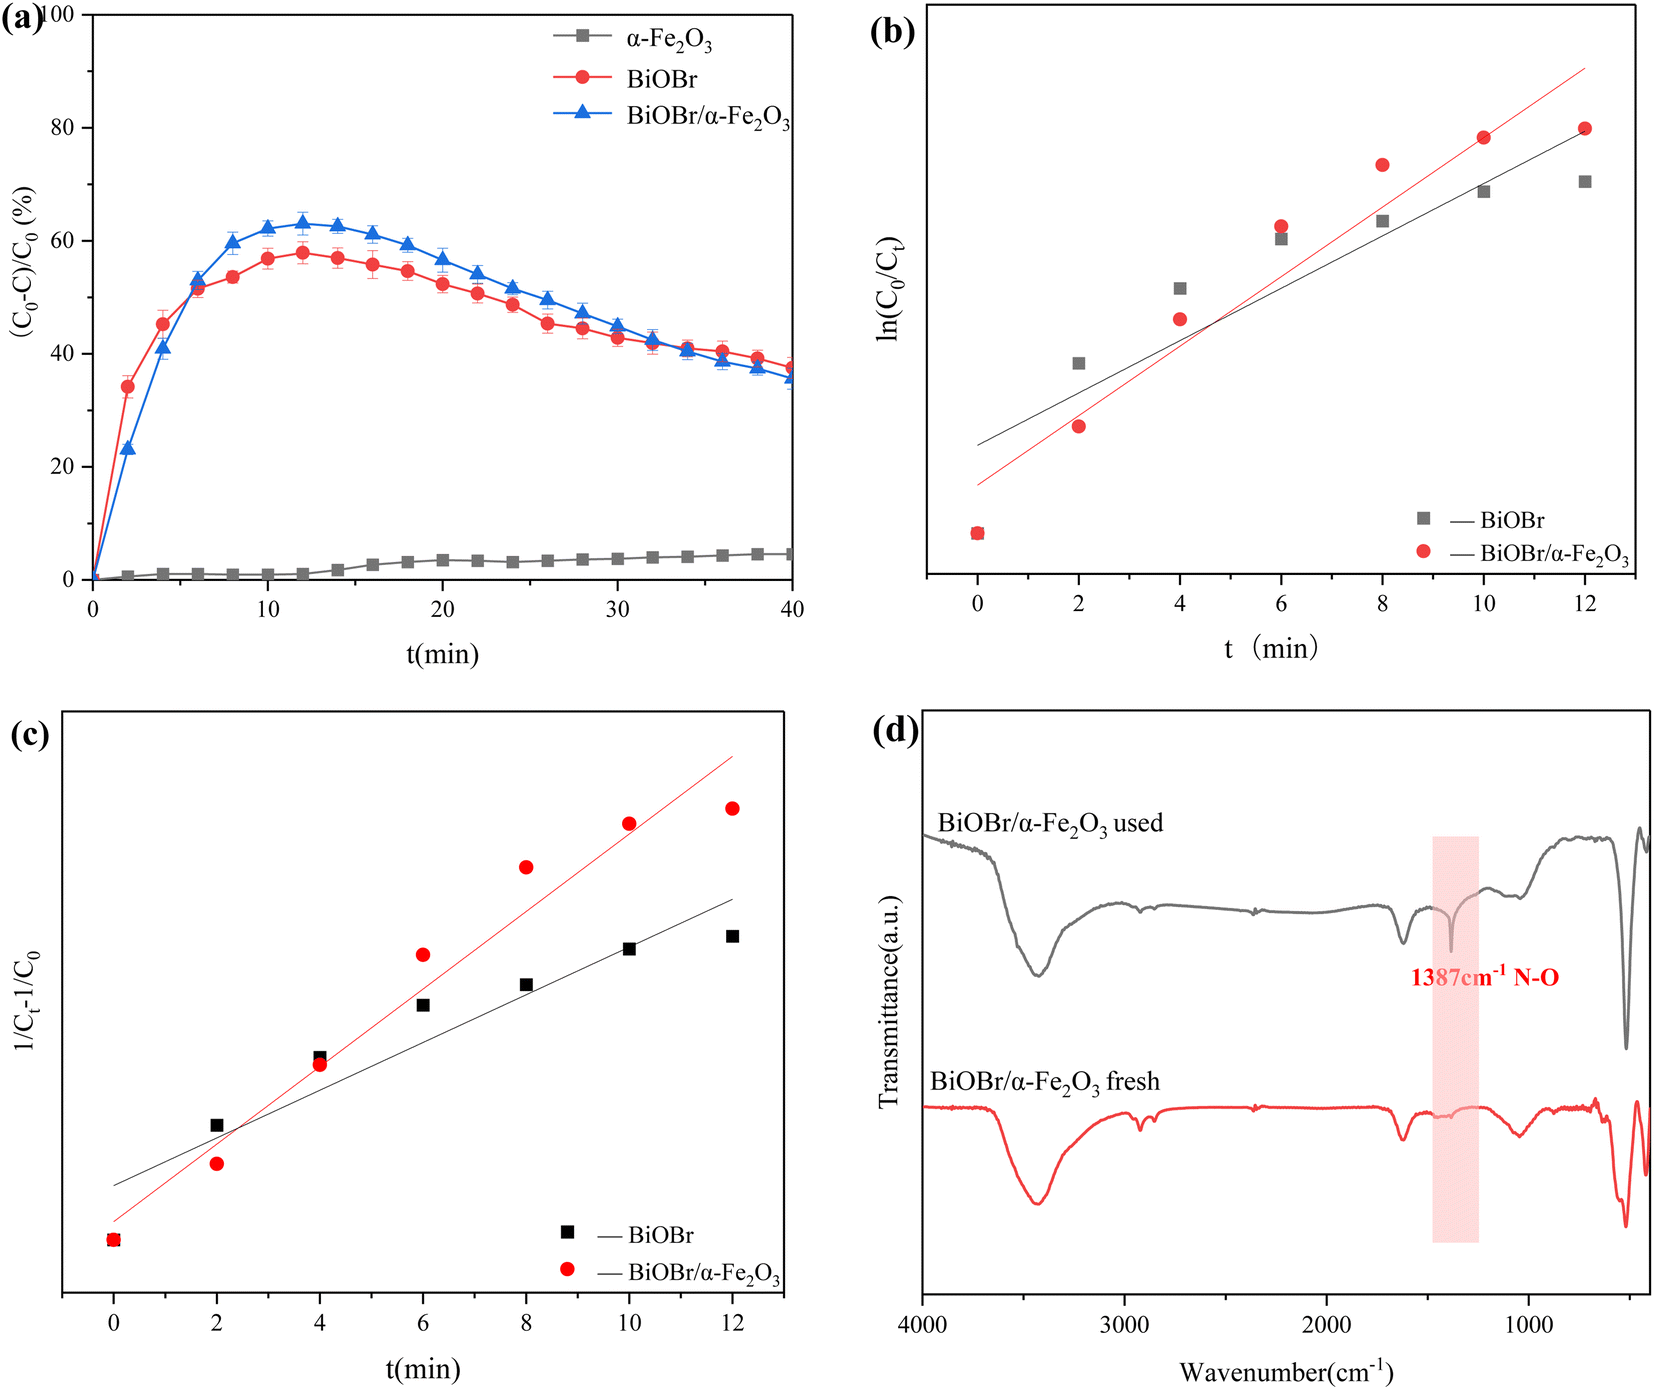
The study investigated the photodegradation performance of three photocatalytic materials, α-Fe2O3, BiOBr, and BiOBr/α-Fe2O3, on NO. As shown in Fig. 7(a), α-Fe2O3 had almost no ability to degrade NO under xenon lamp irradiation, whereas BiOBr achieved a degradation rate of up to 58% within 10 minutes. The product was enriched on the surface of the catalyst, leading to a reduction in available sites. Consequently, as the enrichment of the product on the surface of the catalyst, the active sites decreased, and the degradation efficiency gradually decreased, and the degradation efficiency was 40% after 40 minutes of reaction. The degradation efficiency of BiOBr/α-Fe2O3 was the highest among the tested materials, with a degradation rate of NO reaching 65% within 10 minutes. This was mainly due to the large BET specific surface area of BiOBr/α-Fe2O3, which increases the active sites of the reaction, and the formation of the heterojunction enhances the response to visible light, which improved the photocatalytic activity. The kinetic mechanism of the degradation of photocatalytic materials was further analysed. The degradation effect of α-Fe2O3 on NO is negligible. Consequently, only the kinetic models of BiOBr and BiOBr/α-Fe2O3 were examined for the degradation of NO by photocatalytic materials. The first-order and second-order kinetic analyses of NO degradation by these materials are presented in Fig. 7(b) and (c), respectively. By comparing the kinetic model parameters presented in Table 1, it was determined that the kinetic models of BiOBr and BiOBr/α-Fe2O3 degradation of NO were more closely with the second-order kinetic model. The reaction rates are 11 × 10−4 min−1 and 18 × 10−4 min−1, respectively, indicating that the formation of a heterojunction enhances the photocatalytic activity of the materials, which is conducive to the photocatalytic reaction and accelerating the degradation rate of NO.
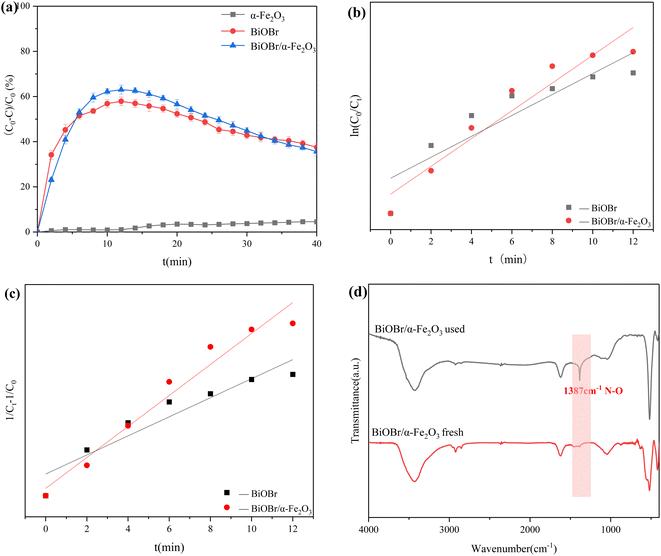 |
| | Fig. 7 (a) Degradation efficiency of NO by different photocatalytic materials; (b) primary kinetic analysis; (c) secondary kinetic analysis; (d) comparison of FTIR spectra of BiOBr/α-Fe2O3 before and after reaction. | |
Table 1 Comparison of kinetic modelling parameters for NO degradation by photocatalytic materials
| Kinetic model |
Parameter |
BiOBr |
BiOBr/α-Fe2O3 |
| First-order kinetic model |
R2 |
0.82 |
0.92 |
| k1 (min−1) |
0.064 |
0.085 |
| Second-order kinetic model |
R2 |
0.90 |
0.96 |
| k2 (min−1) |
0.0011 |
0.0018 |
The properties of the photocatalytic materials were further analyzed by comparing the FT-IR spectra of BiOBr/α-Fe2O3. As shown in Fig. 7(d), the FT-IR spectra of BiOBr/α-Fe2O3 before and after the reaction remained largely unchanged. The spectra exhibited absorption peaks at 3435 cm−1 and 1637 cm−1, primarily attributed to the stretching and bending vibrations of the O–H bonds in the adsorbed water. Additionally, the absorption peak at 526 cm−1 was attributed to the telescopic vibration peak of the Bi–O, which indicates the stability of the material. However, the absorption peak at 1387 cm−1 in the spectrum of BiOBr/α-Fe2O3 after the reaction originated from the N–O bond in nitrate, which proves the degradation of NO by BiOBr/α-Fe2O3 with the production of nitrate.36 As the reaction time increased, the produced nitrate attached to the surface of the photocatalytic material, and the active sites were further reduced. This, in turn, led to a gradual decrease in the photocatalytic degradation efficiency of NO.
3.3 Mechanistic analysis of p–n type BiOBr/α-Fe2O3 photocatalytic heterojunction mechanism
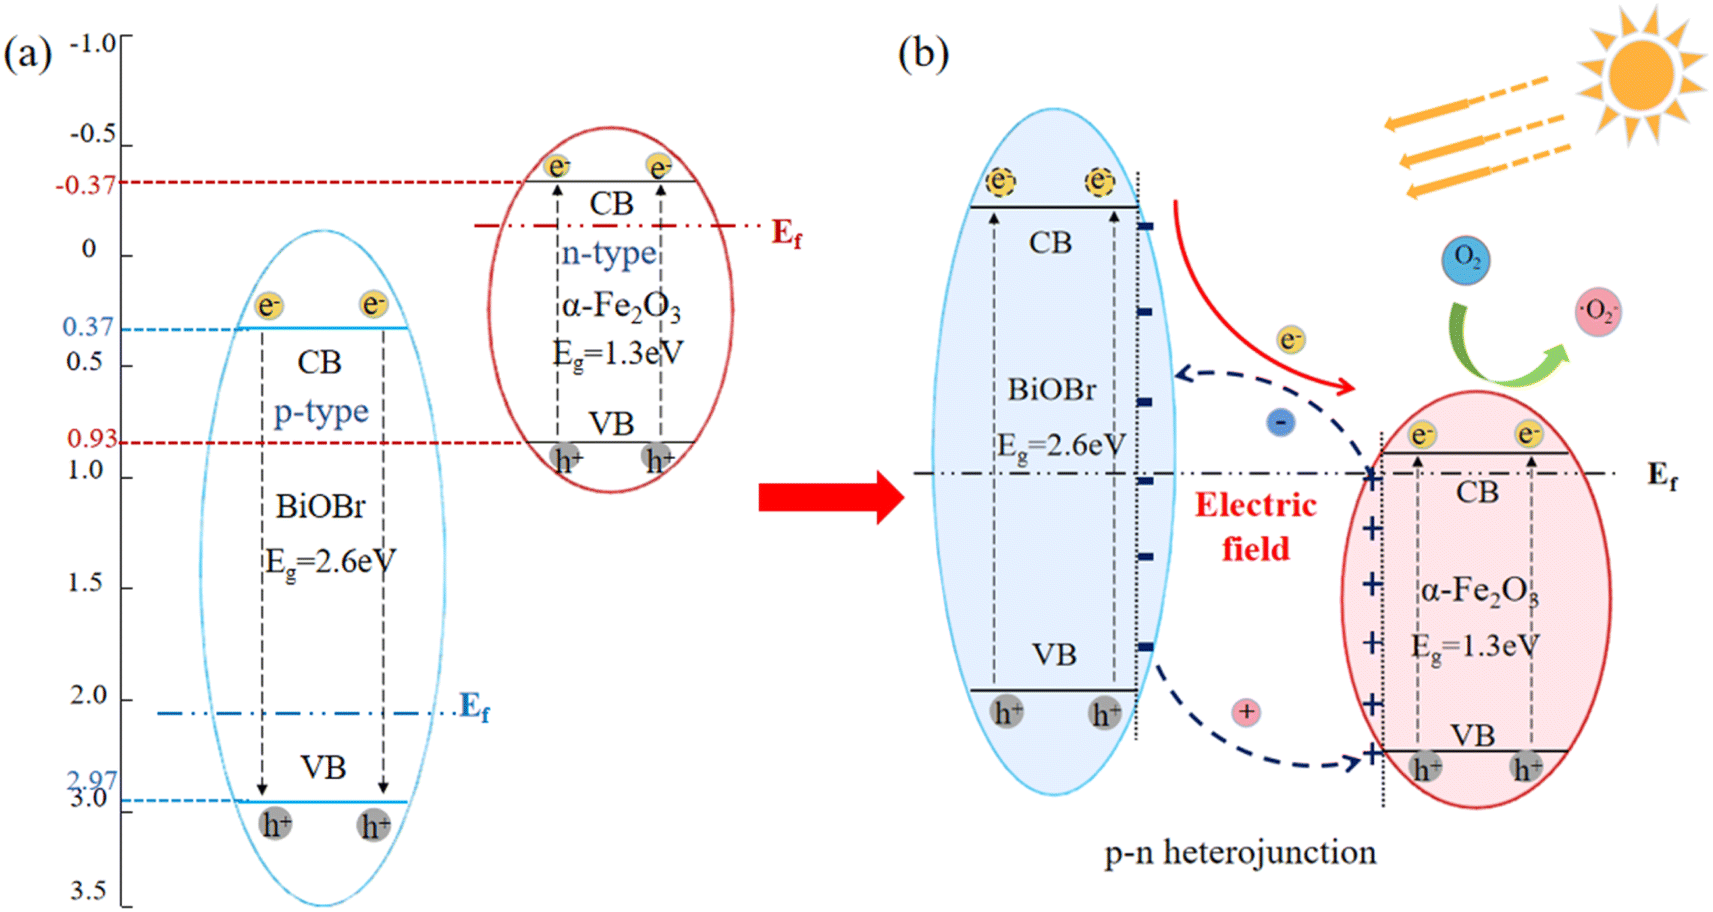
The energy band gap of α-Fe2O3 and BiOBr were obtained through UV diffuse reflection as 1.3 eV and 2.7 eV, respectively. The conduction-band (CB) and valence-band (VB) potentials of α-Fe2O3 and BiOBr were calculated using empirical formulas,37 as presented in eqn (3) and (4). The X-value for α-Fe2O3 is 4.78 eV,38 resulting in ECB and EVB values of −0.37 eV and 0.93 eV, respectively. The X value of BiOBr is 6.17 eV,39 resulting in ECB and EVB values of 0.32 eV and 3.03 eV, respectively. This leads to the schematic electronic structures of the two materials, as illustrated in Fig. 8(a). The potential photocatalytic mechanism of the BiOBr/α-Fe2O3 heterojunction is further analysed as illustrated in Fig. 8(b). α-Fe2O3 is an n-type semiconductor with a Fermi energy level close to the conduction band, while BiOBr is a p-type semiconductor with a Fermi energy level close to the valence band. When α-Fe2O3 is combined with BiOBr, the semiconductor experiences local band bending, followed by electron flow from α-Fe2O3 to BiOBr, leading to the accumulation of negative charges in the BiOBr region near the heterojunction, and the diffusion of holes diffuse from BiOBr to α-Fe2O3, causing a significant buildup of positive charges in the α-Fe2O3 region near the heterojunction. This charge redistribution continues until the Fermi energy level reaches equilibrium, forming an internal electric field in the direction from α-Fe2O3 to BiOBr, the generation of heterojunction, preventing the charge transfer from α-Fe2O3 to BiOBr. When there is light irradiation, both BiOBr and α-Fe2O3 can absorb visible light to generate photogenerated electrons and holes. Under the influence of the internal electric field and the energy band structure, the photogenerated electrons from the valence band of BiOBr migrate to the valence band of α-Fe2O3, while the photogenerated holes are left on the conduction band of BiOBr. The transfer of photocatalytic carriers can be promoted through the p–n junction interface between BiOBr and α-Fe2O3, which improves the activity of the photocatalyst.40,41where, ECB, EVB—conduction band (CB), valence band (VB) potentials; EC—energy of free electrons on the hydrogen scale (about 4.5 eV); X—electronegativity of the semiconductor; Eg—energy band gap of the semiconductor.
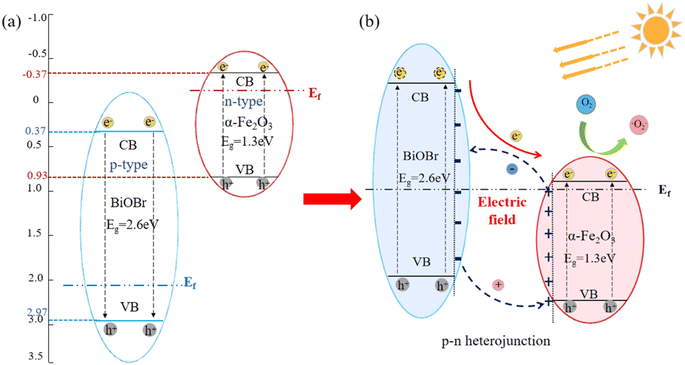 |
| | Fig. 8 Heterogeneous structure building mechanism diagram for p–n type BiOBr/α-Fe2O3 photocatalysis. (a) Schematic electronic structures of BiOBr and α-Fe2O3; (b) heterojunction mechanism diagram for p–n type BiOBr/α-Fe2O3 photocatalysis. | |
3.4 Performance testing of photocatalytic superhydrophobic coatings
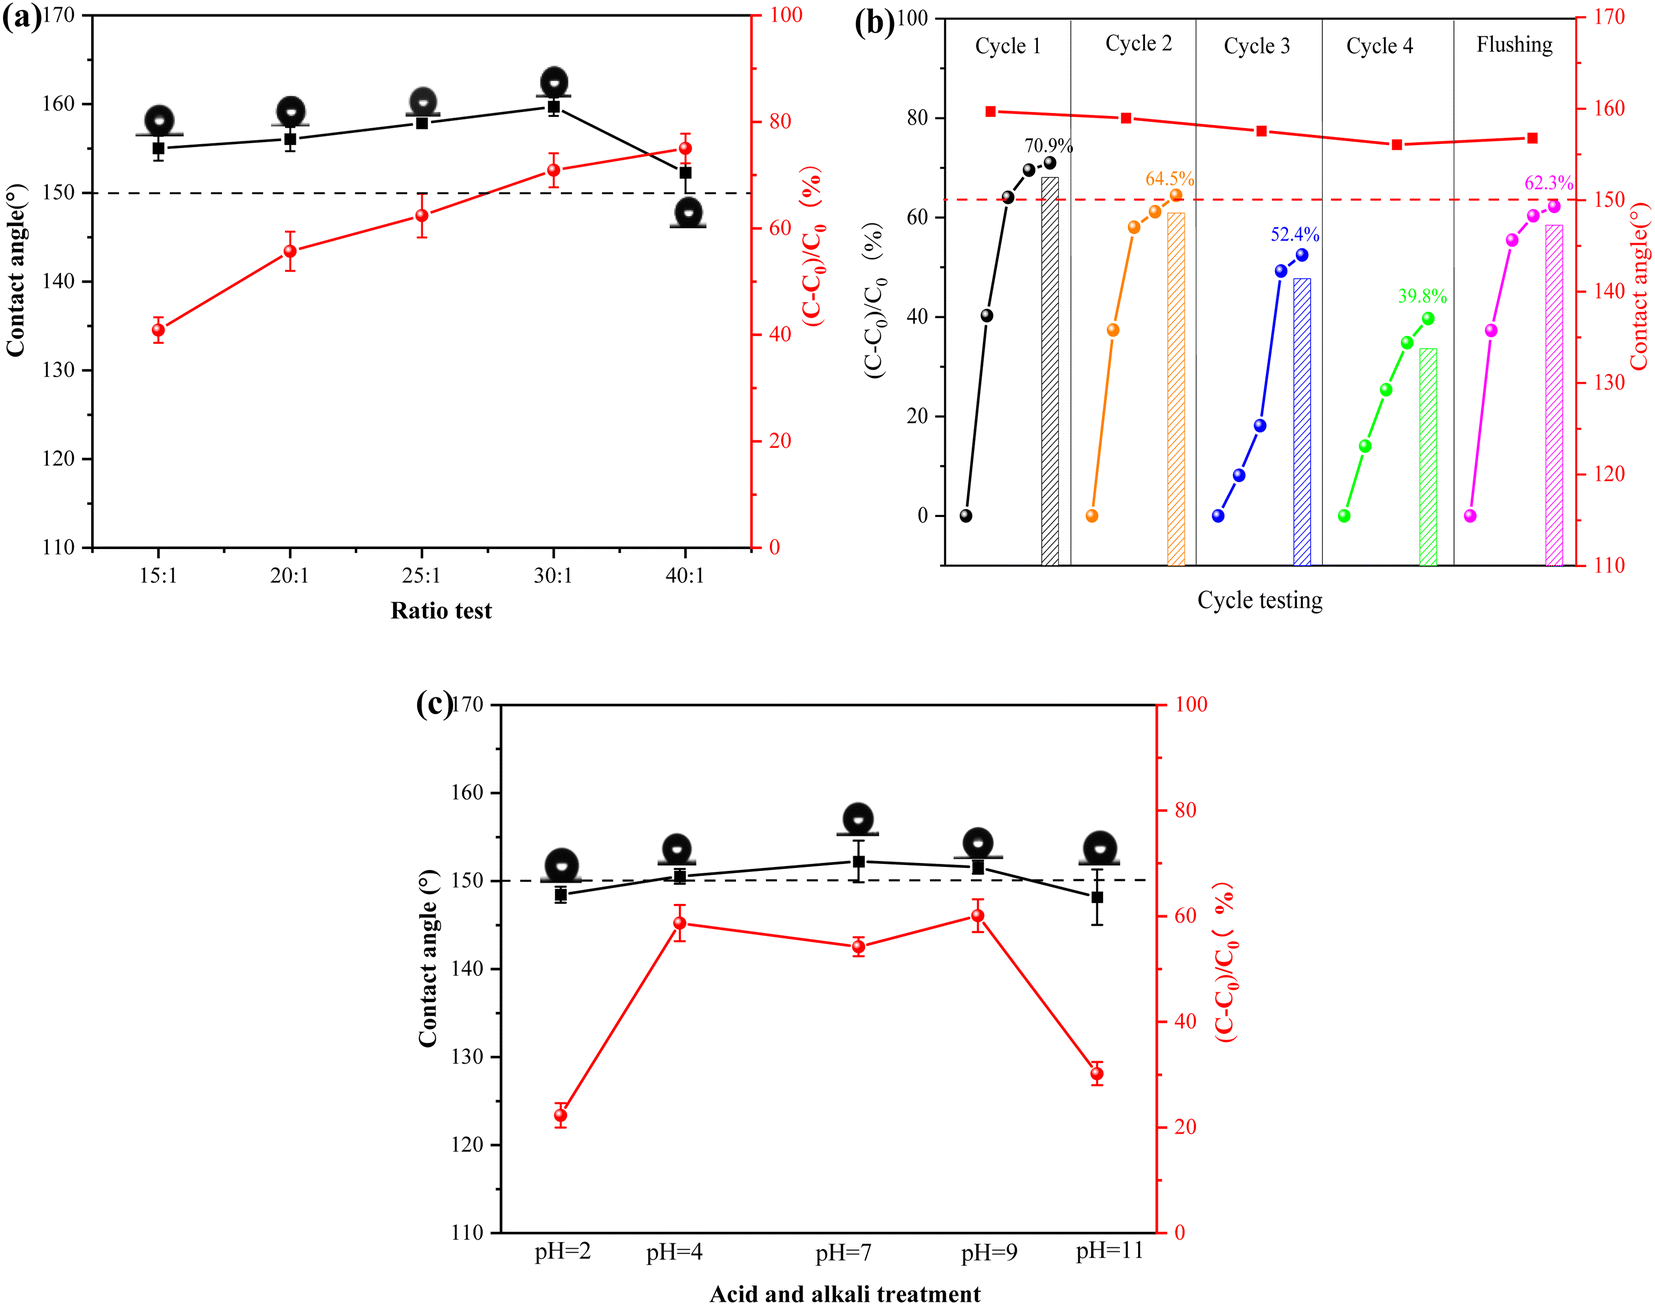
3.4.1 Effect of different photocatalytic materials doping on coating performance. The preparation of superhydrophobicity relies on a micro–nano rough structure and low surface energy. The microsurface of the photocatalytic superhydrophobic coatings was characterized using scanning electron microscopy (SEM), as shown in Fig. 9. The surface displays protruding structures, which are mainly attributed to the incorporation of photocatalytic material in the coatings, resulting in a micro–nano rough structure. Fig. 9(d) illustrates the mapping scan of the coating with a 30:1 mass ratio of photocatalytic material to PDMS. The presence of C, O, and Si elements indirectly confirms the successful grafting of oxy silane onto the surface of the photocatalytic material. This indicates the incorporation of a low-surface-energy substance (PDMS) during the formation of the rough structure. Combined with Fig. 10(a), the hydrophobicity of the surface improved as the proportion of photocatalytic material increased, resulting in a rougher surface. The photocatalytic degradation effect also increased. When the mass ratio of photocatalytic material to PDMS was 30:1, the contact angle reached 159°, and the degradation effect of NO was 70.9%. However, when the proportion of photocatalytic material was increased to 40:1, the contact angle began to decrease again. This phenomenon was attributed to an excess of photocatalytic material, which caused an accumulation of particles and a reduction in surface roughness. These findings further support the notion that the superhydrophobic performance of the coating is due to the combination of micro–nano-rough surfaces and low surface energy materials. Based on the analyses of hydrophobic performance and photocatalytic degradation, it was determined that the optimal results were achieved with a mass ratio of 30:1 of photocatalytic material to PDMS. Therefore, the coating with this ratio was selected to complete the task.
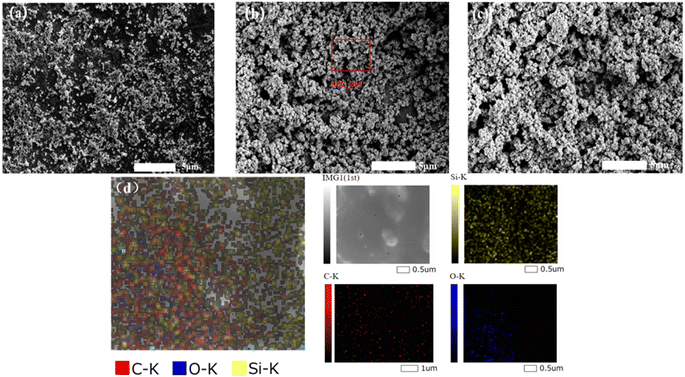 |
| | Fig. 9 Effect of different ratios of materials on the morphology of photocatalytic superhydrophobic coatings (a) 20:1; (b) 30:1; (c) 40:1; (d) mapping (30:1). | |
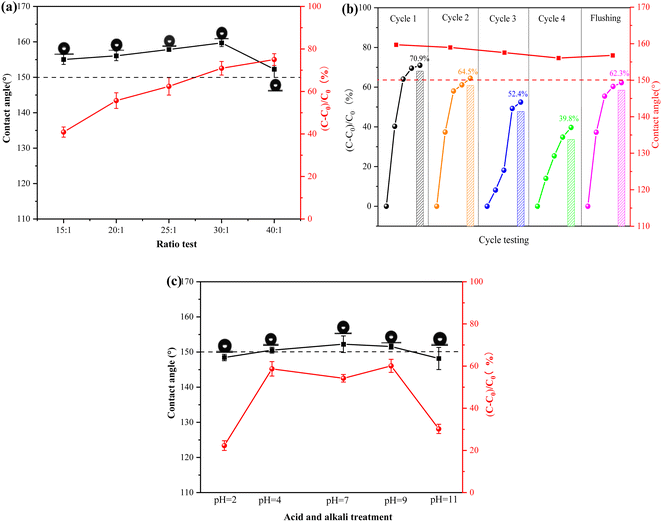 |
| | Fig. 10 Performance tests of photocatalytic superhydrophobic coatings (a) effect of different ratios of materials on the hydrophobicity and photocatalytic degradation of coatings; (b) stability test of photocatalytic superhydrophobic coatings; (c) acid and alkali resistance test of photocatalytic superhydrophobic coatings. | |
3.4.2 Stability. Stability is a crucial property for assessing photocatalytic superhydrophobic coatings.42,43 In this experiment, a xenon lamp (300 W) was utilized to simulate sunlight to provide a light source for the photocatalytic reaction and at the same time, the coating was also tested for UV light durability. The stability test of the photocatalytic superhydrophobic coating is illustrated in the schematic diagram in Fig. 10(b), after four cycles of the experiment, the photocatalytic degradation effect was reduced from 70.9% to 39.8%. This phenomenon was due to the continuous accumulation of products (e.g. nitrate) generated from the photocatalytic reaction on the surface of the coating as the experiment progressed. This accumulation covered the active sites on the surface of the photocatalytic material, resulting in reduced performance. Furthermore, the contact angle of the coating slightly decreased from 159.71° to 156.06°. However, the photocatalytic and hydrophobic properties of the coatings were significantly restored after rinsing with deionised water. The contact angle increased from 156.06° to 156.81°, and the photocatalytic degradation effect increased from 39.8% to 62.3%. This difference of 8.6% from the initial effect could be attributed to the deactivation of some photocatalytic materials during the experimental process and the aging of the coatings due to the intense light source of the xenon lamp. This caused the breakage of the coating molecular chain and disrupted the cross-linking effect, which affected the photocatalytic and hydrophobic properties of the photocatalytic superhydrophobic coating to some extent. Therefore, it is shown that the photocatalytic superhydrophobic coatings have good stability during the application process, and the self-cleaning property in the coatings has a synergistic effect with the photocatalysis.
3.4.3 Acid and alkali resistance. The corrosion resistance of the photocatalytic superhydrophobic coatings was evaluated by exposing them to acid and alkali solutions with varying pH levels in natural harsh environments. As illustrated in Fig. 10(c), the photocatalytic superhydrophobic coating was immersed for 10 h, and its hydrophobic and photocatalytic properties were affected to some extent. The results indicated that the coating exhibited strong acid and alkali resistance, with a contact angle of 148.45° at pH 1 and 148.17° at pH 11. Although the hydrophobic performance of the coating was reduced, possibly due to the reaction of strong acids and bases with the coating. This led to a change in the chemical properties, which in turn impacted the hydrophobic performance.44 Despite this, the coating still exhibited high hydrophobic performance. The performance of photocatalytic degradation, however, was diminished to varying degrees when exposed to strong acids, bases, and salt solutions. The photocatalytic degradation performance is significantly influenced by strong acids and strong alkalis. This is due to the alteration of the microstructure of the coating surface, which makes it difficult to carry out the photocatalytic reaction. The degradation rate of NO is only 22.3% at pH 1, and 30.2% at pH 11. When the photocatalytic superhydrophobic coating was immersed in a salt solution, the ions in the solution reacted with the photocatalytic material, altering its surface properties and potentially impacting the efficiency of the photocatalytic reaction. As shown in Fig. 10, the degradation rate of NO decreased to 54.2%. The analysis indicates that the photocatalytic superhydrophobic coatings exhibit good stability. However, their overall performance is slightly affected in extreme environments, such as strong acids and alkalis.
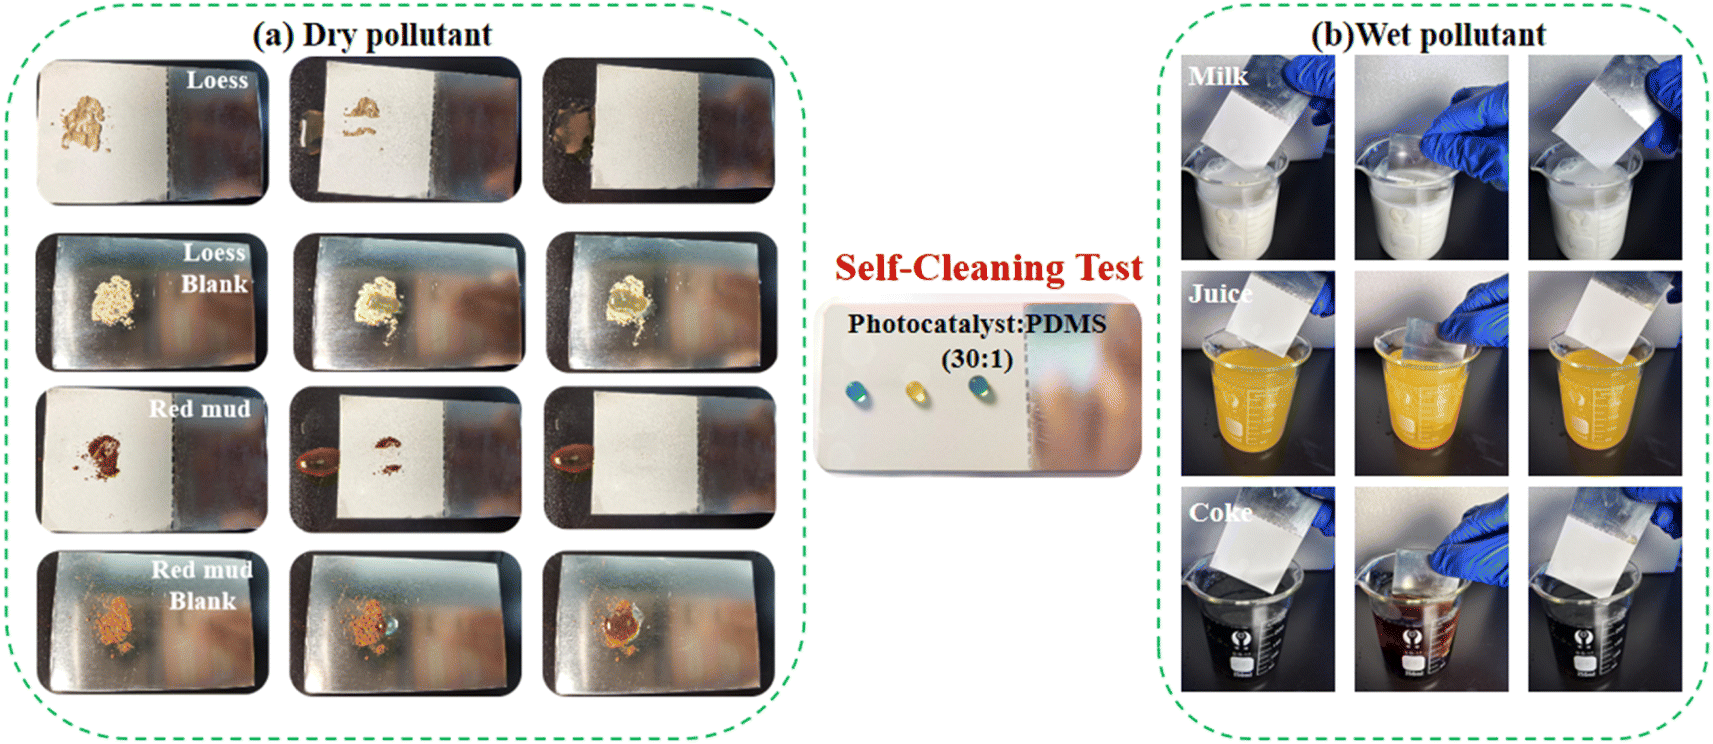
3.4.4 Self-cleaning. During application, photocatalytic superhydrophobic coatings can be influenced by various pollutants, which can reduce their aesthetics and durability. Fig. 11(a) illustrates the assessment of the coating's hydrophobicity by simulating dry pollutants with loess and terracotta, respectively. An uncoated metal plate served as the control. When deionised water was dripped down, both the loess and red mud on the coated surface rolled off with the water droplets, effectively restoring the surface of the coating to a clean state. In contrast, the loess and red mud on the surface of the uncoated metal plate did not roll with the water droplets, but instead absorbed the contaminants. This observation indicates that the coating has good removal ability for dry contaminants. Fig. 11(b) illustrates the simulation of wet contaminants using three types of beverages: milk, orange juice, and cola. The coating surface remained both unstained and unwetted after immersion in these solutions. This analysis confirms that the photocatalytic superhydrophobic coating exhibits excellent self-cleaning performance in the Cassie–Baxter state.
 |
| | Fig. 11 Self-cleaning tests of photocatalytic superhydrophobic coatings on pollutants (mass ratio of photocatalytic material to PDMS 30:1) (a) dry pollutant; (b) wet pollutant. | |
3.5 Mechanistic analysis of photocatalytic superhydrophobic coatings
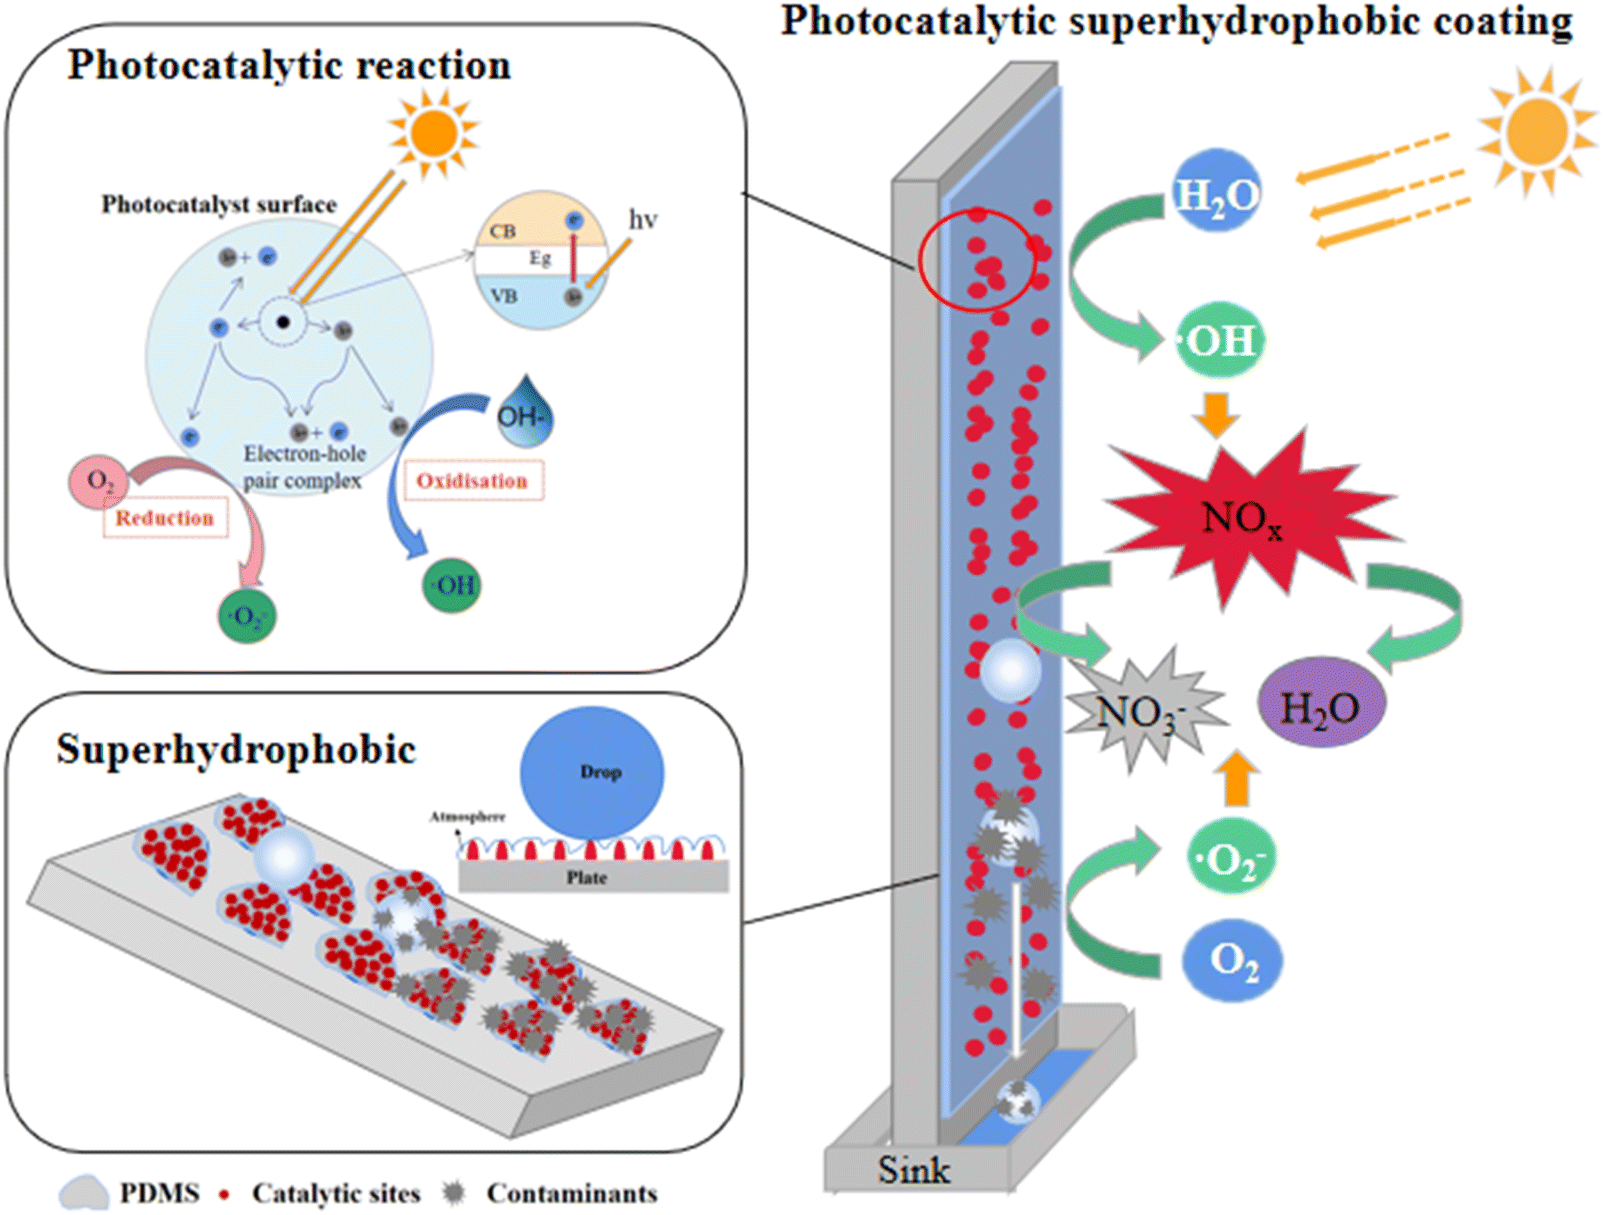
Based on the above analysis, we propose a mechanism for the degradation of NO by photocatalytic superhydrophobic coating, as illustrated in Fig. 12. The coating's micro–nano-photocatalytic materials create a rough surface and a papillary structure, while the incorporation of PDMS, a low-surface-energy material, enables the coating surface to satisfy the Cassie–Baxter model, thereby exhibiting superhydrophobic properties. As a result, water droplets form an air layer at the coating's surface, leading to a ‘point contact’ configuration. This configuration allows the droplets to roll off the surface with minimal external force, effectively preventing liquid droplets from wetting the surface. When exposed to light, the photocatalytic material in the coating generates photogenerated electrons (e−) and holes (h+). The generated ·O2−, ·OH, and h+ oxidise NO, with NO2 and HNO3 serving as intermediates to produce non-toxic and harmless NO3−.45,46 The nitrate produced by the photocatalytic reaction and other pollutants adhere to the surface of the coating more strongly than water droplets. Consequently, these substances roll off with the water droplets to the sewage tank below, effectively preventing groundwater pollution. This process not only regenerates the performance of the photocatalytic hydrophobic coating but also ensures its long-term degradation effect during use.
 |
| | Fig. 12 Photocatalytic superhydrophobic coating degradation of NO mechanism diagram. | |
4 Conclusions
This paper presents the preparation of p–n type BiOBr/α-Fe2O3 photocatalytic superhydrophobic coatings with self-sustained degradation performance based on the ‘Lotus effect’. The results indicate that the formation of a p–n heterojunction significantly enhances the visible light absorption intensity of the BiOBr/α-Fe2O3 photocatalytic composites, resulting in an improved NO degradation efficiency with a removal rate of 65%. Furthermore, optimal results were achieved when the mass ratio of the photocatalytic material to PDMS was 30:1. This resulted in a contact angle of 159.55° and a 70.9% reduction in NO. The photocatalytic superhydrophobic coating demonstrated exceptional superhydrophobicity and photocatalytic activity even after undergoing 4 cycle tests and acid and alkali resistance tests. Various substances were employed to simulate pollutants on the surface of the photocatalytic superhydrophobic coating, the results demonstrated that none of the pollutants adhered easily to the surface of the coating, indicating excellent self-cleaning performance. Finally, the fundamental principle of NO degradation by the photocatalytic superhydrophobic coating was analysed in depth. The coating's surface satisfies the Cassie–Baxter model, exhibiting superhydrophobicity. When exposed to a light source, the photocatalytic material in the coating works in synergy with the superhydrophobicity to enable the coating's recyclability.
Data availability
The data that support the findings of this study are available from the corresponding author upon reasonable request.
Author contributions
All authors contributed to the investigation, methodology, writing – original draft, writing – review, formal analysis & editing.
Conflicts of interest
The authors declare that they have no competing interests or personal relationships that could have appeared to influence the work reported in this paper.
Acknowledgements
This work was finically supported by Central Guidance Fund for Local Science and Technology Development Projects (YDZJSX2024D003) and Fund Program for the Scientific Activities of Selected Returned Overseas Professionals in Shanxi Province (20230005).
References
- H. Shang, S. Huang, H. Li, M. Li, S. Zhao, J. Wang, Z. Ai and L. Zhang, Chem. Eng. J., 2020, 386, 124047 CrossRef CAS.
- Z. Zhou, M. P. Harold and D. Luss, Appl. Catal., B, 2019, 240, 79–91 CrossRef CAS.
- N. Li, C. Wang, K. Zhang, H. Lv, M. Yuan and D. W. Bahnemann, Chin. J. Catal., 2022, 43, 2363–2387 CrossRef CAS.
- G. Liu, H. Xia, Y. Niu, X. Zhao, G. Zhang, L. Song and H. Chen, Prog. Org. Coat., 2020, 148, 105882 CrossRef CAS.
- Z. Lian, P. Xu, W. Wang, D. Zhang, S. Xiao, X. Li and G. Li, ACS Appl. Mater. Interfaces, 2015, 7, 4533–4540 CrossRef CAS PubMed.
- M. S. Tahir, N. Manzoor, M. Sagir, M. B. Tahir and T. Nawaz, Fuel, 2021, 285, 119206 CrossRef.
- Z. Liu, M. Luo, L. Meng, S. Su, W. Ding, S. Yan, H. Li and X. Li, J. Mater. Chem. C, 2024, 12, 10070–10082 RSC.
- P. Pichat, J. M. Herrmann, H. C. J. Disdier and M. N. Mozzanega, Can. J. Chem. Eng., 1982, 60, 27–32 CrossRef CAS.
- H. Courbon and P. Pichat, J. Chem. Soc., 1984, 80, 3175–3185 CAS.
- L. Jiang, J. He, Y. P. Yang, D. C. Mao, D. M. Chen, W. Wang, Y. J. Chen, V. K. Sharma and J. Q. Wang, J. Alloys Compd., 2022, 898, 162886 CrossRef CAS.
- H. Mao, Z. Jin, F. Zhang, H. He, J. Chen and Y. Qian, Ceram. Int., 2018, 44, 17535–17538 CrossRef CAS.
- F. Shah, S. M. Sofi, A. Abdul, A. S. Feroz, M. Samanway, G. Mukul, S. Pabitra, W. P. Hsieh, S. Himanshu, M. Ikram and K. S. Dinesh, Langmuir, 2024, 40, 8418–8426 CrossRef PubMed.
- Q. Y. Tang, J. He, Q. C. Fu, L. X. Zhao, H. Tang, L. X. Xie, C. Liu, L. Jiang and J. Q. Wang, J. Alloys Compd., 2024, 992, 174503 CrossRef CAS.
- X. Wu, C. Y. Toe, C. Su, Y. Ng, R. Amal and J. Scott, J. Mater. Chem. A, 2020, 8, 15302–15308 RSC.
- S. S. Imam, R. Adnan and N. Kaus, J. Environ. Chem. Eng., 2021, 9, 105404 CrossRef CAS.
- S. Amir, A. Esrafil, A. Navid and H. Bayram, Int. J. Environ. Health Res., 2021, 33, 11–14 Search PubMed.
- G. Ding, Z. Liu, Q. Wang, Y. Li, W. Liu and Y. Liu, J. Colloid Interface Sci., 2023, 629, 193–205 CrossRef CAS PubMed.
- R. Nawaz, M. Saad, A. Bahadur, S. Iqbal, S. Mahmood, A. Zidan, M. Khan, R. Liaquat, M. Sohail and M. Alotaibi, Int. J. Hydrogen Energy, 2025, 99, 112–122 CrossRef CAS.
- W. Zhang, H. Xia, M. Yan, L. Song, X. Li, L. Cui, Y. Niu, S. Obukhova and I. Burmisrov, J. Cleaner Prod., 2024, 481, 144146 CrossRef CAS.
- E. Travnikova, B. Pijakova, D. Mareova and L. Blaha, J. Environ. Chem. Eng., 2020, 8, 104153 CrossRef.
- J. Liu, L. Ye, S. Wooh, M. Kappl, W. Steffen and H. J. Butt, ACS Appl. Mater. Interfaces, 2019, 11, 27422–27425 CrossRef CAS PubMed.
- Y. Liu, J. Liu, Y. Tian, H. Zhang, R. Wang, B. Zhang, H. Zhang and Q. Zhang, Ind. Eng. Chem. Res., 2019, 58, 4468–4478 CrossRef CAS.
- J. Peng, X. Zhao, W. Wang and X. Gong, Langmuir, 2019, 35, 8404–8412 CAS.
- G. Liu, H. Xia, W. Zhang, L. Lang, H. Geng, L. Song and Y. Niu, ACS Appl. Mater. Interfaces, 2021, 13, 12509–12520 CrossRef CAS PubMed.
- G. Liu, H. Xia, Y. Niu, M. Yan, H. Li and L. Song, Environ. Sci. Pollut. Res., 2022, 29, 53420–53432 CrossRef CAS PubMed.
- X. Ren, M. Gao, Y. Zhang, Z. Zhang, X. Cao, B. Wang and X. Wang, Appl. Catal., B, 2020, 274, 119063 CrossRef CAS.
- Y. Jiao, Y. Liu, F. Qu, A. Umar and X. Wu, J. Colloid Interface Sci., 2015, 451, 93–100 CrossRef CAS PubMed.
- H. Li, B. Long, K. Ye, Y. Cai, X. He, Y. Lan, Z. Yang and He. Ji, Appl. Surf. Sci., 2020, 515, 145967 CrossRef CAS.
- P. Wu, L. Feng, Y. Liang, X. Zhang, X. Li, S. Tian, H. Hu, G. Yin and S. Khan, J. Mater. Sci.:Mater. Electron., 2020, 31, 5383–5401 Search PubMed.
- D. Majhi, K. Das, A. Mishra, R. Dhiman and B. Mishra, Appl. Catal., B, 2020, 260, 118222 CrossRef CAS.
- H. Si, C. Mao, Y. Xie, X. Sun, J. Zhao, N. Zhou, J. Wang, W. Feng and Y. Li, Dalton Trans., 2017, 46, 200–206 RSC.
- T. Yamashita and P. Hayes, Appl. Surf. Sci., 2008, 254, 2441–2449 CrossRef CAS.
- Y. Gao and S. A. Chambers, J. Cryst. Growth, 1997, 174, 446–454 CrossRef CAS.
- Y. Guo, G. Zhang, J. Liu and Y. Zhang, RSC Adv., 2013, 3, 2963–2970 RSC.
- S. Wang, J. Zhang, O. Gharbi, V. Vivier, M. Gao and M. Orazem, Nat. Rev. Methods Primers, 2021, 1, 41 CrossRef CAS.
- K. Maiti, Chem. Phys., 2018, 515, 509–512 CrossRef CAS.
- J. Jiang, X. Zhang, P. Sun and L. Zhang, J. Phys. Chem. C, 2011, 115, 20555–20564 CrossRef CAS.
- M. Niu, F. Huang, L. Cui, P. Huang, Y. Yu and Y. Wang, ACS Nano, 2010, 4, 681–688 CrossRef CAS PubMed.
- J. Xia, J. Di, S. Yin, H. Xu, J. Zhang, Y. Xu, L. Xu, H. Li and M. Ji, Chem. Inf., 2014, 4, 82–90 CAS.
- L. Che, J. Pan, K. Cai, Y. Cong and S. Lv, Sep. Purif. Technol., 2023, 315, 1383–5866 CrossRef.
- X. Wen, C. Zhang, C. Niu, L. Zhang, D. Huang, X. Wang, X. Zhang and G. Zeng, RSC Adv., 2016, 6, 4035–4042 RSC.
- W. Fan, K. Chan, C. Zhang, K. Zhang, Z. Ning and M. Leung, Appl. Energy, 2018, 225, 535–541 CrossRef CAS.
- Z. Huang, R. Gurney, Y. Wang, W. Han, T. Wang and D. Liu, ACS Appl. Mater. Interfaces, 2019, 11, 7488–7497 CrossRef CAS PubMed.
- W. Wong, T. Corrales, A. Naga, P. Baumli, A. Kaltbeitzel, M. Kappl, P. Papadopoulos, D. Vollmer and H. J. Butt, ACS Nano, 2020, 14, 3836–3846 CrossRef CAS PubMed.
- D. Liu, D. Chen, N. Li, Q. Xu, H. Li, J. He and J. Lu, Appl. Catal., B, 2019, 243, 576–584 CrossRef CAS.
- X. Li, D. Chen, N. Li, Q. Xu, H. Li, J. He and J. Lu, ACS Sustain. Chem. Eng., 2018, 6, 11063–11070 CrossRef CAS.
|
| This journal is © The Royal Society of Chemistry 2025 |
Click here to see how this site uses Cookies. View our privacy policy here. 
 Open Access Article
 This Open Access Article is licensed under a Creative Commons Attribution-Non Commercial 3.0 Unported Licence
 *,
Shirui Zhang,
Shuyan Cheng,
Zhenlian Fan,
Hongyu Gao and
Fangqin Cheng
*,
Shirui Zhang,
Shuyan Cheng,
Zhenlian Fan,
Hongyu Gao and
Fangqin Cheng