 Open Access Article
Facile synthesis of an α-Fe2O3–TiO2-MXene heterojunction for enhanced acetone gas sensors
Zhenyuan Yangab and
Ying Chen *ab
*ab
aSchool of Science, Hubei University of Technology, Wuhan 430068, China. E-mail: chenying@hbut.edu.cn
bHubei Engineering Technology Research Center of Energy Photoelectric Device and System, Hubei University of Technology, Wuhan 430068, China
First published on 29th January 2025
Abstract
Acetone is harmful to the environment and human health. Therefore, research on acetone sensors for its high-efficiency detection is necessary. Herein, an α-Fe2O3–TiO2-MXene heterojunction was synthesized using a simple precipitation method, and its sensitivity towards acetone was systematically investigated. The response value of the sensor based on the α-Fe2O3–TiO2-MXene heterojunction to 50 ppm acetone was 24 at 150 °C, which was more than one-quarter of that of pure α-Fe2O3 (5.3). The best response and recovery time were 10 s and 6 s, respectively. The sensors also showed good stability and selectivity. The excellent gas sensitivity was mainly attributed to the formation of heterojunctions, which improved the carrier-transport efficiency and the specific surface area for gas molecular adsorption.
Introduction
Acetone is a common volatile organic compound (VOC), which can greatly harm the human throat, liver, kidney, and nerves if inhaled in a certain amount.1 It is also an important biomarker in human breath, which can be used for the preliminary review and diagnosis of diabetes.2 Therefore, the development of a high-performance acetone sensor could not only allow the monitoring of air quality in real-time but would also be beneficial for human health.3In recent years, ZnO,4 WO3,5 TiO2,6 SnO2,7 NiO,8 Co3O4,9 α-Fe2O3,10 and other metal oxide semiconductors have been developed in the field of gas sensing. Among them, α-Fe2O3 is an n-type semiconductor material with a band-gap of 2.2 eV, which offers the advantages of low cost, good stability, and non-toxicity, and it is harmless.11–13 Although α-Fe2O3 exhibits good gas-sensing properties, it usually requires a higher operating temperature and gives a slower response, which limits its application in portable and low-power devices.14 Various materials have been employed to blend with α-Fe2O3 to improve its performance.15–19 Zhang et al. formed a heterojunction of α-Fe2O3 and Ti3C2Tx MXene, which accelerated the carrier-transport efficiency, enlarged the specific surface area with more active sites, and thus improved its H2S gas-sensing property.20 Song et al. successfully synthesized a Fe2O3/Ti3C2Tx MXene heterojunction via an in situ growth method. The sensor's response was 1.31 to 70 ppb n-butanol.21 Liu et al. used gold nanoparticles to modify the surface of α-Fe2O3/Ti3C2Tx MXene composites. The sensor's response value to 1 ppm NH3 reached 16.9% at room temperature.22
Herein, an α-Fe2O3–TiO2-MXene heterojunction was successfully synthesized via a simple precipitation method. The thin sheet structure of α-Fe2O3 was evenly distributed on the accordion-like structure of Ti3C2Tx MXene, which provided more active sites for gas molecular adsorption. The formation of a heterojunction also improved the carrier-transport efficiency. The response value of the sensor based on the α-Fe2O3–TiO2-MXene heterojunction to 50 ppm acetone was 24 at 150 °C with a response/recovery time of 10 s/6 s.
Materials and methods
Synthesis of Ti3C2Tx MXene and α-Fe2O3–TiO2-Ti3C2Tx MXene
Characterization
The material crystal structures were characterized by X-ray diffraction (XRD, Rigaku D/Max2550, Tokyo, Japan) with Cu Kα radiation (λ = 1.5418 Å). The scanning range was 5°–80°. Their morphologies were observed by field-emission scanning electron microscopy (FESEM, Hitachi SU8010, Japan) and transmission electron microscopy (TEM, FEI Tecnai F20, USA). The element contents of all the samples were analyzed using an energy-dispersive X-ray spectroscopy (EDS) unit attached to the FESEM device. The elemental chemical status and compositions were identified by X-ray photoelectron spectroscopy (XPS) with Al Kα (1486.6 eV) excitation.Sensor preparation and testing
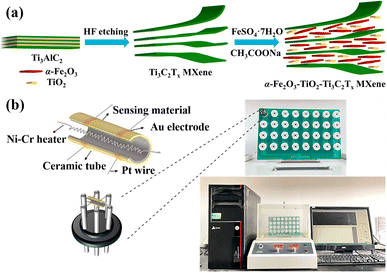
The preparation of the sensors was as follows: first, the appropriate sample powders and deionized water were mixed to form a paste. Then, the paste was brushed evenly on the Al2O3 ceramic surface. After drying at 160 °C for 10 h, the Al2O3 ceramic and the sensor base were welded together. Finally, the sensor was aged at 180 °C for 48 h before the test.The gas-sensitive performance was measured by a WS-30B gas-sensitive test system (Henan Weisheng Electronic Technology Co., Ltd, China), as shown in Fig. 1(b). The test system was composed of sensor resistance RS, load resistance RL, and current source VC, and the working temperature of the sensor was adjusted by changing the value of VH. By measuring the voltage Voutput at both ends of the load resistance, then the sensor resistance value can be obtained from formula (1).
 | (1) |
 | (2) |
The response value S can be calculated using the formula S = Ra/Rg, where Ra is the resistance value of the sensor in air and Rg is the resistance value of the sensor in the test gas.
Results and discussion
Structure and morphology
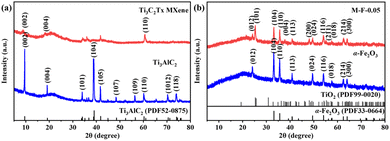
As shown in Fig. 2(a), the diffraction peak of Ti3AlC2 matched the standard card (JCPDS: 52-0875) without impurities. Comparing the XRD pattern of Ti3C2Tx MXene with Ti3AlC2, the impurity peaks were weakened, while the (002) peak for Ti3C2Tx MXene was shifted from 9.45° to 8.75°. The HF etching removed the Al layer and enlarged the layer spacing. These findings prove that Ti3C2Tx MXene was successfully synthesized.23 The α-Fe2O3 in Fig. 2(b) corresponded to the standard card (JCPDS: 33-0664). In the etching process of Ti3AlC2, HF removes its Al layer, then the Ti atoms in Ti3C2Tx are converted to Ti3+ under acidic conditions. These ions are then oxidized to TiO2 at Ti3C2Tx defects. The peaks (101), (004), (200), and (211) of M-F-0.05 were due to the oxidation of Ti3C2Tx MXene to TiO2 at 600 °C. The content of Ti3C2Tx MXene was low. So, the other peaks of M-F-0.05 were consistent with α-Fe2O3.19As shown in Fig. 3(a), the Ti3AlC2 surface layers fitted closely without stratification. After being etched by HF, Ti3AlC2 lost the middle Al layer and became an accordion-like structure for Ti3C2Tx MXene (Fig. 3(b)). α-Fe2O3 displayed a relatively thin sheet structure (Fig. 3(c)). When α-Fe2O3 and Ti3C2Tx MXene formed a complex, as shown in the M-F-0.05 SEM image of Fig. 3(d), α-Fe2O3 was evenly distribute on the surface of Ti3C2Tx MXene. The EDS element mapping images of M-F-0.05 are shown in Fig. 3(f). The Ti, O, Fe, and C elements were evenly distributed in the composite material, which indicated that the α-Fe2O3–TiO2-MXene composite material had been successfully synthesized.
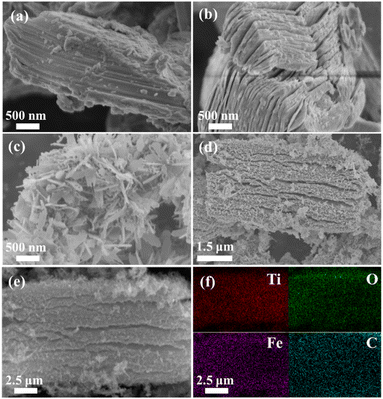 | ||
| Fig. 3 SEM characterization of (a) Ti3AlC2, (b) Ti3C2Tx MXene, (c) α-Fe2O3, (d) and (e) M-F-0.05. (f) EDS mapping for Ti, O, Fe, and C of M-F-0.05. | ||
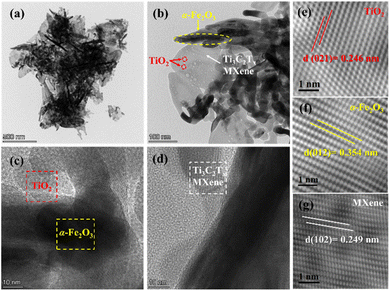
TEM and HRTEM images of M-F-0.05 were obtained. In Fig. 4(e), the observed lattice spacing of 0.246 nm corresponded to the (021) crystal surface of TiO2, as shown by red dotted rectangles (Fig. 4(b) and (c)). In Fig. 4(f), the lattice spacing of 0.354 nm corresponded to the (012) crystal surface of α-Fe2O3, as shown by the yellow dotted rectangles (Fig. 4(b) and (c)). In Fig. 4(g), the lattice spacing of 0.249 nm corresponded to the (102) crystal surface of Ti3C2Tx MXene, as shown by the white dotted rectangles (Fig. 4(b) and (d)).19,22 These results were consistent with the XRD results.
The XPS high-resolution spectra of α-Fe2O3 are shown in Fig. 5(a) and (b). Fig. 5(a) is the Fe 2p high-resolution spectra of α-Fe2O3. The peaks at binding energies of 723.9 and 710.2 eV were attribute to Fe 2p1/2 and Fe 2p3/2, respectively. The satellite peaks centered around 725.3 and 718.2 eV were from Fe3+, indicating the successful synthesis of α-Fe2O3.24 Fig. 5(b) presents the O 1s spectrum, which was mainly divided into three peaks, with peaks at binding energies of 531.7, 530.6, and 529.1 eV, corresponding to H–O–H, Fe–OH, and Fe–O bonds, respectively.25
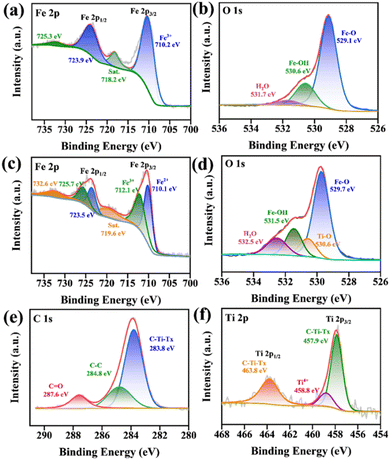 | ||
| Fig. 5 XPS spectra of α-Fe2O3 (a) Fe 2p and (b) O 1s. XPS spectra of M-F-0.05 heterojunction: (c) Fe 2p, (d) O 1s, (e) C 1s, and (f) Ti 2p. | ||
The XPS high-resolution spectra of the M-F-0.05 heterojunction are shown in Fig. 5(c)–(f). Fig. 5(c) shows the high-resolution spectrum of Fe 2p of M-F-0.05. The peaks at binding energies of 723.9 and 710.4 eV corresponded to Fe 2p1/2 and Fe 2p3/2, respectively, while those at 710.1 and 723.5 eV were attributed to Fe2+, at 712.1 and 725.7 eV to Fe3+, and 719.6 and 732.6 eV to the satellite peaks of Fe3+.26 Fig. 5(d) is the high-resolution O 1s spectrum of M-F-0.05 heterojunction. The peaks at binding energies of 532.5, 531.5, 530.6, and 529.7 eV corresponded to H–O–H, Fe–OH, Ti–O, and Fe–O bonds, respectively.27,28 Fig. 5(e) shows the C 1s high-resolution spectrum of M-F-0.05. The peaks at binding energies of 287.6, 284.8, and 283.8 eV were attributed to C![[double bond, length as m-dash]](https://www.rsc.org/images/entities/char_e001.gif) O, C–C, and C–Ti–Tx, respectively.29 Fig. 5(f) shows the Ti 2p high-resolution spectrum of M-F-0.05, which could be divided into Ti 2p3/2 (457.9 eV) and Ti 2p1/2 (463.8 eV). The peaks at binding energies of 463.8, 458.8, and 457.9 eV were attributed to C–Ti–Tx, Ti4+, and C–Ti–Tx bonds, respectively.30 The presence of Ti4+ indicated that TiO2 was generated in the hydrothermal process, which was consistent with the results of the XRD analysis above.
O, C–C, and C–Ti–Tx, respectively.29 Fig. 5(f) shows the Ti 2p high-resolution spectrum of M-F-0.05, which could be divided into Ti 2p3/2 (457.9 eV) and Ti 2p1/2 (463.8 eV). The peaks at binding energies of 463.8, 458.8, and 457.9 eV were attributed to C–Ti–Tx, Ti4+, and C–Ti–Tx bonds, respectively.30 The presence of Ti4+ indicated that TiO2 was generated in the hydrothermal process, which was consistent with the results of the XRD analysis above.
Gas-sensitive performance
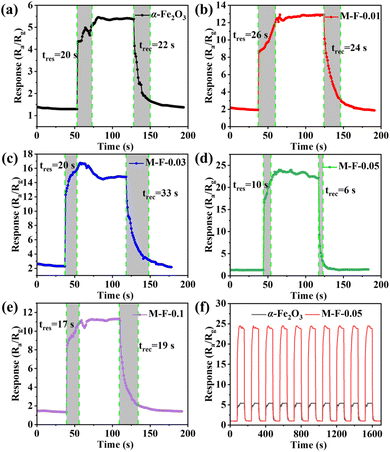
The operating temperature has a huge impact on the sensor. The lower the temperature, the fewer electrons/holes and the slower the migration rate in the gas-sensitive materials, and the response value is then low or there is even no response. Higher temperature excites more electrons and leads to a faster migration rate of electrons and holes, and so the activity of gas-sensitive materials is increased, and the response value increases accordingly. Too high an operating temperature will accelerate desorption of the gas, which is equivalent to reducing the gas adsorbed on the surface of the material, and the response value will then be reduced. Therefore, we first explored the relationship between the operating temperatures and the gas-sensing performance.31,32 The gas-response values of α-Fe2O3, M-F-0.01, M-F-0.03, M-F-0.05, and M-F-0.1 to 50 ppm acetone at different temperatures (50 °C, 80 °C, 100 °C, 150 °C, 200 °C, and 250 °C) are shown in Fig. 6(a). The best working temperature of the sensor was 150 °C. Moreover, with the increase in Ti3C2Tx MXene content, α-Fe2O3–TiO2-MXene had more heterojunctions. The sensors based on M-F-0.05 showed the maximum response values at each temperature. However, the sensor based on M-F-0.1 had the smaller response values. This was possibly because excessive Ti3C2Tx MXene addition will lead to a stacking of the sheets, which reduces the adsorption sites and affects the gas-sensitive response of the composite.33 Each group of experiments above tested three groups of gas sensors under the same experimental conditions, and the mean value and standard deviation were taken, and then the error bar was obtained, which represents the label difference, while the length of the error bar also represents the degree of data dispersion. The same was true for the subsequent gas-sensitivity tests. Fig. 6(b) presents the dynamic response curve of the sample to different concentrations of acetone gas at 150 °C. The response value increased with the increasing acetone concentration. The response of M-F-0.05 to 50 ppm acetone was 24, while that of α-Fe2O3 was 5.3.The response/recovery curves of different samples to different concentrations of acetone gas at 150 °C are shown in Fig. 7(a)–(e). Under the same test conditions, sensor M-F-0.05 had the shortest response/recovery time and the largest response value (10 s/6 s). Repeatability testing of α-Fe2O3 and M-F-0.05 in 50 ppm acetone gas at 150 °C was carried out (Fig. 7(f)). The results showed they all had good repeatability.
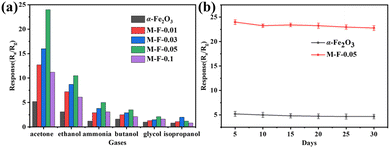
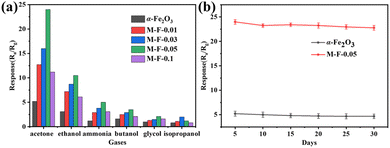
Selectivity is also one of the main properties of gas sensors. The sensors were tested with 50 ppm of different gases (acetone, ethanol, ammonia, n-butanol, ethylene glycol, and isopropyl alcohol) at 150 °C, and the results are shown in Fig. 8(a). M-F-0.05 had the better response to acetone gas compared to the other gases. From the stability tests of α-Fe2O3 and M-F-0.05 in 50 ppm acetone gas at 150 °C for 30 days, as shown in Fig. 8(b), M-F-0.05 also demonstrated good stability. Table 1 shows a comparison of the acetone responses between the M-F-0.05 sensor and some relevant reports. The sensor based on M-F-0.05 exhibited a relatively higher acetone response with a lower working temperature, confirming our sensor is a promising candidate for acetone detection with low power consumption.
| Sensing materials | Preparation method | Temperature (°C) | Concentration (ppm) | S (Ra/Rg) | Res./Rec. time (s) | Ref. |
|---|---|---|---|---|---|---|
| a Res./Rec. Time-response/recovery time. | ||||||
| α-Fe2O3 | Hydrothermal | 400 | 100 | 13.1 | 3/108 | 12 |
| α-Fe2O3 | Azeotropic distillation | 340 | 100 | 9.1 | — | 34 |
| α-Fe2O3/CuFe2O4 | Template | 275 | 100 | 14 | — | 35 |
| α-Fe2O3/SnO2 | Hydrothermal | 280 | 200 | 16.8 | 5/23 | 36 |
| ZnFe2O4/Ag | Hydrothermal | 175 | 100 | 33.4 | 17/148 | 37 |
| α-Fe2O3/SiO2 | Sol–gel | 290 | 500 | 50.2 | 14/7 | 38 |
| Ce-α-Fe2O3 | Oil bath | 220 | 100 | 26.3 | 7/80 | 14 |
| ErFeO3/α-Fe2O3 | Impregnation | 250 | 100 | 55 | 9/123 | 39 |
| Pt-Fe2O3 | Hydrothermal | 139 | 100 | 25.7 | 3/22 | 40 |
| α-Fe2O3/TiO2@Ti3C2Tx | Hydrothermal | 220 | 100 | 34.66 | 10/7 | 41 |
| α-Fe2O3–TiO2-MXene | Precipitation | 150 | 50 | 24 | 10/6 | This work |
Gas-sensing mechanism
The gas-sensitive response of the sensing material is affected by the chemical adsorption of oxygen on the semiconductor surface and the chemical reaction of the gas molecules to be measured.42 The α-Fe2O3–TiO2-MXene gas sensor showed n-type semiconductor characteristics when testing acetone. Here, the oxygen in the air will be adsorbed on its surface, trapping the electrons in its conduction band to generate chemisorbed oxygen (O2−), resulting in a widening of the electron depletion layer and increase in the resistance value of the material.43,44 Ti3C2Tx MXene with metallic properties has a work function of 4.37 eV. TiO2 has a work function of 4.6 eV. After contacting, the electrons in the Ti3C2Tx MXene conduction band will be transferred to the TiO2 conduction band until their Fermi levels reach equilibrium. A Schottky barrier will form at the interface between Ti3C2Tx MXene and TiO2. The work function of α-Fe2O3 is 5.9 eV, therefore when it contacts with Ti3C2Tx MXene-TiO2 heterojunction, electrons will be transferred from the Ti3C2Tx MXene-TiO2 heterojunction to α-Fe2O3, and then another heterojunction will form between the Ti3C2Tx MXene-TiO2 heterojunction and α-Fe2O3. In acetone, acetone molecules are oxidized by oxygen ions (O−) and release electrons into the conduction band of α-Fe2O3–TiO2-MXene, causing the electron depletion layer to narrow, thus further reducing the resistance value of the material, which plays a crucial role in improving the gas-sensitive performance. The whole reaction process is shown in eqn (3)–(6).21,45 The reaction mechanism diagram is shown in Fig. 9.| O2 (gas) → O2 (ads) | (3) |
| O2 (ads) + e− → O2− (ads) | (4) |
| O2− (ads) + e− → 2O− (ads) | (5) |
| CH3COCH3 (gas) + 8O− (ads) → 3CO2 (ads) + 3H2O + 8e− | (6) |
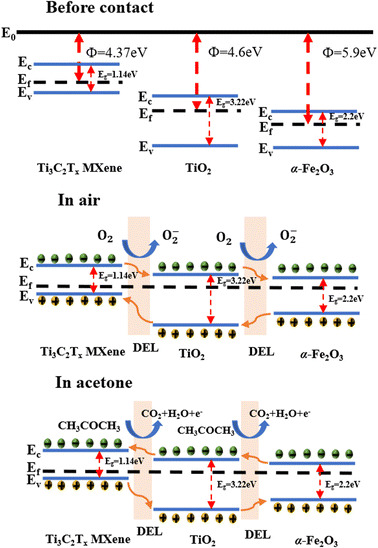 | ||
| Fig. 9 Schematic of the gas-sensing mechanism of the α-Fe2O3–TiO2-MXene heterojunction-based sensor. | ||
Conclusions
α-Fe2O3–TiO2-MXene heterojunctions were successfully prepared by a simple precipitation method. The gas sensor based on them showed good responses value for 24 to 50 ppm acetone at 150 °C, which was more than a-quarter that of pure α-Fe2O3 (5.3). It also had a shorter response/recovery time (10 s/6 s) and a better stability. The enhanced gas sensitivity of the α-Fe2O3–TiO2-MXene gas sensor may be mainly due to two reasons. (1) The α-Fe2O3–TiO2-MXene heterojunction could improve the electron-transfer efficiency. (2) The α-Fe2O3–TiO2-MXene heterojunction has a larger specific surface area with more active sites for gas-sensitive reactions. This article provides an idea for developing excellent acetone sensor-sensitive materials. However, the optimal working temperature needs to be further reduced.Data availability
Data for this article are available from the Open Science Framework at https://osf.io/jt7yg.Author contributions
Conceptualization, Y. Chen and Z. Y. Yang; validation, Y. Chen and Z. Y. Yang; writing—original draft, Y. Chen and Z. Y. Yang; writing—review & editing, Y. Chen and Z. Y. Yang; visualization, Y. Chen; supervision, Y. Chen. All authors have read and agreed to the published version of the manuscript.Conflicts of interest
There are no conflicts to declare.Acknowledgements
This research was funded by the China-Africa Partner Research Institute Exchange Project “China-South Africa Advanced Photovoltaic Hydrogen Energy System Research Center”, and the National “111 Research Center” for Microelectronics and Integrated Circuits.References
- Y.-N. Wang, L. Qin, Z. Yuan, J. Li and F. Meng, Sens. Actuators, B, 2024, 418, 136283 CrossRef CAS.
- S. Thangavel, D. Pattappan, P. Subramaniam, S. Srinivasan, S. Madanagurusamy, K. Krishnasamy, Y.-T. Lai and K. Udayar, Ceram. Int., 2024, 50, 36512–36520 CrossRef CAS.
- W. Zhang, Y. Xian, B. Cheng, R. Han, Y. Zhang and J. Xiang, Ceram. Int., 2024, 50, 34027–34036 CrossRef CAS.
- L. Zhang, F. Li, Y. Yang, D. Li, H. Yu, X. Dong and T. Wang, Chem. Eng. J., 2024, 499, 156604 CrossRef CAS.
- R. Xavier, L. Thirumalaisamy, S. Madhanagurusamy and K. Sivaperuman, Ceram. Int., 2024, 50, 969–976 CrossRef CAS.
- P. Song and T. Wang, ACS Sens., 2022, 7, 3634–3643 CrossRef CAS PubMed.
- L. Zhang, J. Tian, Y. Wang, T. Wang, M. Wei, F. Li, D. Li, Y. Yang, H. Yu and X. Dong, Sens. Actuators, B, 2024, 410, 135728 CrossRef CAS.
- C. Li, P. G. Choi, K. Kim and Y. Masuda, Sens. Actuators, B, 2022, 367, 132143 CrossRef CAS.
- L. Fu, D. Li and W. Tang, J. Alloys Compd., 2023, 960, 170648 CrossRef CAS.
- T. K. Dang, N. D. Cuong, H. V. M. Hai, T. Q. Phuong, L. L. Son, D. T. T. Nhan, V. V. Tan, M. D. Hien, K.-J. Jeon, N. Q. Hung, L. A. Tuyen and N. V. Hieu, Sens. Actuators, B, 2023, 383, 133573 CrossRef CAS.
- H. Wang, Y. Luo, K. Li, B. Liu, L. Gao and G. Duan, Chem. Eng. J., 2022, 427, 131631 CrossRef CAS.
- A. Umar, A. A. Ibrahim, R. Kumar, H. Albargi, M. A. Alsaiari and F. Ahmed, Sens. Actuators, B, 2021, 326, 128851 CrossRef CAS.
- S. Kumar, M. Hojamberdiev, A. Chakraborty, R. Mitra, R. Chaurasiya, M. Kwoka, C. S. Tiwary, K. Biswas and M. Kumar, ACS Appl. Nano Mater., 2024, 16, 16687–16698 CrossRef CAS PubMed.
- X. Wang, T. K. Wang, G. K. Si, Y. Li, S. W. Zhang, X. L. Deng and X. J. Xu, Sens. Actuators, B, 2020, 302, 127165 CrossRef CAS.
- N. Dhariwal, M. Chahar, V. Kumar and O. P. Thakur, Sens. Actuators, B, 2023, 390, 134037 CrossRef CAS.
- M. Das, A. K. Shringi and M. Kumar, IEEE Sens. J., 2022, 22, 19183–19190 CAS.
- J. Bian, Y. Zhang, M. Tang, Z. Wang, Q. Chen and D. Zhang, IEEE Sens. J., 2024, 24, 7456–7462 CAS.
- J. Tang, H. Wang, W. Dong, H. Yang, X. Wang, X. Guo and D. Zeng, Ceram. Int., 2024, 50, 14151–14160 CrossRef CAS.
- S. Li, L. Yu, Y. Zhang, C. Zhang, L. Cao, N. Nan, X. Fan and H. Wang, Sens. Actuators, B, 2024, 413, 135890 CrossRef CAS.
- D. Zhang, J. Jiang, T. Wang, F. Li, H. Yu, X. Dong and Y. Yang, Sens. Actuators, B, 2024, 421, 136543 CrossRef CAS.
- X. Song, T. Liu, K. Gu, Z. Luo and M. Zhang, J. Alloys Compd., 2024, 976, 173153 CrossRef CAS.
- M. Liu, R.-Y. Sun, Y.-L. Ding, Q. Wang and P. Song, ACS Appl. Nano Mater., 2023, 6, 11856–11867 CrossRef CAS.
- X. Xu, W. Ma, H. Jiang, X. Wang, W. Liu, M. Wang, G. Sun, N. Ma, S. Ma, J. Wang and G. Chang, Sens. Actuators, B, 2025, 422, 136595 CrossRef CAS.
- M. Liu, J. Ji, P. Song, J. Wang and Q. Wang, J. Alloys Compd., 2022, 898, 162812 CrossRef CAS.
- N. D. Cuong, V. H. Sinh, D. T. Quang, L. T. Hoa, V. V. Tan, H. D. Mai, K.-J. Jeon, P. H. Phuoc and N. V. Hieu, Curr. Appl. Phys., 2024, 59, 153–164 CrossRef.
- P. S. Bagus, C. J. Nelin, C. R. Brundle, B. V. Crist, N. Lahiri and K. M. Rosso, Phys. Chem. Chem. Phys., 2022, 24, 4562–4575 RSC.
- A. Vijaykumar, A. Mondal, S. Deb, B. Ajitha and Y. A. K. Reddy, Appl. Surf. Sci., 2024, 670, 160664 CrossRef CAS.
- Y. Qin, Y. Zhang, P. Qiu and S. Lei, Sens. Actuators, B, 2025, 422, 136521 CrossRef CAS.
- W. Waheed, S. Anwer, M. U. Khan, M. Sajjad and A. Alazzam, Chem. Eng. J., 2024, 480, 147981 CrossRef CAS.
- Q. T. H. Ta, A. Sreedhar, N. N. Tri and J.-S. Noh, Ceram. Int., 2024, 50, 27227–27236 CrossRef CAS.
- L. Zhang, T. Wang, Y. Yang, M. Wei, F. Li, H. Yu and X. Dong, J. Alloys Compd., 2024, 977, 173430 CrossRef CAS.
- P. Li, Y. Yang, F. Li, W. Pei, D. Li, H. Yu, X. Dong and T. Wang, Sens. Actuators, B, 2025, 426, 137111 CrossRef CAS.
- S. B. Sun, M. W. Wang, X. T. Chang, Y. C. Jiang, D. Z. Zhang, D. S. Wang, Y. L. Zhang and Y. H. Lei, Sens. Actuators, B, 2020, 304, 127274 CrossRef CAS.
- S. Liang, J. P. Li, F. Wang, J. L. Qin, X. Y. Lai and X. M. Jiang, Sens. Actuators, B, 2017, 238, 923–927 CrossRef CAS.
- X. Li, D. Lu, C. Shao, G. Lu, X. Li and Y. Liu, Sens. Actuators, B, 2018, 258, 436–446 CrossRef CAS.
- M. Liu, P. Song, Z. Yang and Q. Wang, Ceram. Int., 2021, 47, 12181–12188 CrossRef CAS.
- C. Zhang, Q. Wu, B. Zheng, J. You and Y. Luo, Ceram. Int., 2018, 44, 20700–20707 CrossRef CAS.
- W. Ge, X. Zhang, X. Ge and K. Liu, Mater. Res. Bull., 2021, 141, 111379 CrossRef CAS.
- F. Liu, P. Li, J. Li, J. Shi and X. Gao, Ceram. Int., 2024, 50, 23721–23732 CrossRef CAS.
- S. D. Zhang, M. J. Yange, K. Y. Liang, A. Turak, B. X. Zhang, D. Meng, C. X. Wang, F. D. Qu, W. L. Cheng and M. H. Yang, Sens. Actuators, B, 2019, 290, 59–67 CrossRef CAS.
- Z. Zhao, Z. Lv, Z. Chen, B. Zhou and Z. Shao, Sensors, 2024, 24, 2604 CrossRef CAS PubMed.
- J. Ding, Z. Luo, Y. Sun, B. Ren, S. Fu, Y. Yang, J. Cui, X. Wang and J. Yue, J. Alloys Compd., 2024, 1003, 175736 CrossRef CAS.
- S. Wang, Q. Liu, J. Shao, G. Pan, Y. Qi and M. Qiu, J. Alloys Compd., 2025, 1010, 177358 CrossRef CAS.
- S. M. H. Bagherzadeh Enferadi and A. Mirzaei, Ceram. Int., 2024, 50, 52861–52870 CrossRef CAS.
- J. Lee, H. Kim, M. Hilal and Z. Cai, Solid State Sci., 2024, 156, 107683 CrossRef CAS.
| This journal is © The Royal Society of Chemistry 2025 |

