DOI:
10.1039/D4RA08590F
(Paper)
RSC Adv., 2025,
15, 655-664
Unlocking advanced thermometric capabilities: BiVO4: Er3+/Yb3+ nanophosphors with dual-mode up-conversion and down-shifting features
Received
5th December 2024
, Accepted 27th December 2024
First published on 8th January 2025
Abstract
Luminescent materials doped with rare-earth (RE) ions have emerged as powerful tools in thermometry, offering high sensitivity and accuracy. However, challenges remain, particularly in maintaining efficient luminescence at elevated temperatures. This study investigates the thermometric properties of BiVO4: Yb3+/Er3+ (BVO: Er/Yb) nanophosphors synthesized via the sol–gel method. Structural, morphological, and optical analyses confirm the high purity and monoclinic crystal structure of the materials. Dual-mode luminescence under UV and near-infrared (NIR) excitation is explored, revealing complex thermal dynamics. The distinct performances of these luminescent thermometers, in terms of thermal sensitivity and temperature uncertainty, were evaluated in the non-saturation regime in both down-shifting (DS) and up-conversion (UC) processes. Utilizing fluorescence intensity ratio (LIR) measurements, we quantified absolute and relative sensitivities, as well as temperature uncertainties, over a temperature range of 300–450 K. Temperature sensing was based on the LIR of green emission bands arising from the thermally coupled 2H11/2 → 4I15/2 and 4S3/2 → 4I15/2 transitions of Er3+. The maximum absolute sensitivity (Sa) reached 60 × 10−4 K−1 at 388 K under 975 nm excitation (UC) and 56 × 10−4 K−1 at 400 K under 325 nm excitation (DS). Notably, for both excitation modes, the relative sensitivity (Sr) decreased consistently with increasing temperature, peaking at 0.908% K−1 and 0.87% K−1 at 300 K, and gradually declining to 0.4% K−1 and 0.39% K−1 at 450 K for the DS and UC processes, respectively. Temperature resolution (δT) also varied with temperature, increasing from 0.55 K to 1.23 K as the temperature rose from 300 to 450 K under 325 nm excitation. A comparable trend was observed for δT under 975 nm excitation. These findings underscore the potential of BVO: Er/Yb nanophosphors as versatile and effective luminescent thermometers for a broad range of applications.
1. Introduction
In recent years, there has been a surge in interest in the development and exploration of new phosphor materials due to their diverse applications in display devices, solar cells, temperature sensors, bioimaging, and more. These materials possess the remarkable ability to convert short-wavelength light into longer-wavelength light, including the ability to convert absorbed higher-energy photons into two lower-energy photons, known as the down-shifting (DS) process when an appropriate mix of Ln3+ dopants is selected.1–5 Conversely, the reverse process, known as up-conversion (UC), is also achievable, wherein two or more photons in the IR or NIR range may be converted to photons of higher energy. Materials that exhibit both DS and UC properties, termed dual-mode luminescence, are particularly intriguing yet exceedingly rare.
Luminescent thermometers, primarily based on spectroscopic parameters, have garnered significant attention due to their excellent accuracy, high sensitivity, and rapid response. The LIR thermometry method is recognized as a promising approach for optical temperature measurement as compared to other optical temperature sensing techniques, owing to its independence from external factors, such as spectral loss and fluctuations in excitation power.6–9 The LIR technique has demonstrated remarkable anti-interference capabilities and enhanced sensitivity, particularly in temperature measurements in electromagnetic and adverse environments, such as building fire detection, micro/nano-scale detection, and biomedical imaging systems.10–14 Typically, the LIR technique relies on the luminescence emission from thermally coupled levels (TCL) of RE, which holds significant potential, especially in challenging environments like oil refineries and coal mines.15–17 Much of the research has focused on Er3+-activated detection materials, which can exhibit intense luminescence, especially with the assistance of Yb3+ sensitizers.18–21 Optical temperature sensing is commonly achieved through the green emissions of suitable TCLs, such as 2H11/2 and 4S3/2 in Er3+.22,23 Understanding the variation in LIR with temperature is crucial for practical detection applications.
The effectiveness of up-conversion emission intensity in optical thermometry hinges significantly on the host material's characteristics. Glasses and fluorides, commonly used for temperature sensors, exhibit substantial emission signals even under low excitation power.24–27 However, their limited stability impedes widespread commercialization, with glasses additionally restricted by their transition temperature.28 Composite materials incorporating nanocrystals in glass-ceramics offer improved stability but suffer from reduced thermal sensitivity.29,30 BiVO4 host presents a promising solution due to their efficient NIR to visible up conversion properties,31,32 and excellent stability even at temperatures up to 800 °C.
Indeed, BiVO4 is a low-symmetry host with a highly asymmetric crystal field surrounding the dopant.33 This crystal field facilitates efficient 4f–f transitions in Ln3+ dopant ions, thus enhancing the up-conversion emission. The layered structure of BiVO4 contains cations with formal oxidation states of Bi3+ (6s2) and V5+ (3d0) coordinated with O−2 (2p6), alongside with a slight crystal structure distortion.34 These characteristics not only promote weak hole-localization and electron–hole pair separation but also contribute to high up conversion emission efficiencies. BiVO4 meets these criteria with moderately low phonon energy, minimizing non-radiative losses, and maximizing radiative emission. Thus, BiVO4 shows promise as a potential up conversion host material.32,35,36 This material has already been explored for luminescence thermometry with promising performance improvements.37–39 However, the effects of excitation on the up conversion (UC) and down shifting (DS) processes have not yet been investigated. In this study, Er3+/Yb3+ codoped BiVO4 phosphors were prepared via a sol–gel method. We investigated the optical temperature sensing properties through up-conversion (UC) and down-shifting (DS) processes. Comparisons were made regarding the performance of BVO: Er/Yb nanophosphors in luminescence thermometric applications under DS (325 nm) and UC (975 nm) excitations.
2. Synthesis and characterization
The sol gel method was used to prepare pure and Yb/Er codoped BiVO4 powders, in which Er2O3 (99.99%), Yb2O3 (99.99%) and analytical grade reagents (A.R.): ammonium metavanadate (NH4VO3), nitric acid (HNO3), citric acid, bismuth nitrate [Bi (NO3)3–9H2O], were served as the raw materials with mole ratio of 1![[thin space (1/6-em)]](https://www.rsc.org/images/entities/char_2009.gif) :1 in ethanol at 70 °C for 1 hour. The obtained sol was changed to the yellow gel after addition of deionized water and acetic acid. The yellow gel was dried at 100 °C for 48 h and calcined at 400–600 °C for 2 h. The phase purity of BiVO4 powder was studied by X-ray diffraction (XRD). The morphology of BiVO4 powder was investigated by scanning electron microscopy (SEM) using a Scanning Electron Microscope FEI Quanta 250 FEG. Absorption spectra were collected using a Lambda 365 UV-vis spectrometer (PerkinElmer) in the 200–1100 nm range. The UC photoluminescence (PL) spectra were measured by using a 975 nm InGaAs/GaAs laser diode as the excitation source, with the HORIBA Jobin Yvon Fluorolog-3 Spectrofluorometer system. The Raman spectra and the DS photoluminescence (PL) spectra were recorded under excitation with a He–Cd laser (325 nm) with a Labram UV-HR 800 Raman spectrometer from Horiba-Jobin Yvon using a low dispersion 150 g mm−1 grating. Through 325 nm and 975 nm diode laser excitations at constant pump power of 30 mW the emission spectra were recorded on monochromator (Horiba Jobin Yvon, iHR320) spectrometer. The monochromator uses an 1800 g per mm grating blazed at 500 nm and a photomultiplier tube (Hamamatsu, R928) to measure luminescence in the green (520–570 nm) emission bands. The chemicals and equipment were procured from suppliers through the facilities at the University of Valladolid, Spain, and the University of Sfax, Tunisia.
:1 in ethanol at 70 °C for 1 hour. The obtained sol was changed to the yellow gel after addition of deionized water and acetic acid. The yellow gel was dried at 100 °C for 48 h and calcined at 400–600 °C for 2 h. The phase purity of BiVO4 powder was studied by X-ray diffraction (XRD). The morphology of BiVO4 powder was investigated by scanning electron microscopy (SEM) using a Scanning Electron Microscope FEI Quanta 250 FEG. Absorption spectra were collected using a Lambda 365 UV-vis spectrometer (PerkinElmer) in the 200–1100 nm range. The UC photoluminescence (PL) spectra were measured by using a 975 nm InGaAs/GaAs laser diode as the excitation source, with the HORIBA Jobin Yvon Fluorolog-3 Spectrofluorometer system. The Raman spectra and the DS photoluminescence (PL) spectra were recorded under excitation with a He–Cd laser (325 nm) with a Labram UV-HR 800 Raman spectrometer from Horiba-Jobin Yvon using a low dispersion 150 g mm−1 grating. Through 325 nm and 975 nm diode laser excitations at constant pump power of 30 mW the emission spectra were recorded on monochromator (Horiba Jobin Yvon, iHR320) spectrometer. The monochromator uses an 1800 g per mm grating blazed at 500 nm and a photomultiplier tube (Hamamatsu, R928) to measure luminescence in the green (520–570 nm) emission bands. The chemicals and equipment were procured from suppliers through the facilities at the University of Valladolid, Spain, and the University of Sfax, Tunisia.
3. Results and discussions
3.1. X-ray diffraction and morphological analysis
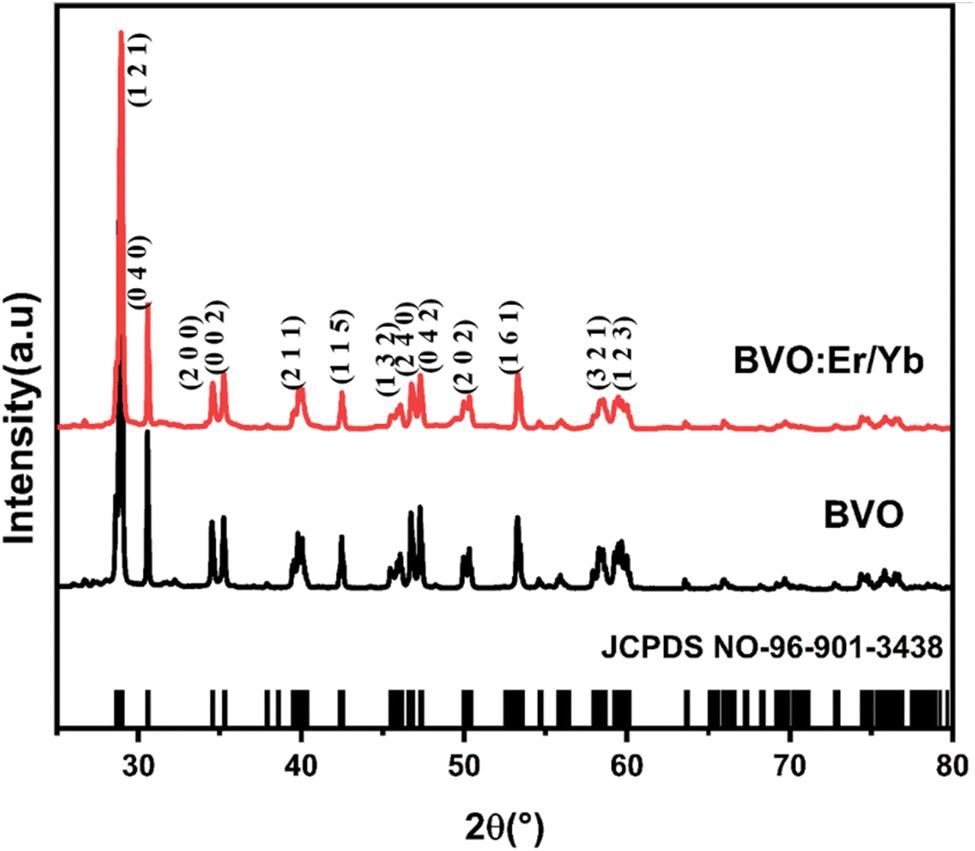
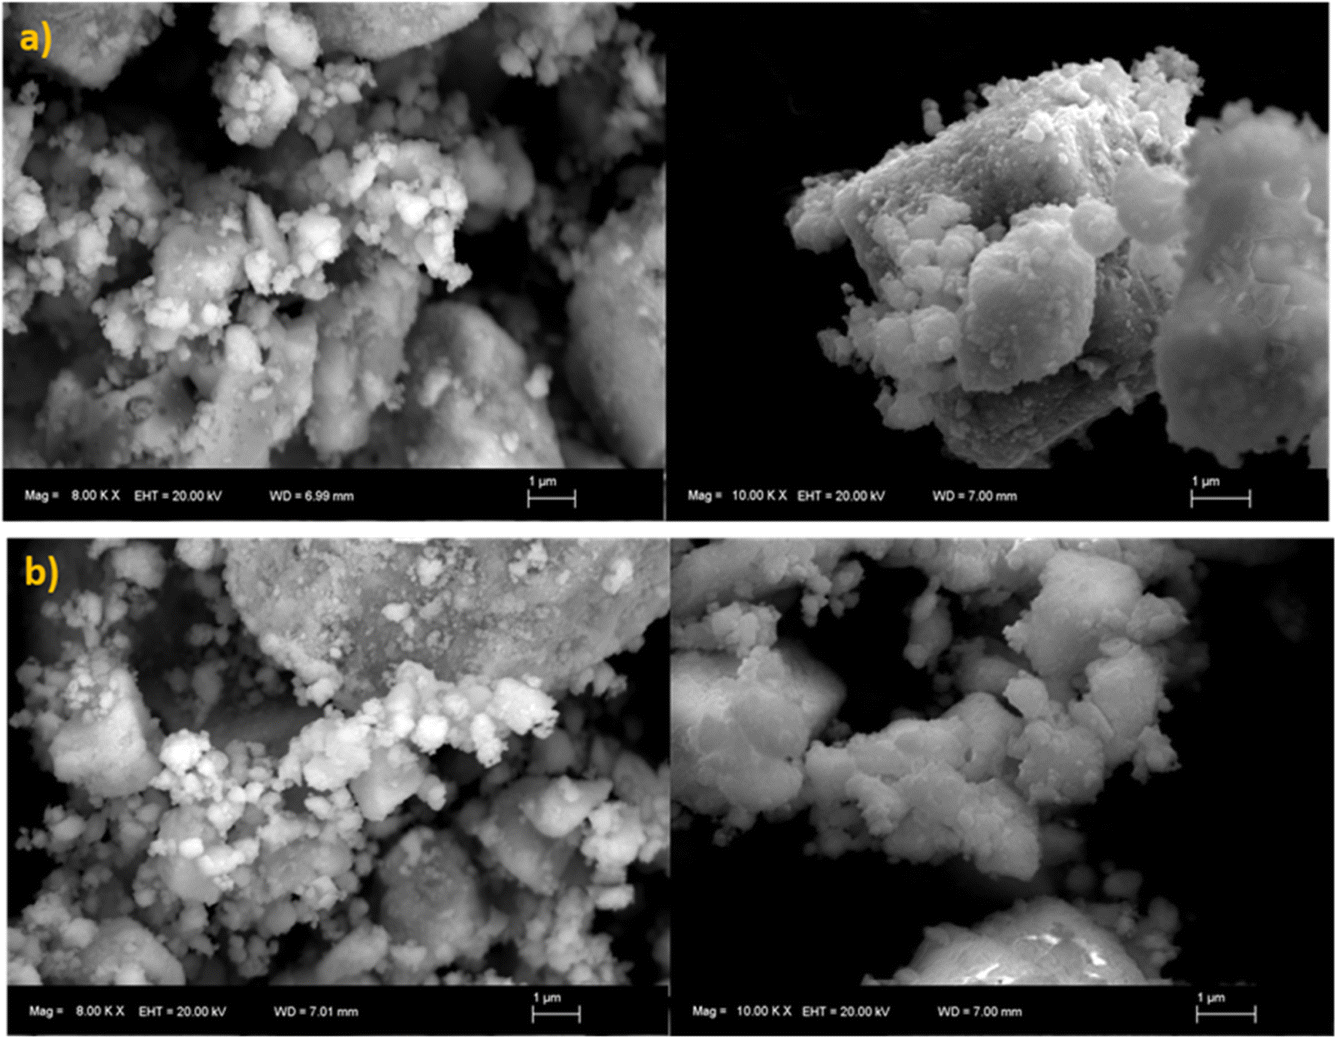
The X-ray diffraction (XRD) pattern was registered using a Bruker AXS D8 Advance diffractometer in Bragg–Brentano geometry (2θ range from 20° to 80°) with CuKα1 radiation (λ = 1.5406 Å). The XRD patterns of samples BVO and BVO: Yb/Er display sharp diffraction peaks as depicted in Fig. 1, which indicates the high crystallinity of these samples. The diffraction peaks of the BVO and BVO: Yb/Er samples agree well with the monoclinic structure of BVO (JCPDS#96-901-3438). This monoclinic host structure provides a highly asymmetric crystal field around the Ln3+ ions, which should favor the 4f → 4f transitions. Moreover, the diffraction peak of the Ln3+ doped sample moves to a higher angle direction compared to the standard card (JCPDS#96-901-3438).40,41 This shift is caused by the substitution of Bi3+ (ionic radius1.03 Å) with Yb3+ (0.858 Å) and Er3+ (1.004 Å) doped ions. Thus, revealing the successful incorporation of Yb3+ and Er3+ into the BiVO4. The surface morphology of the particles in the prepared BVO undoped and doped Er/Yb were studied with SEM micrographs and presented in Fig. 2(a) and (b) respectively. A spherical structure is observed, and the particles have uniform shapes and regular sizes. The average size of particles is about 1 μm.
 |
| | Fig. 1 XRD patterns of pure BVO and BVO: Er/Yb samples. The corresponding standard JCPDS card data of BVO (JCPDS##96-901-3438) is given as a reference. | |
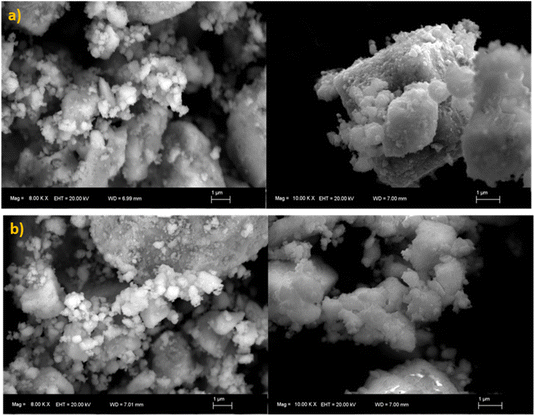 |
| | Fig. 2 (a) and (b) The SEM images of the BVO pure and BVO doped Er/Yb samples, respectively. | |
3.2. Raman studies
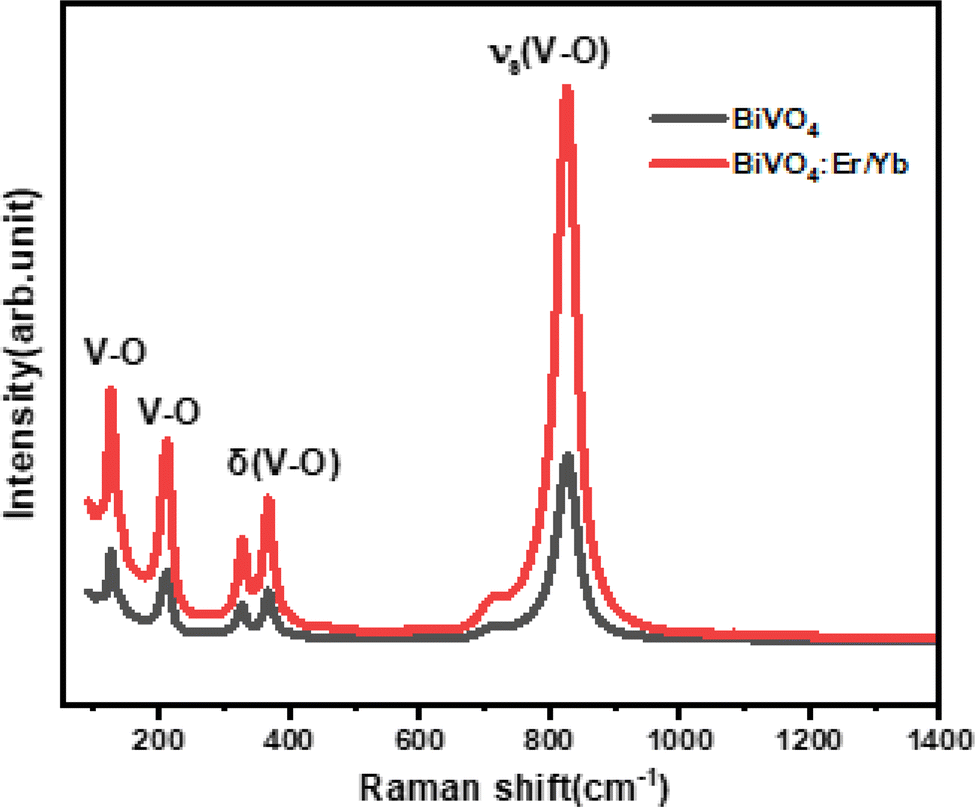
Fig. 3 displays the Raman spectra of BVO pure and doped with Er3+/Yb3+ excited with 532 nm (doubled YAG laser) at a resolution of 2 cm−1 in the range 150–1400 cm−1. We can clearly see that the two spectra are similar, confirming the absence of structural changes by an incorporation of Er3+/Yb3+ into the host BVO. The peak at 828 cm−1 is assigned to the V–O symmetric stretching vibration (υs),42 whereas the peak at 366 cm−1 is attributed to the bending vibration of the VO4−3 group (δ).43 The peak at 329 cm−1 corresponds to the symmetric V–O bending mode. Other bands peaking at 213 cm−1 and 127 cm−1 are combined with external modes of the VO4−3 group.44 These Raman peaks are the typical vibrational bands of BVO.
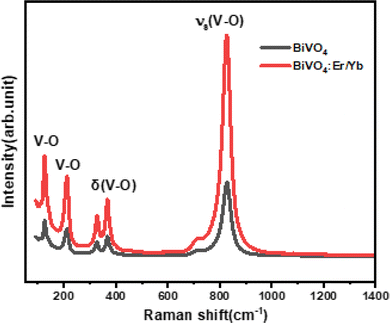 |
| | Fig. 3 Raman spectra of pure BVO and BVO: Er/Yb samples. | |
3.3. UV-visible spectroscopy
Fig. 4(a) display the UV-vis-NIR diffuse reflectance spectra of pure BVO as well as Yb3+/Er3+ codoped BVO samples. There are two sharp absorption bands seen in both the undoped and Yb3+/Er3+ doped samples at 260 and 314 nm which are due to the charge transfer band (CTB) between V5+ and O2−. These strong absorption bands in the UV window are caused by the Vanadate (VO4)3− group which acts as a self-activating host.45 In addition to these broad CTB bands, there are also a few peaks observed in the Er3+/Yb3+ codoped samples at 649 and 720 nm due to transitions from the 4I15/2 ground state to different excited states, namely 4F9/2 and 4I9/2 of the Er3+ ions, respectively, as shown in Fig. 4. The absorption peaks around 980 nm of the BVO: Er/Yb sample is assigned to the 2F7/2 → 2F5/2 transition of the Yb3+ ion.
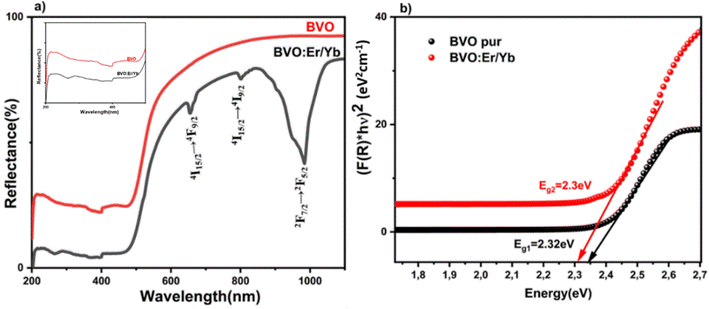 |
| | Fig. 4 (a) UV-vis-NIR diffuse reflectance spectra (inset spectra from 200–500 nm region), (b) the plot of gap energy of pure BVO and BVO: Er/Yb samples. | |
The sharp absorption intensity observed at 980 nm is indicative of the strong absorption cross-section of Yb3+ ions in this spectral region. The doping concentration of Yb3+ ions play a critical role in determining the intensity and sharpness of this absorption feature. At lower doping concentrations, the 980 nm absorption peak remains sharp and well-defined due to minimal ion–ion interactions. However, at higher doping levels, enhanced ion interactions can lead to a broadening or slight diminution in sharpness, altering the spectroscopic behavior. This concentration-dependent variation underscores the importance of optimizing Yb3+ ion doping for specific applications. In addition, the Kubelka–Munk function can be applied to determine the band gap size which can be expressed as follows eqn (1):
| | |
((F(R)hϑ)n) = B(hϑ − Eg)
| (1) |
where
hυ is the incident photon energy,
C is a constant of proportionality and
Eg is the band gap (eV).
Fig. 4(b) shows the evolution of (
F(
R)
hυ)
2 as a function of
hυ. The
Eg values are estimated as 2.32 eV and 2.3 eV for BVO pure and BVO: Yb
3+/Er
3+, respectively. This large band gap of the host effectively accommodates the energy levels of the dopant ions to produce luminescence.
4. UC and DS luminescent properties of NPs
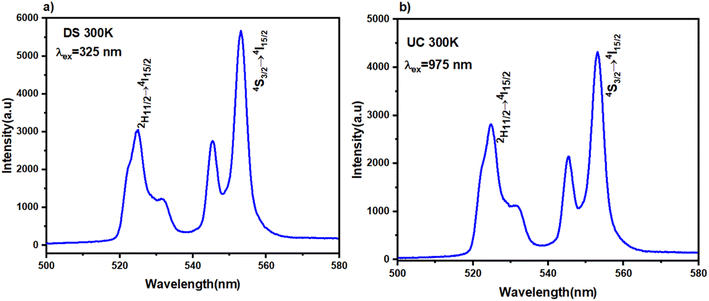
Fig. 5(a) and (b) represent the PL spectra of BVO: Er3+/Yb3+ phosphor excited with UV (325 nm) and IR (975 nm). Sensitizer ion concentrations commonly utilized exceed 15 mol% (Yb3+) to produce a strong UC emission, whereas emitter ion concentrations of about 2% work well based on our previous work.46 The DS and UC emission spectra exhibit two strong emission bands linked to the 2H11/2/4I15/2 (525 nm) and 4S3/2/4I15/2 (552 nm) transitions of Er3+ ions. The emission intensity of the BVO phosphor under DS luminescence is much higher than under up conversion luminescence. This indicates that host material has some impact on the UC and DS luminescence. Analogous outcomes were reported in other studies carried out in diverse phosphors, which were ascribed to a mechanism of borrowing intensity that blends the 4f and 5d RE orbits through the valence band energy levels of the lattice.46–50
 |
| | Fig. 5 Emission spectra of BVO: Er/Yb at room temperature (a) under 325 nm excitation (DS), (b) under 975 nm excitation (UC), respectively. | |
Substantial evidence suggests that high excitation density can lead to the saturation of intermediate up-converting levels, resulting in a reduction of photon absorption by the ground state due to its carrier depletion. Consequently, it can readily saturate the anti-Stokes emission conversion. The importance of excitation pump power in luminescence thermometry was underscored by previous research, indicating that achieving high sensitivity necessitates excitation in the non-saturation regime.
In the subsequent phase of our research, we will utilize a minimum excitation pump power of 30 mW to activate the up-conversion mechanism in BVO: Er/Yb. Accordingly, for future thermometric inquiries, we will maintain a constant 30 mW excitation for both the UC and DS processes.
Such spectral properties will be beneficial to obtain a reliable temperature sensing behavior of BVO: Er/Yb phosphor. For the UC process, the UC emission intensity (I) depends on the pump power (P) eqn (2):51–53
wherein
n is roughly equal to the number of pump photons necessary to excite the RE ions from ground state to the excited state at relatively small pump power.
n can be estimated from an exponential fit of the intensity
versus pump power plot using
eqn (2).
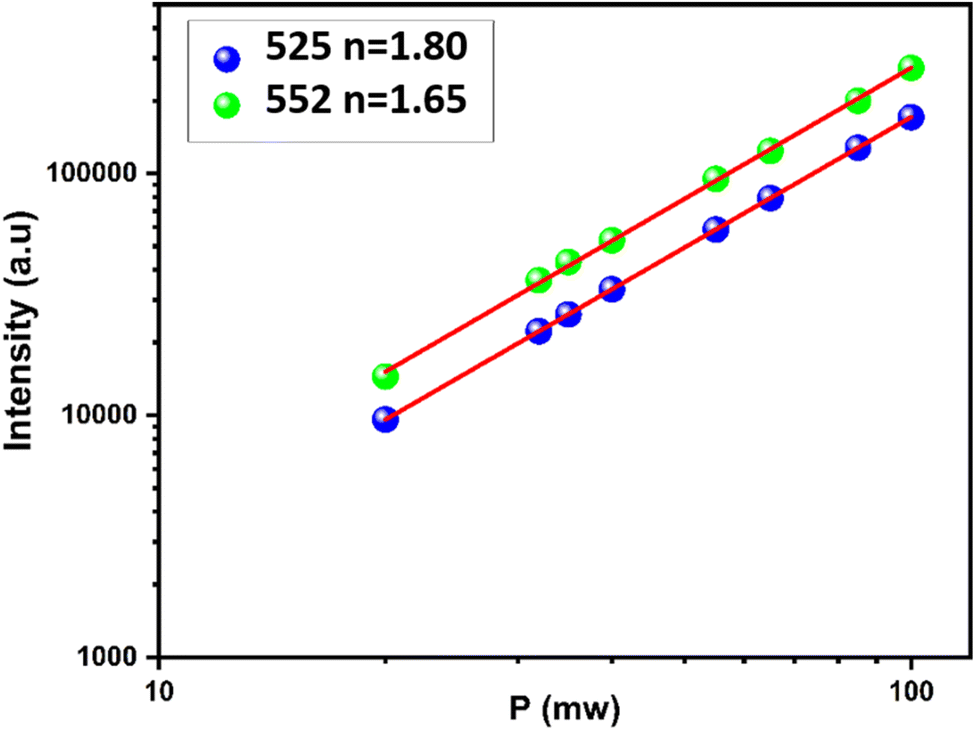
Fig. 6 presents the linear fit slopes (
n) for the green emission associated with
2H
11/2 and
4S
3/2 upon 975 nm excitation, they are estimated separately to be 1.8 and 1.65, respectively. This suggest that the populations of these states are (
2H
11/2,
4S
3/2,
4F
9/2) are mainly contributed by two-photon absorption process.
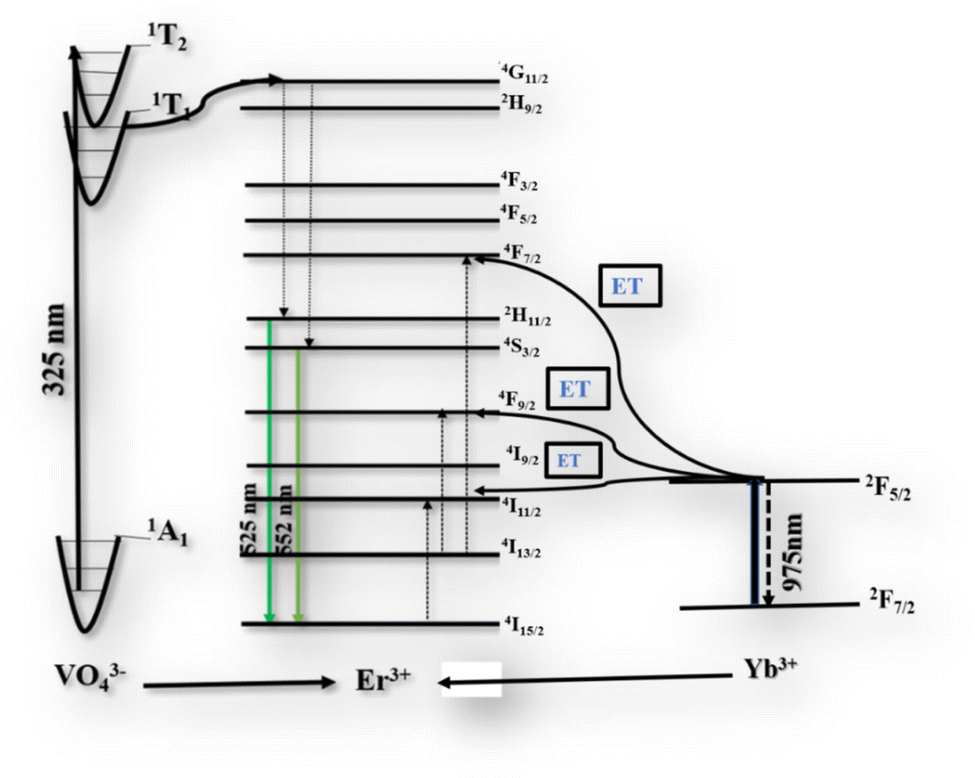
54–56 Based on the previous results, a scheme for the luminescence processes under NIR and UV excitation can be drawn.
Fig. 7 illustrates the diagrams of the energy levels of Er
3+ and Yb
3+ ions and the tentative diagrams of the DS and UC processes. Here, we set up possible excitation and emission transitions, and energy transfer path between sensitizer (Yb
3+) and activator (Er
3+) in BVO. These processes have been widely discussed in the literature. The different radiative and non-radiative pathways implicated in the PL scheme of BVO are represented in the energy level plot of
Fig. 7. Upon excitation with 325 nm (DS), vanadate ion in the ground state
1A
1 can be promoted to the
1T
2 state, then relaxes non-radiatively to the
1T
1 state. The excited state energy level
1T
1 of vanadate is almost aligned with the
4G
11/2 Er
3+ excitable state, leading to a non-radiative resonance energy transfer from the vanadate to Er
3+ ions. The
4G
7/2 excited state of Er
3+ is non-radiatively depleted to the
2H
11/2 and
4S
3/2 emitting states of Er
3+ ions, which result in the green emission at 525 and 547 nm, respectively, which permits to explain the DS mechanism.
57,58 Upon excitation through 975 nm (UC), first, the Yb
3+ ion absorbs NIR photons at 975 nm promoting it to its excited state. Second, energy transfer from Yb
3+ to Er
3+ ions take place, exciting Er
3+ to the
4I
11/2 state and then to the
4F
7/2 state. Third, the Er
3+ ion in the
4F
7/2 state relaxes quickly to the lower energy
2H
11/2/
4S
3/2 states. Finally, the
2H
11/2/
4S
3/2–
4I
15/2 transitions take place, producing the green emission.
 |
| | Fig. 6 Integral emission intensity of the green and red emission lines as a function of the pump laser power (975 nm excitation). | |
 |
| | Fig. 7 Schematic energy level diagram of Er3+ and Yb3+ ions and mechanisms. | |
5. Temperature sensing behavior
To evaluate the potential application of Yb3+/Er3+ codoped BVO phosphor in dual-mode optical thermometry, the temperature-dependent luminescence behavior of the samples was studied in detail under both 325 nm and 975 nm excitations.
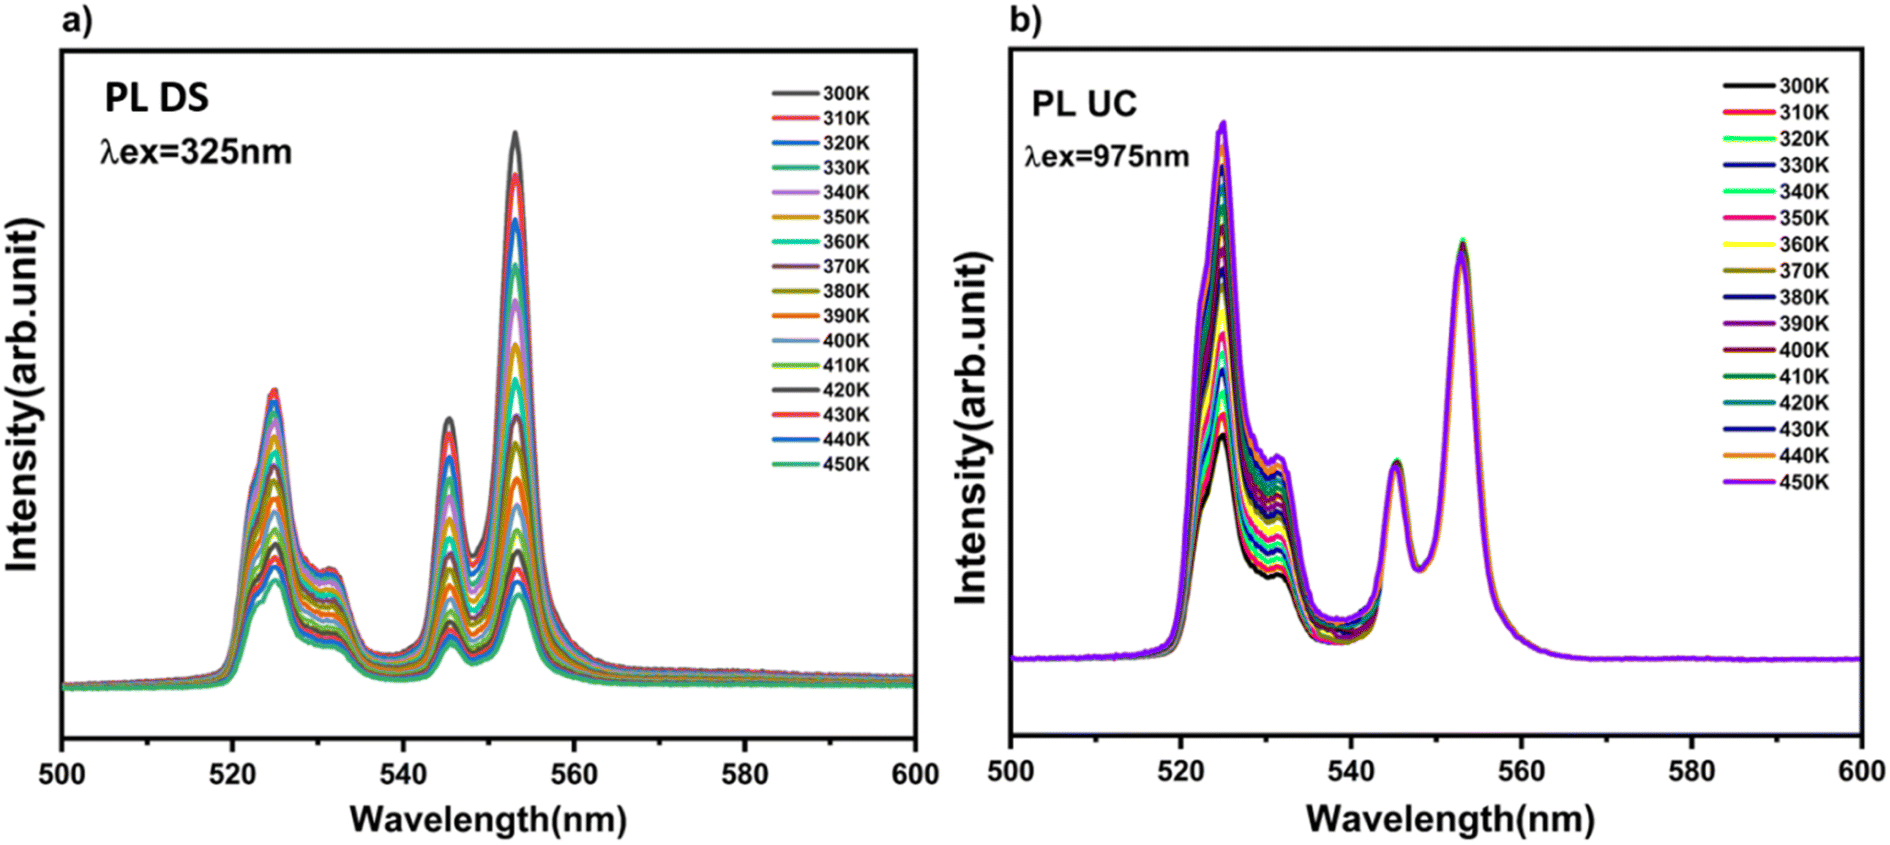
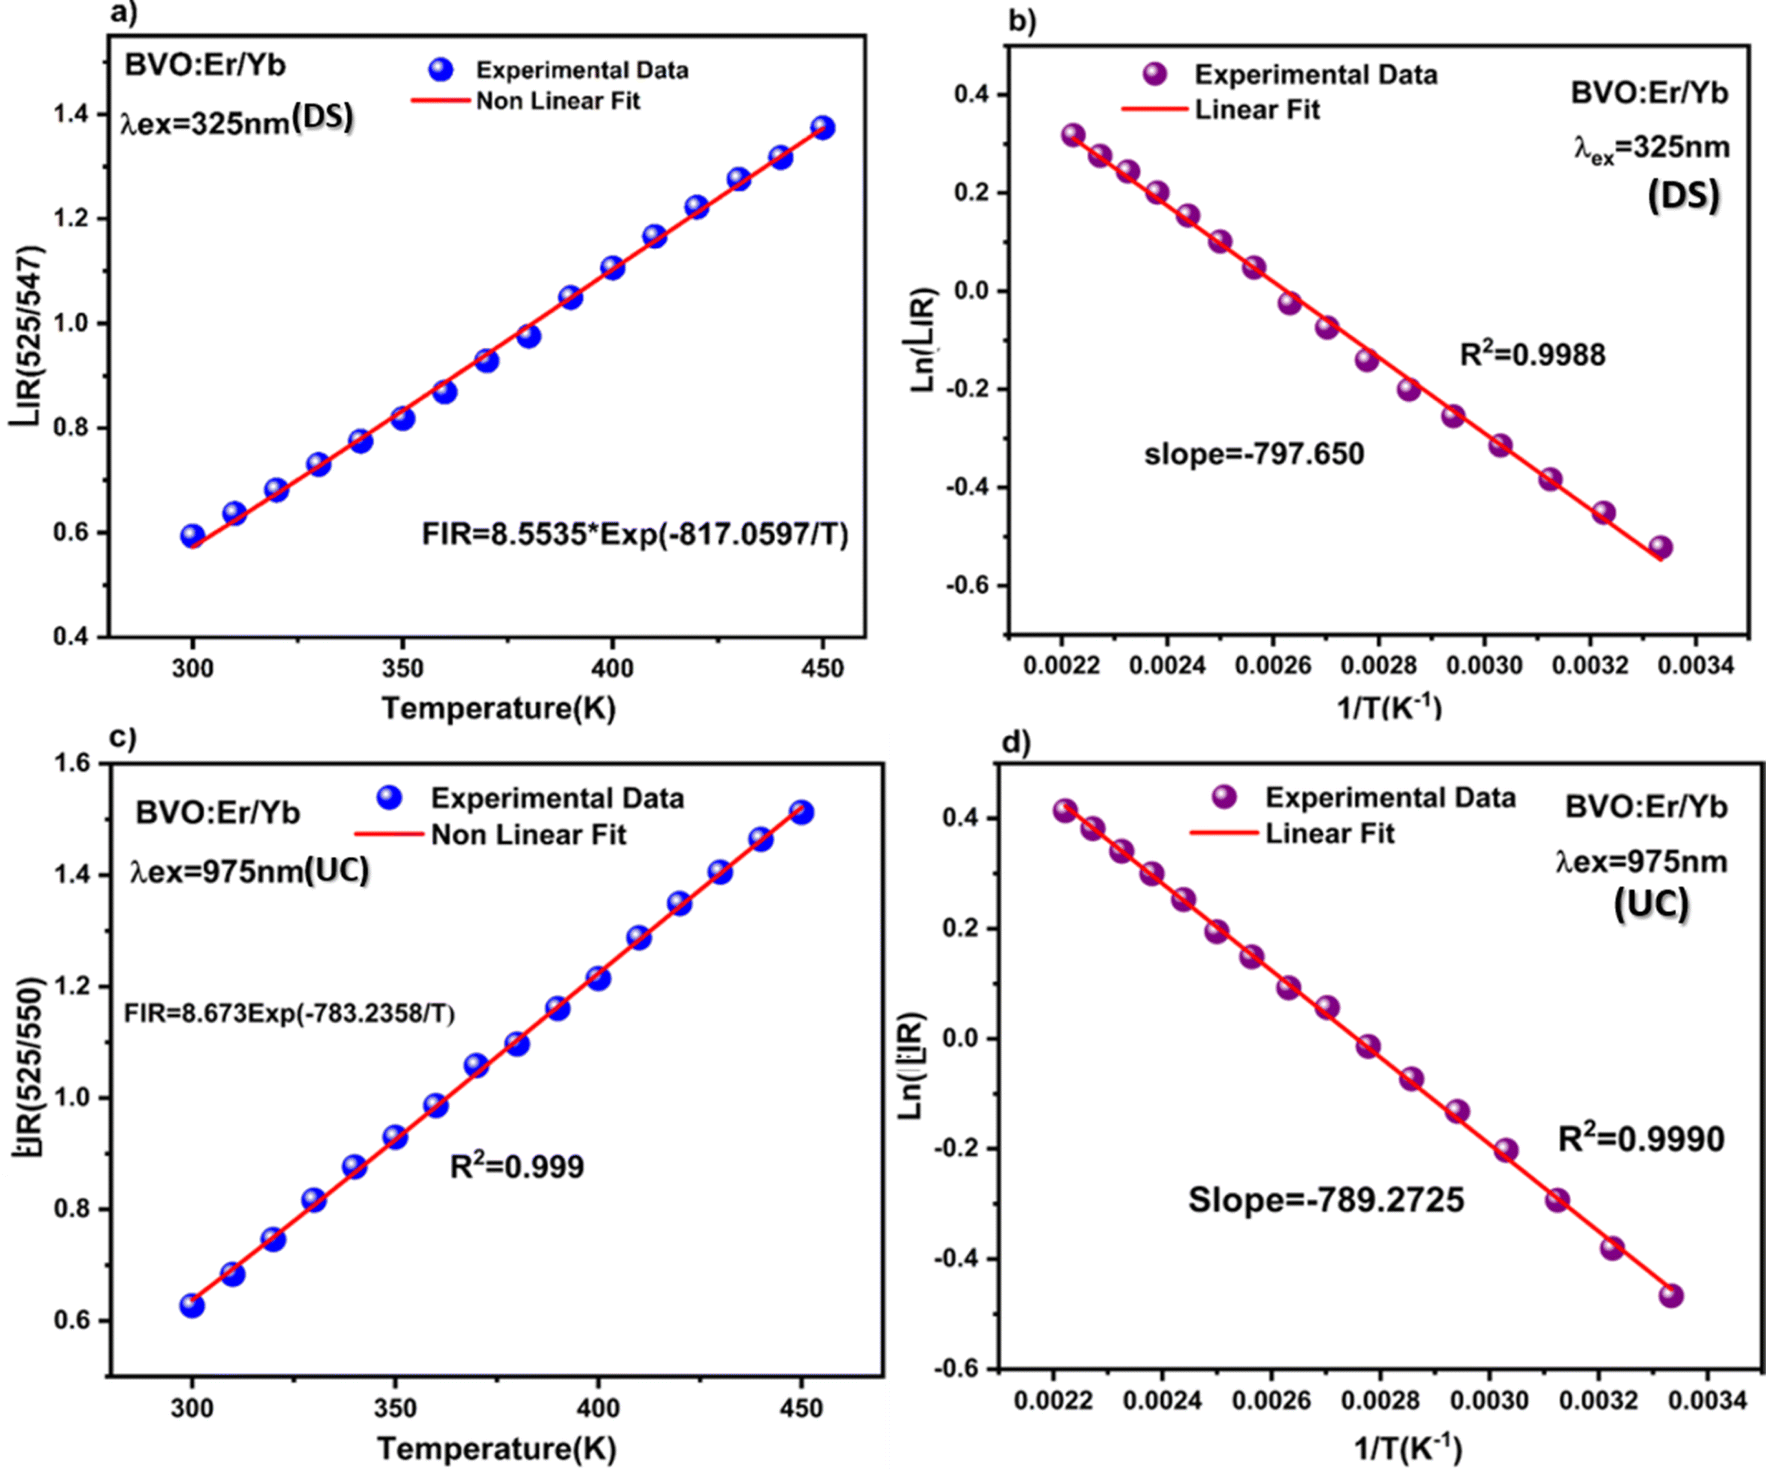
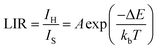
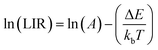
Fig. 8 depicts the temperature-dependent emission spectra in the range of 400–700 nm of the phosphor BVO: Er/Yb excited under 325 nm and 975 nm respectively. For both UC and DS, all the spectra produced by the investigated phosphor exhibit two peaks ascribed to the Er3+ ion transitions and they are located in the green (G) visible region, namely, 525 nm: 2H11/2 → 4I15/2 and 552 nm: 4S3/2 → 4I15/2. As compared to the 4S3/2 → 4I15/2 transition, the emission intensity of the 2H11/2 → 4I15/2 transition shows a monotonic increase with no evident shift in the position of the band with the increase of temperature, which indicates that the 2H11/2 level can be effectively populated from the 4S3/2 level through the thermal excitation process.59 Furthermore, the increase of temperature is also advantageous for reducing the structural defects and surface ligands. Thus, the thermally coupled level (TCLs) method is assumed to be applicable for the optical thermometry. Based on the Boltzmann distribution law, the LIR of two TCL emissions (2H11/2 and 4S3/2) can be written as eqn (3).60–62
| |
 | (3) |
where
IH and
IS indicate the embedded intensities of the
2H
11/2 →
4I
15/2 (524–537 nm) and
4S
3/2 →
4I
15/2 (537–564 nm) transitions, respectively.
A is a parameter that depends on the host lattice. Δ
E is the energy gap between the levels
2H
11/2 and
4S
3/2,
kb and
T are the Boltzmann constant (0.695 K
−1 cm
−1), and the absolute temperature, respectively taking transforming
eqn (3) to logarithmic format,
eqn (4):
| |
 | (4) |
 |
| | Fig. 8 Emission spectra of the BVO: Yb/Er phosphor for different temperatures in the visible range (a) under 325 nm excitation (DS), (b) under 975 nm (UC) excitation. | |
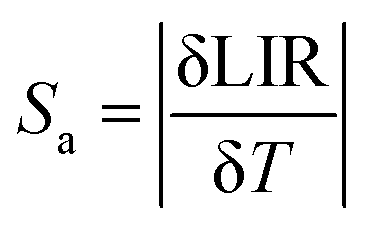
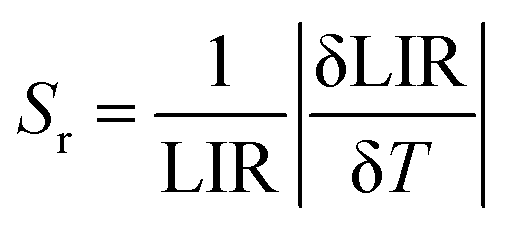
The absolute sensitivity Sa and the relative sensitivity Sr play very important roles in the determination of the practical application of the optical thermal sensing, which can be achieved by eqn (5) and (6).63–65
| |
 | (5) |
| |
 | (6) |
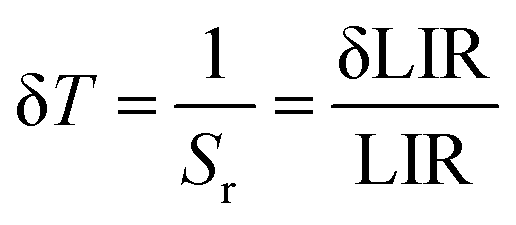
Besides the sensitivities, one also finds the temperature ambiguity (δT or ΔT). δT is the lowest measured variation of the temperature value during a given measurement, which is generally expressed as eqn (7):66,67
| |
 | (7) |
where δLIR is the uncertainty of the LIR parameter δLIR/LIR in our case is fixed at 0.5%.
68,69
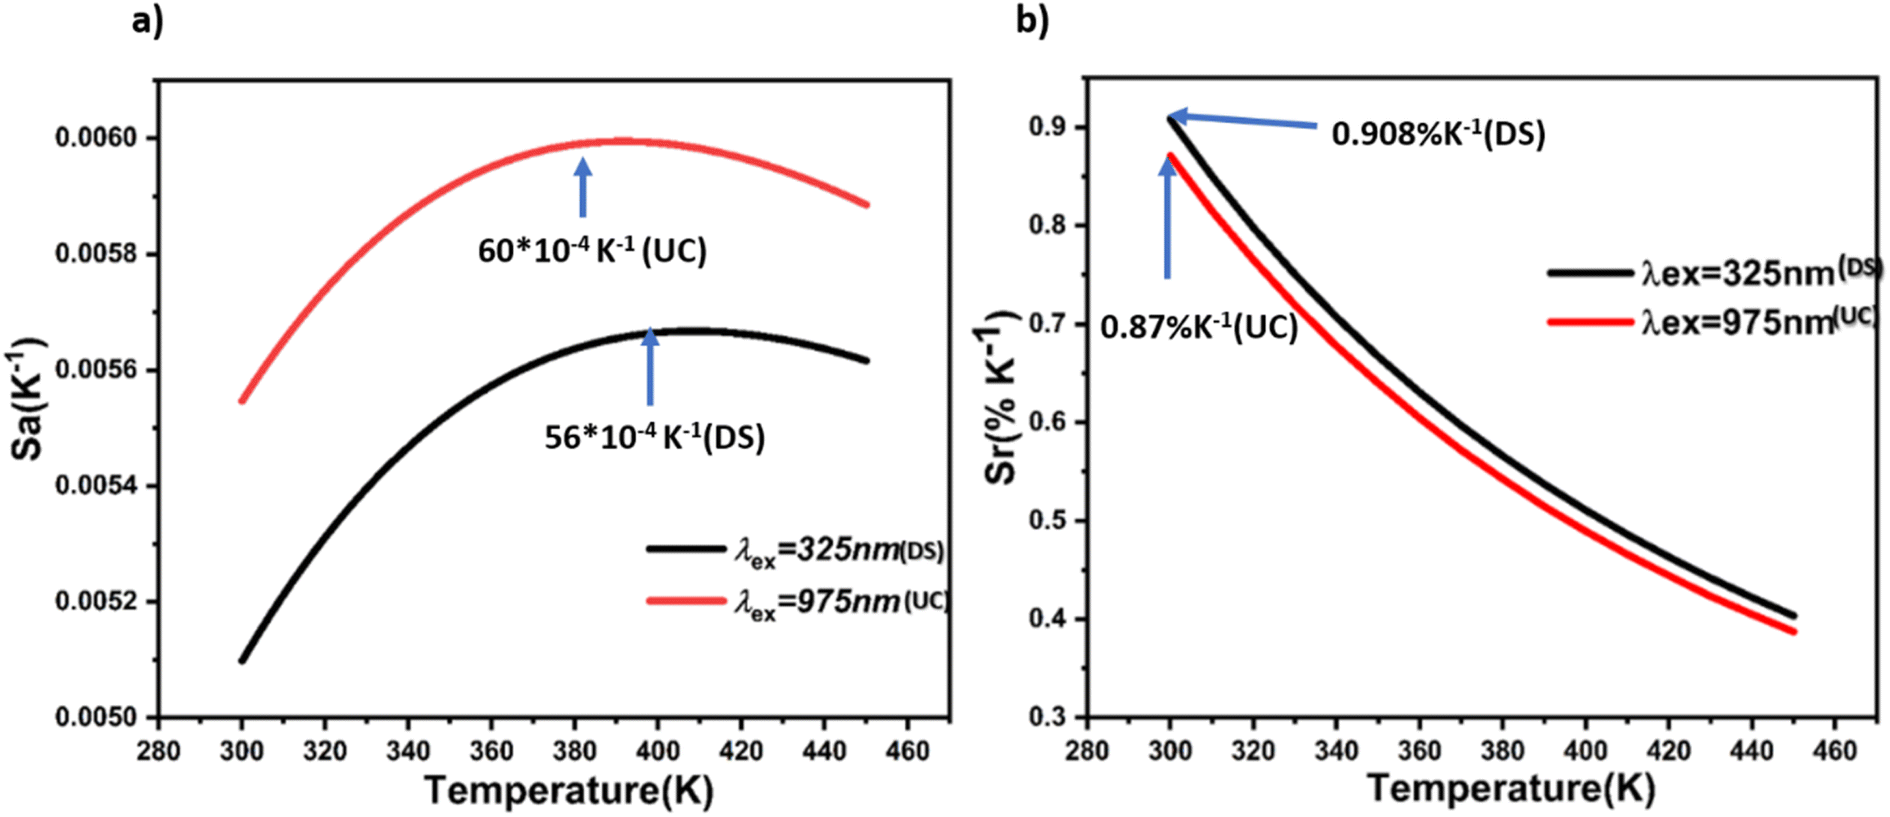
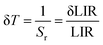
It is clear from Fig. 8(a) and (b) that the two intensity emission bands at 525 nm (2H11/2–4I15/2) and 552 nm (4S3/2–4I15/2) for both UC and DS are progressively attenuated with the increase in temperature. The potential for thermometry applications is related to the luminescence intensity ratio (LIR), which can be assessed using the eqn (3), Fig. 9(a) and (c) show plots of (LIR) vs. T for DS and UC respectively, while Fig. 9(b) and (d), plots ln LIR vs. the inverse temperature for DS and UC respectively, showing a linear behavior according to eqn (4). The slope values are ΔE/kb = 797 K for DS and ΔE/kb = 789 K for UC, respectively. Therefore, the ΔE/kb parameter is not very sensitive to the change of the excitation source. The above discussions suggest that the 2H11/2/4S3/2–4I15/2 transitions of the Er3+ ion can be used for radiometric temperature sensing with both 325 nm and 975 nm excitations. It is necessary to investigate the behavior of this pair of transitions over the two excitations. Marciniak et al. have confirmed that the relative sensitivity, (Sr), compared to the absolute sensitivity, (Sa), can be a witness of the critical performance of thermal sensors.70 The absolute sensitivity (Sa) and the relative sensitivity (Sr) are described as absolute and relative change of the LIR value with respect to temperature variation, using eqn (5) and (6), respectively. Fig. 10(a) and (b) illustrate the corresponding optical thermometry sensitivities Sa and Sr for both UC and DS processes.
 |
| | Fig. 9 Luminescence intensity ratio LIR as a function of temperature. (a) under 325 nm (DS); (c) under 975 nm (UC). Monolog plot of the LIR as a function of the inverse temperature(1/T). (b) under 325 nm (DS); (d) under 975 nm (UC). | |
 |
| | Fig. 10 (a) Absolute sensitivities (Sa) of BVO: Er/Yb phosphor as a function of temperature. (b) Relative (Sr) sensitivities of BVO: Er/Yb phosphor as a function of temperature. | |
These results demonstrate that changes in excitation have a minor impact on sensitivities. Specifically, under 975 nm excitation (UC), the maximum absolute sensitivity (Sa) reaches 60 × 10−4 K−1 at 388 K, whereas under 325 nm excitation (DS), (Sa) decreases to 56 × 10−4 K−1 at 400 K. However, the maximal relative sensitivity parameter, (Sr), is observed with the DS emission. Notably, for both excitations, (Sr) values consistently decrease with temperature from 300 K to 450 K, taking a value of 0.908% K−1 and 0.87% K−1 at 300 K for the DS and UC processes, respectively. Table 1 displays the optical temperature parameters of various luminescence materials. In comparison, the samples prepared in our study exhibit relatively high sensitivity across a wide temperature range, suggesting that the novel strategy employed here can be further explored to understand temperature-dependent dual-mode optical properties. The temperature resolution, as calculated using eqn (7), is depicted in Fig. 11. Under excitation at 325 nm, the temperature resolution δT gradually rises from 0.55 to 1.23 K as the temperature increases from 300 to 450 K. Conversely, the δT obtained under 975 nm excitation closely mirrors that found under excitation at 325 nm. This evidences that the excitation source does not influence the temperature resolution significantly, but the sensitivity achieved via the DS process. The BiVO4 doped Er3+/Yb3+ codoped phosphors could be potential candidates for optical thermometry applications.
Table 1 Sensitivities for the temperature-sensing luminescence materials
| Sensing materials |
T range (K) |
λexc (nm) |
Samax (10−3 K) |
Srmax (% K−1) |
Ref. |
| LaNbO4: Er/Yb |
10–300 |
980 |
8.1 (430 K) |
0.749 (300 K) |
71 |
| Ca3(PO4)2: Er/Yb |
300–473 |
980 |
— |
0.34 (300 K) |
72 |
| LaPVO4: Er/Yb |
300–440 |
325 |
5.766 (360 K) |
0.801 (300 K) |
47 |
| 300–520 |
980 |
4.38 (300 K) |
0.7 (300 K) |
| YPVO4: Er/Yb |
300–440 |
980 |
6.58 (100 K) |
6.58 (100 K) |
73 |
| NaErF4@NaYF4@NaYbF4: Tm@NaYF4 NPs |
293–413 |
980 |
— |
0.71 (315 K) |
74 |
| GdPVO4: Er/Yb |
300–510 |
325 |
6.12 (380 K) |
0.85 (300 K) |
39 |
| 300–440 |
980 |
5.07 (320 K) |
0.63 (300 K) |
| Silicate glass: Er/Yb |
296–723 |
980 |
— |
0.33 (296 K) |
75 |
| NaY (MoO4)2: Er/Yb |
303–523 |
980 |
— |
0.66 (373 K) |
76 |
| GdVO4@SiO2: Er/Yb |
297–343 |
980 |
— |
0.94 (343 K) |
77 |
| Y2SiO5: Er/Yb |
— |
975 |
— |
0.7 (300 K) |
78 |
| La2CaZnO5: Er/Yb |
303–573 |
980 |
— |
0.71 (303 K) |
79 |
| BVO: Er/Yb |
300–450K |
325 |
5.6 (400 K) |
0.908 (300 K) |
This work |
| 975 |
6 (388 K) |
0.87 (300 K) |
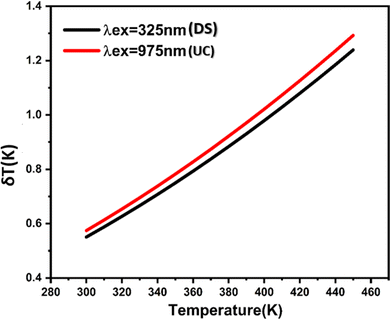 |
| | Fig. 11 Temperature (δT) resolution of BVO: Er/Yb phosphor as a function of temperature. | |
6. Conclusion
In summary, we successfully synthesized pure and codoped Er3+/Yb3+ doped bismuth vanadate using the sol–gel method, with their crystal structures confirmed via XRD analysis. BVO: Er/Yb exhibits notable up-conversion (UC) and down shifting (DS) emissions, making of it a promising dual-mode phosphor. We investigated the performance of these luminescent thermometers in terms of thermal sensitivities and temperature uncertainties under both UC and DS processes, employing the self-referenced luminescence intensity ratio technique. The thermal sensor was evaluated in the 300–450 K temperature range using the 2H11/2 → 4I15/2 and 4S3/2 → 4I15/2 transitions of Er3+ ions. We have demonstrated that changes in excitation have a minor impact on sensitivities. Specifically, under 975 nm excitation (UC), the maximum absolute sensitivity (Sa) reaches 60 × 10−4 K−1 at 388 K, whereas under 325 nm excitation (DS), (Sa) decreases to 56 × 10−4 K−1 at 400 K. However, the maximal relative sensitivity parameter, (Sr), is observed for the DS process. Notably, for both excitation processes, the Sr values consistently decrease with temperature in the range of 300 K to 450 K. They peak at 0.908% K−1(DS) and 0.87% K−1(UC) at 300 K, gradually declining to 0.4% K−1 (DS) and 0.39% K−1 (UC) at 450 K for the DS and UC processes, respectively. The temperature resolution gradually increases from 0.55 to 1.23 K with increasing temperature under 325 nm excitation. Interestingly, the resolution under 980 nm excitation closely resembles that under 325 nm excitation, indicating minimal influence of excitation source on temperature resolution. Our findings underscore the nearly identical nature of up conversion and downshifting processes in influencing the performance of thermometric sensors when BiVO4 codoped with Er3+/Yb3+is utilized as the host material. This work not only advances our understanding of luminescent thermometry but also holds promise for diverse applications in environmental monitoring and materials science.
Data availability
All data underlying the results are available as part of the article and no additional source data are required.
Conflicts of interest
There are no conflicts to declare.
Acknowledgements
Fadwa Ayacha received partial funding through the Erasmus+ KA171 Project. I. Mediavilla and J. Jimenez were partially funded by the Spanish Ministry of Science and Innovation (Grants PID2021-126046OB-C22, PID2020-113533RB-C33, TED2021-130786B-I00) and the Regional Government of Castilla y León (Junta de Castilla y León). Additional funding was provided by the Ministry of Science and Innovation and the European Union's NextGeneration EU/PRTR under the project “Programa Complementario de Materiales Avanzados”.
References
- B. Zhuang, Y. Liu, S. Yuan, H. Huang, J. Chen and D. Chen, Nanoscale, 2019, 11, 15010–15016 RSC.
- Y. Gao, F. Huang, H. Lin, J. Zhou, J. Xu and Y. Wang, Adv. Funct. Mater., 2016, 26, 3139–3145 CrossRef.
- B. Dong, B. Cao, Y. He, Z. Liu, Z. Li and Z. Feng, Adv. Mater., 2012, 15, 1987–1993 CrossRef.
- C. D. S. Brites, S. Balabhadra and L. D. Carlos, Adv. Opt. Mater., 2019, 7, 1801239 CrossRef.
- X. Qiu, Q. Zhou, X. Zhu, Z. Wu, W. Feng and F. Li, Nat. Commun., 2020, 11, 4 CrossRef.
- Z. Zhang, H. Suo, X. Zhao and C. Guo, Photonics Res., 2020, 8, 32–38 CrossRef.
- M. Sekulić, V. Đorđević, Z. Ristić, M. Medić and M. D. Dramićanin, Adv. Opt. Mater., 2018, 6, 1800552 CrossRef.
- Y. Pan, X. Xie, Q. Huang, C. Gao, Y. Wang, L. Wang, B. Yang, H. Su, L. Huang and W. Huang, Adv. Mater., 2018, 30, 1705256 CrossRef PubMed.
- X. Chen, S. Liu, K. Huang, J. Nie, R. Kang, X. Tian, S. Zhang, Y. Li and J. Qiu, Chem. Eng. J., 2020, 396, 125201 CrossRef.
- Y. Gao, Y. Cheng, T. Hu, Z. Ji, H. Lin, J. Xu and Y. Wang, J. Mater. Chem. C, 2018, 6, 11178–11183 RSC.
- Z. Zheng, J. Zhang, X. Liu, R. Wei, F. Hu and H. Guo, Ceram. Int., 2020, 46, 6154–6159 CrossRef.
- H. Zhang, H. Yang, G. Li, S. Liu, H. Li, Y. Gong, Y. Liang and Y. Chen, Chem. Eng. J., 2020, 396, 125251 CrossRef CAS.
- X. Zhang, Z. Zhu, Z. Guo, Z. Sun and Y. Chen, Chem. Eng. J., 2019, 356, 413–422 CrossRef.
- L. Li, X. Tang, Z. Wu, Y. Zheng, S. Jiang, X. Tang, G. Xiang and X. Zhou, J. Alloys Compd., 2019, 780, 266–275 CrossRef.
- Y. Jiang, Y. Tong, S. Chen, W. Zhang, F. Hu, R. Wei and H. Guo, Chem. Eng. J., 2021, 413, 127470 CrossRef.
- M. D. Dramićanin, J. Appl. Phys., 2020, 128, 040902 CrossRef.
- M. Lin, L. Xie, Z. Wang, B. S. Richards, G. Gao and J. Zhong, J. Mater. Chem. C, 2019, 7, 2971–2977 RSC.
- S. Wang, H. Zhou, X. Wang and A. Pan, J. Phys. Chem. Solids, 2016, 98, 28–31 CrossRef.
- K. Green, K. Huang, H. Pan, G. Han and S. F. Lim, Front. Chem., 2018, 6, 416 CrossRef PubMed.
- X. Wang, Y. Wang, J. Yu, Y. Bu and X. Yan, Opt. Express, 2018, 26, 21950 CrossRef PubMed.
- M. Ding, Z. Shen, Y. Yuan, W. Bai, C. Lu and Z. Ji, Ceram. Int., 2018, 44, 14884–14890 CrossRef.
- F. Ayachi, K. Saidi, M. Dammak, W. Chaabani, I. Mediavilla-Martínez and J. Jiménez, Mater. Today Chem., 2023, 27, 101352 CrossRef.
- F. Ayachi, K. Saidi, K. Soler-Carracedo, M. Dammak and I. R. Martín, J. Alloys Compd., 2023, 961, 171146 CrossRef.
- S. F. León-Luis, U. R. Rodríguez-Mendoza, E. Lalla and V. Lavín, Sens. Actuators, B, 2011, 158, 208–213 Search PubMed.
- D. Wawrzynczyk, A. Bednarkiewicz, M. Nyk, W. Strek and M. Samoc, Nanoscale, 2012, 4, 6959 RSC.
- A. Pandey, S. Som, V. Kumar, V. Kumar, K. Kumar, V. K. Rai and H. C. Swart, Sens. Actuators, B, 2014, 202, 1305–1312 CrossRef.
- W. A. Pisarski, J. Pisarska, R. Lisiecki and W. Ryba-Romanowski, Opt. Mater., 2016, 59, 87–90 CrossRef.
- D. Manzani, J. F. D. S. Petruci, K. Nigoghossian, A. A. Cardoso and S. J. Ribeiro, Sci. Rep., 2017, 7, 1–11 Search PubMed.
- K. Zhou, H. Zhang, Y. Liu, Y. Bu, X. Wang and X. Yan, J. Am. Ceram. Soc., 2019, 102, 6564–6574 CrossRef.
- J. Cao, D. Xu, F. Hu, X. Li, W. Chen, L. Chen and H. Guo, J. Eur. Ceram. Soc., 2018, 38, 2753–2758 CrossRef.
- R. L. Frost, D. A. Henry, M. L. Weier and W. Martens, J. Raman Spectrosc., 2006, 37, 722–732 CrossRef.
- C. Regmi, Y. K. Kshetri, S. H. Jeong and S. W. Lee, J. Appl. Phys., 2019, 125, 043101 CrossRef.
- K. V. Terebilenko, K. L. Bychkov, V. N. Baumer, N. S. Slobodyanik, M. V. Pavliuk, A. Thapper, I. I. Tokmenko, I. M. Nasieka and V. V. Strelchuk, Dalton Trans., 2016, 45, 3895–3904 RSC.
- L. Shan and Y. Liu, J. Mol. Catal. Chem., 2016, 416, 1–9 CrossRef.
- W. Zheng, P. Huang, D. Tu, E. Ma, H. Zhu and X. Chen, Chem. Soc. Rev., 2015, 44, 1379–1415 RSC.
- F. Wang, D. Banerjee, Y. Liu, X. Chen and X. Liu, Analyst, 2010, 135, 1839–1854 RSC.
- Y. Liu, L. Meng, H. Wang, J. Jiao, M. Xing, Y. Peng, X. Luo and Y. Tian, Dalton Trans., 2021, 50, 960–969 RSC.
- J. Sun, Z. Zhang, H. Suo, Y. Chen, J. Xiang and C. Guo, Ceram. Int., 2021, 47, 409–415 CrossRef.
- Y. K. Kshetri, C. Regmi, B. Chaudhary, H.-S. Kim, T.-H. Kim, F. Rosei and S. W. Lee, J. Lumin., 2021, 230, 117739 CrossRef.
- S. Lotfi, A. Assani, M. Saadi and H. A. Ahsaine, Mater. Today Proc., 2022, 61, 487–497 CrossRef.
- C. Li, B. Dong, S. Li and C. Song, Chem. Phys. Lett., 2007, 443, 426–429 CrossRef.
- M. Azdouz, B. Manoun, M. Azrour, L. Bih, L. El Ammari, S. Benmokhtar and P. Lazor, J. Mol. Struct., 2010, 963, 258–266 CrossRef CAS.
- U. Opara Krašovec, B. Orel, A. Šurca, N. Bukovec and R. Reisfeld, Solid State Ionics, 1999, 118, 195–214 CrossRef.
- R. T. Harley, W. Hayes and S. R. P. Smith, Solid State Commun., 1971, 9, 515–517 CrossRef CAS.
- A. Dwivedi, E. Rai, D. Kumar and S. B. Rai, ACS Omega, 2019, 4, 6903–6913 CrossRef CAS.
- K. Saidi, C. Hernández-Álvarez, M. Runowski, M. Dammak and I. Rafael Martín Benenzuela, ACS Appl. Nano Mater., 2023, 6, 19431–19442 CrossRef CAS.
- F. Ayachi, K. Saidi, M. Dammak, W. Chaabani, I. Mediavilla-Martínez and J. Jiménez, Mater. Today Chem., 2023, 27, 101352 CrossRef CAS.
- F. H. Borges, J. C. Martins, F. J. Caixeta, R. R. Pereira, L. D. Carlos, R. A. S. Ferreira and R. R. Gonçalves, J. Sol-Gel Sci. Technol., 2022, 102, 249–263 CrossRef CAS.
- P. Woźny, K. Soler-Carracedo, M. Perzanowski, J. Moszczyński, S. Lis and M. Runowski, J. Mater. Chem. C, 2024, 12, 11824–11835 RSC.
- A. Dwivedi, K. Mishra and S. B. Rai, J. Phys. Appl. Phys., 2015, 48, 435103 CrossRef.
- N. M. Bhiri, M. Dammak, J. J. Carvajal, M. Aguiló, F. Díaz and M. C. Pujol, J. Alloys Compd., 2022, 921, 166020 CrossRef CAS.
- I. Kchaou, K. Saidi, R. Salhi and M. Dammak, RSC Adv., 2022, 12, 7529–7539 RSC.
- K. Saidi and M. Dammak, RSC Adv., 2020, 10, 21867–21875 RSC.
- H. Dong, L.-D. Sun and C.-H. Yan, Chem. Soc. Rev., 2015, 44, 1608–1634 RSC.
- M. Pollnau, D. R. Gamelin, S. R. Lüthi, H. U. Güdel and M. P. Hehlen, Phys. Rev. B:Condens. Matter Mater. Phys., 2000, 61, 3337–3346 CrossRef CAS.
- J. F. Suyver, A. Aebischer, S. García-Revilla, P. Gerner and H. U. Güdel, Phys. Rev. B:Condens. Matter Mater. Phys., 2005, 71, 125123 CrossRef.
- H. Cui, Y. Cao, Y. Zhang, L. Cao, S. Ran, X. Wang, D. Wu, X. Li, X. Zhang and B. Chen, J. Lumin., 2022, 241, 118484 CrossRef CAS.
- Y. Chen, Y. Bu, X. Chen, Y. Zhang, Y. Shen, L. Zhou and D. Deng, J. Lumin., 2022, 250, 119121 CrossRef CAS.
- W. Xu, Y. Cui, Y. Hu, L. Zheng, Z. Zhang and W. Cao, J. Alloys Compd., 2017, 726, 547–555 CrossRef CAS.
- C. Hernández-Álvarez, P. I. Martín-Hernández, I. R. Martín, F. Rivera-López, H. Hemmerich, J. Llanos and M. Runowski, Appl. Mater. Today, 2024, 38, 102207 CrossRef.
- H. Cui, Y. Cao, Y. Zhang, T. Peng, L. Cao, S. Ran, Y. Wang, D. Wu, X. Li, X. Zhang and B. Chen, Ceram. Int., 2021, 47, 21271–21275 CrossRef CAS.
- I. Kachou, K. Saidi, C. Hernández-Álvarez, M. Dammak and I. R. Martín, Adv. Mater., 2024, 5, 8280–8293 RSC.
- K. Saidi, M. Yangui, C. Hernández-Álvarez, M. Dammak, I. Rafael Martín Benenzuela and M. Runowski, ACS Appl. Mater. Interfaces, 2024, 16, 19137–19149 CrossRef CAS.
- M. Yangui, K. Saidi, C. Hernández-Álvarez, M. Dammak and I. R. Martín, J. Alloys Compd., 2025, 1010, 177958 CrossRef CAS.
- F. Ayachi, K. Saidi, W. Chaabani and M. Dammak, J. Lumin., 2021, 240, 118451 CrossRef CAS.
- F. Ayachi, K. Saidi, M. Dammak, J. J. Carvajal and M. C. Pujol, RSC Adv., 2024, 14, 13494–13504 RSC.
- F. Ayachi, K. Saidi and M. Dammak, Adv. Mater., 2024, 5, 6162–6169 RSC.
- O. A. Savchuk, J. J. Carvajal, C. D. S. Brites, L. D. Carlos, M. Aguilo and F. Diaz, Nanoscale, 2018, 10, 6602–6610 RSC.
- F. Ayachi, K. Saidi, M. Dammak, J. Josep Carvajal and M. Cinta Pujol, RSC Adv., 2024, 14, 13494–13504 RSC.
- L. Marciniak, A. Bednarkiewicz, D. Hreniak and W. Strek, J. Mater. Chem. C, 2016, 4, 4327–4328 RSC.
- K. Pavani, J. P. C. do Nascimento, S. K. Jakka, F. F. do Carmo, A. J. M. Sales, M. J. Soares, M. P. F. Graça, F. J. A. de Aquino, D. X. Gouveia and A. S. B. Sombra, J. Lumin., 2021, 235, 117992 CrossRef CAS.
- K. M. Krishna, S. P. Tiwari, A. Kumar and K. Kumar, Sens. Actuators, A, 2020, 315, 112302 CrossRef CAS.
- F. Ayachi, K. Saidi, W. Chaabani and M. Dammak, J. Lumin., 2021, 240, 118451 CrossRef CAS.
- L. Lei, X. Dai, Y. Cheng, Y. Wang, Z. Xiao and S. Xu, J. Mater. Chem. C, 2019, 7, 3342–3350 RSC.
- C. Li, B. Dong, S. Li and C. Song, Chem. Phys. Lett., 2007, 443, 426–429 CrossRef CAS.
- X. Yang, Z. Fu, Y. Yang, C. Zhang, Z. Wu and T. Sheng, J. Am. Ceram. Soc., 2015, 98, 2595–2600 CrossRef CAS.
- O. A. Savchuk, J. J. Carvajal, C. Cascales, M. Aguiló and F. Díaz, ACS Appl. Mater. Interfaces, 2016, 8, 7266–7273 CrossRef CAS PubMed.
- N. Rakov and G. S. Maciel, Sens. Actuators, B, 2012, 164, 96–100 CrossRef CAS.
- V. Kumar, S. Som, S. Dutta, S. Das and H. C. Swart, RSC Adv., 2016, 6, 84914–84925 RSC.
|
| This journal is © The Royal Society of Chemistry 2025 |
Click here to see how this site uses Cookies. View our privacy policy here. 
 Open Access Article
 This Open Access Article is licensed under a Creative Commons Attribution-Non Commercial 3.0 Unported Licence
 *a,
Irene Mediavillab and
Juan Jiménezb
*a,
Irene Mediavillab and
Juan Jiménezb