
 Open Access Article
 This Open Access Article is licensed under a Creative Commons Attribution-Non Commercial 3.0 Unported Licence
Development of an optode based on 2-amino-4-(4-nitrophenyl)diazenyl pyridine-3-ol and tri-n-octyl phosphine oxide for trace-level lead detection in complex samples†
Abdullah H. Alluhayba,
Ahmed Hamad Alanazib,
Alaa M. Younisa,
Khaled F. Debbabicd,
Refat El-Sayedce and
Alaa S. Amin *e
*e
aDepartment of Chemistry, College of Science, Qassim University, Buraidah, 51452, Saudi Arabia
bChemistry Department, College of Science, Jouf University, Sakaka 2014, Saudi Arabia
cDepartment of Chemistry, University College in Al-Jamoum, Umm Al-Qura University, 21955, Saudi Arabia
dDepartment of Chemistry, High Institute of Applied Science & Technology of Mahdia, Monastir, Tunisia
eChemistry Department, Faculty of Science, Benha University, Benha, Egypt. E-mail: asamin2005@hotmail.com
First published on 14th February 2025
Abstract
A new selective optode has been created for the ultra-sensitive detection of lead ions at trace levels. The membrane is created by incorporating tri-n-octylphosphine oxide (TOPO), 2-amino-4-(4-nitrophenyl)diazenyl pyridine-3-ol (ANPDP), and sodium tetraphenylborate (Na-TPB) into a matrix of plasticized poly(vinyl chloride) (PVC) and o-nitrophenyloctyl ether (o-NPOE). ANPDP serves as a chromophore in this design, while TOPO promotes the formation of a complex between lead ions (Pb2+) and ANPDP, resulting in a cooperative interaction. The composition of the optode was optimized to achieve maximum sensor performance. The sensor exhibits a linear dynamic range from 6.0 to 160 ng mL−1, with quantification and detection limits of 5.9 ng mL−1 and 1.8 ng mL−1, respectively. The membrane demonstrated rapid response times and long-term durability, with no detectable leaching of ANPDP. To ensure accurate total lead determination, Pb4+ ions were reduced to Pb2+ using 6.00 M HCl and freshly prepared 2.50% (w/v) sodium azide. The optode sensor exhibited superior specificity for Pb2+ ions, even when other ions that could potentially interfere were present. It could be effectively regenerated by treatment with 0.1 M ethylenedi-aminetetraacetic acid (EDTA), restoring its functionality for repeated use. The sensor was successfully applied to detect lead in various complex matrices, including biological fluids, environmental water, and food samples, demonstrating its broad applicability and reliability for real-world lead monitoring.
Introduction
Heavy metal contamination is a pervasive issue affecting air, water sources, and soil, contributing to significant environmental degradation and posing serious risks to human health.1–3 Over the past decades, the escalating levels of toxic metals in the environment have become a critical concern.4 The buildup of heavy metal ions in living tissues is known to trigger a range of chronic conditions, including respiratory ailments, kidney dysfunction, bone damage, neurological disorders, hypertension, and even cancer in both humans and animals.5–9 Among these metals, Pb2+ stands out as one of the most dangerous. The WHO has set a temporary limit for the weekly intake of lead in food additives at 50 micrograms per kilogram of body weight.10 Lead(II) is a prominent environmental toxin with the potential to damage vital organs, impair the hematopoietic system (which is responsible for blood production), and cause neurological harm, with potential links to carcinogenic effects in humans.11 Due to its significant toxicological impact, the need for its detection has garnered increased attention.The significant levels of lead found in wastewater released into the environment have contributed to the growing pollution of water bodies in recent times, sparking serious concerns about the environmental and health risks posed by this contaminant.12 Lead in its divalent form, Pb2+, is highly toxic even at low levels. This is because it can build up in the bodies of organisms that consume it, leading to a range of health problems and illnesses.13 The EPA has set a maximum allowable limit of 10 μg L−1 for lead in water.14 Both natural processes and human activities have contributed to elevated lead levels in surface and groundwater, a growing issue for water quality preservation agencies.12 This has spurred substantial research interest in developing methods and technologies to monitor and detect lead in water, with the goal of reducing the risks it poses to human health and ecosystems. As a result, more and more attention is being paid to developing quick and accurate ways to find lead contamination in the environment, especially in aquatic plants that people eat.
In recent decades, significant advancements have been made in analytical techniques for detecting lead, including methods such as flame atomic absorption spectrometry (FAAS),15–17 hydride generation atomic absorption spectrometry (HG-AAS),18 inductively coupled plasma optical emission spectroscopy (ICP-OES),19,20 size exclusion chromatography coupled with ICP-mass spectrometry,21 Raman spectroscopy,22 electrothermal atomic spectroscopy,23,24 potentiometry,25 glassy carbon electrode analysis,26,27 anodic stripping voltammetry,28,29 electroanalytical methods,30 and fluorometry.31–33 While these approaches provide excellent limits of detection (LODs) and broad linear ranges, they are costly and require specialized expertise, limiting their use primarily to laboratory settings. The need for rapid, on-site analysis of trace Pb2+ ions is therefore of immense interest for environmental monitoring and practical applications.
Recently, there has been a growing emphasis on developing chemical methods that reduce the use of environmentally harmful substances and mitigate risks to human health. To achieve lower reagent consumption, alternative approaches are being explored. Optical chemical sensors have gained attention due to their compact design and suitability for miniaturization, making them highly advantageous for routine and research laboratory use. These sensors significantly reduce the need for reagents, offering ease of preparation, cost-effectiveness, and the ability to perform in situ monitoring without the need for separate reference devices. These benefits make optical sensors an especially appealing option for various applications.34–42
In this study, we present the development of an optical sensor for the detection of Pb2+ ions by immobilizing 2-amino-4-(4-nitrophenyl)diazenyl pyridine-3-ol (ANPDP) in a plasticized poly(vinyl chloride) (PVC) membrane. A key challenge in this approach is the slow reaction rate between Pb2+ ions and ANPDP, which requires a minimum standing time of 25 minutes to achieve complete color formation. To address this limitation, we incorporated tri-n-octyl phosphine oxide (TOPO) into the membrane, leveraging its synergistic effect to enhance the complexation of Pb2+ ions with ANPDP. This significantly accelerates the sensor's response. Notably, this is the first report to explore the use of such a synergistic effect in the development of an optical sensor for Pb2+ ion detection.
Experimental
Apparatus
Bidistilled water was produced using a double distillation apparatus from Fisons (UK). The analysis of lead (Pb2+) concentrations was conducted through ICP-AES utilizing a PerkinElmer 8300 system from Germany. To measure pH levels, a Jenway 3505 pH meter operating on a 9 V AC power supply was utilized. Spectroscopic evaluations were carried out with a JASCO 530V UV-Vis spectrophotometer. For the absorption measurements, thin films were placed in quartz cuvettes, and all experiments were performed in batch mode at a temperature of 25 ± 2.0 °C. Furthermore, the thickness of the membrane was ascertained using a Mitutoyo Digimatic Micrometer, specifically from the Series 293 MDC-MX Lite.Reagent
The research was carried out using deionized water, with all reagents utilized being of high purity analytical reagent grade and not subjected to any further purification processes. The following chemicals were obtained from Fluka Chemical Company: sodium tetraphenyl borate (Na-TPB) {99.5%}, tetrahydrofuran (THF) {99.0%}, tri-n-octyl phosphine oxide (TOPO) {99.0%}, o-nitrophenyl octyl ether (o-NPOE) {99.0%}, and high-molecular-weight poly(vinyl chloride) (PVC) {99.0%}. A variety of buffer systems were employed to keep the pH of the solutions stable, maintaining values between 2.5 and 11.5, as previously established in earlier research.43 The lead(II) stock solution was prepared by dissolving 399.5 mg of analytical-grade lead(II) nitrate {99.9%} in 300 mL of deionized water. To prevent the hydrolysis of lead ions, 1.0 mL of a dilute HNO3 {65.0%} solution was added. Working solutions of lead were then generated by methodically diluting the stock solution with deionized water. Lead(IV) acetate {95.0%} was obtained from Sigma-Aldrich to prepare Pb4+ solution.Synthesis of ANPDP reagent
To convert p-nitroaniline {99.0%} (0.01 mol) into its hydrochloride form, the minimum quantity of concentrated HCl {37%} was added to the aromatic amine. This mixture was then diluted with bidistilled water and cooled to −5.0 °C. The amine salt is progressively mixed with a cooled solution of NaNO2 {99.9%} while being continuously flipped. The resultant diazonium salt is added gradually to a solution of 2-amino-3-hydroxypyridine {98%} (0.01 mol) dissolved in 10% sodium hydroxide and chilled at −5.0 °C after being let stand for 15 minutes in an ice bath with continual flipping. To obtain brown crystals, the synthesized azo compound is filtered, dried, and subsequently recrystallized using an alcohol/water mixture, yielding a product with an 88% yield and a melting point of 230 °C. The chemical composition of the synthesized reagent, 2-amino-4-(4-nitrophenyl)diazenyl pyridine-3-ol (ANPDP), was determined (Scheme 1).44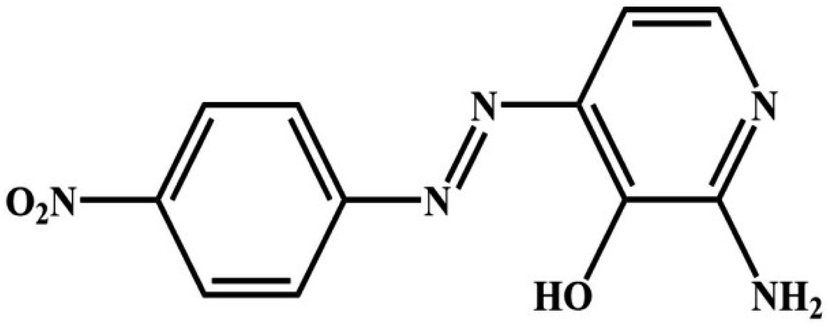 | ||
| Scheme 1 The chemical structure the synthesized ANPDP. | ||
FT IR(KBr) spectra of the ANPDP reagent shows 3497 cm−1 (OH), 3383 cm−1 (NH2), 1624 cm−1 (C![[double bond, length as m-dash]](https://www.rsc.org/images/entities/char_e001.gif) C), 1520 cm−1 (NO2), and 1403 cm−1 (NN). 1H-NMR(DMSO-d6): δ = 6.60 (d, 1H, J = 9.5 Hz, Hpy), 7.36 (bs, 2H, NH2), 7.52 (m, 3H, Haryl and py), 8.17 (d, 2H, J = 9.5 Hz, Ar–H), 11.27 (bs, 1H, OH).
C), 1520 cm−1 (NO2), and 1403 cm−1 (NN). 1H-NMR(DMSO-d6): δ = 6.60 (d, 1H, J = 9.5 Hz, Hpy), 7.36 (bs, 2H, NH2), 7.52 (m, 3H, Haryl and py), 8.17 (d, 2H, J = 9.5 Hz, Ar–H), 11.27 (bs, 1H, OH).
Membrane preparation
The sensor membranes were prepared using 28 mg of PVC, 56 mg of o-NPOE as a plasticizer, and 6.0 mg of ANPDP. If required, appropriate amounts of Na-TPB and TOPO were added to the formulation, specifically 2.0 mg of Na-TPB and 8.0 mg of TOPO. The membrane components were precisely dissolved in 1.0 mL of THF. We transferred a 100 μL quantity of the THF mixture onto the glass plate using a pipette. Before applying the coating, the glass surfaces were thoroughly cleaned with purified tetrahydrofuran (THF) to remove any dust and organic impurities. The membrane was spun at a speed of 750 rpm for 2.0 minutes, after which it was left to air dry for several minutes. The sensor membrane that was most effective was approximately 4.0–6.0 μm in thickness, measured by a Mitutoyo Digimatic Micrometer. Variations in solvent and solute quantities modulated the membrane thickness. Control membranes, identical to the experimental ones, were fabricated without ANPDP.Procedure
The membranes were attached to the spectrophotometer cells (sample and blank), which were already filled with 2.5 milliliters of thiel buffer solution adjusted to a pH of 4.5. Subsequently, a solution containing Pb2+ ions at a predetermined concentration was introduced into the sample cell. Following this, the solution underwent thorough stirring for a duration of 3.0 min to facilitate the migration of Pb2+ to the surface of the membrane. The absorption spectrum was measured in comparison to a reference membrane at 10 mm intervals across a range of wavelengths (350–750) nm. All measurements were conducted at ambient temperature. A calibration curve was generated by plotting absorbance values obtained from a series of Pb2+ ion standard solutions with diverse concentrations. This graph can be employed to ascertain the concentration of Pb2+ ions within the sample. The optode membrane was rejuvenated by immersing it in a 0.1 M EDTA solution for two minutes, rendering it suitable for subsequent use (Scheme 2). | ||
| Scheme 2 Diagram illustrating the configuration of the Pb2+ sensing optode membrane. | ||
Determination of stoichiometry for the Pb2+–ANPDP complex
The quantitative relationship between lead ions (Pb2+) and ANPDP within the formed complex was determined using both the molar ratio technique and the continuous variation method, also referred to as Job's method. This analysis was conducted at a pH level of 4.5, with concentrations of Pb2+ and ANPDP set at 2.5 × 10⁻³ M. The measurements were taken at the absorption peak of 639 nm to ensure accurate stoichiometric evaluation of the complex formed.Determination of Pb2+ and Pb4+ speciation in mixture
In a 25 mL conical flask, suitable aliquots (1.0–2.0 mL) of lead (II + IV) mixtures (preferably 1![[thin space (1/6-em)]](https://www.rsc.org/images/entities/char_2009.gif) :1, 1:5, 1:10) were obtained. It was lowered by adding a few drops of 6.0 M HCl and three to four drops of freshly made 2.5% (w/v) sodium azide solution. The mixture was then heated in a steam bath for 5.0–10 min to get rid of any extra reductant. The contents of the container were chilled to 25 ± 2.0 °C. Neutralized with diluted NH4OH; the reaction mixture was transferred quantitatively into a 10 mL measuring vial. The total lead (II + IV) concentration was determined using the calibration graph and the analytical procedure. In a 25 mL beaker, an aliquot of the above lead (II + IV) mixture was placed. To mask lead(IV), 1.0 mL of 0.01% (w/v) tartrate was added and neutralized with diluted NH4OH. The beaker's contents were transferred to a 10 mL measuring vial, and its lead(II) concentration was determined using the above analytical procedure. Utilizing a calibration graph, the lead concentration was measured in ng mL−1. This provides a measure of the lead originally present in the composition as lead(II). The concentration of lead(IV) was detected by subtracting the concentration of lead(II) from the corresponding concentration of total lead.
:1, 1:5, 1:10) were obtained. It was lowered by adding a few drops of 6.0 M HCl and three to four drops of freshly made 2.5% (w/v) sodium azide solution. The mixture was then heated in a steam bath for 5.0–10 min to get rid of any extra reductant. The contents of the container were chilled to 25 ± 2.0 °C. Neutralized with diluted NH4OH; the reaction mixture was transferred quantitatively into a 10 mL measuring vial. The total lead (II + IV) concentration was determined using the calibration graph and the analytical procedure. In a 25 mL beaker, an aliquot of the above lead (II + IV) mixture was placed. To mask lead(IV), 1.0 mL of 0.01% (w/v) tartrate was added and neutralized with diluted NH4OH. The beaker's contents were transferred to a 10 mL measuring vial, and its lead(II) concentration was determined using the above analytical procedure. Utilizing a calibration graph, the lead concentration was measured in ng mL−1. This provides a measure of the lead originally present in the composition as lead(II). The concentration of lead(IV) was detected by subtracting the concentration of lead(II) from the corresponding concentration of total lead.
Investigation of metal cation interferences
To assess potential interferences, a range of metal cations was analyzed using their corresponding nitrate and chloride salts. All the glasses that were used to make the solution were cleaned very carefully. They were scrubbed with a detergent solution, then put in a 10% (v/v) nitric acid solution, and finally rinsed many times with deionized water to get rid of any remaining dirt.Evaluation of precision and accuracy
To determine the accuracy and precision of the developed method, six different solutions with distinct concentrations of Pb2+ ions were tested. The test was done over six different days and looked at both repeatability (intra-assay precision) and intermediate precision (inter-assay precision). These parameters were evaluated using RSD percentage, calculated from six replicate measurements taken during the assay procedure within the same day.Reusability of sensor
To test if the sensor could be used again, it was put into a stirred solution of HCl (0.1 M) for a certain amount of time and then its absorbance was measured at λmax = 639 nm.Statistical analysis
The experiments were performed in six replicates and 95% significance level, with the results expressed as the mean ± standard deviation (SD). Statistical evaluation was carried out using the Student's t-test and F-test at 95% significance level to assess significance and variability. Data processing and analysis, including the calculation of averages and recovery rates, were conducted using Microsoft Excel 2007. This detailed statistical analysis provided an in-depth assessment of the experimental findings.Preparation of food samples for lead content assessment
Food samples, specifically spinach and fish, were sourced from a local market in Elmonofia, Egypt. The samples were initially desiccated in an oven at 105 °C to remove residual moisture, followed by grinding into a fine powder using an agate mortar. Approximately two grams of each powdered sample were precisely weighed and transferred into individual conical flasks. Ten milliliters of concentrated nitric acid were added to each flask for the digestion process. The mixtures were then evaporated to a nearly dry state, after which 3.0 mL of H2O2 was added to aid further decomposition. Once the mixtures were completely dry, we introduced 10 mL of deionized water into the flasks. In parallel, the vegetable material was subjected to high-temperature ash treatment in a muffle furnace at temperatures ranging from 500 to 550 °C. The resulting ash was dissolved in 10.0 mL of 0.1 M HNO3. This solution was treated with 2.0 mL of KI, 5.0 mL of HCl, and 10 mL of methyl isobutyl ketone (MIBK) for separation and extraction. The organic phase was then washed and diluted to ensure precise lead concentration measurement, with all prepared samples stored at 4.0 °C until analysis.45Analysis of lead in biological specimens
Urine (10–20 mL) or blood (5.0–10 mL) or specimens from individuals were gathered in polyethylene containers. These samples were promptly stored in a mixture of ice and salt, followed by preservation at −20 °C in the lab. A 100 milliliter micro-Kjeldahl flask was employed to contain the samples, which were mixed with a glass bead and ten milliliters of concentrated nitric acid. The flask was placed in a digester and gently heated. Once the initial vigorous reaction calmed down, the mixture was cooled. An additional 5.0 mL of concentrated HNO3 and 0.5 mL of 70% perchloric acid (HClO4) were carefully added. Heating continued until dense white fumes formed, with further HNO3 added as required, for a minimum of 30 minutes. After cooling, the solution was filtered and neutralized with diluted ammonia. The resulting solution was then quantitatively transferred to a 10 mL volumetric flask and diluted with deionized water. An aliquot was then prepared for lead quantification using tartrate as a masking agent.Assessment of lead levels in soil samples
A 100 gram portion of soil, which was dried and homogenized, was accurately measured and transferred into a 100 mL micro-Kjeldahl flask. Digestion was conducted by following a specific protocol that included the use of an oxidizing agent.46 Once the mixture had been broken down, it was filtered through Whatman no. 40 filter paper into a 25 mL volumetric flask and neutralized with a weak NH4OH solution. The resulting solution was then diluted to the appropriate volume with deionized water. From this, aliquots ranging from 1.0 to 2.0 mL were taken and transferred to a 100 mL volumetric flask. A calculated quantity of 5 × 10⁻³ M HCl was added to achieve a final acidity of 1.5 × 10⁻³ to 1 × 10⁻² M, along with 1.0 to 2.0 mL of 0.01% (m/v) tartrate solution to serve as a masking agent. The lead concentration was quantified using the previously established analytical procedure, referencing a calibration curve created in parallel.Assessment of lead levels in environmental water samples
Filtered water samples (100 mL) from Benha, Egypt, were evaporated to concentrate salts, utilizing 10 mL of concentrated HNO3 in a fume hood, followed by heating with an equal volume of deionized water. After cooling, we neutralized the mixture with a diluted ammonium hydroxide solution. The solution was then filtered and quantitatively transferred into a 100 mL volumetric flask, with deionized water added to achieve the desired volume. An aliquot of 1.0–2.0 mL from this concentrated sample was placed in a 10 mL measuring flask, where the lead concentration was assessed using tartrate as a masking agent to mitigate interference from Cu2+ ions.Quantitative analysis of lead species in mixed solutions
Different amounts of mixed lead (II and IV) solutions were made in a 25 mL conical flask. These amounts were 1.0–2.0 mL each. The ratios of the solutions were 1:1, 1:5, and 1:10. To change the tetravalent lead to divalent lead, a few drops of 6.0 M HCl and 3.0 to 4.0 drops of a new 2.5% (w/v) sodium azide solution were added. The mixture was heated in a steam bath for 5.0 to 10 minutes to eliminate any excess reducing agents. Once cooled to room temperature, the mixture was neutralized with diluted NH4OH and quantitatively transferred to a 10 mL volumetric flask. The total concentration of lead (II and IV) was quantified using a calibration curve. To separate lead(II), 1.0 mL of 0.01% (w/v) tartrate was added to a separate portion of the mixed solution. This portion was also neutralized before analysis. The concentration of lead(IV) was derived by subtracting the lead(II) value from the total lead concentration.
Results and discussion
Spectral insights into the multifunctional behavior of ANPDP
The sensor operates based on a bulk equilibrium process between the organic phase of the plasticized PVC membrane and the surrounding aqueous solution. Within this membrane, ANPDP serves a dual function as both a chromoionophore and an ionophore. Upon the diffusion of Pb2+ ions into the membrane, they interact with ANPDP to form a complex, resulting in a detectable change in the membrane's optical properties. The complexation of Pb2+ ions by ANPDP was studied using techniques such as continuous variation and molar ratio analysis. Results indicated that a 2:1 complex forms between ANPDP and Pb2+ ions, accompanied by the deprotonation of ANPDP and proton release into the solution.
This result is confirmed from studying the Fourier-transform infrared spectra (FTIR) for ANPDP and [(ANPDP)2–Pb] complex which represented the disappearing of νStretch at 3497 cm−1 corresponded to o-OH group and shifting of νStretch 1403 cm−1 corresponded to the –NN– group to νStretch 1391 cm−1 after the complexation process. In addition to a new stretching band at 463 corresponding to Pb–O bond formation. Finally, by analyzing the FTIR spectra of both ANPDP and the ANPDP2–Pb complex, the authors postulated the structure of the complex as represented in Scheme 3.
 | ||
| Scheme 3 The suggested chemical structure of the ANPDP2–Pb2+ complex. | ||
Fig. 1 presents the absorption spectra of the membrane after it was equilibrated in a thiel buffer solution with a pH of 4.5 and different concentrations of Pb2+ ions. As expected, the absorbance corresponding to the uncomplexed ligand decreases (λmax = 453 nm), while the absorbance of the Pb2+–ANPDP complex rises (λmax = 639 nm) as more Pb2+ ions are introduced. The formation of the complex is confirmed by the appearance of an isosbestic point at 548 nm, indicating a clear transition between the free ligand and its complexed form with Pb2+ ions.
 | ||
| Fig. 1 Absorption spectra of 1- ANPDP membrane and its optodes upon contact with (2–7), 25, 50, 75, 100, 125 and 150 ng mL−1 Pb2+ at pH 4.5. | ||
Effect of pH on optode performance for lead detection
The pH level affects the formation of complexes between ligands and metal ions because changes in pH can cause the ligand to lose or gain protons.47 To assess the performance of the optode, a variety of buffer solutions, including acetate, borate, phosphate, thiel, and universal buffers, were evaluated. Thiel buffer proved to be the most effective. Fig. 2 illustrates how pH variations affect the optode's performance. Absorbance was measured at 639 nm for a 100 ng mL−1 Pb2+ solution at different pH levels, using a reference membrane for comparison. The best response occurred around pH 4.0–5.0, but beyond pH 6.5, the response weakened, likely due to the dissociation of the Pb4+ complex in solution. Testing in alkaline media was avoided due to Pb2+ ion precipitation. The diminished response at low pH can be attributed to competition between hydrogen ions and Pb2+ ions for binding to ANPDP. | ||
| Fig. 2 Effect of pH on the ANPDP membrane immersed in 100 ng mL−1 of Pb2+ at the optimum condition. | ||
Optimization of optode composition
The performance of an optode, in terms of both sensitivity and selectivity for the target ion, is highly dependent on the membrane composition, including the chosen ionophore, additives, and solvent mediator.48 To optimize the membrane's response, various factors were systematically evaluated. These included the amount of ionophore, selection of the plasticizer, the presence of TOPO, and the incorporation of NaTPB, which acts as a lipophilic additive and provides anionic sites. The effects of these variables were thoroughly tested to enhance the optode's overall detection capabilities.Selection of plasticizer for improved membrane performance
To have a uniform organic phase in an optode membrane, the plasticizer that is used as the membrane solvent must be able to physically bond with the polymer while the membrane is being made. In this study, several plasticizers with varying polarities—namely DES, DBP, DMS, and o-NPOE—were evaluated. Membranes incorporating DBP and DES showed unsatisfactory physical properties, suggesting these plasticizers were not ideal for this membrane. Of the remaining options, o-NPOE exhibited the best properties (as outlined in Table 1) and was therefore selected for further research. Absorbance readings of optode membranes with different plasticizers were performed using a 100 ng mL−1 Pb2+ solution, compared to a reference membrane that lacked Pb2+ ions.| Membrane | ANPDP (mg) | PVC (mg) | Plasticizer (56 mg) | TOPO (mg) | Na-TPB (mg) | Absorbancea |
|---|---|---|---|---|---|---|
| a Measured absorbance was recorded from a solution 100 ng mL−1 of Pb2+ ion (pH 4.5). | ||||||
| 1 | 6.0 | 28 | DBP | — | — | 0.107 |
| 2 | 6.0 | 28 | DES | — | — | 0.117 |
| 3 | 6.0 | 28 | DMS | — | — | 0.134 |
| 4 | 6.0 | 28 | o-NPOE | — | — | 0.224 |
| 5 | 6.0 | 28 | DBP | 8.0 | 2.0 | 0.278 |
| 6 | 6.0 | 28 | DES | 8.0 | 2.0 | 0.291 |
| 7 | 6.0 | 28 | DMS | 8.0 | 2.0 | 0.412 |
| 8 | 6.0 | 28 | o-NPOE | 8.0 | 2.0 | 0.555 |
Optimizing ANPDP concentration for enhanced sensitivity
As an ionophore and a chromoionophore, ANPDP has two roles in the optical sensor configuration, so its concentration in the optode membrane formulation needs to be carefully adjusted. To investigate this, absorbance at 639 nm was recorded for membranes containing varying levels of ANPDP, in the presence of a 100 ng mL−1 Pb2+ ion solution (see Fig. 3). A “blank” membrane, which lacked ANPDP, was used in a thiel buffer at pH 4.5 as a control. As ANPDP concentration increased up to 6.0 mg, the absorbance values correspondingly rose (Table 2, membranes 1–4). However, surpassing this 6.0 mg concentration did not enhance sensitivity and was considered unsuitable because of the potential risk of ANPDP leaking from the membrane. | ||
| Fig. 3 Effect of ANPDP concentration on the membrane immersed in 100 ng mL−1 of Pb2+ at the optimum condition. | ||
| Membrane | DEABT (mg) | TOPO (mg) | Na-TPB (mg) | PVC/DMS (mg mg−1) | Response time (min) | Absorbancea |
|---|---|---|---|---|---|---|
| a Measured absorbance was recorded from a solution 100 ng mL−1 of Pb2+ ion (pH 4.5).b Optimum composition. | ||||||
| 1 | 4.0 | 5.0 | 7.0 | 28/56 | 5.0 | 0.095 |
| 2 | 5.0 | 5.0 | 6.0 | 28/56 | 5.0 | 0.231 |
| 3 | 6.0 | 6.0 | 4.0 | 28/56 | 5.0 | 0.509 |
| 4 | 7.0 | 7.0 | 2.0 | 28/56 | 5.0 | 0.256 |
| 5 | 12 | — | — | 28/56 | 15 | 0.128 |
| 6 | 6.0 | 10 | — | 28/56 | 9.0 | 0.483 |
| 7 | 9.0 | — | 7.0 | 28/56 | 20 | 0.419 |
| 8b | 6.0 | 8.0 | 2.0 | 28/56 | 5.0 | 0.555 |
| 9 | 6.0 | 7.0 | 3.0 | 28/56 | 5.5 | 0.436 |
| 10 | 6.0 | 6.0 | 4.0 | 28/56 | 7.0 | 0.458 |
| 11 | 6.0 | 5.0 | 5.0 | 28/56 | 7.9 | 0.415 |
| 12 | 6.0 | 4.0 | 6.0 | 28/56 | 8.0 | 0.427 |
| 13 | 6.0 | 6.0 | 4.0 | 28/56 | 5.0 | 0.396 |
| 14 | 6.0 | 5.0 | 5.0 | 28/56 | 8.0 | 0.389 |
| 15 | 6.0 | 7.0 | 3.0 | 28/56 | 7.0 | 0.466 |
| 16 | 6.0 | 8.0 | 2.0 | 28/56 | 6.0 | 0.555 |
| 17 | 6.0 | 9.0 | 1.0 | 28/56 | 5.0 | 0.538 |
Optimizing membrane composition
Leveraging synergistic effects in solvent extraction is a proven approach for enhancing metal ion extraction efficiency. Synergism here refers to the marked improvement in extraction outcomes when two reagents are combined, achieving better results than when each is used alone.48 A common example involves combining an uncharged base (S) with an acidic chelating agent (HR) to extract a metal ion (Mn+). This synergy is especially effective when the metal's coordination potential is underutilized in the MRn chelate. In such scenarios, adding the extractant S promotes the formation of a mixed complex, MRnSx, which significantly increases extraction efficiency compared to the original chelate.Investigating the influence of TOPO on our sensor membrane system has uncovered a range of fascinating effects. As summarized in Table 2, various membranes were prepared to assess the relationship between composition and response behavior. Notably, a comparison between membranes 5 and 6 showed that the inclusion of TOPO led to a marked reduction in response time. This effect is likely due to the synergistic interaction between TOPO and the Pb2+–ANPDP complexation, where TOPO appears to function as a catalyst, facilitating the extraction of Pb2+ ions into the membrane and accelerating their complexation.
In contrast, when TOPO is omitted and Na-TPB, a suitable anionic additive, is incorporated into the membrane, there is minimal improvement in response time (membrane 7 in Table 2). The essential takeaway here is understanding Na-TPB's role as a phase transfer catalyst, enhancing the uptake of metal ions like Pb2+ into the optode membrane. This insight suggests that response time is governed not solely by the diffusion of Pb2+ ions into the membrane but more critically by the intricate interaction and complexation between Pb2+ ions and ANPDP.
When TOPO is incorporated, Na-TPB accelerates the response time by increasing the diffusion rate of Pb2+ ions into the sensor membrane, as evidenced in membranes 13–17 in Table 2. This adjustment implies that with TOPO, the rate-limiting factor shifts towards Pb2+ ion diffusion. Essentially, adding Na-TPB boosts Pb2+ ion diffusion into the optode membrane, enhancing response efficiency. Achieving an ideal balance of response speed and absorbance change involved carefully calibrating TOPO and Na-TPB levels (Table 2). The optimized membrane composition—6.0 mg ANPDP, 2.0 mg Na-TPB, 28 mg PVC, 56 mg o-NPOE, and 8.0 mg TOPO—exhibits the most favorable response characteristics. Notably, an excessive Na-TPB concentration can cause unwanted reagent leakage into the sample solution.
Effect of temperature's
The temperature dependence of the optical sensor film was investigated and conducted. Absorption spectra was performed across a temperature range of 20 to 50 °C at a wavelength of 639 nm. A decline in absorbance at 639 nm was observed with rising temperature of the Pb2+ sample. This reduction is attributed to thermal deactivation linked to heightened atomic vibrations within the ionic structure49 and a diminished interaction between the Pb2+ ions and the membrane sensor. At temperatures exceeding 60 °C, no changes in absorbance were detected, suggesting a lack of complex formation between Pb2+ and ANPDP. Optimal sensitivity and selectivity were achieved at a temperature of 25 ± 2.0 °C.The development of an effective sensor membrane required several key adjustments: modifying the membranes chemical makeup, maintaining a controlled ambient temperature of 25 ± 2.0 °C, regulating the environmental moisture levels, and extending the drying period of the coating solution to 48 hours instead of the originally planned 24 hours. External variables like temperature and humidity, according to these investigations, have a significant impact on the sensor membrane preparation procedures. Despite a month of preservation in a sealed bag, the produced sensor did not alter its physical appearance.
Influence of stirring on optode sensitivity
The reaction of Pb2+ with the sensor membrane takes place after 10 min. To facilitate the migration of Pb2+ ion to the surface of the membrane for complex formation, a stirring process was done. Stirring at various velocities was studied from 400 to 1000 rpm. The most favourable one is at 750 rpm. The response efficiency of the designed optode shows a marked improvement with the stirring of the Pb2+ solution, achieving nearly three times the response rate of a non-stirred setup. This enhancement can be attributed to the active transport of Pb2+ ions toward the ANPDP chromoionophore within the membrane, which is significantly accelerated by stirring. Stirring facilitates the Pb2+–ANPDP interaction and expedites Pb2+ ion diffusion through the membrane, leading to faster complexation. Conversely, in static conditions, Pb2+ ion movement across the membrane relies solely on the concentration gradient, inherently slowing down the process and reducing overall sensor responsiveness.50Selectivity of the optode
The selectivity of a sensor membrane is essential for its effectiveness, as it determines the membrane's capability to selectively detect the target ion, Pb2+, in the presence of other competing ions. To assess this selectivity, the effect of various interfering ions on the Pb2+ optode's absorbance was examined. The relative error (RE), indicating the influence of these interfering ions, was calculated using the formula: RE (%) = [(A − A0)/A0] × 100, where A represents the absorbance in the presence of interfering ions, and A0 is the baseline absorbance without interference. Table 1 shows the RE values for various ions. The results reveal that with a fixed Pb2+ concentration of 100 ng mL−1, the RE for Cu2+ and Cd2+, even at concentrations 1250 times and 2000 times higher than that of the other ions, respectively, remains within ±5.0%. This demonstrates that the Pb–ANPDP optode has a high degree of selectivity for Pb2+ ions in aqueous solutions.Analytical figures of merit
In the first approach, the sensor's lifespan was evaluated by repeatedly immersing a single membrane in a 75 ng mL−1 Cu2+ solution under optimal conditions. After 35 measurements, a slight decrease of approximately 4.5% in absorbance intensity was noted. Additionally, a separate membrane was submerged in water for a maximum duration of one month. After this period, the absorbance at 637 nm decreased by 5.0%. These findings indicate that the sensor exhibits excellent stability, maintaining its performance even with extended use and storage, confirming its reliability for multiple applications and a minimum storage period of one month.
Dynamic range and detection limit
The absorbance response of the designed sensor membrane is illustrated over a range of Pb2+ ion concentrations. This response profile indicates a linear relationship between absorbance and Pb2+ ion concentration from 6.0 to 160 ng mL−1, with the equation Y = 290.5X + 0.06 (R2 = 0.9988), where X represents the molar concentration of Pb2+ ions, and Y denotes absorbance. The detection and quantification limits of the optode membrane—defined by the analyte concentration yielding a signal equivalent to the blank signal plus three and ten times the blank's standard deviation, respectively, were established at 1.8 ng mL−1 and 7.90 ng mL−1.Stability evaluation of the optode membrane
In the optimally configured optode membrane, response efficiency is largely dictated by the time required for Pb2+ ions to diffuse from the main solution to the sensor membrane surface, where they react with ANPDP. Response time was assessed by tracking the absorbance change when transitioning from a thiel buffer (pH 4.5) to a solution containing 100 ng mL−1 of Pb2+ ions. The membrane displayed a response time, reaching 97.5% of its maximum absorbance, at around 5.0 minutes across both high and low Pb2+ ion concentrations.The stability evaluation of the optode membrane involved immersing it in aqueous solutions with pH values below 6.5 for a minimum of 5.0 hours. Over this period, absorbance was measured 10 times (at 20 minutes intervals), yielding a relative standard deviation of 0.88%, which indicates that ANPDP remained fully retained within the membrane. Additionally, the membrane showed no absorbance changes under light exposure, confirming that the optical stability was unaffected by photodegradation or ANPDP leaching. Stored in ambient air, the membrane maintained stable performance even after 21 days without use.
Effective regeneration of sensor membrane
The sensor membrane's absorbance did not fully reset when switching from higher to lower concentrations of Pb2+ ions. To regenerate an optode membrane that had previously been exposed to Pb2+, various reagents were tested, including HCl, HNO3, H2SO4, NaOH, and EDTA. A 0.1 M EDTA solution stood out as the most effective, completely restoring the sensor's functionality after just a 2.0 minutes treatment. Following this regeneration, the optode membrane requires immersion in a phosphate buffer (pH 4.5) for at least 5.0 minutes before it is ready for further analysis (Table 3).| Ion | TR | RE% | Ion | TR | RE% |
|---|---|---|---|---|---|
| K+, Na+, B4O72− | 18000 |
−2.7 | Al3+, Cr6+, CO32− | 7000 | −2.5 |
| Tl+, Ag+, Li+, citrate | 16500 |
−2.9 | Fe2+, Fe3+, oxalate | 6250 | 3.3 |
| Ca2+, Mg2+, acetate | 15000 |
3.1 | Pd2+, Hg2+, SO42− | 5500 | −3.7 |
| Sr2+, Ba2+, PO43− | 13000 |
−3.6 | Hg2+, Cr3+ HCO3− | 4750 | 4.3 |
| Ge4+, Ti4+, NO2− | 12000 |
−3.9 | Te4+, Se4+, Co2+ | 4000 | −4.4 |
| Bi2+, Mn2+, S2O32− | 10500 |
4.0 | Zn2+, Sn4+, SCN− | 3200 | −3.7 |
| Zr4+, Th4+, IO3− | 9500 | −3.7 | Au3+, La3+, Cr3+ | 2650 | 3.5 |
| Mo6+, W6+, Br− | 8500 | −3.9 | Cd2+, Sn2+, Cl− | 2000 | 2.5 |
| UO22+, Pt4+, succinate | 7750 | 4.2 | Ni2+, Cu2+ | 1250 | 4.6 |
Comparative analysis of Pb2+ detection
The analytical performance of the proposed optode for Pb2+ ion separation and quantification was evaluated alongside various optical and potentiometric sensor techniques, with comparisons drawn on detection limits and linear response ranges as reported in other studies.51–60 Although an absorption-based optode using 5-(2′-bromophenylazo)-6-hydroxy-pyrimidine-2,4-dione59 offers a lower detection threshold, the proposed optode exhibits sensitivity nearly threefold higher, while minimizing interference from ions such as Hg, Ni, Cu, Cd, Fe, and Zn. Furthermore, it demonstrates improved sensitivity over potentiometric sensors.50–52 The proposed method was also assessed in relation to recent fluorescence and reflectance-based sensors55,60 in terms of unique analytical characteristics, as shown in Table S1 (ESI†).Despite this, the current method distinguishes itself with high recovery efficiency, rapid analysis times, and cost-effectiveness, alongside eliminating the need for organic solvents. Importantly, the proposed optode offers remarkable lead ion selectivity, especially against common alkali and alkaline earth ions, achieving the selectivity coefficients essential for precise Pb2+ detection across a range of samples, including food, biological matrices, and environmental water sources.
Using a calibration curve, the concentration of lead in ng mL−1 was quantified, indicating the initial presence of Pb2+ in the mixture. The Pb4+ concentration was subsequently calculated by subtracting the Pb2+ value from the total lead concentration. This approach yielded highly reproducible results, as demonstrated in Table S2† (supplemental), which presents a summary of multiple determinations.
Applications
The developed optode was employed alongside spectrophotometric techniques to identify lead concentrations in the nanogram range within water samples. To assess lead contamination, these samples were spiked with varying concentrations of a lead standard solution. The findings, along with the recovery percentages, are summarized in Table 4. According to U.S. standards, the average lead concentration in drinking water is 50 ng mL−1.61 The results obtained from the proposed optode were cross-validated using the ICP-AES method. The outcomes of this lead analysis procedure demonstrated a high level of agreement with those achieved through ICP-AES analysis.| Sample | Lead (ng mL−1) | Recovery (%) | sr (%)b | ||
|---|---|---|---|---|---|
| Added | Founda | ICP-AES | |||
| a Average of six replicate determinations.b sr: Standard error = ± tSD/√N with 95% confidence level (N = 6). | |||||
| Rain water | 0.0 | 8.8 | 9.0 | ||
| 40 | 50.2 | 47.6 | 102.87 | 0.42 | |
| 80 | 86.7 | 91.3 | 97.64 | 0.66 | |
| Sea water | 0.0 | 18.5 | 18.3 | ||
| 60 | 79.6 | 77.2 | 101.40 | 0.51 | |
| 120 | 137.0 | 140.4 | 98.92 | 0.38 | |
| Well water | 0.0 | 27.0 | 26.8 | ||
| 35 | 63.7 | 60.2 | 102.74 | 0.71 | |
| 70 | 98.3 | 94.7 | 101.34 | 0.57 | |
| Tap water | 0.0 | 12.0 | 11.8 | ||
| 55 | 66.4 | 68.0 | 100.91 | 0.73 | |
| 130 | 144.5 | 140.1 | 101.76 | 0.85 | |
| River nile | 0.0 | 28.4 | 28.0 | ||
| 45 | 75.0 | 71.9 | 102.18 | 0.46 | |
| 90 | 116.7 | 120.0 | 98.86 | 0.75 | |
The feasibility of utilizing the proposed optode for detecting Pb2+ ions in real biological samples was evaluated. The results obtained from analyses conducted with the ANPDP membrane showed excellent correlation with the values obtained through ICP-AES. These findings are detailed Table 5. Notably, the abnormally elevated lead level in the patient diagnosed with hemolytic anemia is probably attributed to significant interactions between lead and other elements, such as zinc and arsenic.
| Serial no. | Sample | Lead (ng mL−1) | Sample source a | |
|---|---|---|---|---|
| ICP-AES | Proposed methodb | |||
| a Samples were from Benha Medical College Hospital.b Average of five determinations ± SD. | ||||
| 1 | Blood | 11.4 | 11.5 ± 0.70 | Convulsion patient (M) |
| Urine | 3.2 | 3.1 ± 0.80 | ||
| 2 | Blood | 33.5 | 33.4 ± 1.05 | Hemolytic anemia patient [due to zinc-protoporphyrin (ZPP) accumulation] (F) |
| Urine | 9.1 | 9.0 ± 0.75 | ||
| 3 | Blood | 22.0 | 22.1 ± 1.00 | Lung cancer patient (M) |
| Urine | 6.9 | 6.8 ± 0.85 | ||
| 4 | Blood | 0.30 | 0.29 ± 0.40 | Normal adult (F) |
| Urine | 0.10 | 0.10 ± 0.50 | ||
To demonstrate the effectiveness of the proposed technique, it was utilized for the spectral identification of lead in food samples. The optode successfully assessed a variety of vegetable specimens, as presented in Table 6. The findings reveal that the measured levels of Pb2+ are close to the detection threshold, with concentrations for the vegetable samples ranging from 5.0 to 20 μg, corresponding to 5.0 to 20 ppb. Under optimized conditions, the ANPDP membrane developed was applied to detect Pb2+ in food products acquired from supermarkets in Benha, Egypt, including items such as poultry and fish. For the validation of the proposed optode, the samples were fortified with varying amounts of Pb2+, and the recovery percentages were calculated. The analytical results for six replicates are presented in Table 6. In the preliminary evaluation, the recovery rates of Pb2+ in the spiked samples varied from 97.44% to 103.53%, confirming the proposed method's reliability and validity.
| Samples | Added (μg) | Founda (μg g−1) | Recovery% | |
|---|---|---|---|---|
| ANPDP optode | ICP-AES | |||
a Results expressed as:  is the mean of n observations of x, s is the standard deviation. The F- and t-values refer to comparison of the proposed method with the ICP-AES method.b Theoretical values at 95% confidence level: F = 5.05 and t = 2.78. is the mean of n observations of x, s is the standard deviation. The F- and t-values refer to comparison of the proposed method with the ICP-AES method.b Theoretical values at 95% confidence level: F = 5.05 and t = 2.78. |
||||
| Lettuce leaves | — | 0.60 ± 0.004 | 0.65 ± 0.015 | — |
| 0.5 | 1.12 ± 0.008 | 1.10 ± 0.026 | 101.82 | |
| 1.0 | 1.56 ± 0.009 | 1.75 ± 0.030 | 97.50 | |
| Fb = 3.73, tb = 1.62 | ||||
| Cabbage leaves | — | 0.85 ± 0.003 | 0.80 ± 0.017 | — |
| 0.75 | 1.64 ± 0.007 | 1.42 ± 0.026 | 102.50 | |
| 1.50 | 2.32 ± 0.009 | 3.45 ± 0.033 | 98.72 | |
| F = 3.64, t = 1.17 | ||||
| Fish | — | 0.05 ± 0.008 | 0.06 ± 0.021 | — |
| 0.40 | 0.44 ± 0.006 | 0.50 ± 0.032 | 97.78 | |
| 0.80 | 0.88 ± 0.002 | 0.82 ± 0.036 | 103.53 | |
| F = 3.84, t = 1.92 | ||||
| Spinach leaves | — | 0.75 ± 0.007 | 0.75 ± 0.014 | — |
| 0.60 | 1.32 ± 0.011 | 1.45 ± 0.021 | 97.78 | |
| 1.20 | 1.90 ± 0.010 | 2.05 ± 0.018 | 97.44 | |
| F = 3.52, t = 1.65 | ||||
| Meat | — | 0.04 ± 0.006 | 0.03 ± 0.008 | — |
| 0.65 | 0.71 ± 0.010 | 0.66 ± 0.017 | 102.90 | |
| 1.30 | 1.37 ± 0.012 | 1.35 ± 0.026 | 102.24 | |
| F = 2.98, t = 1.33 | ||||
| Tomato leaves | — | 0.48 ± 0.005 | 0.50 ± 0.022 | — |
| 0.70 | 1.15 ± 0.09 | 1.25 ± 0.031 | 97.46 | |
| 1.40 | 1.93 ± 0.013 | 1.80 ± 0.027 | 102.66 | |
| F = 3.37, t = 1.48 | ||||
The evaluation of performance was conducted through the calculation of the t-value (to assess accuracy) and the F-test (to evaluate precision) in comparison to the GF-AAS method. Mean values were determined using Student's t-test and F-test at a confidence level of 95%, with five degrees of freedom.62 The findings indicated that the computed values did not surpass the theoretical thresholds, suggesting no significant differences when compared to the referenced procedure.
The proposed sensor was utilized for measuring Pb2+ levels in both soil and gasoline samples. A total of three commercial samples of soil and gasoline sourced from various suppliers were analyzed using the proposed method alongside comparative techniques. It is widely recognized that organic lead compounds are incorporated into gasoline as anti-knock agents. Tetraalkyl lead compounds present in the gasoline samples are transformed into water-soluble species. The findings are presented in Tables S3 and S4 (ESI),† demonstrating alignment with results from the comparative method (ICP-AES). No significant statistical differences were observed between the values obtained by both methodologies when a t-test was applied at a 95% confidence level.
Conclusion
The developed optode was efficiently created for the detection of Pb2+ ions under optimal conditions. Advantages such as cost-effectiveness, ease of production, capability, regeneration, short response time, high stability, sensitivity, low detection and quantification limits (1.8 and 5.9 ng mL−1, respectively), as well as a wide dynamic range (6.0–160 ng mL−1), contribute to the success of the proposed optode. As the concentration of Pb2+ ions increased from 30 ng mL−1 to 90 ng mL−1, the response time rose significantly, from 4.0 minutes to 5.0 minutes. This approach exhibits superior sensitivity and selectivity compared to previous techniques. Additionally, the optode demonstrates high selectivity towards Pb2+ ions, showing minimal response to other cations and anions. Optode selectivity stands out as a key advantage of the proposed sensor, complementing its other spectrophotometric features. The proposed sensor offers a practical and cost-effective alternative for Pb2+ detection in aqueous solutions, with a straightforward measurement technique that does not necessitate expensive equipment. A discerning comparison of our sensor against its counterparts from previous studies accentuates its swiftness and simplicity, with a detection limit standing shoulder to shoulder with the best in the field. To show that the proposed method could be used in real life, samples from the environment, living things, and food were tested using both the proposed sensor and the ICP-AES method. The accuracy and reliability of the sensor were further investigated by determining Pb2+ in real samples using the standard addition method. High recoveries (97.44–103.53%) indicated that the proposed procedure is reliable, accurate, and selective, making it suitable for the determination of trace quantities of Pb2+ ions.Data availability
All the authors declare no conflicts of interest.Author contributions
Abdullah Alluhayb and Ahmed Alanazi: conceptualization, data curation, investigation, methodology, visualization, validation, writing – original draft, writing–review & editing. Alaa Younis and Khaled Debbabi: conceptualization, data curation, investigation, methodology, validation, writing–original draft, writing–review & editing. Refat El-Sayed and Alaa Amin: conceptualization, methodology, data curation, investigation, supervision, validation, writing – original draft, writing – review & editing.Conflicts of interest
There is no conflict of interestAcknowledgements
The authors extend their appreciation to Qassim, Gouf, Umm-Al-Qura and Benha Universities, Saudi Arabia and Egypt for supporting this work.References
- L. X. Yang, L. X. Xie, M. L. Chu, H. Wang, M. W. Yuan, Z. Yu, C. Wang, H. Yao, S. M. Islam, K. Shi, D. Yan and S. Ma, Angew. Chem., Int. Ed., 2022, 61, e202112511 CrossRef CAS PubMed.
- R. Akhbarizadeh, S. Dobaradaran, G. Parhizgar, T. C. Schmidt and R. Mallaki, Environ. Res., 2021, 202, 111706 CrossRef CAS.
- H. Arfaeinia, S. Dobaradaran, M. Moradi, H. Pasalari, E. A. Mehrizi, F. Taghizadeh, A. Esmaili and M. Ansarizadeh, Sci. Total Environ., 2019, 653, 783–791 CrossRef CAS PubMed.
- S. Y. Bae, X. Zeng and G. M. Murray, J. Anal. At. Spectrom., 1998, 13, 1177–1180 RSC.
- S. Squadrone, M. Prearo, P. Brizio, S. Gavinelli, M. Pellegrino, T. Scanzio, S. Guarise, A. Benedetto and M. C. Abete, Chemosphere, 2013, 90, 358–365 CrossRef CAS PubMed; M. Vigeh, K. Yokoyama, A. A. Shinohara and M. Afshinrokh, Toxicol. Lett., 2011, 205, S197 CrossRef.
- S. T. F. Glahn and H. Foth, Toxicol. Lett., 2009, 189, S224–S225 Search PubMed.
- Z. Jaworowski, F. Barbalat, C. Blain and E. Peyre, Sci. Total Environ., 1985, 43, 103–126 CrossRef CAS PubMed.
- M. B. Mood, K. Naseri, Z. Tahergorabi, M. R. Khazdair and M. Sadeghi, Front. Pharmacol, 2021, 12, 643972 CrossRef PubMed.
- C. C. Su, K. Y. Tsai, Y. Y. Hsu, Y. Y. Lin and I. B. Lian, Oral Oncol., 2010, 46, 586–590 CrossRef CAS PubMed.
- Joint FAO/WHO Expert Committee on Food Additives Sixty-First Meeting, Rome, 2003 Search PubMed.
- P. A. Carson and C. J. Mumford, Hazardous Chemicals Handbook, Butterworth-Heinemann, London, 1994, p. 47 Search PubMed.
- K. Kebede, M. Titus and M. Bhekie, J. Cleaner Prod., 2017, 151, 475–493 CrossRef.
- ATSDR, 2011. Agency for Toxic Substances and Disease Registry. https://www.atsdr.cdc.gov/substances/toxsubstance.asp?toxid=22 (accessed 22 November 2020) Search PubMed.
- EPA, United States Environmental Protection Agency, Ground water and drinking water under the Clean Water Act (CWA). (https://www.epa.gov/ground-water-and-drinking-water/basic-information-about-lead-drinking-water) (accessed on 14 June 2019), 2020 Search PubMed.
- T. Borahan, T. Unutkan, N. B. Turan, F. Turak and S. Bakırdere, Food Chem., 2019, 299, 125065 CrossRef CAS.
- E. J. Pacer, C. D. Palmer and P. J. Parsons, Spectrochim. Acta, Part B, 2022, 190, 106324 CrossRef CAS.
- S. Tokalıoglu, S. T. H. Moghaddam, Y. Yılmaz and S. Patat, Microchem. J., 2023, 195, 109515 CrossRef.
- M. Atasoy, ChemistrySelect, 2024, 9, e202402842 CrossRef CAS.
- M. S. Dundar, H. Gucunlu, C. Caner, H. Altundag, O. Gulec and M. Arslan, J. Chem. Metrol., 2024, 18, 71–82 Search PubMed.
- X.-S. Wei, Y.-W. Wu and L.-J. Han, Anal. Lett., 2015, 48, 996–1008 CrossRef CAS.
- Z. Guo, P. Chen, L. Yin, M. Zuo, Q. Chen, H. R. El-Seedi and X. Zou, Food Control, 2022, 132, 108498 CrossRef CAS.
- B. Gercken and R. M. Barnes, Anal. Chem., 1991, 63, 283–287 CrossRef CAS.
- H. Zheng, J. Ma, Z. Zhu, Z. Tang and S. Hu, Talanta, 2015, 132, 106–111 CrossRef CAS.
- S. Timoori, Anal. Methods Environ. Chem. J., 2019, 2, 55–62 CrossRef CAS.
- O. Ozbek, H. Gezegen, A. Cetin and O. Isildak, ChemistrySelect, 2022, 7, e202202494 CrossRef CAS.
- A. Seifi, A. Afkhami and T. Madrakian, J. Appl. Electrochem., 2022, 52, 1513–1523 CrossRef CAS.
- S. Hu, S. Zhang, J. Qin, K. Cai, C. Peng, L. Luo, Y. Gu and Y. Mei, Microchem. J., 2024, 205, 111154 CrossRef CAS.
- K. Torrarit, S. Cotchim, A. Phonchai, K. Chaisiwamongkhol and W. Limbut, Microchim. Acta, 2024, 191, 417 CrossRef CAS PubMed.
- N. H. Pratiwi, M. Y. Azis, D. A. Setyorini and R. S. Rahayu, Anal. Bioanal. Electrochem., 2022, 14, 331–347 CAS.
- L. R. G. Silva, Y. S. Mutz, J. S. Stefano, C. A. Conte-Junior and R. Q. Ferreira, J. Food Compos. Anal., 2022, 110, 104564 CrossRef CAS.
- Z. Zhang, Z. Huang, D. Qin, D. Liu, X. Guo and H. Lin, Carbohydr. Polym., 2023, 323, 121427 CrossRef.
- Z. Dehghani, M. Akhond, S. R. H. Jangi and G. Absalan, Talanta, 2024, 266, 124977 CrossRef CAS PubMed.
- M. Chen, M. Hassan, H. Li and Q. Chen, Microchim. Acta, 2020, 187, 85 CrossRef CAS.
- A. S. Amin, Sens. Actuators, B, 2015, 221, 1342–1347 CrossRef CAS.
- N. Hassan and A. S. Amin, RSC Adv., 2017, 7, 46566–46574 RSC.
- M. Hemdan, M. A. Ali and A. S. Amin, Anal. Bioanal. Chem., 2024, 416, 3835–3846 CrossRef CAS.
- M. Hemdan, M. A. Ali, A. S. Doghish, S. S. A. Mageed, I. M. Elazab, M. M. Khalil, M. Mabrouk, D. B. Das and A. S. Amin, Sens., 2024, 24, 5143 CrossRef CAS.
- R. F. Alshehri, M. Hemdan, A. O. Babalghith, A. S. Amin and E. R. Darwish, RSC Adv., 2024, 14, 712–724 RSC.
- H. Hesham, S. M. El-Bahy, A. M. E. Hassan, A. S. Amin and I. J. Envir, Anal. Chem., 2023, 103, 4031–4048 Search PubMed.
- R. F. Alshehri, H. H. El-Feky, A. M. Askar, A. S. Amin and M. Aish, Spectrochim. Acta, Part A, 2024, 305, 123424 CrossRef CAS PubMed.
- M. Aish, R. F. Alshehri, A. S. Amin and E. R. Darwish, Food Chem., 2024, 439, 138112 CrossRef CAS.
- R. F. Alshehri, A. S. Amin and E. R. Darwish, Talanta Open, 2024, 9, 100285 CrossRef.
- A. I. Vogel, A Text Book of Quantitative Inorganic Analysis, ELBS, London, 4th edn, 1978 Search PubMed.
- H. A. Altantawy, W. I. Mortada, E. Abdel-Latif and Y. G. Abou El-Reash, Egypt. J. Chem., 2021, 64, 25–32 Search PubMed.
- G. Venkatesh, A. K. Singh and B. Venkataramani, Microchim. Acta, 2004, 144, 233–241 CrossRef CAS.
- M. L. Jacson, Soil Chemical Analysis, Prentice Hall, Englewood Cliffs, NJ, 1965, p. 326 Search PubMed.
- M. Ghaedi, A. Shokrollahi, M. R. Fathi, S. Gharaghani and M. Soylak, Quim. Nova, 2008, 31, 70–74 CrossRef.
- K. Seiler and W. Simon, Anal. Chim. Acta, 1992, 266, 73–87 CrossRef CAS.
- W. E. Morf, K. Seiler, P. Sorensen and E. Pungor, ed. Ion-Selective Electrodes, Academiai Kiado, 1989, Budapest, vol. 5, pp. 141–149 Search PubMed.
- M. Ahmad and R. Narayanaswamy, Sens. Actuators B Chem, 2002, 81, 259–266 CrossRef CAS.
- H. Agarwal, A. P. Gupta and G. L. Verma, J. Indian Chem. Soc., 2004, 81, 666–669 CAS.
- M. F. Mousavi, M. B. Barzegar and S. Sahari, Sens. Actuators B Chem, 2001, 73, 199–204 CrossRef CAS.
- M. R. Fathi, F. Darviche and M. R. Ganjali, Anal. Lett., 2000, 33, 1025–1035 CrossRef CAS.
- A. H. Kamel, Electroanalysis, 2007, 19, 2419–2427 CrossRef CAS.
- W. H. Chan, R. H. Yang, T. Mo and K. M. Wang, Anal. Chim. Acta, 2002, 460, 123–132 CrossRef CAS.
- S. S. Bozkurt, S. Ayata and I. Kaynak, Spectrochim. Acta, Part A, 2009, 72, 880–883 CrossRef PubMed.
- M. Lerchi, E. Bakker, B. Rusterholz and W. Simon, Anal. Chem., 1992, 64, 1534–1540 CrossRef CAS.
- N. Alizadeh, A. Moemeni and M. Shamsipur, Anal. Chim. Acta, 2002, 464, 187–196 CrossRef CAS.
- M. Aish, R. F. Alshehri, A. S. Amin and H. H. El-Feky, Talanta Open, 2023, 8, 100253 CrossRef.
- N. A. Yusof and M. Ahmad, Sens. Actuators B Chem, 2003, 94, 201–209 CrossRef CAS.
- E. A. Greenberg, S. L. Clesceri and D. A. Eaton, Standard Methods for the Examination of Water and Wastewater, American Public Health Association, Washington, DC, 1992, 18th edn, p. 3 Search PubMed.
- J. N. Miller and J. C. Miller, Statistics and Chemometrics for Analytical Chemistry, Prentice Hall, England, 5th edn, 2005 Search PubMed.
Footnote |
| † Electronic supplementary information (ESI) available. See DOI: https://doi.org/10.1039/d4ra08828j |
| This journal is © The Royal Society of Chemistry 2025 |