Two-temperature model of the non-thermal chemical dissociation of CO2†
Q.
Shen
 a,
A.
Pikalev
 ab,
F. J. J.
Peeters
 ac,
J.
Gans
 a and
M. C. M.
van de Sanden
 *ad
*ad
aDutch Institute for Fundamental Energy Research, Eindhoven, The Netherlands. E-mail: M.C.M.vandeSanden@differ.nl
bInstituto de Plasmas e Fusao Nuclear, Instituto Superior Tecnico, Universidade de Lisboa, Lisboa, Portugal
cLeyden Jar Company, Eindhoven, The Netherlands
dDepartment of Applied Physics, Eindhoven Institute of Renewable Energy Systems, Eindhoven University of Technology, Eindhoven, The Netherlands
First published on 21st October 2024
Abstract
A two-temperature model with a vibrational temperature different from the gas temperature is presented for the decomposition of CO2. All vibrational modes of CO2, CO and O2 are included, and a novel procedure to calculate the vibrational–dissociation reaction rate constant is proposed. In all cases, a Boltzmann distribution is assumed for the vibrational states and the effect of the activation barrier on the chemical reactions is taken into account using the Fridman–Macheret expression. The non-thermal reaction rate constants are therefore functions of gas and vibrational temperatures. The results show that relatively higher vibrational temperatures benefit CO2 conversion. This work provides more insights into the dissociation and recombination reactions of CO2 conversion under non-thermal conditions and offers the opportunity for multi-dimensional non-thermal modelling in the future.
1 Introduction
The accumulation of anthropogenic greenhouse gases has resulted in significant impacts on human life, making carbon capture, utilisation and storage (CCUS) an increasingly popular topic worldwide.1 CO2 is an inherently stable molecule and a significant amount of energy is required for its dissociation (5.453 eV). By producing value-added compounds from CO2 feedstock, CCUS presents a pragmatic and financially viable avenue towards realising the commercial deployment of technologies aimed at abating carbon dioxide emissions.2,3 Development and optimisation of CO2 processing technologies are attracting more and more attention.4,5Thermal and non-thermal dissociation are both popular approaches for CO2 conversion. CO2 dissociation using microwave (MW) plasma is considered to be a promising technology, as recent experimental results show that the maximum energy efficiency (∼48%) in our group is very close to the theoretical thermal efficiency limit (∼50%) (Fig. 1).6–9 Compared to thermal dissociation, more efficient energy utilisation in the non-thermal state appears promising for CO2 dissociation,10,11 which might explain the high efficiencies reached. In the non-thermal plasma, vibrational energy decreases or even eliminates the need to heat all degrees of freedom, potentially improving the energy efficiency.12 However, since a great number of vibrational levels are involved in the vibrational kinetics, it is challenging to simulate the non-thermal dissociation process, especially for polyatomic molecules that have multiple vibrational modes.13
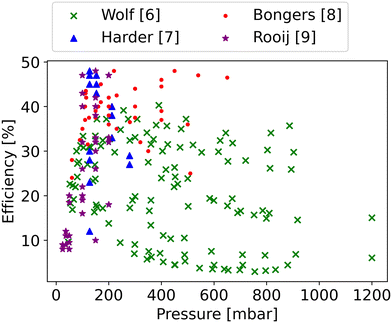 | ||
| Fig. 1 Experimental data for CO2 splitting from DIFFER, showing the energy efficiency as a function of the pressure.6–9 | ||
Recently, a state-to-state (STS) model has been widely used to investigate vibrational kinetics in CO2 plasma.14 In the STS model, vibrational states of the molecules are treated as independent species and their interactions are considered as separate reactions, providing the possibility to resolve the non-Boltzmann distribution of internal energy. However, numerous rate coefficients for all the excitation and dissociation processes of every vibrational level are required, which makes the STS model computationally expensive and resource-demanding. Due to this limitation of the STS approach, the number of vibrational levels of CO2 molecules used in the model has to be reduced.15 Based on the assumption that vibrational relaxation of symmetric and asymmetric modes has a significantly different relaxation time, the PLASMANT group developed a set of STS models, including 25 vibrational levels of CO2 (4 lumped symmetric mode levels + 21 asymmetric mode levels, up to the dissociation limit) with a focus on the asymmetric mode. This allows the model to reveal CO2 vibrational kinetics under different conditions such as reduced electric field, temperature, pressure, etc., which are applied to dielectric barrier discharges (DBD) and MW plasma investigation.10,16–18 However, the temperature measurement experiments by Biondo et al.19 and Klarenaar et al.20 indicate that the vibrational temperature of the bending and symmetric modes is not always equal to the gas temperature, though it is closer to gas temperature compared to the vibrational temperature of the asymmetric mode. It implies that the vibrational energy in the bending and symmetric modes still can enhance CO2 dissociation, thereby increasing the energy efficiency. The group from IST Lisbon University also proposed several models, covering 72 CO2 vibrational levels with vibrational energies up to about 2 eV, and paid great attention to the symmetric and bending modes, which have good agreement with the experiments of direct current (DC) glow discharge.13,21–23 Despite many efforts to reduce the computational cost,24–28 it is currently not possible to couple the STS approach with computational fluid dynamics (CFD) to represent a more realistic fluid-dynamic situation with a multidimensional model.
A multi-temperature model, another approach to depict the non-thermal effect, can decrease the computational cost and raise the numerical efficiency. Park29 proposed a two-temperature model to account for the effects of vibrational excitation in the dissociation rates of N2 and O2, governed by the geometric mean of the translational–rotational temperature (Tg) and the vibrational temperature (Tv).30,31 However, the model is not consistent with microscopic reversibility and also has other limitations.31 A more complicated multi-temperature model is the Treanor–Marrone model, adjusted by a semi-empirical parameter U, which is suitable for computing dissociation rate coefficients for molecule–molecule and molecule–atom collisions.32 Due to the dependence on U, the Treanor–Marrone model with the same value of U fails to calculate all the dissociation rates at different vibrational levels in the wide temperature range.33 Compared with Park and Treanor–Marrone models, the Fridman–Macheret model34–36 has no limitation to the vibrational and gas temperatures, and provides the most accurate results.37
This work proposes a method which aims to quantify the impact of non-thermal effects and to provide a benchmark for the simple case of a two-temperature system governed by a gas temperature different from the vibrational temperature. The Boltzmann distribution is postulated to govern the vibrational states with a vibrational temperature, which is different from gas temperature. The non-thermal model presented in this study employs a weighted algebraic expression to calculate the reaction rate constants. Using the proposed model, the energy efficiencies are calculated at different combinations of vibrational and gas temperatures, which can serve as a benchmark for future experiments under non-thermal conditions, and give insight into underlying mechanisms. This approach significantly reduces computational costs and facilitates the establishment of multi-dimensional non-thermal CO2 models for comprehensive analysis in the future.
2 Model description
Numerical modelling becomes increasingly important as it is difficult to measure all the parameters in experiments in sufficient detail.12 However, establishing a specific reactor model with complex CO2 molecule properties is an arduous task.38 To date, many zero-dimensional (0D) models have been used to describe the reaction mechanism in CO2 dissociation under various conditions.24,38 Although these models have limitations, the results still show good agreement with experimental data.7,39 Therefore, a 0D continuous stirred tank reactor (CSTR) model is simulated, where the gas composition (CO2, CO, C, O, O2, and C2), and other characteristics (gas temperature, pressure, etc.) are assumed to be spatially homogeneous through perfect mixing. For this reactor model, the pressure is held constant (100 mbar).The model is based on Cantera, which is an open-source Python package that solves chemical kinetics, thermodynamics, and transport processes.40 Thermodynamic data, encompassing enthalpy, entropy, heat capacity, and other relevant parameters for all species, are obtained from the NASA database.41 Because translational–rotational equilibrium is much faster than vibrational excitation, translational and rotational modes are lumped together, governed by Tg. All the vibrational modes are assumed to have Boltzmann distribution with the single vibrational temperature Tv. In this paper, we consider vibrational–vibrational relaxation to be infinitely faster than vibrational–translational relaxation, to separate Tg and Tv from each other.
2.1 Vibrational levels and their energies
When chemical conversion is driven by gas heating, the supplied energy is distributed across all molecular degrees of freedom. However, the effectiveness in promoting reactivity is generally not expected to be the same for all internal modes, as proposed in the field of mode-selective chemistry.42,43 Since vibrational motion involves changes in the relative positions of atoms, it plays a crucial role in promoting the cleavage of specific bonds. Selective excitation of vibrational modes can guide the chemical reaction toward the desired product and lower the energy barrier for the reaction. Consequently, vibrational activation of chemical reactions can reduce gas temperature requirements, thereby enhancing energy efficiency.The non-thermal vibrational distribution depends on the model of the energy spectrum. Vibrational energies of CO2 molecule are calculated by anharmonic oscillator approximation in our model.19 The vibrational energy is limited by the dissociation energy of the molecule. For CO2, we use the limit of 5.453 eV which is the dissociation reaction enthalpy at the temperature of 0 K. As a linear triatomic molecule, CO2 has three vibrational modes, including symmetric, doubly degenerated bending, and asymmetric modes, that need to be considered in the simulation. The energies of the CO2 levels are calculated using the following anharmonic oscillator approximation:38
 | (1) |
For the diatomic molecules, i.e. CO and O2, the vibrational energies for each level are directly taken from Laporta et al.44 and Esposito et al.,45 respectively. Due to the very limited amount of C2, we do not consider its vibrational excitation to save computing time. Our comprehensive set of vibrational levels for CO2, O2, and CO molecules includes 10![[thin space (1/6-em)]](https://www.rsc.org/images/entities/char_2009.gif) 810, 47, and 81 levels, respectively. More details about the vibrational levels of different molecules can be found in the ESI† material.
810, 47, and 81 levels, respectively. More details about the vibrational levels of different molecules can be found in the ESI† material.
2.2 Reaction scheme
The evolution of the species densities is defined by the following equation: | (2) |
For strongly endothermic reactions, such as reaction N1 in Table 1, the backward reactions are barrierless and cannot be vibrationally enhanced. However, it should be emphasised that for the reaction where the activation energies of the forward and reverse reactions are comparable, such as the reaction N4, vibrational excitation is considered for both forward and reverse reactions. Fig. 2 illustrates the effect of vibrational energy on the activation barrier.
| No. | Reaction | A (m3 s−1) | b | E a (eV) | α | Cite | Note |
|---|---|---|---|---|---|---|---|
| a Multiply A by 2.0, and 1.0 for M = atoms and molecules, respectively. b Multiply A by 1.5, and 1.0 for M = atoms and molecules, respectively. c Multiply A by 5, and 1.0 for M = atoms and molecules, respectively. | |||||||
| Nf1 | CO2 + M ↔ O + CO + M | 1.15 × 10⁻⁸ | −1.5 | 5.453 | 1.00 | 46 | |
| Nf2 | CO + M ↔ C + O + M | 1.99 × 10⁻⁹ | −1.0 | 11.128 | 1.00 | 46 | |
| Nf3 | O2 + M ↔ 2O + M | 6.20 × 10⁻¹² | −0.56 | 5.210 | 0.99 | 45 | |
| Nf4 | O + CO2 ↔ O2 + CO | 4.50 × 10⁻¹⁶ | 0 | 2.913 | 0.54 | 47 | |
| Nf5 | C + CO ↔ C2 + O | 3.98 × 10⁻¹³ | −1.00 | 4.998 | 1.00 | 48 | |
| Nf6 | O + CO ↔ C + O2 | 6.48 × 10⁻¹⁷ | −0.18 | 5.963 | 1.00 | 48 | |
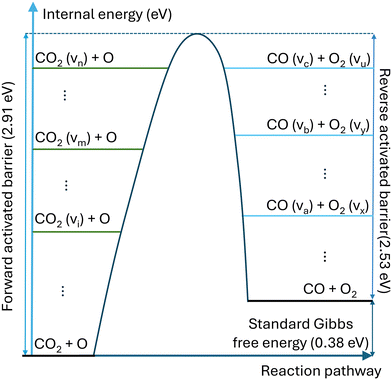 | ||
| Fig. 2 Schematic illustration of the impact of vibrational energy on the activation barrier of reversible reaction CO2 + O. | ||
Compared with the thermal state, the vibrational energy in CO2 molecules can facilitate the dissociation of CO2 chemical bond by reducing the energy barrier, dramatically lowering the need for thermal energy. The non-thermal reaction rate constant is calculated by:
 | (3) |
 is the effective vibrational energy of molecules, which is always ≤ Ea/α. For the effective vibrational energy higher than the activation barrier, the reactions are barrierless. R0 is the pre-exponential factor and is considered to be vibrational level independent.
The overall reaction rate constant, Knontotal [in m3 s−1], can be calculated by multiplying the rate constant of each vibrational level with its corresponding population fraction:
 | (4) |
 | (5) |
 | (6) |
 | (7) |
 | (8) |
The main difference between the present method and the theoretical-informational approach lies in the calculation of the pre-exponential factor R0 [in m3 s−1]. In the theoretical-informational approach, the value of R0 is equivalent to the pre-exponential factor A (Table 1).51,52 However, this value calculated by the theoretical-informational approach differs from that calculated using the thermal Arrhenius expression when Tv = Tg. In this method, R0 can be calculated by matching the non-thermal rate and the thermal reaction rate (i.e. Tv = Tg):
 | (9) |
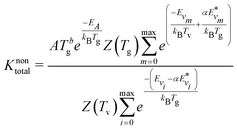
Using the expressions for R0, the overall reaction rate constant is computed as follows:
 | (10) |
It should be noted that eqn (10) assumes that only one reactant has vibrational energy. For the reaction Nb4, both CO and O2 have vibrational energy. Therefore, the population of vibrational level is described by the following expression:
 | (11) |
 and
and  are the vibrational energy of O2 and CO molecule, respectively.
The pre-factor R0 and overall reaction rate constant becomes:
 | (12) |
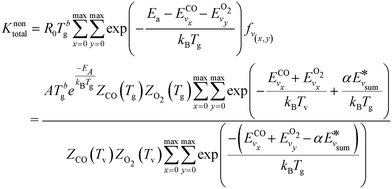 | (13) |
 (and for vibrational energies higher than Ea/α,
  ).
).
2.3 Post-processing of the results
For each simulation step, we can obtain the composition of the gas mixture. Here, we define some characteristics which are important for the following section.The conversion (γ) and energy efficiency (η) [both in %] are the primary global performance metrics for evaluating the dissociation process. The conversion is given as:
 | (14) |
 | (15) |
 | (16) |
Except for the vibrational energy, the enthalpy change of thermal energy for heating the gas from room temperature (Troom) to a higher temperature (Tg) (mole fractions are unchanged) can be expressed by:53
| ΔHtherm = H(Tg, CO2) − H(Troom, CO2) | (17) |
| ΔHdisso = H(Tg, X) − H(Tg, CO2) | (18) |
3 Results and discussion
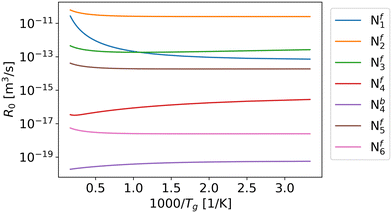
According to the Fridman–Macheret model, reactions with a relatively low activation barrier are enhanced less by vibrational excitation. Therefore, we assumed that the contribution of vibrational energy towards backward reactions Nb1, Nb2, Nb3, Nb5, and Nb6 can be neglected. For the other reactions, the reaction rate constants are influenced by the higher vibrational temperature.As previously mentioned, in eqn (9), R0 is primarily influenced by the gas temperature and independent of the vibrational temperature. When α is equal or close to 1 (i.e. Nf1, Nf2, Nf3, Nf5 and Nf6), R0 increases with gas temperature (Fig. 3), which follows the same trend as the partition function (Fig. 4). For reactions Nf4 and Nb4, the low activation barrier limits the effect of vibrational excitation on the pre-factor, leading to an opposite trend with respect to gas temperature. Overall, except for the pre-factor of reaction Nf1, it can be found that the pre-factors are not sensitive to the gas temperature (Fig. 3).
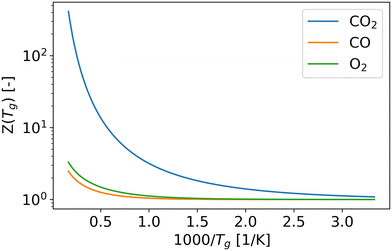 | ||
| Fig. 4 The vibrational partition functions of CO2, CO and O2 molecules as a function of gas temperature, which are calculated by the eqn (6) and (8). | ||
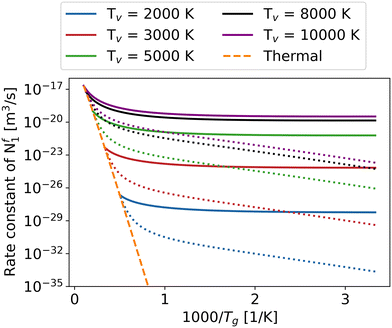
Fig. 5 explores the influence of gas temperature as well as the impact of varying the vibrational temperature on the overall rate constant of reaction Nf1. The other overall reaction rate constants have similar trends as functions of vibrational and gas temperature (see ESI† material). With the help of the higher vibrational temperature, all the overall reaction rate constants increase dramatically, especially at low gas temperatures, offering the potential to achieve higher energy efficiency in the non-thermal state. In many STS models, because of the massive computing cost, most of the attention is paid to the CO2 asymmetric mode.16,24,27 In order to elucidate the importance of the other two vibrational modes, i.e. symmetric and bending modes, on the overall rate constants, a comparison is made between the case when only the asymmetric mode is vibrationally excited (dotted) and when all modes are vibrationally excited (solid) (Fig. 5).
To simplify, the symmetric and bending modes are assumed to share a common vibrational temperature denoted as T12, while the asymmetric mode is characterised by T3.54 Due to the difference in vibrational temperatures between T12 and T3, the calculation of the CO2 vibrational energy set must exclude the influence of the third term in eqn (1). Furthermore, in order to prevent the rate constant difference caused by using different vibrational energy sets, the rate constant calculation in Fig. 5 also ignores the third term effect of eqn (1) when T12 = T3. In reality, since the symmetric and bending modes have shorter equilibration times, T12 is lower than T3, as demonstrated in the works of Biondo et al.19 and Klarenaar et al.20 As a result, the real dissociation rate constants fall between the solid and dotted lines in Fig. 5. The excitation of all vibrational modes with higher vibrational temperature yields a pronounced enhancement in the overall rate constant of the reaction Nf1, particularly evident at low gas temperatures ranging from 300 to 1000 K.
The slope of the rate constant with respect to the gas temperature is similar between the different fixed vibrational temperatures (i.e. the trend is not sensitive to the vibrational temperature) at low gas temperature until 1000 K (Fig. 5). The behaviour can be explained by the dominance of the energy level closest to the dissociation limit or levels with energies exceeding Ea/α in case it is less than the dissociation limit, as the minimum difference between the effective vibrational energy and activation barrier exerts a substantial influence on the overall reaction rate, particularly at relatively low gas temperatures.37,55 As an example, for the reaction Nf3, the vibrational energy of the highest level is closest to the Ea/α. Although the population is the lowest for the highest vibrational level (Boltzmann distribution), the contribution of this level to the overall reaction rate is still the most significant, especially at low gas temperature (Fig. 6). However, with increasing gas temperature, low vibrational levels play a more and more significant role in the overall rate constant, until the thermal state is reached where the contribution of each level to the overall rate constant is the same (purple line in Fig. 6).
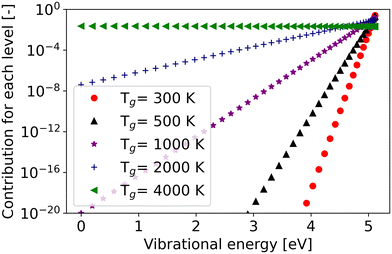 | ||
| Fig. 6 The contribution of each vibrational level to the overall rate constant of reaction Nf3 at a set vibrational temperature of 4000 K. | ||
To validate the accuracy of our method, our obtained reaction rate constants are compared to the theoretical-informational approach, the forced harmonic oscillator (FHO) method and the quasi-classical trajectory (QCT) method for different vibrational levels (Fig. 7).45,56,57
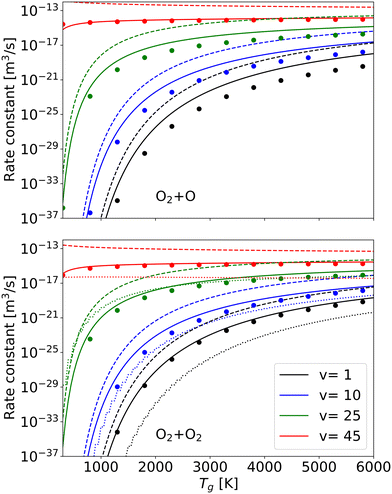 | ||
| Fig. 7 Rate constants at different vibrational levels by present work (solid line), by theoretical-informational approach (dashed line), by FHO method57 (dotted line) and by QCT calculations (solid dots circle) from ref. 45 and 56 as a function of gas temperature. | ||
The QCT method is considered as an excellent way of determining non-equilibrium dissociation rate constants and can be used as a reference.45 However, the QCT method is extremely computationally expensive and requires accurate potential energy surfaces.56 Furthermore, the QCT data related to CO2 dissociation is still lacking.58 Compared with the QCT method, the FHO method requires much less computing time but still supplies relatively accurate results.59 The FHO results are taken directly from the STELLAR database,57 and QCT results are fitted by Andrienko et al.56 Since the vibrational energy sets for O2 across these three methods are nearly identical (i.e., the number of vibrational levels is the same, and the values for each level are very close), the calculation difference of rate constants due to using different vibrational energy sets can be ignored. The results obtained by our method are in much better agreement with QCT results for different temperatures, particularly at elevated vibrational levels, which exert the most significant influence on the overall rate constant (Fig. 6). Our approach offers greater flexibility and computational efficiency compared to the QCT method. In comparison with the FHO method, our results are not only closer to the QCT results, demonstrating higher accuracy, but also our method is 2–3 orders of magnitude faster than the FHO calculation.
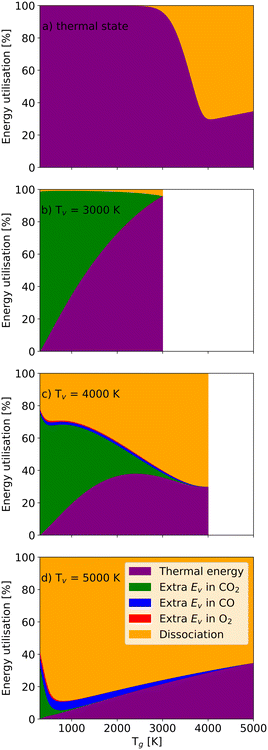
Fig. 8 depicts the energy utilisation fractions for a residence time of 1 ms (i.e. how much of the energy is associated with additional CO2, CO or O2 vibrational energy, dissociation and thermal energy). The thermal energy is only determined by the gas temperature. In the thermal case (Fig. 8(a)), temperatures below 2200 K only heat the gas (i.e. no significant dissociation takes place). At Tg > 2200 K, more and more energy is used for dissociation as Tg increases further until Tg = 4200 K, at which point the dissociation energy fraction hits its maximum (66%). It should be pointed out that this does not directly link to energy efficiency, as the dissociation energy fraction also encompasses the energy required for dissociating CO and O2. For the relatively low vibrational temperature Tv = 3000 K (Fig. 8(b)), the relatively low vibrational energy in CO2 molecules does not increase the dissociation significantly. Most energy is still used to heat CO2 molecules.
As the vibrational temperature rises to 4000 K (Fig. 8(c)), a significant amount of CO2 molecules are dissociated even at the lowest gas temperatures. Due to significant dissociation, vibrational energy is also stored in the dissociation products CO and O2. The extra vibrational energy in CO molecules always exceeds the vibrational energy stored in the O2 molecules, as the production of CO molecules is greater than O2 molecules (stoichiometry). On the other hand, CO has a higher dissociation barrier, requiring more energy to break its chemical bond. Full dissociation of CO2 at Tg = 3500 K is responsible for the disappearance of the extra vibrational energy of CO2 molecules (Fig. 8(c)). At the highest vibrational temperature (Tv = 5000 K) in Fig. 8(d), more CO2 molecules are pumped into higher vibrational states, significantly accelerating the dissociation process. Consequently, almost all CO2 and O2 molecules can be split even at a relatively low gas temperature (Tg = 1200 K), and the dissociation fraction exceeds 85%. Then, the thermal energy fraction increases with the gas temperature, consequently reducing the efficiency. The energy utilisation fractions as a function of the vibrational temperature at different gas temperatures can be found in the ESI† material.
Similar to the thermal model, the residence time also plays a vital role in the non-thermal state (Fig. 9). When the residence time is 10−3 ms, nearly all CO2 molecules remain undissociated no matter how high the gas temperature is. Although CO2 molecules have enough vibrational energy to support dissociation, the reaction rates are limited by kinetics. However, for longer residence times, the high vibrational energy enables the dissociation even at the gas temperature of 300 K. Eventually, 55% energy is used for dissociation, and about 35% vibrational energy is still stored in the CO2 molecules (Fig. 9(a)). With the gas temperature increasing to 1000 K, the energy utilisation fraction of dissociation also rises to 85% in the end (Fig. 9(b)).
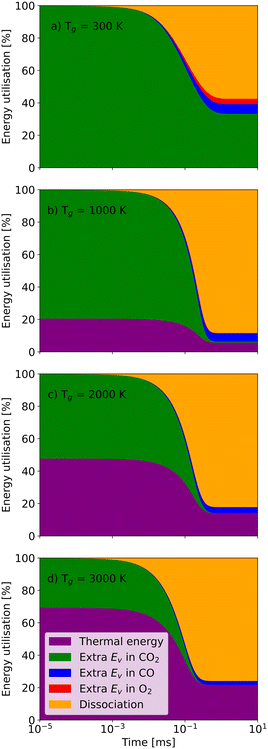 | ||
| Fig. 9 The energy utilisation fractions as a function of residence time at a vibrational temperature of 5000 K and a gas temperature of a) 300 K; b) 1000 K; c) 2000 K; and d) 3000 K. | ||
Then, continually raising the gas temperature to 2000 K or even 3000 K increases the energy utilisation fraction of thermal energy, which reduces the utilisation for dissociation and efficiency accordingly. It should be noted that, at the same vibrational temperature, the chemical equilibration time, when all the energy utilisation fractions and concentrations of species remain stable (i.e. the chemical equilibrium is reached), shortens with increasing gas temperature. Therefore, it is essential to figure out the characteristic time at different vibrational and gas temperatures in the non-thermal state.
One of the factors limiting efficiency is the chemical equilibration time, which is typically longer than the residence time in experiments.7,53 In this work, the chemical equilibration time is defined as the time when relative differences of all densities from their values at the infinite time become less than 10−4 (Fig. 10).
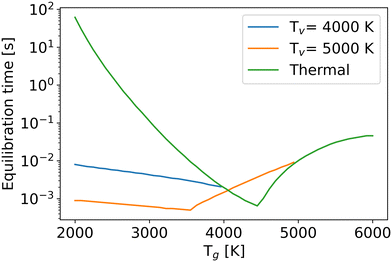 | ||
| Fig. 10 The chemical equilibration time as a function of the gas temperature at different vibrational temperatures. | ||
For the thermal state (green line), due to enhanced reaction rates at higher gas temperatures, the equilibration time decreases in the temperature range from 2000 K to 4500 K. However, beyond 4500 K, the high temperature offers enough energy to decompose CO after CO2 dissociation, requiring more time to reach the chemical equilibrium. Therefore, even though the reaction rates increase with gas temperature, the chemical equilibration time still extends because of the process of CO dissociation. In the non-thermal state, the time constant follows a similar trend to that in the thermal state. If the total energy (the sum of thermal and vibrational energy) is insufficient for CO dissociation after CO2 dissociation, the higher vibrational or gas temperatures increase the reaction rates, leading to a shorter equilibration time. Otherwise, although CO2 and O2 dissociate faster at high gas or vibrational temperatures, the extra CO dissociation process, due to the high internal energy, still prolongs the equilibration time. The extra vibrational energy also lowers the gas temperature of the inflexion point (i.e. the point where the trend of the equilibration time with gas temperature changes).
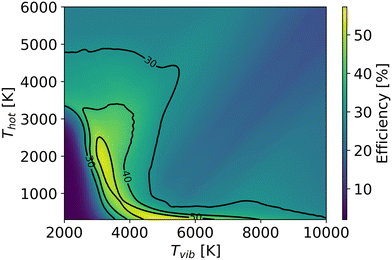
In order to better understand the benefit of higher vibrational temperature on the efficiency, Fig. 11 presents the variations in efficiency for different residence times. At a residence time of 0.1 ms (Fig. 11(a)), the thermal model attains a maximum efficiency of 36% at Tg = 4700 K. In contrast, the non-thermal efficiency reaches 61% at 6431 K of vibrational temperature and 300 K of gas temperature at the same residence time (0.1 ms). It is the most energy-efficient dissociation process, i.e. pure vibrationally-induced dissociation. As the residence time extends to 1 ms (Fig. 11(b)), the region of efficiency above 40% expands, and the maximum efficiency reaches 63% at Tv = 5280 K and Tg = 382 K. The region of efficiency above 30% reduces, at high vibrational and gas temperatures. This reduction occurs because a portion of the energy continues to be utilised for O2 and CO dissociation with a longer residence time, leading to a narrower Tg and Tv window of relatively high efficiency. With a residence time of 10 ms, the non-thermal state offers a large range of temperature conditions to achieve efficiencies over 48% (i.e. close to the maximum we observed in our previous experimental work (cf.Fig. 1)6–9).
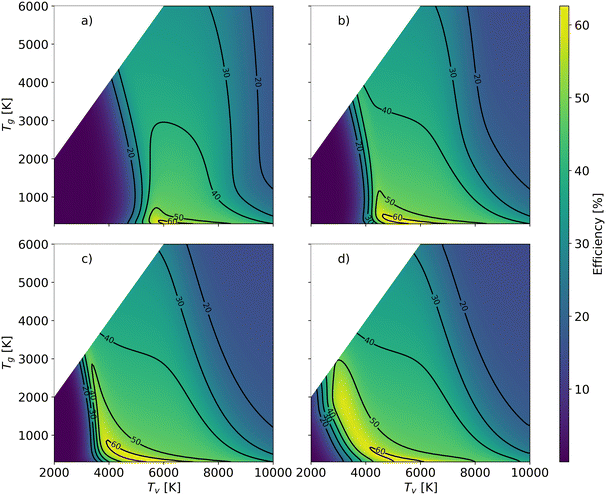 | ||
| Fig. 11 Energy efficiency as a function of the gas and vibrational temperature with different residence times: a): 0.1 ms; b): 1 ms; c) 10 ms; d) infinite time. | ||
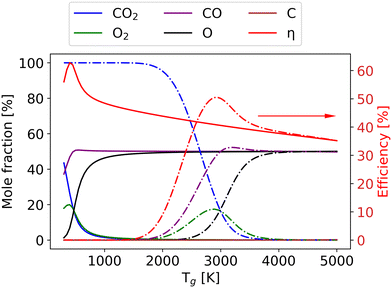
As the gas reaches chemical equilibrium (Fig. 11(d)), the maximum non-thermal efficiency is 64% at Tv = 5280 K and Tg = 382 K. Under thermal conditions, the maximum energy efficiency is ∼50% at Tg = 2950 K. This is significantly less than the non-thermal case, due to energy wasted for gas heating. It should be noted that higher vibrational temperature does not always result in high efficiency. For instance, Fig. 12 presents the mole fractions of species and energy efficiency for a range of gas temperatures in the thermal and non-thermal states at the chemical equilibrium (Tv = 5000 K). At the lowest gas temperature (Tg = 300 K), nearly 45% of CO2 is decomposed in the non-thermal state. As gas temperature increases to 400 K, the efficiency and mole fraction of O2 reach the maximum at the same time in the non-thermal state.
Although CO2 is not fully dissociated (the conversion is around 65%), more energy is wasted on the O2 dissociation and the gas heating at higher gas temperatures. With the gas temperature increasing to 2000 K, all the CO2 and O2 are dissociated, and the components remain steady. When the gas temperature rises to 2500 K, compared with the thermal model, a larger part of the energy is used for O2 dissociation, which results in low efficiency in the non-thermal model. At Tg = 2950 K, the efficiency reaches its maximum in the thermal state, and the difference in efficiency between the thermal and non-thermal states is also at its highest. The discrepancy persists until the gas temperature reaches 5000 K, at which the non-thermal state transforms into the thermal state. The results under thermal chemical equilibrium are in good agreement with the data calculated by the NASA Computer model CEA based on the same conditions.7
Besides the dissociation process in the hot zone, the quenching process also significantly influences conversion and efficiency. Rapid quenching can prevent recombination reactions, safeguarding the targeted product (CO).60,61 Under the conditions of optimal efficiency in the hot region, regardless of how fast the cooling rate is, a part of CO is always destroyed, decreasing the efficiency after quenching. However, a faster quenching rate can reduce the CO loss in the quenching process. In this study, we simulate the quenching region after the hot region, with the gas temperature linearly decreasing (i.e. the cooling rate is constant) over time until both room temperature and chemical equilibrium are reached. The optimal efficiency is calculated by scanning the residence time in the hot zone (ranging from 10−7 s to 100 s) and the cooling rate (ranging from 103 K s−1 to 109 K s−1) in the quenching process at a specific temperature (Thot) and pressure in the CSTR. Fig. 13 illustrates the optimal efficiency at different gas temperatures and pressures. The optimal efficiency (45%) at different pressures and temperatures is lower than our highest experimental efficiency. Therefore, the thermal model fails to explain the experimental results (cf.Fig. 1).
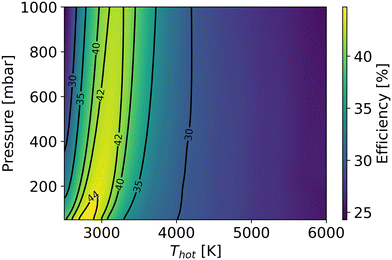 | ||
| Fig. 13 The optimal efficiency under the thermal condition with scanning residence time and cooling rate as a function of gas temperature in the hot region and pressure. | ||
In the non-thermal quenching model, we assume the same linear cooling rate for gas and vibrational temperatures. Fig. 14 depicts the highest efficiency as a function of vibrational and gas temperatures at 100 mbar. Despite the fact that the quenching process also decreases efficiency in the non-thermal state, the higher efficiency achieved in the hot zone still allows efficiencies to exceed the experimentally observed 48% after the cooling process. The optimal efficiency after the quenching process is 56% at Tg = 300 K, Tv = 5698 K and a cooling rate of 108 K s−1. However, it should be stressed that the quenching process in the non-thermal state overlooks the enhancement of vibrational energy due to recombination, which could also increase CO production after quenching. Consequently, the efficiency is underestimated at high vibrational and gas temperatures, where more O atoms and CO are dissociated in the hot region and more recombination energy is released in the quenching process. More details about intra- and inter-mode energy transitions in the quenching process of CO2 plasma will be included in future work.
4 Conclusions
The CO2 dissociation in the non-thermal state is described using a 0D CSTR model with a vibrational temperature exceeding the gas temperature. The model includes 10![[thin space (1/6-em)]](https://www.rsc.org/images/entities/char_2009.gif) 810 vibrational levels of CO2, 81 vibrational levels of CO and 47 vibrational levels of O2. A new approach to calculate the vibrational–dissociation rate constants is presented. Compared with the rate constant calculated by the theoretical-informational method and the FHO method, it shows better agreement with the results of the accurate QCT method, especially at high vibrational levels. Furthermore, the present method is 2–3 orders of magnitude faster than the FHO calculation. Based on the new approach, the rate constants are calculated as a function of the gas and vibrational temperatures. Furthermore, the model reveals the energy utilisation fractions of dissociation, thermal energy, and extra vibrational energy stored in different molecules, for different temperatures and residence times. This work illustrates the impact of gas temperature, vibrational temperatures, and residence time on efficiency. The results show a maximum efficiency of 63% with 1 ms of residence time and 64% with infinite residence time (i.e. gas reaches chemical equilibrium) at Tv = 5280 K and Tg = 382 K. The chemical equilibration time changes as a function of Tv and Tg in the thermal and non-thermal states. Due to the dissociation of CO molecules, the chemical equilibration time does not monotonically decrease with increasing Tg.
810 vibrational levels of CO2, 81 vibrational levels of CO and 47 vibrational levels of O2. A new approach to calculate the vibrational–dissociation rate constants is presented. Compared with the rate constant calculated by the theoretical-informational method and the FHO method, it shows better agreement with the results of the accurate QCT method, especially at high vibrational levels. Furthermore, the present method is 2–3 orders of magnitude faster than the FHO calculation. Based on the new approach, the rate constants are calculated as a function of the gas and vibrational temperatures. Furthermore, the model reveals the energy utilisation fractions of dissociation, thermal energy, and extra vibrational energy stored in different molecules, for different temperatures and residence times. This work illustrates the impact of gas temperature, vibrational temperatures, and residence time on efficiency. The results show a maximum efficiency of 63% with 1 ms of residence time and 64% with infinite residence time (i.e. gas reaches chemical equilibrium) at Tv = 5280 K and Tg = 382 K. The chemical equilibration time changes as a function of Tv and Tg in the thermal and non-thermal states. Due to the dissociation of CO molecules, the chemical equilibration time does not monotonically decrease with increasing Tg.
Finally, accounting for the impact of the quenching process, the optimal efficiency of the thermal dissociation predicted by our model under various parameters, including pressure, cooling rates, and temperature, is limited to 45%, which is clearly in disagreement with the maximum experimental efficiency of ∼48% (cf.Fig. 1). The highest non-thermal efficiency after the quenching process is 56%, demonstrating the potential to achieve maximum experimental efficiency.
The model described in this paper can serve as a benchmark for the CO2 dissociation process in the non-thermal two-temperature state, offering insights for the development of more sustainable and environmentally friendly chemical conversion processes. Compared to traditional STS models, the proposed model delivers enhanced computational efficiency. However, it is important to note that the model overlooks the intricate internal structure of polyatomic molecules, neglecting their interplay. Future research should delve into the impact of various microscopic collision processes, including VV and VT vibrational energy transitions, surface and gas phase recombination, as well as dissociation and deactivation processes at the reactor surface.
Data availability
The model is based on Cantera, which is an open-source Python package that solves chemical kinetics, thermodynamics, and transport processes. The source code will be made publicly available upon the publication of the paper.Conflicts of interest
The authors state that there are no conflicts to declare.Acknowledgements
This work is financially supported by the China Scholarship Council Grant No. CSC202106240037. The work of A. Pikalev is financially supported by the European Space Agency under Project I-2021-03399.Notes and references
- Y.-M. Wei, J.-N. Kang, L.-C. Liu, Q. Li, P.-T. Wang, J.-J. Hou, Q.-M. Liang, H. Liao, S.-F. Huang and B. Yu, Nat. Clim. Change, 2021, 11, 112–118 CrossRef.
- M. Bui, C. S. Adjiman, A. Bardow, E. J. Anthony, A. Boston, S. Brown, P. S. Fennell, S. Fuss, A. Galindo and L. A. Hackett, et al. , Energy Environ. Sci., 2018, 11, 1062–1176 RSC.
- K. M. G. Langie, K. Tak, C. Kim, H. W. Lee, K. Park, D. Kim, W. Jung, C. W. Lee, H.-S. Oh and D. K. Lee, et al. , Nat. Commun., 2022, 13, 7482 CrossRef CAS.
- Y. Qin, G. Niu, X. Wang, D. Luo and Y. Duan, J. CO2 Util., 2018, 28, 283–291 CrossRef CAS.
- M. Ong, S. Nomanbhay, F. Kusumo and P. Show, J. Cleaner Prod., 2022, 336, 130447 CrossRef CAS.
- A. Wolf, T. Righart, F. Peeters, P. Groen, M. van de Sanden and W. Bongers, Plasma Sources Sci. Technol., 2019, 28, 115022 CrossRef CAS.
- N. den Harder, D. C. van den Bekerom, R. S. Al, M. F. Graswinckel, J. M. Palomares, F. J. Peeters, S. Ponduri, T. Minea, W. A. Bongers, M. C. M. van de Sanden and G. J. van Rooij, Plasma Processes Polym., 2017, 14, 1600120 CrossRef.
- W. Bongers, H. Bouwmeester, B. Wolf, F. Peeters, S. Welzel, D. van den Bekerom, N. den Harder, A. Goede, M. Graswinckel and P. W. Groen, et al. , Plasma Processes Polym., 2017, 14, 1600126 CrossRef.
- G. van Rooij, D. van den Bekerom, N. Den Harder, T. Minea, G. Berden, W. Bongers, R. Engeln, M. Graswinckel, E. Zoethout and M. van de Sanden, Faraday Discuss., 2015, 183, 233–248 RSC.
- R. Snoeckx and A. Bogaerts, Chem. Soc. Rev., 2017, 46, 5805–5863 RSC.
- D. van den Bekerom, A. van de Steeg, M. van de Sanden and G. van Rooij, J. Phys. D: Appl. Phys., 2019, 53, 054002 CrossRef.
- L. D. Pietanza, O. Guaitella, V. Aquilanti, I. Armenise, A. Bogaerts, M. Capitelli, G. Colonna, V. Guerra, R. Engeln and E. Kustova, et al. , Eur. Phys. J. D, 2021, 75, 237 CrossRef CAS.
- T. Silva, M. Grofulović, B. Klarenaar, A.-S. Morillo-Candas, O. Guaitella, R. Engeln, C. Pintassilgo and V. Guerra, Plasma Sources Sci. Technol., 2018, 27, 015019 CrossRef.
- V. Kotov and P. M. Koelman, Plasma Sources Sci. Technol., 2019, 28, 095002 CrossRef CAS.
- T. Kozak and A. Bogaerts, Plasma Sources Sci. Technol., 2014, 24, 015024 CrossRef.
- A. Berthelot and A. Bogaerts, J. Phys. Chem. C, 2017, 121, 8236–8251 CrossRef CAS.
- S. Kelly, C. Verheyen, A. Cowley and A. Bogaerts, Chem, 2022, 8, 2797–2816 CAS.
- S. Kelly, E. Mercer, Y. Gorbanev, I. Fedirchyk, C. Verheyen, K. Werner, P. Pullumbi, A. Cowley and A. Bogaerts, J. CO2 Util., 2024, 80, 102668 CrossRef CAS.
- O. Biondo, C. Fromentin, T. Silva, V. Guerra, G. van Rooij and A. Bogaerts, Plasma Sources Sci. Technol., 2022, 31, 074003 CrossRef CAS.
- B. Klarenaar, R. Engeln, D. Van Den Bekerom, M. Van De Sanden, A. Morillo-Candas and O. Guaitella, Plasma Sources Sci. Technol., 2017, 26, 115008 CrossRef.
- C. Fromentin, T. Silva, T. Dias, A. Morillo-Candas, O. Biondo, O. Guaitella and V. Guerra, Plasma Sources Sci. Technol., 2023, 32, 024001 CrossRef CAS.
- C. Fromentin, T. Silva, T. Dias, E. Baratte, O. Guaitella and V. Guerra, Plasma Sources Sci. Technol., 2023, 32, 054004 CrossRef CAS.
- T. Silva, M. Grofulović, L. Terraz, C. Pintassilgo and V. Guerra, J. Phys. D: Appl. Phys., 2018, 51, 464001 CrossRef.
- A. Berthelot and A. Bogaerts, Plasma Sources Sci. Technol., 2016, 25, 045022 CrossRef.
- K. Peerenboom, A. Parente, T. Kozak, A. Bogaerts and G. Degrez, Plasma Sources Sci. Technol., 2015, 24, 025004 CrossRef.
- P. Viegas, M. C. van de Sanden, S. Longo and P. Diomede, J. Phys. Chem. C, 2019, 123, 22823–22831 CrossRef CAS.
- J. F. de la Fuente, S. Moreno, A. Stankiewicz and G. Stefanidis, React. Chem. Eng., 2016, 1, 540–554 RSC.
- P. Diomede, M. C. van de Sanden and S. Longo, J. Phys. Chem. A, 2018, 122, 7918–7923 CrossRef CAS.
- C. Park, 24th thermophysics conference, 1989, p. 1740 Search PubMed.
- X. Wang, Q. Hong, Y. Hu and Q. Sun, Acta Mech. Sin., 2023, 39, 122193 CrossRef CAS.
- G. V. Candler, P. K. Subbareddy and J. M. Brock, J. Spacecr. Rockets, 2015, 52, 17–28 CrossRef CAS.
- G. Shoev, G. Oblapenko, O. Kunova, M. Mekhonoshina and E. Kustova, Acta Astronaut., 2018, 144, 147–159 CrossRef.
- M. Capitelli, F. Esposito, E. Kustova and E. Nagnibeda, Chem. Phys. Lett., 2000, 330, 207–211 CrossRef CAS.
- S. O. Macheret and I. V. Adamovich, J. Chem. Phys., 2000, 113, 7351–7361 CrossRef CAS.
- S. O. Macheret and J. W. Rich, Chem. Phys., 1993, 174, 25–43 CrossRef CAS.
- H. Luo, A. A. Alexeenko and S. O. Macheret, J. Thermophys. Heat Transfer, 2018, 32, 861–868 CrossRef CAS.
- M. L. da Silva, V. Guerra and J. Loureiro, Chem. Phys., 2007, 342, 275–287 CrossRef.
- I. Armenise and E. Kustova, Chem. Phys., 2013, 415, 269–281 CrossRef CAS.
- P. Viegas, L. Vialetto, A. Wolf, F. Peeters, P. Groen, T. Righart, W. Bongers, M. van de Sanden and P. Diomede, Plasma Sources Sci. Technol., 2020, 29, 105014 CrossRef CAS.
- D. G. Goodwin, H. K. Moffat, I. Schoegl, R. L. Speth and B. W. Weber, Cantera: An Object-oriented Software Toolkit for Chemical Kinetics, Thermodynamics, and Transport Processes, https://www.cantera.org, 2023, Version 3.0.0 Search PubMed.
- B. J. McBride, NASA Glenn coefficients for calculating thermodynamic properties of individual species, National Aeronautics and Space Administration, John H. Glenn Research Center, 2002 Search PubMed.
- B. Jiang and H. Guo, J. Chem. Phys., 2013, 138, 234104 CrossRef.
- M. Stei, E. Carrascosa, A. Dorfler, J. Meyer, B. Olasz, G. Czako, A. Li, H. Guo and R. Wester, Sci. Adv., 2018, 4, eaas9544 CrossRef PubMed.
- V. Laporta, J. Tennyson and R. Celiberto, Plasma Sources Sci. Technol., 2016, 25, 01LT04 CrossRef.
- F. Esposito, I. Armenise, G. Capitta and M. Capitelli, Chem. Phys., 2008, 351, 91–98 CrossRef CAS.
- C. Johnston and A. Brandis, J. Quant. Spectrosc. Radiat. Transfer, 2014, 149, 303–317 CrossRef CAS.
- L. Ibragimova, Khim. Fiz., 1991, 10, 307–310 CAS.
- C. Park, J. T. Howe and R. L. Jaffe, J. Thermophys. Heat Transfer, 1994, 8, 9–23 CrossRef CAS.
- V. D. Rusanov, A. Fridman and G. V. Sholin, Sov. Phys. Uspekhi, 1981, 24, 447 CrossRef.
- O. Knab, H.-H. Fruehauf and E. Messerschmid, J. Thermophys. Heat Transfer, 1995, 9, 219–226 CrossRef CAS.
- A. Fridman, Plasma chemistry, Cambridge university press, 2008 Search PubMed.
- R. Levine and R. Bernstein, Dynamics of Molecular Collisions: Part B, Springer, 1976, pp. 323–364 Search PubMed.
- A. J. Wolf, F. J. J. Peeters, P. W. C. Groen, W. A. Bongers and M. C. M. van de Sanden, J. Phys. Chem. C, 2020, 31, 16806–16819 CrossRef.
- E. Kustova and M. Mekhonoshina, Phys. Fluids, 2020, 32, 096101 CrossRef CAS.
- M. Lino da Silva, V. Guerra and J. Loureiro, J. Thermophys. Heat Transfer, 2007, 21, 40–49 CrossRef CAS.
- D. A. Andrienko and I. D. Boyd, Chem. Phys., 2017, 491, 74–81 CrossRef CAS.
- See http://esther.ist.utl.pt/pages/stellar.php for STELLAR database.
- E. Kustova, A. Savelev and I. Armenise, J. Phys. Chem. A, 2019, 123, 10529–10542 CrossRef CAS PubMed.
- I. V. Adamovich, S. O. Macheret, J. W. Rich and C. E. Treanor, AIAA J., 1995, 33, 1064–1069 CrossRef CAS.
- E. R. Mercer, S. van Alphen, C. van Deursen, T. Righart, W. Bongers, R. Snyders, A. Bogaerts, M. van de Sanden and F. Peeters, Fuel, 2023, 334, 126734 CrossRef CAS.
- A. Hecimovic, A. Federico, E. Carbone and U. Fantz, J. CO2 Util., 2022, 57, 101870 CrossRef CAS.
Footnote |
| † Electronic supplementary information (ESI) available. See DOI: https://doi.org/10.1039/d4re00300d |
| This journal is © The Royal Society of Chemistry 2025 |

