Design and performance evaluation of low-volatility and low-viscosity absorbents for CO2 capture†
Ning
Ma
 a,
Liu
Yang
a,
Zhenchang
Fang
b,
Kaijia
Jiang
b,
Xinling
Li
*ac and
Zhen
Huang
*b
a,
Liu
Yang
a,
Zhenchang
Fang
b,
Kaijia
Jiang
b,
Xinling
Li
*ac and
Zhen
Huang
*b
aCollege of Smart Energy, Shanghai Jiao Tong University, China. E-mail: lxl@sjtu.edu.cn
bKey Laboratory of Power Machinery and Engineering, Ministry of Education, Shanghai Jiao Tong University, China. E-mail: z-huang@sjtu.edu.cn
cInstitute of Eco-Chongming (IEC), Shanghai 202162, China
First published on 28th October 2024
Abstract
Deficiencies such as high viscosity, volatility, and rich phase precipitation limited the engineering application of non-aqueous absorbents. A series of high boiling point solvent screening experiments were conducted to develop an absorption saturated solution with a homogeneous phase at low viscosity (14.71 mPa s) in this study. Further addition of polyamines increased the absorption capacity by 42% (3.55 mol CO2 per kg). The 13C NMR results indicated that in the DETA/MEA/NMF blended amine system, MEA was involved in the deprotonation process of DETA zwitterions as proton acceptors. Quantum chemical calculations were utilized to compare the energies of each possible single-step reaction, providing insights into the reaction pathways of the blended amine system. The rate constant of the MEA/CO2 reaction was found to be 1.98 times that of the DETA/CO2 reaction, indicating lower reaction activity, consistent with NMR results. In addition, the results of the analysis of weak interactions revealed that the hydrogen bonds were key factors affecting the viscosity change and precipitation in non-aqueous absorbents, providing a new method for designing novel low-viscosity non-aqueous absorbents. The combination of theoretical analysis and experimental results underscores the potential of the blended amine non-aqueous absorbent as a feasible alternative for the industrial applications of CO2 capture.
1 Introduction
Climate change, driven by the greenhouse effect,1 has become a global concern due to its associated natural disasters and the escalating severity of global warming.2–4 It is imperative to control greenhouse gas emissions, with CO2 being the primary contributor.5,6 The atmospheric concentration of CO2 has already surpassed 36 Gt per year and continues to rise.6 Carbon capture technology serves as an effective means to reduce carbon emissions towards net-zero,7 with installations like CCS in coal-fired power plants capable of capturing up to 90% of carbon emissions.8,9Among existing carbon capture technologies, chemical absorption is the most mature, widely applied in industrial carbon capture due to its high CO2 selectivity and removal rate.10,11 Organic amine absorbents, particularly aqueous solutions of monoethanolamine (MEA), are the most extensively used chemical reagents, owing to their high selectivity and rapid absorption rates.12 However, practical applications of MEA are marred by issues such as high corrosion and degradation rates13 and significant energy consumption for solvent regeneration,14 primarily attributed to the use of water as the solvent.15 Additionally, due to only one amino group per molecule, MEA has a theoretical absorption load of just 0.5 mol CO2 per mol, significantly lower than polyamines and tertiary amine solutions.
Researchers suggest that non-aqueous absorbent systems could effectively mitigate the issues associated with aqueous absorbents.16–19 Organic solvents, including alcohols,17,20–26 glycol ethers,19 pyrrolidones,27–29 formamides,25,30–32 and sulfoxides,14,18,33–35 have been identified as promising alternatives to reduce regeneration energy due to their lower specific heat capacities, vaporization heats, and higher boiling points compared to water. However, the solubility of amines and CO2 reaction products varies in different solvents, and some solvents are prone to forming powdery or gel-like precipitates at high CO2 capacities.31 Additionally, the high viscosity resulting from the mixture of organic solvents and products cannot be overlooked.28,36
Polyamines, which contain multiple amino groups within a single molecule, can significantly increase the CO2 absorption load. Common polyamines include cyclic compounds like piperazine (PZ) and 2-methylpiperazine (2-MPZ),37–39 as well as linear polyamines like 2-(2-aminoethylamino)ethanol (AEEA),34,40,41 diethylenetriamine (DETA)18,42,43 and triethylenetetramine (TETA).20,26,44 However, the CO2 reaction products of PZ tend to form precipitates, while polyamines like DETA and TETA exhibit high viscosity upon absorption saturation, making them unsuitable as primary absorbents for carbon capture. Studies have shown that the absorption effect of blended amines surpasses that of single amine solutions.17,26,37 Therefore, polyamines were incorporated as additives into monoamine absorbent systems to enhance the overall absorption load.
In this study, the organic solvent N-methylformamide (NMF) was used to replace water in MEA solutions, with polyamine DETA added to increase the overall absorption capacity. The absorption characteristics of MEA were compared and screened in a series of high boiling point and low vapor pressure organic solvents, focusing on absorption capacity, viscosity after absorption saturation, and precipitation behavior. Organic solvents capable of maintaining a low viscosity homogeneous phase were selected for subsequent experiments. A part of MEA was then replaced with different polyamines to compare the effects of addition, particularly changes in absorption capacity and viscosity. The combination with the best comprehensive performance was selected, and the ratio of polyamines and MEA was further optimized. By balancing absorption capacity and viscosity, the optimal blended amine ratio was determined. The possible reaction products and pathways of the DETA/MEA/NMF absorbent were elucidated through 13C NMR and quantum chemical calculations. Additionally, weak interactions in different absorption systems were analyzed through molecular dynamics simulations, highlighting the influence of hydrogen bond length distribution on solution viscosity changes. This study provides a new perspective and approach for designing non-aqueous absorbents in carbon capture processes.
2 Experimental
2.1 Materials
N,N-Dimethylformamide (DMF, ≥99.8%, CAS: 68-12-2), N-methylformamide (NMF, ≥99%, CAS: 123-39-7), 1-butanol (butanol, ≥99%, CAS: 71-36-3), 2-methyl-1-propanol (isobutanol, ≥99%, CAS: 78-83-1), cyclohexanol (≥99%, CAS: 108-93-0), ethylene glycol (EG, ≥99%, CAS: 107-21-1), N-methyl-2-pyrrolidone (NMP, ≥99.5%, CAS: 872-50-4), methyl sulfoxide (DMSO, ≥99.9%, CAS: 67-68-5), 2-methoxyethanol (EGME, ≥99%, CAS: 109-86-4), 2-(2-aminoethylamino)ethanol (AEEA, ≥99%, CAS: 111-41-1), and N-methyldiethanolamine (MDEA, ≥99%, CAS: 105-59-9) were supplied by Shanghai Titan Scientific Co., Ltd. Diethylenetriamine (DETA, ≥99%, CAS: 111-40-0), triethylenetetramine (TETA, ≥99.7%, CAS: 112-24-3), piperazine (PZ, ≥99.5%, CAS: 110-85-0), 2-methylpiperazine (2-MPZ, 98%, CAS: 109-07-9) and monoethanolamine (MEA, 99.7%, CAS: 141-43-5) were provided by Shanghai Aladdin Biochemical Technology Co., Ltd. The nitrogen gas (N2, ≥99.99%, volume fraction) and the carbon dioxide gas (CO2, ≥99.99%, volume fraction) were purchased from Liquefied Air (Shanghai) Compressed Gas Co., Ltd. All the reagents were used without further purification.2.2 Bubbling absorption setup
Different MEA, DETA, and organic solvents (totaling 25 mL) were mixed uniformly at a specific molar ratio and placed in a bubbling reactor (50 mL). 10% volumetric concentration of CO2 gas was continuously introduced to the reactor at a flow rate of 1 L min−1. The CO2 concentration of the outlet gas was measured using a CO2 concentration detector. The absorbent was maintained in a constant temperature water bath system at 313.15 K. The methods for calculating the absorption rate (rabs, mol CO2 per min kg) and absorption capacity (Caabs, mol CO2 per kg) were given by eqn (S1) and (S2).† The CO2 load in the liquid phase was determined by acid digestion, where 5 mL of 2 mol L−1 (M) H2SO4 was added to 1 mL of the solution to be tested; after thorough mixing and sufficient reaction, the volume of the gas released was measured by displacement.45 A schematic diagram of the reaction device used is shown in Fig. S1.† The viscosity of the solution (mPa s) was measured using a digital viscometer (LV-SSR) from Shanghai Fangrui Instrument Co. Ltd.2.3 13C NMR characterization
The composition of products in the reaction process was analyzed using a 600 MHz nuclear magnetic resonance spectrometer (NMR, Bruker AVANCE III) at 298 K.2.4 Quantum computational methods
The molecular configurations, harmonic frequencies, and Gibbs free energies of the reactants, products, and transition states were optimized and calculated to analyze the reaction pathways. Calculation details are included in the ESI.†2.5 Molecular dynamics simulation
To simulate real reaction conditions and understand the precipitation mechanism of MEA-CO2 products in non-aqueous solvents, amorphous cells with MEA products in various solvents were constructed in Material Studio 2023.46,47 Calculation details can be found in the ESI.†3 Results and discussion
3.1 Solvent screening
A series of high boiling point solvents with different molecular structures were selected to mix with MEA to identify one or several solvents with high capacity and low viscosity after absorption for further research. The concentration of MEA in the experiment was determined to be 5 M. Due to the influence of temperature on solution viscosity, all viscosity measurements for different samples were conducted at an absorption temperature of 313 K.The overall absorption capacity of MEA in organic solvents was higher than that in MEA aqueous solution (except for EG and cyclohexanol), and the saturated viscosity of MEA in all organic solvents was higher than that in aqueous solution of the same concentration (3.72 mPa s). Among the four alcohol solvents, only ethylene glycol (EG) maintained a homogeneous phase after complete absorption; the other three solvents all generated precipitates, as shown in Fig. 1a. Comparing the absorption rates and times of MEA in different solvents (Fig. 1b), it was observed that the initial absorption rates in most organic solvents were significantly higher than those in aqueous solutions, while absorption rates in EG and cyclohexanol were similar to those in aqueous solutions. This is attributed to the easier dissolution of CO2 in organic solvents, which facilitated the mass transfer process at the gas–liquid interface and within the liquid phase, thereby promoting chemical reactions. In Fig. 1, two special cases (EG and cyclohexanol) exhibited significantly different properties from other organic solvents. This difference is due to their high viscosity, which seriously affected mass transfer in the liquid phase, hindering reaction occurrence and resulting in lower absorption rates and capacities. N,N-Dimethylformamide (DMF), NMF, and dimethyl sulfoxide (DMSO), which maintained high absorption capacity (>2.6 mol CO2 per kg) and low viscosity (<30 mPa s), were used in subsequent absorbent optimization experiments to further enhance the absorption capacity.
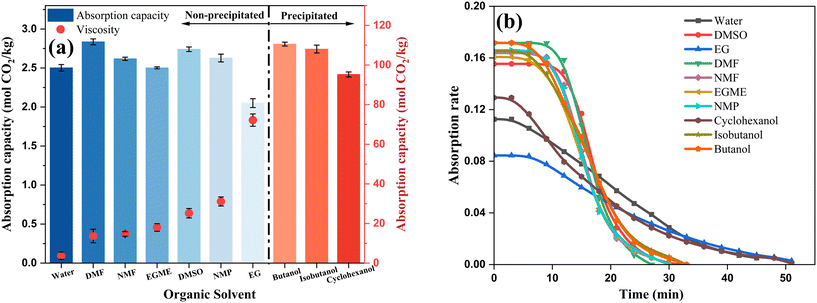 | ||
| Fig. 1 Comparison of 5 M MEA absorption efficiency in different solvents: (a) capacity and viscosity; (b) rate and time (CMEA: 5 M; Vsolution: 25 mL; Tabsorption: 313.15 K; Q10%CO2: 1 L min−1). | ||
3.2 Optimization
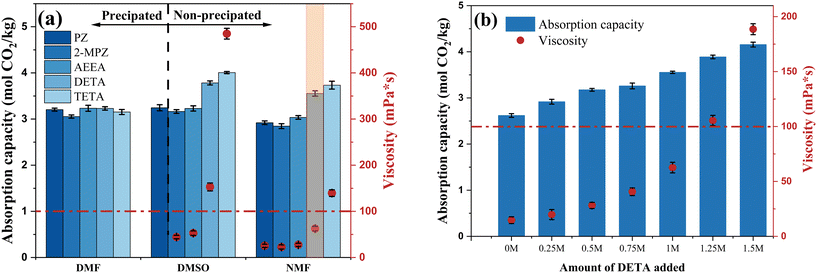
Organic solvents demonstrated higher absorption capacities than water; however, this enhancement was limited while maintaining a constant total amine concentration. Polyamines have much higher absorption loads than monoamines, but high concentrations of polyamines lead to increased viscosities after absorption, which can easily lead to precipitation. To further improve the absorption capacity, five types of polyamines were selected as additives and incorporated into the MEA non-aqueous absorption system. The total amine concentration was maintained at 5 M, comprising 1 M polyamine and 4 M MEA, with DMF, NMF, and DMSO as solvents.The effect of different additives on CO2 absorption in the MEA non-aqueous absorption system is shown in Fig. 2a. In the state of absorbing saturated solution, all polyamine/MEA blends formed precipitates after absorption in DMF, and the MEA/PZ blend also formed precipitates in DMSO. In NMF, different blended amine systems remained homogeneous (liquid phase) after absorption. The loading enhancement effect of polyamines in different solvents also varied depending on the solvent. The influence of polyamine PZ, 2-MPZ, and AEEA on the three solvents was similar, with slightly lower absorption capacity and viscosity in NMF, consistent with previous solvent screening results. DETA and TETA exhibited average promoting effects in DMF but had significantly higher absorption capacity and viscosity than other polyamines in DMSO and NMF, with TETA outperforming DETA due to its greater number of amino groups and longer molecular chains. The poor performance of DETA and TETA in DMF was attributed to gel-like precipitation obstructing the bubble inlet during later absorption stages. Furthermore, excessive viscosity in the solution is detrimental to mass transfer and reaction. From the perspective of absorption capacity, polyamine DETA or TETA showed better enhancing effects on absorption in solvents DMSO and NMF. Considering that the solution fluidity deteriorates when the viscosity exceeds 100 mPa s, the DETA/MEA/NMF blended system was selected for further ratio optimization.
The effects of different DETA addition levels on the absorption capacity and viscosity of the MEA/NMF system were compared. The total amine concentration was maintained at 5 M, with DETA comprising 0–30% (0–1.5 M) of the total amines, under the same experimental conditions as previously described. As the DETA addition increased, the total absorption capacity showed a linear upward trend while keeping homogeneous, correlating positively with the increase in amino groups (Fig. 2b). Concurrently, the viscosity of the saturated absorbent dramatically increased once the DETA addition exceeded 1 M. When DETA addition increased from 1 M to 1.25 M, the DETA content increased by only 5%, yet the viscosity of the saturated absorbent surged by 68% (from 62.59 mPa s to 105.44 mPa s). The sharp increase in viscosity will limit the flowability of the absorbents, which is unfavorable for practical industrial applications. Therefore, the optimal ratio was determined to be 1 M DETA![[thin space (1/6-em)]](https://www.rsc.org/images/entities/char_2009.gif) :
:![[thin space (1/6-em)]](https://www.rsc.org/images/entities/char_2009.gif) 4 M MEA, with NMF as the solvent. The resulting DETA/MEA/NMF blended amine non-aqueous absorption system increased the absorption capacity by 35.72% compared to the 5 M MEA/NMF system, with viscosity rising from 14.71 mPa s to 62.59 mPa s. It also showed a 41.96% increase in absorption capacity compared to 5 M MEA aqueous solution.
4 M MEA, with NMF as the solvent. The resulting DETA/MEA/NMF blended amine non-aqueous absorption system increased the absorption capacity by 35.72% compared to the 5 M MEA/NMF system, with viscosity rising from 14.71 mPa s to 62.59 mPa s. It also showed a 41.96% increase in absorption capacity compared to 5 M MEA aqueous solution.
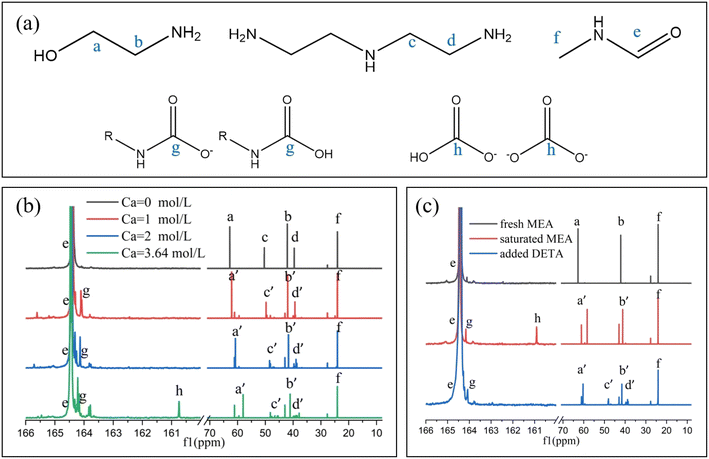
3.3 NMR analysis
13C NMR was utilized to detect the products during the reaction process. The product NMR spectra at different absorption capacities (Ca) were detected based on the amine concentration ratio in the DETA/MEA/NMF absorbent, as shown in Fig. 3b; the signals between 160 and 166 ppm were magnified for ease of observation. The signal peaks labeled a–d, located between 65 and 35 ppm, were assigned to the alkyl carbon signals of MEA and DETA, while the signal peaks labeled e at 164.4 ppm and f at 24.2 ppm corresponded to the carbonyl carbon signal and alkyl carbon signal of NMF, respectively. As the absorption progressed, product signal peaks g and h gradually appeared at 164.5–163.5 ppm and 160.5–161 ppm. When the absorption capacity increased from 0 to 2 M, the signal peaks c and d of DETA dispersed from single peaks into a cluster of peaks. This dispersion is attributed to the multiple amino groups of DETA, which leads to various combinations and different carbon signal shifts when forming protonated amines.26,31 The product signal peaks primarily occurred around 164.5–164 ppm, displaying clustered peaks for the same reason. Additionally, signals a and b also showed some shifts and splitting, indicating that during the early stages of absorption, a small amount of MEA carbamate was formed in the solution. As the absorption capacity approached saturation from 2 M, new product peak g appeared between 164 and 163.5 ppm, along with the emergence of product h, distributed between 161 and 160.5 ppm. At this point, MEA mainly participated in CO2 absorption, forming MEA carbamate, corresponding to the generation of signal g. The further shift and splitting of signals a and b also confirmed this conclusion. Some carbamates hydrolyzed in the NMR solvent D2O to form carbonates and bicarbonates, corresponding to product peak h. The formation of signal peak h was not detected when the absorption load was less than 2 M, indicating that CO2 primarily combined with DETA, and DETA carbamate was not easily hydrolyzed. These results further confirmed that DETA had a higher reaction priority with CO2 than MEA.To further confirm that DETA combined with CO2 more readily than MEA, a comparative experiment was conducted. Under prior experimental conditions, 4 M MEA was reacted with CO2 in NMF until saturation was reached. Subsequently, 1 M DETA was added without introducing CO2 and thoroughly blended. The NMR spectra of the fresh, saturated, and DETA added solutions were then detected, as shown in Fig. 3c. After saturation, new signal peaks g and h appeared in the solution, corresponding to MEA carbamate and partially hydrolyzed carbonates and bicarbonates. Upon adding 1 M DETA, product peak h disappeared, and new clustered signal peaks g appeared in the range of 164.5–164 ppm, indicating that the MEA carbamate was replaced by DETA carbamate. Meanwhile, the MEA signal peak a′ significantly shifted back, approaching the initial signal a, and signal peaks c and d appeared as clustered peaks, with the overall spectrum resembling the spectrum in Fig. 3b at an absorption load of 2 M. These results indicated that DETA can rob CO2 from MEA carbamate and preferentially form DETA carbamate, demonstrating that DETA exhibited higher reactivity than MEA.
3.4 Calculation of the product molecular structure and reaction pathways
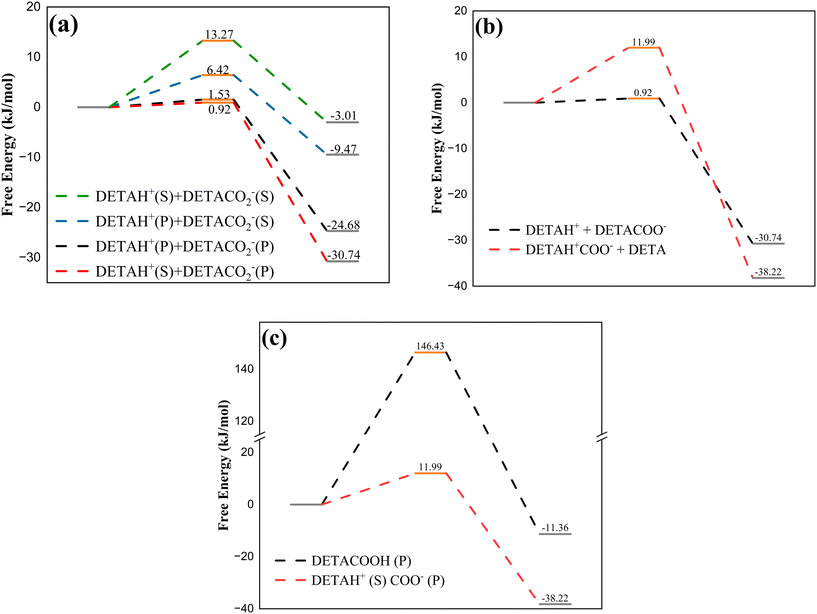
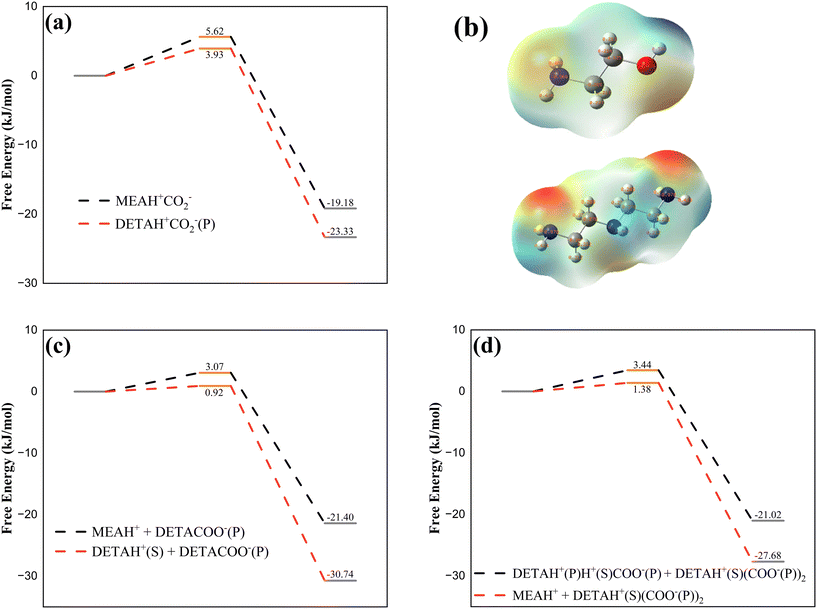
The potential products and reaction barriers during the reaction process of DETA/MEA/NMF were calculated to analyze the reaction pathways. The potential products and reaction paths of DETA with CO2 were calculated initially, and then the reaction mechanisms of different amines were combined to calculate reaction orders and product distributions in the DETA/MEA blended amine system. The total reaction pathway diagram for the DETA/MEA/NMF non-aqueous absorption system was constructed.There are two primary amines (P) and one secondary amine (S) contained in DETA. According to the zwitterion mechanism, each amino group can combine with either CO2− or H+, resulting in four possible combinations, as shown in Fig. 4a. The transition state energy and reaction energy changes for each combination were calculated, revealing that the energies of two products formed by the combination of CO2− with the primary amine were significantly lower than those of products formed with the secondary amine. The tendency for H+ to combine showed another characteristic: compared to the same type of amine (either primary or secondary), H+ was more likely to combine with CO2− on different amino groups. When CO2− was combined with the primary amine, the product energy of H+ combining with the secondary amine was lower than that combining with the primary amine. This is influenced by the molecular structure, where the contact method of the primary amine associated with the secondary amine was more conducive to the dissociation of zwitterions. The activation energies of different reactions also showed the same trend, with the combination of DETACO2−(P) + DETAH+(S) having the lowest reaction barrier, making it the most favorable for the reaction to occur. Overall, in DETA, the primary amine was more likely to combine with CO2−, and the secondary amine was more likely to combine with H+. The ESP diagram and NBO charges of DETA in Fig. 5b indicated that the primary amine had a stronger negative charge than the secondary amine, making it more likely to combine with the positively charged carbon atom in CO2−.
According to the previous analysis, the dissociation of zwitterions presented two possible proton transfer pathways: association with the secondary amine of the DETAH+CO2− itself or with the secondary amine of another DETA molecule. The energy changed during the reaction process, as shown in Fig. 4b, indicating that the activation energy for intramolecular proton transfer was 13.1 times higher than that for intermolecular transfer, and the energy of the product from self-transfer was slightly lower than that from the bimolecular reaction. It was suggested that two molecular participations in zwitterion dissociation are significantly more favorable than proton self-transfer. Studies had shown that there was a small amount of carbamic acid contained in non-aqueous absorbents; therefore, the reaction energies for proton transfer to the secondary amine and CO2− were compared (Fig. 4c). The activation energy of carbamic acid formation was found to be 12.2 times higher than that of carbamate formation, and the product energy was also significantly higher. This indicates that carbamate formation is favored in this reaction, suggesting that the proton of the zwitterion preferentially associates with the secondary amine. The reaction formulas for CO2 absorbed into DETA absorbents can be summarized in eqn (1)–(3).
| 2DETA + CO2 → DETACO2−(P) + DETAH+(S) | (1) |
| 2DETA + 2CO2 → 2DETAH+(S)CO2−(P) | (2) |
| 2DETA + 3CO2 → DETAH+(P)H+(S)CO2−(P) + DETAH+(S)(CO2−(P))2 | (3) |
In the blended amine system of DETA and MEA, the dissociation of zwitterions may result in different types of associations between protonated amines. Therefore, based on the analysis of the DETA/CO2 reaction pathways, the influence of MEA on the system must be considered. On the one hand, MEA itself participated in the CO2 absorption reaction, forming MEACO2− and MEAH+; on the other hand, MEA may also participate in the dissociation of the DETAH+CO2− zwitterions.
Previous analysis indicated that CO2 preferentially bound with the primary amine of DETA, so the reaction energies for the zwitterion formation by DETA and MEA were compared (Fig. 5a). The results showed that the activation energy and product energy for the combination of DETA with CO2 were both lower, indicating that DETA reacted with CO2 prior to MEA. During the dissociation of DETAH+CO2−(P), the zwitterion formed a carbamate and protonated amine with DETA. When MEA was added to the solution, the potential for MEA participating in the dissociation reaction must be considered. The energies of the DETAH+CO2− zwitterion reacting with both DETA and MEA were compared (Fig. 5c), revealing that when the DETA zwitterion dissociated, the proton preferentially associated with the secondary amine of DETA, and MEA did not participate in the dissociation reaction. When the reaction load exceeded 1 mol CO2 per mol amine, DETAH+CO2−(P) continued to combine with CO2 molecules, forming DETAH+CO2−(P)H+CO2−(P) zwitterions, where the proton in the zwitterion can associate with either the amine of MEA or the primary amine of DETAH+CO2−(P). The comparison of the energies of both reactions is shown in Fig. 5d, where MEA participated in the dissociation reaction, forming MEAH+. The overall reaction pathway for the DETA/MEA blended amine system is summarized in Fig. 6.
3.5 Molecular dynamics simulation
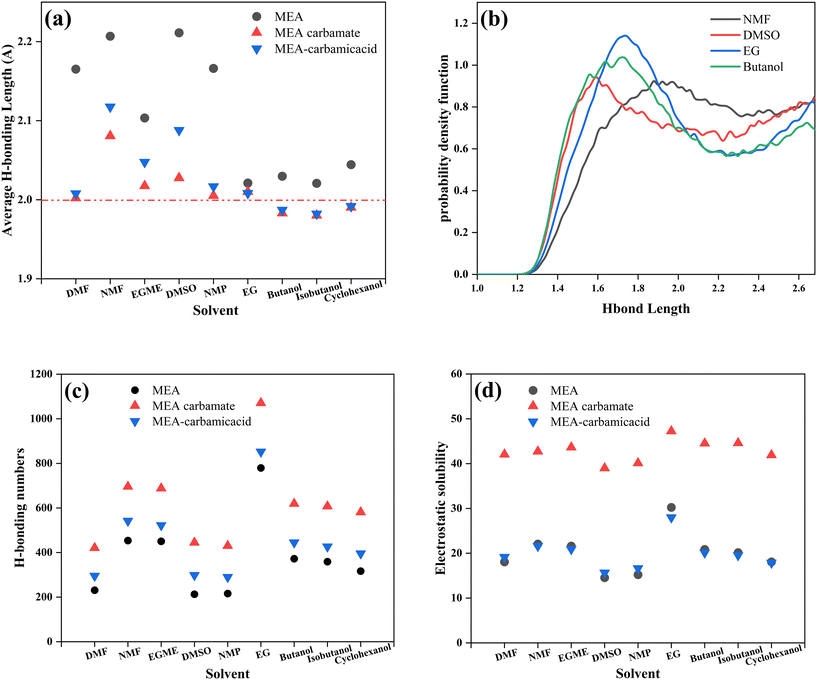
The primary challenges faced by non-aqueous absorbents were high viscosity and precipitation, which had also been confirmed in previous experiments. To further explore the mechanisms behind viscosity changes and precipitation in different solvents during the absorption process, amorphous cells of MEA/non-aqueous solvents were constructed for molecular dynamics simulation to analyze the weak interactions in the absorbents. Based on the reaction mechanism analyzed before, weak interactions, including hydrogen bonds, and electrostatic solubility of MEA, MEA carbamic acid, and MEA carbamate were calculated.Compared with fresh solutions, the average hydrogen bond lengths in different solutions decreased after absorption saturation (Fig. 7a). When ranking solvents by viscosities after absorption from low to high, it was found that, except for DMF, the average hydrogen bond lengths generally decreased as viscosities increased in different solutions. Notably, the three types of solutions with average hydrogen bond lengths less than 2 Å after absorption all formed precipitates, indicating that the average hydrogen bond length was a key factor affecting viscosity changes and precipitate formation. Although DMF had low solution viscosity, precipitation occurred in various additive/MEA/DMF solutions in subsequent experiments, which was directly related to the low average hydrogen bond lengths of the MEA saturated absorption solution.
The specific hydrogen bond distribution intervals in the solution were analyzed, and for clarity, the hydrogen bond distribution probability density functions of several representative solutions were plotted (Fig. 7b), mainly showing the possible distribution probabilities at different hydrogen bond lengths. In solvent NMF, the most likely hydrogen bond length was distributed around 2.0 Å, and the probability distribution of hydrogen bonds at shorter lengths (1–2 Å) was significantly lower than in other solvents, which accounted for its lowest viscosity. In solvent DMSO, the most likely hydrogen bond length was distributed around 1.6 Å, possibly due to the influence of the sulfur element in DMSO, but the probability distribution in the shorter hydrogen bond length interval was also lower, and hence its slightly higher viscosity than NMF. Solvents EG and butanol showed similar probability distributions in the long hydrogen bond interval, but in the shorter hydrogen bond interval, the overall hydrogen bond distribution of butanol tended to shorter lengths, with the most likely hydrogen bond length being less than that in EG. Additionally, in the 1.2–1.6 Å interval, butanol exhibited the highest distribution probability, and the excess of short hydrogen bonds was a significant reason for precipitation in MEA/butanol solution. The hydrogen bond distribution PDF further verified the substantial impact of hydrogen bond length distribution on solution viscosity and precipitation.
Furthermore, the number of hydrogen bonds also affected solution viscosity, with a clear increase in hydrogen bond numbers across different solutions after absorption (Fig. 7c). The number of hydrogen bonds in solvent DMF was lower than that in NMF, while the average hydrogen bond length was also significantly lower than that in NMF solution. From a microscopic perspective, although there were fewer hydrogen bonds in DMF, the interaction of each hydrogen bond was stronger, resulting in a similar viscosity to NMF solution. In different solvents, the number of hydrogen bonds in MEA carbamate was greater than that in MEA carbamic acid, due to the carbamates and protonated amines having more freedom in their distribution direction, increasing the probability of hydrogen bond formation between different molecules compared to carbamic acid.
Additionally, comparing the number of hydrogen bonds and electrostatic solubilities in different solutions (Fig. 7d), similar trends were found with solvent changes, indicating that hydrogen bonds directly affect electrostatic solubilities as the main weak interactions. In different solvents, the electrostatic solubilities of MEA and MEA carbamic acid were close, while the electrostatic solubility of MEA carbamate was about twice those of the former ones. This was because the separated ionic form of carbamate and protonated amine was not electrically neutral, resulting in higher electrostatic solubility.
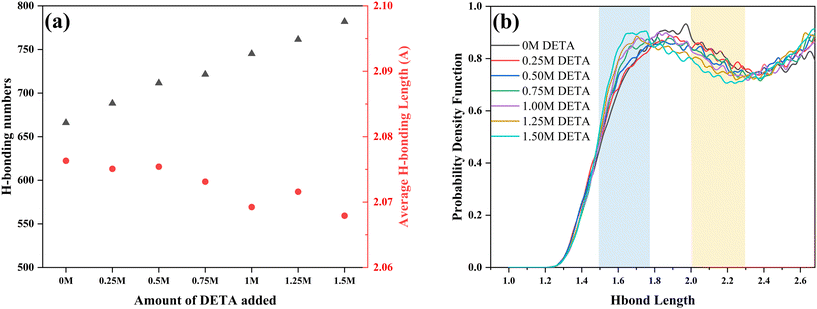
In order to further investigate the effect of DETA addition on the viscosity of absorption saturated solutions, simulations of DETA/MEA/NMF blended solutions with different DETA addition amounts were conducted, calculating the distribution of hydrogen bonds in saturated solutions. As the amount of DETA added increased, the total number of hydrogen bonds in the solution increased linearly (Fig. 8a). This was because more carbamates were formed, and the number of N and O atoms increased in the solution, changing linearly with the amount of DETA added. Concurrently, the average hydrogen bond lengths in the solution decreased with the increase in DETA content, indicating an overall strengthening of intermolecular hydrogen bonds. This was due to the increased number of carbamates in the solution, with the extra O atoms in CO2− able to form stronger hydrogen bonds, thereby reducing the overall hydrogen bond lengths.
To analyze the distribution of hydrogen bonds of different lengths in the solution, the probability density function of hydrogen bonds was calculated (Fig. 8b). It can be seen that with the increase in DETA addition, the distribution of the most probable hydrogen bond length decreased from 1.9 Å to 1.6 Å. Opposite distribution results were presented within different hydrogen bond length intervals. The hydrogen bond distribution probability gradually increased within the shorter hydrogen bond interval of 1.5 Å to 1.75 Å, and decreased within the longer hydrogen bond interval of 2.0 Å to 2.3 Å. The increase in the number of short hydrogen bonds on the one hand and the decrease in the number of long hydrogen bonds on the other hand collectively led to the results that the average hydrogen bond lengths decreased with the increase in DETA addition. The increase in hydrogen bond numbers and the decrease in average hydrogen bond length worked in tandem, manifesting as the increase in the viscosities of the saturated solution with the increase in DETA addition. This was consistent with previous analysis results, indicating that the distribution of hydrogen bonds in the solution was an important factor affecting viscosity changes.
4 Conclusions
A series of organic solvents and polyamine additives were screened to select the most suitable absorbent on the basis of absorption capacity and saturated solution viscosity. Alcohol solvents exhibited a propensity for precipitation, and the addition of polyamines increased the absorption capacity while rapidly increasing the saturated solution viscosity. The main absorption products of CO2 absorption in the blended amine non-aqueous absorption system were mainly carbamates, with MEA participating as a proton acceptor in the deprotonation process of DETA zwitterions. Quantum chemical calculations indicated that the reaction activity of CO2 with MEA was lower than that with DETA, which was consistent with the NMR results. Furthermore, molecular dynamics calculations emphasized that excessively short average hydrogen bond lengths can lead to precipitation in the solution. The construction of amorphous cells for molecular dynamics simulations and hydrogen bond analysis proved to be effective methods for designing new low-viscosity non-aqueous absorbents. Non-aqueous absorbents based on DETA/MEA can achieve efficient CO2 capture in a homogeneous state, avoiding equipment modification of biphasic absorbents and reducing industrial carbon capture costs. The DETA/MEA/NMF system is a promising candidate as a non-aqueous blended amine absorbent for the next generation of carbon capture, with significant potential for industrial applications.Data availability
The authors confirm that the data supporting the findings of this study are available within the article and its ESI.†Author contributions
Ning Ma: data curation, formal analysis, investigation, methodology, and writing – original draft. Liu Yang: investigation and validation. Zhenchang Fang: data curation and formal analysis. Kaijia Jiang: investigation and validation. Xinling Li: supervision, writing – review & editing, and methodology. Zhen Huang: funding acquisition, supervision, validation, and writing – review & editing.Conflicts of interest
The authors declare no competing financial interest.Acknowledgements
This study was financially supported by the Shanghai Municipal Science and Technology Major Project.References
- IPCC, 2023: Climate Change 2023: Synthesis Report. Contribution of Working Groups I, II and III to the Sixth Assessment Report of the Intergovernmental Panel on Climate Change, Core Writing Team, ed. H. Lee and J. Romero, Intergovernmental Panel on Climate Change (IPCC), Geneva, Switzerland, 2023 Search PubMed.
- X. Wang, Y. Wang, X. Sang, W. Zheng, S. Zhang, L. Shuai, B. Yang, Z. Li, J. Chen, L. Lei, N. M. Adli, M. K. H. Leung, M. Qiu, G. Wu and Y. Hou, Angew. Chem., Int. Ed., 2021, 60, 4192–4198 CrossRef CAS.
- M. Breckner and U. Sunde, World Dev., 2019, 123, 104624 CrossRef.
- K. Zickfeld, D. Azevedo, S. Mathesius and H. D. Matthews, Nat. Clim. Change, 2021, 11, 613–617 CrossRef CAS.
- Y. Wang, Z. Pan, W. Zhang, T. N. Borhani, R. Li and Z. Zhang, Environ. Res., 2022, 207, 112219 CrossRef CAS PubMed.
- X. Xue, Y. Wang, H. Chen and G. Xu, Front. Energy, 2022, 16, 307–320 CrossRef.
- Y. Zheng, L. Gao, S. He and H. Jin, Front. Energy, 2023, 17, 390–399 CrossRef.
- S. Li, L. Gao, S. He, D. Yang, C. Wang and Y. Zheng, Fundam. Res., 2024, 4, 916–925 CrossRef PubMed.
- Y. Xu, K. Wang and J. Pei, Clean Technol. Environ. Policy, 2023, 25, 2393–2411 CrossRef.
- Y. Bi and Y. Ju, Front. Energy, 2022, 16, 793–811 CrossRef.
- G. T. Rochelle, Science, 2009, 325, 1652–1654 CrossRef CAS PubMed.
- D. Wang, S. Li, F. Liu, L. Gao and J. Sui, Appl. Energy, 2018, 227, 603–612 CrossRef CAS.
- K. Wu, X. Zhou, X. Wu, B. Lv, G. Jing and Z. Zhou, Int. J. Greenhouse Gas Control, 2019, 83, 216–227 CrossRef CAS.
- L. Yang, J. Chen, N. Ma, Z. Fang, X. Li and Z. Huang, Chem. Eng. J., 2024, 479, 147903 CrossRef CAS.
- W. Gao, S. Liang, R. Wang, Q. Jiang, Y. Zhang, Q. Zheng, B. Xie, C. Y. Toe, X. Zhu, J. Wang, L. Huang, Y. Gao, Z. Wang, C. Jo, Q. Wang, L. Wang, Y. Liu, B. Louis, J. Scott, A.-C. Roger, R. Amal, H. He and S.-E. Park, Chem. Soc. Rev., 2020, 49, 8584–8686 RSC.
- L. Yang, J. Chen, N. Ma, X. Li and Z. Huang, Carbon Capture Sci. Technol., 2023, 9, 100147 CrossRef CAS.
- F. Barzagli, F. Mani and M. Peruzzini, Int. J. Greenhouse Gas Control, 2013, 16, 217–223 CrossRef CAS.
- R. Wang, L. Jiang, Q. Li, G. Gao, S. Zhang and L. Wang, Energy, 2020, 211, 118667 CrossRef CAS.
- S. Shen, X. Shi, C. Li, H. Guo, Q. Long, S. Wang and X. Yin, Sep. Purif. Technol., 2022, 300, 121908 CrossRef CAS.
- J. Li, Y. Li, C. Li, R. Tu, P. Xie, Y. He and Y. Shi, Greenhouse Gases: Sci. Technol., 2022, 12, 362–375 CrossRef CAS.
- Z. Shen, S. Tang, H. Lu, S. Zhong, L. Song, H. Li and B. Liang, Chem. Eng. Sci., 2023, 281, 119083 CrossRef CAS.
- H. Rashidi and S. Sahraie, Energy, 2021, 221, 119799 CrossRef CAS.
- X. Xu, M. B. Myers, F. G. Versteeg, E. Adam, C. White, E. Crooke and C. D. Wood, J. Mater. Chem. A, 2021, 9, 1692–1704 RSC.
- W. Tian, K. Ma, J. Ji, S. Tang, S. Zhong, C. Liu, H. Yue and B. Liang, Ind. Eng. Chem. Res., 2021, 60, 3871–3880 CrossRef CAS.
- F. Bougie, D. Pokras and X. Fan, Int. J. Greenhouse Gas Control, 2019, 86, 34–42 CrossRef CAS.
- F. Liu, G. Jing, X. Zhou, B. Lv and Z. Zhou, ACS Sustainable Chem. Eng., 2018, 6, 1352–1361 CrossRef CAS.
- L. Bihong, Y. Kexuan, Z. Xiaobin, Z. Zuoming and J. Guohua, Appl. Energy, 2020, 264, 114703 CrossRef.
- Z. Tu, F. Han, C. Liu, Y. Wang, J. Wei and X. Zhou, Sep. Purif. Technol., 2023, 307, 122722 CrossRef CAS.
- H. Svensson, J. Edfeldt, V. Z. Velasco, C. Hulteberg and H. T. Karlsson, Int. J. Greenhouse Gas Control, 2014, 27, 247–254 CrossRef CAS.
- G. Lu, Z. Wang, Z. Yue, W. Wei, Y. Huang, X. Zhang and X. Fan, Chem. Eng. J., 2023, 474, 145929 CrossRef CAS.
- X. Gao, X. Li, S. Cheng, B. Lv, G. Jing and Z. Zhou, Chem. Eng. J., 2022, 430, 132932 CrossRef CAS.
- Y. Li, J. Cheng, L. Hu, J. Liu, J. Zhou and K. Cen, Fuel, 2018, 216, 418–426 CrossRef CAS.
- H. K. Karlsson, H. Makhool, M. Karlsson and H. Svensson, Sep. Purif. Technol., 2021, 256, 117789 CrossRef CAS.
- X. Zhou, X. Li, J. Wei, Y. Fan, L. Liao and H. Wang, Environ. Sci. Technol., 2020, 54, 16138–16146 CrossRef CAS PubMed.
- X. Li, X. Zhou, J. Wei, Y. Fan, L. Liao and H. Wang, Sep. Purif. Technol., 2021, 265, 118481 CrossRef CAS.
- K. Gonzalez, L. Boyer, D. Almoucachar, B. Poulain, E. Cloarec, C. Magnon and F. de Meyer, Chem. Eng. J., 2023, 451, 138948 CrossRef CAS.
- C. Nwaoha, C. Saiwan, P. Tontiwachwuthikul, T. Supap, W. Rongwong, R. Idem, M. J. AL-Marri and A. Benamor, J. Nat. Gas Sci. Eng., 2016, 33, 742–750 CrossRef CAS.
- X. Zhang, R. Zhang, H. Liu, H. Gao and Z. Liang, Appl. Energy, 2018, 218, 417–429 CrossRef CAS.
- H. Li, Y. L. Moullec, J. Lu, J. Chen, J. C. V. Marcos and G. Chen, Int. J. Greenhouse Gas Control, 2014, 31, 25–32 CrossRef CAS.
- F. Liu, M. Fang, N. Yi, T. Wang and Q. Wang, Sustainable Energy Fuels, 2019, 3, 3594–3602 RSC.
- Y. Wang, Y. Dong, L. Zhang, G. Chu, H. Zou, B. Sun and X. Zeng, Sep. Purif. Technol., 2021, 269, 118714 CrossRef CAS.
- R. Wang, H. Zhao, X. Yang, C. Qi, H. Zhao, S. Zhang, Q. Li, P. Li and L. Wang, Energy, 2023, 281, 128353 CrossRef CAS.
- X. Zhou, G. Jing, B. Lv, F. Liu and Z. Zhou, Appl. Energy, 2019, 235, 379–390 CrossRef CAS.
- S. Zheng, M. Tao, Q. Liu, L. Ning, Y. He and Y. Shi, Environ. Sci. Technol., 2014, 48, 8905–8910 CrossRef CAS.
- Y. Jiang, Z. Zhang, J. Fan, J. Yu, D. Bi, B. Li, Z. Zhao, M. Jia and A. Mu, Int. J. Greenhouse Gas Control, 2019, 88, 311–320 CrossRef CAS.
- G. Jing, Y. Qian, X. Zhou, B. Lv and Z. Zhou, ACS Sustainable Chem. Eng., 2018, 6, 1182–1191 CrossRef CAS.
- X. Zhang, F. Huo, X. Liu, K. Dong, H. He, X. Yao and S. Zhang, Ind. Eng. Chem. Res., 2015, 54, 3505–3514 CrossRef CAS.
Footnote |
| † Electronic supplementary information (ESI) available: Additional details on the experimental materials, schematic diagrams of experimental apparatus, the calculation method of parameters and data of hydrogen bonds calculated (PDF). See DOI: https://doi.org/10.1039/d4re00379a |
| This journal is © The Royal Society of Chemistry 2025 |

