 Open Access Article
Chemical waves in reaction-diffusion networks of small organic molecules†
Arpita
Paikar‡
a,
Xiuxiu
Li‡
ab,
Liat
Avram
 c,
Barbara S.
Smith
d,
István
Sütő
e,
Dezső
Horváth
 f,
Elisabeth
Rennert
g,
Yuqing
Qiu
h,
Ágota
Tóth
e,
Suriyanarayanan
Vaikuntanathan
h and
Sergey N.
Semenov
 *a
*a
aDepartment of Molecular Chemistry and Materials Science, Weizmann Institute of Science, Rehovot, Israel. E-mail: sergey.semenov@weizmann.ac.il
bDepartment of Chemistry, Shenzhen Key Laboratory of Small Molecule Drug Discovery and Synthesis, Southern University of Science and Technology, Shenzhen, China
cDepartment of Chemical Research Support, Weizmann Institute of Science, Rehovot, Israel
dSchool of Biological and Health Systems Engineering, Arizona State University, Tempe, Arizona, USA
eDepartment of Physical Chemistry and Materials Science, University of Szeged, Szeged, Hungary
fDepartment of Applied and Environmental Chemistry, University of Szeged, Szeged, Hungary
gGraduate Program in Biophysical Sciences, University of Chicago, Chicago, IL, USA
hDepartment of Chemistry, University of Chicago, Chicago, IL, USA
First published on 9th December 2024
Abstract
Chemical waves represent one of the fundamental behaviors that emerge in nonlinear, out-of-equilibrium chemical systems. They also play a central role in regulating behaviors and development of biological organisms. Nevertheless, understanding their properties and achieving their rational synthesis remains challenging. In this work, we obtained traveling chemical waves using synthetic organic molecules. To accomplish this, we ran a thiol-based reaction network in an unstirred flow reactor. Our observations revealed single or multiple waves moving in either the same or opposite directions, a behavior controlled by the geometry of our reactor. A numerical model can fully reproduce this behavior using the proposed reaction network. To better understand the formation of waves, we varied the diffusion coefficient of the fast inhibitor component of the reaction network by attaching polyethylene glycol tails with different lengths to maleimide and studied how these changes affect the properties of the waves and conditions for their sustained production. These studies point towards the importance of the molecular titration network motif in controlling the production of chemical waves in this system. Furthermore, we used machine learning (ML) tools to identify phase boundaries for classes of dynamic behaviors of this system, thus demonstrating the applicability of ML tools for the study of experimental nonlinear reaction-diffusion systems.
Introduction
Biological organisms adapt, evolve, and self-replicate. These essential properties remain out of reach in synthetic materials because of the inherent lack of autonomous regulation.1–3 Inspired by biological organisms, where responses are controlled by biochemical signaling networks,4 researchers have recently developed soft materials which are autonomously regulated by synthetic chemical reaction networks.5–9 The initial approach involved incorporating existing nonlinear chemistry, as in the Belousov–Zhabotinsky (BZ) reaction,10,11 into hydrogels. While this method provided a foundation for exploring rich, dynamic behaviors in hydrogels, it faced significant limitations in chemical control due to (i) restricted ability to modify component structures, (ii) incomplete knowledge of reaction mechanisms, and (iii) difficulty in simultaneously designing the hydrogel chemistry and the regulatory reaction networks. To overcome these challenges, the field has explored the use of de novo enzymatic,6,12 DNA,7,8 and organic5,9,13 reaction networks to regulate hydrogels. Among these, reaction networks composed of small organic molecules offer greater flexibility in controlling component structures through synthetic organic chemistry, surpassing the control offered by DNA and enzyme chemistry.One frequently found motif in regulatory chemical networks is chemical waves. They are important elements for regulating behaviors in biology, including cellular function,14–16 peristaltic motions,17 and heartbeats.18 Chemical fronts and waves are defined as a variation in concentration of chemical compounds which propagates in nonlinear chemical systems far from equilibrium.19,20 This propagation is usually driven by autocatalytic reactions.21 While an autocatalytic system is sufficient for the formation of fronts, the formation of waves additionally requires negative feedback. Similar to waves in the sea, chemical waves have a crest, a trough, and a face.20 In synthetic systems, chemical waves have been observed in BZ and related reactions,21 on the platinum surface during catalytic oxidation of CO,22,23 in in vitro experiments with Min proteins,14 and in predator-prey DNA reaction networks.24,25 They, however, have not yet been obtained using non-biological organic chemistry lacking oxo-halogen or metal species. Chemical waves from small organic molecules offer various advantages for controlling soft materials. First, the structural versatility of organic molecules aids in controlling the waves (e.g., their traveling velocity, amplitude, and width) by tuning the rate of constants and diffusion coefficients of reactants. Second, the chemistry of small organic molecules exhibits a natural synergy with the materials chemistry of hydrogels.5,26
In this work, we demonstrate for the first time, the synthesis of traveling chemical waves from organic reaction networks. To achieve this, we introduced thiouronium salt-based oscillatory reaction network into an unstirred flow reactor. By using maleimide derivatives with different diffusivities, we demonstrated that molecular titration motif plays a central role in generating chemical waves in this system.
Results and discussion
Experimental design
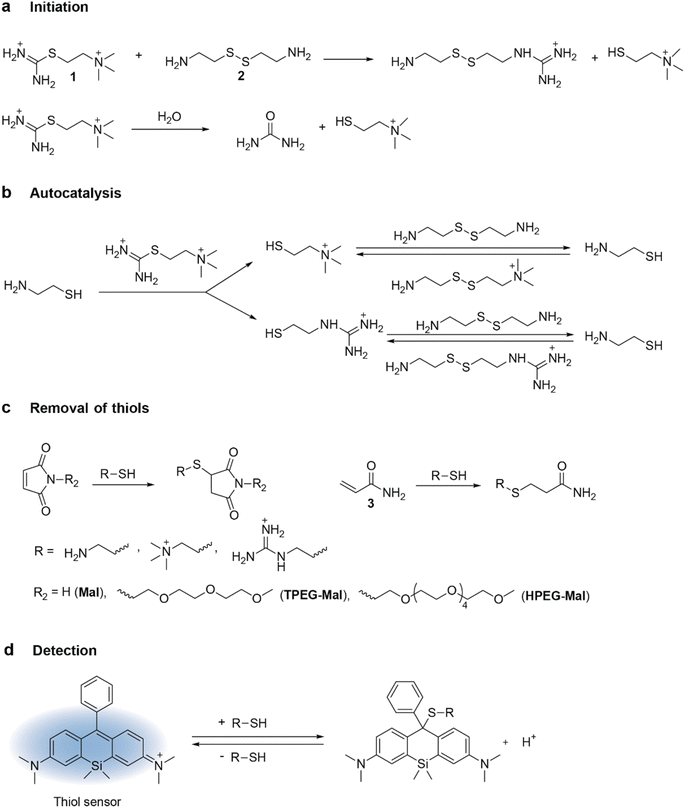
To generate chemical waves, an oscillatory chemical reaction is conducted under unstirred conditions within a hydrogel or a solution layer.27 To design recurring waves, it is essential to identify the conditions for the periodic initiation of waves within the hydrogel. For most oscillatory systems, one of these conditions is the constant supply of reactants, which ensures that the system remains out of chemical equilibrium. Additionally, other experimental parameters, such as the dimensions of the hydrogel and the concentration of reactants, must be fine-tuned to avoid steady-state situations.In this project, we used a thiouronium salts-based version of thiol oscillators, also called Semenov-Whitesides oscillators by Gao and Epstein (see Fig. 1).26,28,29 Autocatalysis in this system requires two components: thiouronium salt and disulfide of β-aminothiol, typically cystamine (Fig. 1a and b). This two-component nature of the autocatalysis allows for separate supply of these components from opposite channels and avoids activation of autocatalysis at the interface between the hydrogel and feeding solution. Another advantage of this oscillator, even over thioester-based oscillators,30,31 is the very large ratio of the rates of autocatalytic production of thiol versus their noncatalytic production by hydrolysis and aminolysis, which is an important parameter characterizing the efficiency of autocatalysis. This ratio is particularly high for thiocholine-based thiouronium salt, which we selected for this study. The negative feedback in this oscillator is provided by two molecules: maleimide and acrylamide. Maleimide is present in small quantities, but it reacts with thiols very quickly and suppresses autocatalysis.
Diffusion of molecules plays an important role in defining behaviors of chemical waves. Therefore, we sought to manipulate the diffusion coefficients of maleimide-based components in the oscillatory network by attaching polyethylene glycol tails to the nitrogen of the maleimide scaffold (Fig. 1c). We synthesized substituted maleimides by reacting N-methoxycarbonylmaleimide with amine-terminated triethylene glycol monomethyl ether (TPEG) or amine-terminated hexaethylene glycol monomethyl ether (HPEG).32 This substitution led to a gradual decrease in the diffusion coefficient from 7.76 × 10⁻⁶ cm2 s−1 for unsubstituted maleimide (Mal) to 5.23 × 10⁻⁶ cm2 s−1 for TPEG-Mal and 3.02 × 10⁻⁶ cm2 s−1 for HPEG-Mal, as determined by DOSY NMR following maleimide peak at approximately 7 ppm. The diffusion coefficients for all starting materials are summarized in the Tables S2 and S3.†
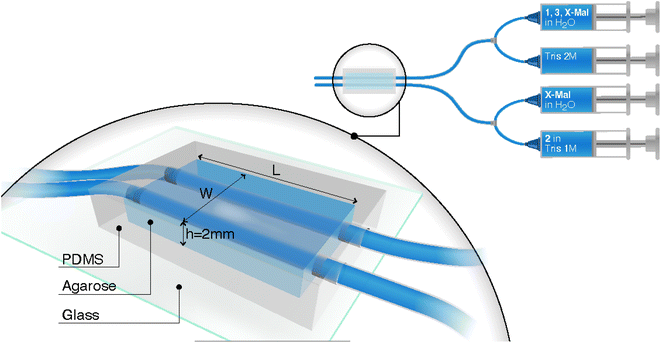
In this study, we utilized a miniaturized version of the reactor design previously published by Dúzs and Szalai.33 The reactor consists of two channels inside a hydrogel piece through which the solutions of reactants flow (Fig. 2, see ESI and Video S1† for the fabrication procedures). Therefore, we could supply cystamine and thiouronium salt, two starting materials for autocatalysis, in independent channels. We used 1% agarose hydrogel as a material for the reactor because of simplicity of its preparation, good mechanical properties, high water content, and inertness. The channels within the gel were 0.8 mm in diameter, and the thickness of the gel was 2 mm to accommodate the channels. We varied the width and length of the reactor to study their impact on the chemical waves. The width determined how quickly the reagents reached the middle of the reactor, while the length determined the distance the waves could travel.
To encase the hydrogel, we used a polydimethyl siloxane (PDMS) casing that was attached to a glass slide. The PDMS casing served as a mold to cast the hydrogel, provided mechanical strength to the setup, and offered connection ports for tubing. The setup was covered with a detachable glass slide from the top to enable visualization of the wave in the gel. For visualization, we used a silicon derivative of rhodamine dye (Fig. 1d) that reversibly reacts with thiols.34 The sensor is blue in the absence of thiols and colorless in their presence. It has sensitivity for thiols in the mM range, which is optimal for our experiments where we expected a change in the concentration of thiols in the range of 0–10 mM.
We used two setups for supplying reactants to the hydrogel by syringe pumps: one with three syringes and the other with four. The three-syringe setup was used exclusively for experiments with Mal. In this setup, the first syringe contained 1 (200 mM), Mal (20 mM), and 3 (1600 mM) in water. Its contents were premixed in a T-junction mixer with 2 M Tris buffer pH 7.5 supplied from the second syringe. This solution was flown through the first channel of the reactor. The third syringe contained 2 (200 mM) in 1 M Tris buffer pH 7.5, and its contents were directly supplied to the second channel of the setup. This arrangement ensured that 1 and maleimide were not hydrolyzed in the Tris buffer in the syringes, while also eliminating the buffer gradient inside the hydrogel. The flow rate of reactants was 200 or 300 μL h−1 in each channel. Changes in the gel were recorded by a USB camera mounted on the top of the setup.
The four-syringe setup was used for experiments with all maleimide derivatives (Mal, TPEG-Mal, or HPEG-Mal). It included two T-junction pre-mixers. The syringes one and two were identical to those used in the three-syringe setup, with an exception that the first syringe contained Mal, TPEG-Mal or HPEG-Mal dependently on the experiment. The third syringe, however, contained 2 (400 mM) in 2 M Tris buffer pH 7.5. Its contents were premixed with a water solution of Mal, TPEG-Mal or HPEG-Mal from the fourth syringe. In this arrangement, Mal, TPEG-Mal, or HPEG-Mal could diffuse from both channels.
The reason for using two setups is the difference in diffusion coefficients of Mal, TPEG-Mal, or HPEG-Mal. Mal is the fastest diffusing molecule in the system, which allowed us to supply it from one channel and still prevent premature activation of autocatalysis. TPEG-Mal or HPEG-Mal, which diffuse significantly slower than maleimide, had to be supplied from both channels.
Experiments with different reactor geometries
Initially, we conducted experiments using Mal in three reactors of varying dimensions: (i) 5 mm in width and 20 mm in length, (ii) 7 mm in width and 20 mm in length, and (iii) 5 mm in width and 30 mm in length. Across all reactor geometries, we observed multiple waves moving along the length of the reactor, parallel to the channels (Fig. 3). In the 5 mm width reactors (Fig. 3a and c), wave initiation occurred at the end of the reactor furthest away from the entrance of the reagents. For the 7 mm wide reactor (Fig. 3b), initiation occurred closer to the middle of the reactor. For the 30 mm long gel (Fig. 3c), we observed multiple waves traveling simultaneously.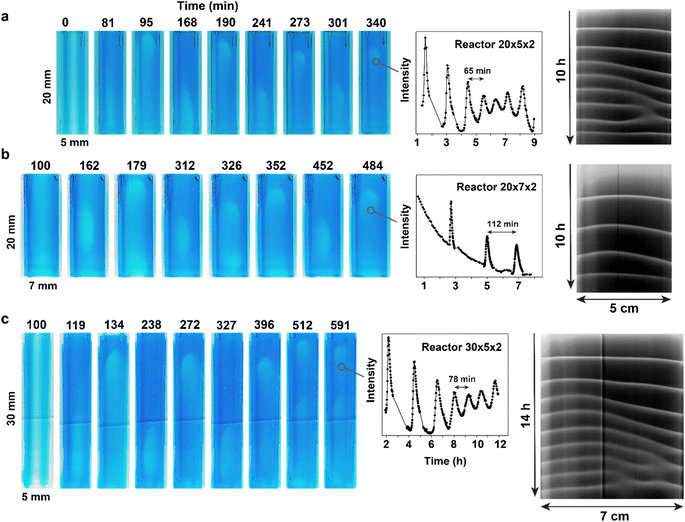 | ||
| Fig. 3 Experimental observation of chemical waves in reactors with different geometry. Dark-blue regions have low concentration of thiols; light-blue regions have high (compared to surrounding regions) concentration of thiols. The direction of the flow is from the top to the bottom. Experimental conditions: 25 °C, right channel (as in the image) – 1 M Tris-buffer pH 7.5, [1] = 100 mM, [Mal] = 10 mM, [3] = 800 mM, flow = 200 μL h−1, left channel (as in the image) – 1 M Tris-buffer pH 7.5, [2] = 200 mM, flow = 200 μL h−1. (a) The experiment in the reactor with 20 × 5 × 2 mm dimensions. The plot provides the analysis of the waves' frequency, obtained by plotting the value in the red channel at a spot along the waves' path. The space-time plot was obtained by stacking 1D profiles along the central axis of the reactor obtained at each time point in the green channel. (b) The experiment in the reactor with 20 × 7 × 2 mm dimensions. The plots were obtained as for (a). (c) The experiment in the reactor with 30 × 5 × 2 mm dimensions. The plot were obtained as for (a). See also Videos S2–S4.† | ||
Qualitatively, the formation of waves can be understood as follows: initially, reagents diffuse into the hydrogel. Similar to previously studied oscillators,28,30,31 there are three critical reactions at play: hydrolysis of 1, aminolysis of 1, and conjugate addition of thiocholine, produced by hydrolysis and aminolysis, to Mal (Fig. 1a and c). Together, these reactions act as a trigger that initiates autocatalysis only when all Mal is consumed. The timing of initiation is usually determined by the competition between hydrolysis (or aminolysis) of 1 and the supply of Mal. The supply of Mal is slightly weaker towards the downstream end of the reactor due to some of the Mal in the channel already diffused into the gel. Additionally, initiation tends to occur towards the middle (along the width) of the reactor, where the supply of Mal is slow, but the concentration of 1 is still high enough. Once initiated, a wave travels along the length of the reactor as it is an area where the medium is excitable. 1 and 2 are supplied from opposite sides, resulting in the fastest autocatalytic production of thiols, which determines excitability, in the middle. The high concentration of 3, which removes thiols after they are autocatalytically produced, ensures that the medium recovers its excitability for the next wave.
We quantitatively analyzed the frequency and propagation rate of waves in our experiment (Fig. 3). To determine frequency of waves, we measured the value in the red channel at a spot along the waves' path. As the wave passed through the spot, the blue thiol sensor (which absorbs red and partially green light) decolorized in that area, resulting in a spike in intensity in the red and green channels. Our analysis showed that the period between waves, as well as the amplitude of waves, decreased over time, approaching a constant value. The period between waves was larger (∼2 h for the last two waves) and the waves were “sharper” in the wider (7 mm) reactor compared to the narrower (5 mm) reactors, where the period between waves was 1–1.5 h.
To analyze the propagation rate of waves, we measured the rate of movement of the point corresponding to a wave's position at its half amplitude. Our data revealed that the propagation rate did not significantly depend on the geometry of the reactors (Fig. S14†). As with the period between waves, the propagation rate decreased over time, approaching a constant value. These phenomena likely reflect the global approach of the system to a steady wave-production mode. The larger intervals between waves at the beginning of the experiments allowed for a more complete recovery of concentrations of 1 and 2 in the gel, resulting in faster autocatalysis and faster propagation of waves. The values for propagation rates in the range of 7–22 mm h−1 were comparable to our previous studies and other organic or biochemical systems,5,24,35,36 but were almost order of magnitude slower than in BZ reaction.37
Of particular interest is the comparison with experiments performed by Dúzs and Szalai with the bromate-sulfite-ferrocyanide (BSF) reaction.33 They observed waves that were qualitatively very similar to our case. These waves emerged at one end of the reactor and traveled parallel to the channels. Although the chemical nature of reactants and the mechanism of the BSF reaction are substantially different from Semenov–Whitesides system,31 it also requires the substrates for the key autocatalytic step to be supplied externally. Thus, this type of wave in a two-channel reactor can be expected for a variety of chemical oscillators that share this feature.
Experiments with different derivatives of maleimide
One of the primary advantages of using small organic molecules for constructing reaction-diffusion systems is the ability to independently vary reactivity and diffusion. Thus, we used three different maleimide derivatives – Mal, TPEG-Mal, and HPEG-Mal – that have almost identical reactivity but different diffusion rates. To induce sustained waves – defined as periodic waves traveling the full length of the hydrogel – we supplied PEG-substituted maleimides from both channels. For the sake of better comparison, Mal was also supplied from both channels in this series of experiments (Fig. 4, Videos S5–S11†). During the search of conditions for sustained wave production with different maleimides, we noticed that under certain conditions, waves traveling through the entire length of the hydrogel would fade, but the system did not settle into a steady state. Instead, the system reached a state where only very short-traveling waves appeared at the tip of the hydrogel piece (for example see Video S5†). We called this regime “tip waves”.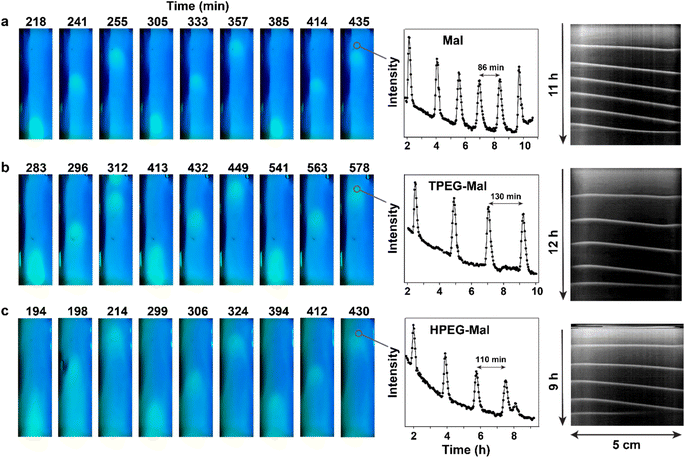 | ||
| Fig. 4 Experimental observation of chemical waves obtained with unsubstituted and PEG-substituted maleimides. Dark-blue regions have low concentration of thiols; light-blue regions have high (compared to surrounding regions) concentration of thiols. Direction of the flow is from the top to the bottom. Experimental conditions: 25 °C, right channel (as in the image) – 1 M Tris-buffer pH 7.5, [1] = 100 mM, [3] = 800 mM, flow = 300 μL h−1, concentrations of corresponding maleimides are shown in the figure, left channel (as in the image) – 1 M Tris-buffer pH 7.5, [2] = 200 mM, flow = 300 μL h−1. (a) The experiment with Mal. Right channel [Mal] = 10 mM; left channel [Mal] = 4 mM. The plot provides the analysis of the waves' frequency, obtained by plotting the value in the red channel at a spot along the waves' path. The space-time plot was obtained by stacking 1D profiles along the central axis of the reactor obtained at each time point in the green channel. (b) The experiment with TPEG-Mal. Right channel [TPEG-Mal] = 25.5 mM; left channel [TPEG-Mal] = 12.5 mM. The plots were obtained as for (a). (c) The experiment with HPEG-Mal. Right channel [HPEG-Mal] = 35 mM; left channel [HPEG-Mal] = 17 mM. The plots were obtained as for (a). See also Videos S5–S11.† | ||
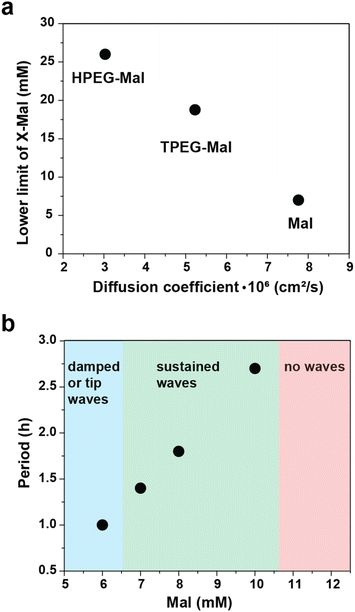
The concentrations of maleimide derivatives necessary for achieving sustained waves increased with the rise in the molecular weight of the maleimide derivatives. For instance, the minimal concentrations of Mal required for sustained waves were 4 and 10 mM in left and right channels respectively (Fig. 4a and Video S6†). Corresponding concentrations for TPEG-Mal were 12.5 and 25.5 mM (Fig. 4b and Video S10†), and for HPEG-Mal, they were 17 and 35 mM (Fig. 4c and Video S11†). Analysis of the period and propagation rate of these waves (Fig. 4 and S15†) revealed a surprising insensitivity to the nature of the maleimide component in the observed regime. Nevertheless, Mal supported sustained waves with a period of approximately one and a half hour (Fig. 4a), while for TPEG-Mal and HPEG-Mal, the periods were not shorter than two hours (Fig. 4b and c). The space-time plots (Fig. 4) indicate that in all experiments waves reached steady regimes where they propagate with constant velocity. The propagation rate for the waves approached about 15 mm h−1, regardless of the maleimide component (Fig. S15†).
To better understand relationship between conditions for sustained waves, concentrations of maleimide derivatives, and their diffusion coefficients, we plotted minimal concentration of the maleimide component (average between two channels) required for sustained waves against the diffusion coefficient of the maleimide component (Fig. 5a). The dependence is inverse. This trend is intuitively understandable. The formation of sustained waves, much like oscillations, requires the recovery of excitability in the medium after the passage of a wave. This recovery relies on the complete quenching of autocatalysis, a process enabled by the maleimide component. Given that the supply of maleimide derivatives is proportional to their concentrations and diffusion coefficients, derivatives with slower diffusion rates need to be introduced at higher concentrations to maintain the supply rate similar to that of Mal.
In experiments with Mal, we also examined dependence of the frequency of waves on Mal concentration (Fig. 5b, Videos S5–S9†). The period of the waves gradually increases as we move from the lower to the higher limit of maleimide concentrations. At concentrations of 8 mM and 16 mM in left and right channels (12 mM average), no initiation happens, and waves do not emerge. In this regard, the behavior of the waves closely mirrors the behavior of oscillations in the Semenov–Whitesides system.28,30,31 As Mal concentration increases, the oscillations undergo Fold bifurcation and disappear through infinite period increase, as waves do in the current setup.29–31 Both trends – inverse dependence of the concentration vs. diffusion coefficient and linear dependence of the period vs. concentration – point towards importance of molecular titration motif for the behavior of these waves.38,39 Strong (in many cases linear) dependence of the system's dynamics from the supply rate of the fast inhibitor is characteristic for it.40
Nevertheless, Mal, TPEG-Mal, and HPEG-Mal are not completely interchangeable in terms of the properties of the waves that they produce. We conducted a detailed analysis of the wave shapes in experiments involving Mal, TPEG-Mal, and HPEG-Mal (Fig. 6). The impact of maleimides on the wave shapes is clearly observable. The shape gradually transitions from “ball-like” to “bullet-like”. This shape change is likely related to an increase in the steepness of concentration gradients when transitioning from Mal, to TPEG-Mal and HPEG-Mal. The steeper gradient is necessary for TPEG-Mal and HPEG-Mal to maintain the required flux of these molecules despite their slower diffusion compared to Mal. However, the resulting distributions of reagents are not equivalent, leading to differences in the shape of the waves.
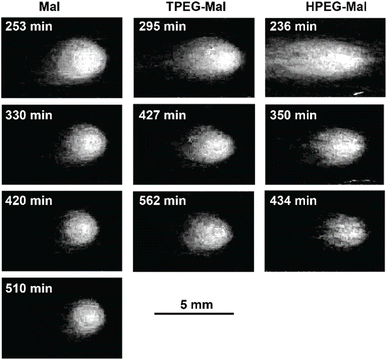 | ||
| Fig. 6 Analysis of the shapes of the waves obtained with unsubstituted and PEG-substituted maleimides. The waves were taken from experiments shown in Fig. 4. The profiles of the waves were obtained by subtracting the background (a representative image without a wave) from the image with the wave in green and red channels. | ||
This observation illustrates how subtle features of a dynamic chemical system can be finely tuned by modifications in the molecular structure of participating reactants. The attachment of the PEG tails to the maleimide core most likely has little influence on the reactivity of the molecules but slows their diffusion. As a result of these modifications, all molecules can generate a similar waves, but their shape depends on the nature of the molecules.
Numerical model
To better understand the formation of waves in our experiments, we have constructed a numerical model that describes the reaction network in Fig. 1. Mass transport in the vertical direction has only a small contribution, since the flow reactor is made up of a thin gel. Hence, the setup in Fig. 2 is simplified by considering only the center horizontal plane, resulting in a two-dimensional system. The width and length of the reaction-diffusion domain and the initial concentrations are set to match the experimental values. The linear flow velocity is adjusted to correspond to the experimental residence times (Fig. 7).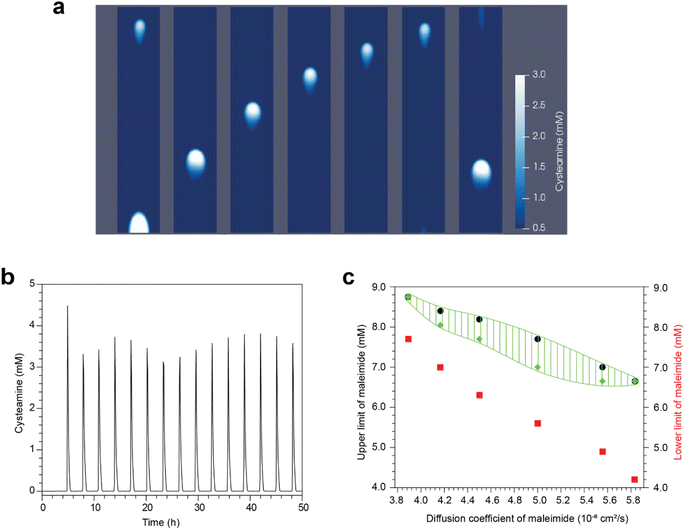 | ||
| Fig. 7 Numerical modeling of the chemical waves in linear hydrogel flow reactor. (a) Stack of snapshots of a propagating wave. Time interval between snapshots is 36 minutes. Color indicates concentration of cysteamine. The diffusion coefficient of the maleimide (corresponding to Mal, TPEG-Mal, or HPEG-Mal in the experimental system) is 5.8 × 10⁻⁶ cm2 s−1 and the average maleimide concentration is (9.5 + 3.8)/2 = 6.65 mM with parameters in ESI.† (b) Oscillations of the cysteamine concentration at a spot in the middle of the hydrogel. (c) Regions of different behaviors of the system. Above black dots, no initiation happens. Between black and green dots sustained waves traveling through the reactor are observed. Between green and red dots tip waves are seen. Below red dots waves are damped. | ||
As the reactants fill up the gel, a mixing zone develops along the central long axis of the reactor. At the far end, a spot with high cysteamine concentration may evolve that generates a chemical wave traveling along the axis in a direction opposite to the flow of reactants. This wave is characterized by a maximum in cysteamine concentration and leaves a low cysteamine state in its wake. This is then followed by a second wave, behind which the central region can remain in the high cysteamine state or return to the low cysteamine state, depending on the conditions.
In Fig. 7a, we present a scenario where the sustained periodic initiation of a chemical wave takes place at the far end of the gel. The resultant wave propagates along the long axis yielding spikes of high cysteamine concentration with uniform temporal delay between them (see Fig. 7b). This behavior, shown with a green shaded area in the phase diagram of Fig. 7c, is observed below a critical maleimide input concentration. Above that, no sufficient buildup of cysteamine occurs at the edge and no waves are initiated. A lower critical maleimide concentration also exists (illustrated by red dots in Fig. 7c), below which the second wave leaves a trail of high cysteamine concentration along the axis and no further wave propagation occurs. In the region above this latter limit, the initiation departs from the edge as the maleimide concentration is lowered, generating the tip waves that we also observed in experiments.
Overall, the model mirrors experiment in both qualitative and quantitative aspects, and it captures even unusual regimes such as tip waves. This correspondence shows that behavior of this system can be mostly explained by the basic reaction set proposed in Fig. 1.
Analysis of the waves using machine learning
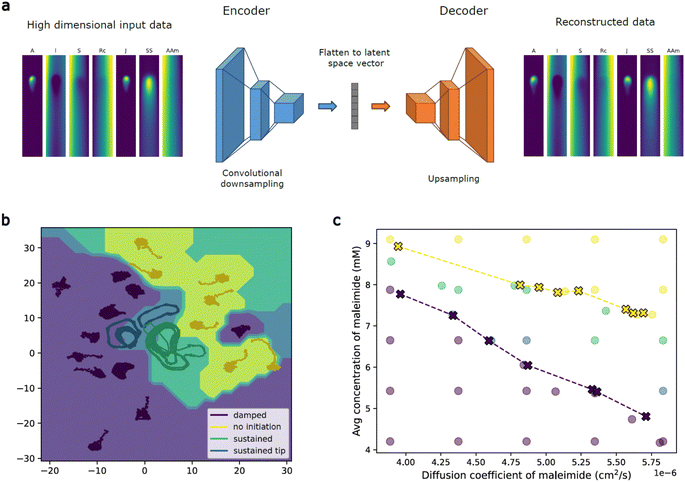
Machine learning (ML) can be used to identify the key patterns and relationships in large data sets or high dimensional data, providing insights into the underlying system. To better understand the chemical waves in our system, we analyzed this system using a convolutional autoencoder structure that passes the data through a low dimensional bottleneck while still preserving enough information to reconstruct the input data,41,42 ensuring that essential features are still present in the data (Fig. 8a). We trained the autoencoder using images generated by the numerical model because they contain more chemical information and less noise than experimental data while still capturing all the essential features of the experimental system. The low dimensional latent space learned by the autoencoder contains the most important features of large and potentially noisy input data space. Dynamics in this reduced dimensional space can additionally provide insights into the dynamics of the full system.43,44 We use these ML techniques to identify phase boundaries on wave behaviors as well as investigate a minimal dynamical model of the system.We estimated the phase boundaries in the parameter space of the system using machine learning techniques to predict boundary points and behaviors for parameter combinations not sampled by simulations.45 From a small number of simulations, we used a linear Support Vector Machine (SVM) to calculate the latent space boundary between different labeled resulting behaviors (Fig. 8b). The separating hyperplane was then projected back to the space of input parameters, allowing prediction of behavior directly from input parameters (Fig. 8c). The initial boundary prediction is noisy, but converges quickly with a small number of resampled points from the identified region of interest. We resample based on points selected in the latent space and then projected back to the parameter space as it provides more efficient coverage of less frequent behaviors.46,47 Machine learning guided sampling and boundary prediction of this system allows estimates of behavior transition boundaries with significantly fewer samples than would be needed in the full parameter space.
To propose a minimal model of the system, we first averaged the data from the numerical model along the short axis for each channel, giving us a series of 1D concentration profiles over time for each chemical species (Fig. S18†). We then trained an autoencoder on the combination of concentrations for each time and space point, allowing us to reduce 7 channels to only 1. This suggests that there is a minimal model that could represent concentration profiles of reactive species through only a single dynamical variable.43 We find that the following model qualitatively describes the waves seen in the one dimensional latent variable. The wave velocity as a function of the latent variable, u, is given as
v(u) = v0 + ![[v with combining macron]](https://www.rsc.org/images/entities/i_char_0076_0304.gif) ∇ln(u), ∇ln(u), |
where m(x) is the background source gradient, analogous to the source chemicals diffusing out from the flow channels, and approximated as linear. This wave has the structure of a Fisher like wave with a changing background concentration. Overall, this analysis helps identify some of the important driving forces and characteristics of the resultant waves. Specifically, in the latent dimension, the waves are convected by the equivalent of a chemical potential like gradient. Further, source and sink terms reminiscent of those encountered in population dynamics models also drive the wave forms.
Conclusion
As the majority of dynamically self-organized states of matter, chemical waves are challenging targets for rational design because of their holistic nature. The overwhelming majority of traveling chemical waves were seen in inorganic redox reactions; these observations provided insights into dissipative chemical structures.19–21 Recent studies have begun to explore a bottom-up approach to synthesize chemical waves using synthetic DNA reaction networks.24 Here, we used a bottom-up approach to demonstrate, for the first time, the synthesis of traveling chemical waves using networks of organic reactions.Quadratic autocatalysis with two direct inhibition reactions is among the simplest reaction networks capable of generating sustained oscillations in CSTR.29 This network was used to create chemical oscillators with various chemistries.28,31,48 Here, we showed that it can also generate sustained chemical waves. This observation follows a general trend in nonlinear chemical reactions where the same reaction (e.g., BZ reaction) can generate a variety of phenomena depending on the reactor type and other experimental conditions. Nevertheless, the reaction networks of BZ type have many elementary steps and many sources on nonlinearity;49 it is interesting to see that similar trends persist even in networks with only a few reactions.
A key feature of the two-inhibitor network is the molecular titration (trigger) motif,39 which is responsible for maintaining oscillations in CSTR.31 By varying the diffusion coefficient of the fast inhibitor, we demonstrated that the trigger motif is also responsible for the generation of the sustained waves. This observation highlights a deep connection between chemical oscillations and waves, showing that the same underlying mechanisms can give rise to both phenomena.27 It also highlights the usefulness of deconstructing complex networks into smaller motifs to understand their behavior.50,51 While our understanding of such holistic systems will always be incomplete, this reductionist approach is still valuable for designing new reaction networks with desirable properties.
An alternative to the reductionist approach for constructing dynamic chemical systems is the use of machine learning (ML), which captures the behavior of a system as a whole in response to changes in external parameters. The first step in this direction is to train ML on the numerical model of the system. In this work, we demonstrated that ML, using latent space analysis, identifies and extracts the most relevant parts of extremely high dimensional data and captures essential dynamic features of the system. As a result, it can predict the phase space of the system and suggest the dimensionality of a minimalistic model that would capture some essential properties of the system. For design purposes, the next step would involve extracting major correlations between system behaviors and control parameters within a large parameter space using ML. These correlations can then be used to guide the design of such systems.
Through this work, we envision that these types of waves may produce peristaltic motions in soft materials,52,53 relevant for applications where fluids and particles need to be controlled autonomously.54 For future applications, it might be beneficial to change the negative feedback from conjugate addition to oxidation to enable the regeneration of thiols without material exchange. Learning how specific spatiotemporal behaviors originate from synthetic networks may reveal new strategies to synthesize non-linear reaction-diffusion systems and materials regulated by them.55–57
Data availability
The data required to reproduce finding in this manuscript are available in the ESI.†Author contributions
S. N. S. supervised the research. S. N. S., A. P., and X. L. planned the project and designed experiments. A. P. and X. L. performed experiments. A. P., X. L., L. A., and S. N. S. analyzed data. L. A. determined diffusion coefficients. I. S., D. H., and A. T. performed numerical simulations. E. R., Y. Q., and S. V. studied the system by machine learning. S. N. S., B. S. S., A. P., A. T., and S. V. wrote the manuscript with help from all coauthors.Conflicts of interest
Authors declare no conflict of interest.Acknowledgements
This work was supported by the Israel Science Foundation (1562/23 to S. N. S.), the Minerva Stiftung with funding from the Federal German Ministry for Education and Research, and a research grant from the Marshall and Arlene Bennett Family Research Program. Financial support from Helen and Martin Kimmel Institute for Magnetic Resonance Research is gratefully acknowledged. SV, ER and YQ were funded by the National Institute of General Medical Sciences of the NIH under Award No. R35GM147400. IS, DH and AT thank the financial support of National Research, Development, and Innovation Office (K138844 and TKP2021-NVA-19).References
- M. M. Lerch, A. Grinthal and J. Aizenberg, Adv. Mater., 2020, 32, e1905554 CrossRef.
- P. J. de Jong, F. Trigka and M. M. Lerch, ChemSystemsChem, 2024, 6, e202400005 CrossRef CAS.
- A. Walther, Adv. Mater., 2020, 32, e1905111 CrossRef.
- B. N. Kholodenko, Nat. Rev. Mol. Cell Biol., 2006, 7, 165–176 CrossRef CAS PubMed.
- A. Paikar, A. I. Novichkov, A. I. Hanopolskyi, V. A. Smaliak, X. Sui, N. Kampf, E. V. Skorb and S. N. Semenov, Adv. Mater., 2022, 34, e2106816 CrossRef PubMed.
- S. G. J. Postma, I. N. Vialshin, C. Y. Gerritsen, M. Bao and W. T. S. Huck, Angew. Chem., Int. Ed., 2017, 56, 1794–1798 CrossRef CAS.
- A. Cangialosi, C. Yoon, J. Liu, Q. Huang, J. Guo, T. D. Nguyen, D. H. Gracias and R. Schulman, Science, 2017, 357, 1126–1130 CrossRef CAS PubMed.
- L. N. Green, H. K. K. Subramanian, V. Mardanlou, J. Kim, R. F. Hariadi and E. Franco, Nat. Chem., 2019, 11, 510–520 CrossRef CAS PubMed.
- G. Fusi, D. Del Giudice, O. Skarsetz, S. Di Stefano and A. Walther, Adv. Mater., 2023, 35, e2209870 CrossRef PubMed.
- R. Yoshida, Adv. Mater., 2010, 22, 3463–3483 CrossRef CAS PubMed.
- R. Yoshida, T. Takahashi, T. Yamaguchi and H. Ichijo, J. Am. Chem. Soc., 1996, 118, 5134–5135 CrossRef CAS.
- E. Jee, T. Bansagi, Jr., A. F. Taylor and J. A. Pojman, Angew. Chem., Int. Ed., 2017, 56, 1794–1798 CrossRef.
- T. Heuser, E. Weyandt and A. Walther, Angew. Chem., Int. Ed., 2015, 54, 13258–13262 CrossRef CAS PubMed.
- M. Loose, E. Fischer-Friedrich, J. Ries, K. Kruse and P. Schwille, Science, 2008, 320, 789–792 CrossRef CAS PubMed.
- L. Leybaert and M. J. Sanderson, Physiol. Rev., 2012, 92, 1359–1392 CrossRef CAS.
- F. Siegert and C. Weijer, J. Cell Sci., 1989, 93, 325–335 CrossRef CAS.
- P. E. Rapp, J. Exp. Biol., 1979, 81, 281–306 CrossRef CAS PubMed.
- J. M. Davidenko, A. V. Pertsov, R. Salomonsz, W. Baxter and J. Jalife, Nature, 1992, 355, 349–351 CrossRef CAS PubMed.
- R. Kapral and K. Showalter, Chemical Waves and Patterns, Springer, 1995 Search PubMed.
- J. Ross, S. C. Muller and C. Vidal, Science, 1988, 240, 460–465 CrossRef CAS PubMed.
- A. N. Zaikin and A. M. Zhabotinsky, Nature, 1970, 225, 535–537 CrossRef CAS PubMed.
- G. Ertl, Science, 1991, 254, 1750–1755 CrossRef CAS PubMed.
- M. D. Graham, I. G. Kevrekidis, K. Asakura, J. Lauterbach, K. Krischer, H. H. Rotermund and G. Ertl, Science, 1994, 264, 80–82 CrossRef CAS PubMed.
- A. Padirac, T. Fujii, A. Estevez-Torres and Y. Rondelez, J. Am. Chem. Soc., 2013, 135, 14586–14592 CrossRef CAS PubMed.
- A. Zambrano, A. S. Zadorin, Y. Rondelez, A. Estevez-Torres and J. C. Galas, J. Phys. Chem. B, 2015, 119, 5349–5355 CrossRef CAS PubMed.
- A. I. Hanopolskyi, T. A. Mikhnevich, A. Paikar, B. Nutkovich, I. Pinkas, T. Dadosh, B. S. Smith, N. Orekhov, E. V. Skorb and S. N. Semenov, Chem, 2023, 9, 3666–3684 CAS.
- I. R. Epstein and J. A. Pojman, An introduction to nonlinear chemical dynamics : oscillations, waves, patterns, and chaos, Oxford University Press, New York, 1998 Search PubMed.
- A. I. Novichkov, A. I. Hanopolskyi, X. Miao, L. J. W. Shimon, Y. Diskin-Posner and S. N. Semenov, Nat. Commun., 2021, 12, 2994 CrossRef CAS.
- H. Wang, Z. Cheng, L. Yuan, L. Ren, C. Pan, I. R. Epstein and Q. Gao, J. Am. Chem. Soc., 2023, 145, 23152–23159 CrossRef CAS.
- B. J. Cafferty, A. S. Y. Wong, S. N. Semenov, L. Belding, S. Gmur, W. T. S. Huck and G. M. Whitesides, J. Am. Chem. Soc., 2019, 141, 8289–8295 CrossRef CAS.
- S. N. Semenov, L. J. Kraft, A. Ainla, M. Zhao, M. Baghbanzadeh, C. E. Campbell, K. Kang, J. M. Fox and G. M. Whitesides, Nature, 2016, 537, 656–660 CrossRef CAS PubMed.
- C. Hammaecher, B. Joris, E. Goormaghtigh and J. Marchand-Brynaert, Eur. J. Org Chem., 2013, 2013, 7952–7959 CrossRef CAS.
- B. Dúzs and I. Szalai, Commun. Chem., 2020, 3, 168 CrossRef.
- K. Umezawa, M. Yoshida, M. Kamiya, T. Yamasoba and Y. Urano, Nat. Chem., 2017, 9, 279–286 CrossRef CAS.
- S. N. Semenov, L. Belding, B. J. Cafferty, M. P. S. Mousavi, A. M. Finogenova, R. S. Cruz, E. V. Skorb and G. M. Whitesides, J. Am. Chem. Soc., 2018, 140, 10221–10232 CrossRef CAS.
- M. M. Wrobel, T. Bansagi, S. K. Scott, A. F. Taylor, C. O. Bounds, A. Carranzo and J. A. Pojman, Biophys. J., 2012, 103, 610–615 CrossRef CAS PubMed.
- L. Howell, E. Osborne, A. Franklin and E. Hebrard, J. Phys. Chem. B, 2021, 125, 1667–1673 CrossRef CAS.
- S. N. Semenov, A. J. Markvoort, W. B. L. Gevers, A. Piruska, T. F. A. de Greef and W. T. S. Huck, Biophys. J., 2013, 105, 1057–1066 CrossRef CAS.
- N. E. Buchler and M. Louis, J. Mol. Biol., 2008, 384, 1106–1119 CrossRef CAS.
- S. N. Semenov, A. J. Markvoort, T. F. A. de Greef and W. T. S. Huck, Angew. Chem., Int. Ed., 2014, 53, 8066–8069 CrossRef CAS PubMed.
- S. F. Zhang, J. H. Zhai, J. F. Chen and Q. He, IEEE Sys. Man. Cybern., 2018, 415–419 Search PubMed.
- M. Tschannen, B. Olivier and L. Mario, arXiv, 2018, preprint, DOI:10.48550/arXiv.1812.05069.
- R. Seyboldt, J. Lavoie, A. Henry, J. Vanaret, M. D. Petkova, T. Gregor and P. Francois, Proc. Natl. Acad. Sci. U.S.A., 2022, 119, e2113651119 CrossRef CAS PubMed.
- J. Colen, A. Poncet, D. Bartolo and V. Vitelli, Phys. Rev. Lett., 2024, 133, 107301 CrossRef PubMed.
- T. Gaskin, G. A. Pavliotis and M. Girolami, Proc. Natl. Acad. Sci. U.S.A., 2023, 120, e2216415120 CrossRef CAS.
- M. J. Falk, F. D. Roach, W. Gilpin and A. Murugan, Phys. Rev. Res., 2024, 6, 033052 CrossRef.
- C. Dai and S. C. Glotzer, J. Phys. Chem. B, 2020, 124, 1275–1284 CrossRef CAS.
- M. Ter Harmsel, O. R. Maguire, S. A. Runikhina, A. S. Y. Wong, W. T. S. Huck and S. R. Harutyunyan, Nature, 2023, 621, 87–93 CrossRef CAS.
- L. Gyorgyi, T. Turanyi and R. J. Field, J. Phys. Chem., 1990, 94, 7162–7170 CrossRef CAS.
- J. J. Tyson, K. C. Chen and B. Novak, Curr. Opin. Cell Biol., 2003, 15, 221–231 CrossRef CAS.
- U. Alon, Nat. Rev. Genet., 2007, 8, 450–461 CrossRef CAS.
- S. Maeda, Y. Hara, R. Yoshida and S. Hashimoto, Angew. Chem., Int. Ed., 2008, 47, 6690–6693 CrossRef CAS.
- V. V. Yashin and A. C. Balazs, Science, 2006, 314, 798–801 CrossRef CAS PubMed.
- L. Ren, M. Wang, C. Pan, Q. Gao, Y. Liu and I. R. Epstein, Proc. Natl. Acad. Sci. U.S.A., 2017, 114, 8704–8709 CrossRef CAS.
- L. Ren, L. Wang, Q. Gao, R. Teng, Z. Xu, J. Wang, C. Pan and I. R. Epstein, Angew. Chem., Int. Ed., 2020, 59, 7106–7112 CrossRef CAS PubMed.
- L. Ren, L. Yuan, Q. Gao, R. Teng, J. Wang and I. R. Epstein, Sci. Adv., 2020, 6, eaaz9125 CrossRef PubMed.
- X. M. He, M. Aizenberg, O. Kuksenok, L. D. Zarzar, A. Shastri, A. C. Balazs and J. Aizenberg, Nature, 2012, 487, 214–218 CrossRef CAS.
Footnotes |
| † Electronic supplementary information (ESI) available. See DOI: https://doi.org/10.1039/d4sc06351a |
| ‡ These authors contributed equally to this work. |
| This journal is © The Royal Society of Chemistry 2025 |

