
 Open Access Article
 This Open Access Article is licensed under a Creative Commons Attribution-Non Commercial 3.0 Unported Licence
Fast synthesis of Cu@zeolitic imidazolate framework-8 (ZIF-8) derived Cu/ZnO catalysts via a facile mechanical grinding method for CO2 hydrogenation to methanol†
Fei
Chen
a,
Siyu
Liu
a,
Hao
Huang
e,
Bo
Wang
e,
Zhihao
Liu
e,
Xiuyun
Jiang
e,
Wenjie
Xiang
e,
Guohui
Yang
 ef,
Guangbo
Liu
g,
Xiaobo
Peng
*b,
Zhenzhou
Zhang
*cd,
Zhongyi
Liu
*ac and
Noritatsu
Tsubaki
*e
ef,
Guangbo
Liu
g,
Xiaobo
Peng
*b,
Zhenzhou
Zhang
*cd,
Zhongyi
Liu
*ac and
Noritatsu
Tsubaki
*e
aCollege of Chemistry, Pingyuan Laboratory, Zhengzhou University, Zhengzhou, 450001, China. E-mail: liuzhongyi@zzu.edu.cn
bNational Engineering Research Center of Chemical Fertilizer Catalyst, College of Chemical Engineering, Fuzhou University, Gongye Road 523, Fuzhou 350002, China. E-mail: PENG.Xiaobo@fzu.edu.cn
cState Key Laboratory of Coking Coal Resources Green Exploitation, School of Chemical Engineering, Zhengzhou University, Zhengzhou 450001, China. E-mail: zhangzhenzhou@zzu.edu.cn
dEngineering Research Center of Advanced Functional Material Manufacturing of Ministry of Education, School of Chemical Engineering, Zhengzhou University, Zhengzhou 450001, China
eDepartment of Applied Chemistry, School of Engineering, University of Toyama, Gofuku 3190, Toyama 930-8555, Japan. E-mail: tsubaki@eng.u-toyama.ac.jp
fState Key Laboratory of Fine Chemicals, School of Chemical Engineering, Dalian University of Technology, Dalian 116024, China
gQingdao Institute of Bioenergy and Bioprocess Technology, Chinese Academy of Sciences, Qingdao 266101, China
First published on 23rd December 2024
Abstract
Direct conversion of CO2 with renewable H2 to produce methanol provides a promising way for CO2 utilization and H2 storage. Cu/ZnO catalysts are active, but their activities depend on the preparation methods. Here, we reported a facile mechanical grinding method for the fast synthesis of Cu@zeolitic imidazolate framework-8 (ZIF-8) derived Cu/ZnO catalysts applied in CO2 hydrogenation to methanol. The confinement in ZIF-8 cages led to the formation of metal oxide particles with controlled crystallite sizes after pyrolysis in air. ZnO derived from ZIF-8 with ultrahigh specific surface area offered high CuO dispersion, obtaining higher Cu0 surface area and smaller Cu crystallite size after reduction. The effects of the Cu/(Cu + Zn) molar ratio and alcohol types during catalyst preparation on the textural properties of final catalysts were systemically studied. The resultant catalyst exhibited high activity with STY of methanol up to 128.7 g kgcat−1 h−1 at 200 °C, much higher than that of catalysts prepared by the conventional impregnation and coprecipitation methods and commercial Cu/ZnO. The present work offers an efficient method for optimizing Cu/ZnO catalysts for CO2 hydrogenation to methanol.
Introduction
Carbon dioxide (CO2) concentration in the atmosphere is increasing year by year because of human activities and fossil fuel combustion, resulting in ocean acidification, global warming and sea level rising.1,2 Therefore, the green carbon science including the capture, utilization and storage of CO2 is becoming more and more important. As one of the potential carbon sources, CO2 can be converted to multiple high-value added chemical products such as methanol, ethanol, gasoline, olefins, aromatics, etc.3,4 Among them, selective CO2 hydrogenation to methanol is industrially viable because methanol is a clean liquid fuel which can be directly used for vehicles and as a starting material for synthesizing important downstream products such as formaldehyde, dimethyl ether (DME), acetic acid and so on.5 Hence, it is critical to develop a facile method to prepare a highly active and stable catalyst for CO2 hydrogenation to methanol.Cu-based catalysts have been widely applied for industrial methanol synthesis from syngas and also to be active for CO2 hydrogenation to methanol, but their activity is closely related to the preparation methods, including co-precipitation,6,7 impregnation,8 sol–gel,9 organic acid combustion,10 urea hydrolysis,11 deposition–precipitation,12 hydrothermal method13 and flame spray pyrolysis (FSP).14 Wang et al. studied the effect of preparation methods on the activity of La modified Cu–Mn–Zr catalysts for CO2 hydrogenation to methanol, disclosing that the catalyst synthesized by the hydrothermal method exhibited the highest methanol selectivity due to the highest percentage of moderate basic sites.15 E. Heracleous and co-workers revealed that the physiochemical properties of a Cu–Mo2C catalyst can be tuned by different preparation methods. They found that the catalyst prepared by the sol–gel combustion method promotes the dissociation of CO2 and H2 and also enhances the interaction between Cu and Mo2C, thus increasing CO2 conversion.16 It is generally accepted that coprecipitation is the most applied method for Cu-based catalysts. However, there exist some drawbacks to this method, such as tedious multi-step processing and the need for accurate pH/temperature control.17 Besides, the precipitate needs to be washed several times in order to remove Na+ ions, leading to the generation of a large amount of wastewater. Compared to the coprecipitation method, the mechanical grinding method shows specific advantages, such as rapidity, simplicity and being solvent-free or the utilization of small amounts of solvent.18,19 Thus, it has been adopted to prepare Cu-based catalysts.
Recently, metal organic frameworks (MOFs) have received much attention in the catalysis field owing to their unique structure, which can confine metal particles within their cages.20–23 The pyrolysis of MOFs can yield metal oxides or carbon materials, which is strongly associated with pyrolysis conditions.24 Zeolitic imidazolate frameworks (ZIFs) are a novel material exhibiting unique properties from both zeolites and MOFs such as ultra-high surface area, chemical and thermal stability, and unimodal micropores.25 C8H12N4Zn, also known as ZIF-8, is synthesized using Zn2+ as the metal ion and 2-methylimidazole as the organic ligand to generate three-dimensional zeolite structures.26 Liu et al. prepared an inverse ZnO/Cu catalyst by directly calcining a Cu@ZIF-8 precursor for CO2 hydrogenation to methanol and revealed that the turnover frequency of methanol increased by decreasing Cu and ZnO particle sizes.27 Furthermore, they synthesized a Pd@ZIF-8 derived PdZn alloy via a similar method and studied the effect of calcination temperature on the formation of the PdZn alloy.26 The characterization results indicated that the active site that was responsible for methanol production was the PdZn alloy rather than metallic Pd. Carbon-modified CuO/ZnO catalysts were also fabricated via the deposition–precipitation method using ZIF-8 derived ZnO as the support.24 The pyrolysis temperature had an obvious influence on the surface carbon content and oxygen vacancies, which played important roles in CO2 conversion and methanol selectivity. V. K. Velisoju et al. used a two-step method to synthesize highly dispersed Cu encapsulated on ZIF-8 that suppressed the reverse water–gas shift gas (RWGS) reaction, leading to higher methanol selectivity and productivity compared to those of the commercial Cu–Zn–Al catalyst.28
Typically, the preparation of Cu@ZIF-8 consists of two steps. ZIF-8 is first synthesized using zinc nitrate and 2-methylimidazole, followed by dispersion of the as-prepared ZIF-8 in alcohol solution containing copper nitrate producing Cu@ZIF-8. However, the whole synthesis time takes at least 24 h and large amounts of alcohol solvent are also used during the synthesis process. Therefore, it is necessary to develop a facile and environmentally friendly method with short synthesis time and the utilization of a small amount of alcohol solvent to synthesize Cu@ZIF-8.
In this work, a facile mechanical grinding method was developed for the fast synthesis of Cu@ZIF-8, followed by direct pyrolysis of Cu@ZIF-8 producing CuO/ZnO catalysts with controlled CuO and ZnO crystallite sizes. The structural and physicochemical properties of Cu@ZIF-8 precursors and CuO/ZnO catalysts were regulated by simply varying the Cu/(Cu + Zn) molar ratio and the types of alcohol. The reduced Cu/ZnO catalysts were used for CO2 hydrogenation to methanol and the structure–activity correlations were revealed by detailed characterization methods. Compared to the Cu/ZnO catalyst prepared by the conventional impregnation and coprecipitation methods and commercial Cu/ZnO, the Cu@ZIF-8 derived Cu/ZnO catalyst exhibited much higher space time yield (STY) of methanol. This facile mechanical grinding method sheds new light on the fast synthesis of MOF derived Cu-based catalysts applied in methanol synthesis from CO2 hydrogenation.
Results and discussion
Characterization of ZIF-8 and Cux@ZIF-8-y precursors
Fig. 1(a) exhibits XRD patterns of the synthesized ZIF-8 and Cux@ZIF-8-MeOH precursors with different Cu/(Cu + Zn) molar ratios. It was clear that the synthesized ZIF-8 was in accordance with simulated ZIF-8 (CCDC: 823083) and six diffraction peaks in the 2θ range of 5–20° were assigned to (011), (002), (112), (022), (013) and (222) planes,24 indicating that high crystallinity ZIF-8 was successfully synthesized via a facile mechanical grinding method. The Cux@ZIF-8-MeOH precursor displayed the same diffraction peaks as those of ZIF-8. However, the peak intensity decreased gradually with increasing Cu content, revealing that Cu doping had no obvious influence on crystal phases of ZIF-8 but decreased its crystallinity. As shown in Fig. 1(b), different types of alcohol such as ethanol and 1-propanol were also used to synthesize Cu0.5@ZIF-8-y. The as-prepared Cu0.5@ZIF-8-EtOH and Cu0.5@ZIF-8-PrOH exhibited the same diffraction peaks as those of Cu0.5@ZIF-8-MeOH.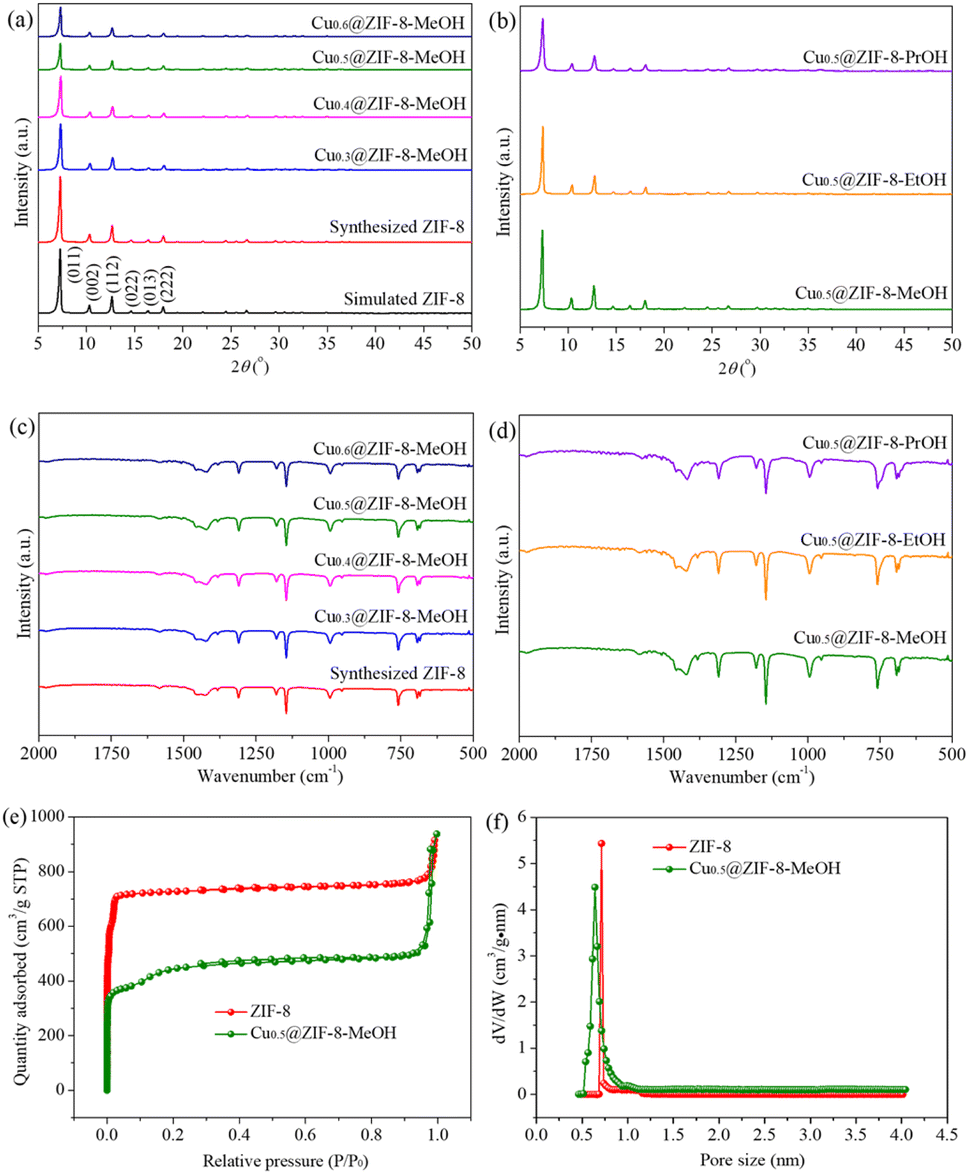 | ||
| Fig. 1 (a and c) XRD patterns and FT-IR spectra of the synthesized ZIF-8 and Cux@ZIF-8-MeOH precursors, where x represents the Cu/(Cu + Zn) molar ratio (x = 0.3, 0.4, 0.5, 0.6). (b and d) XRD patterns and FT-IR spectra of Cu0.5@ZIF-8-y precursors, where y represents different types of alcohol (y = MeOH, EtOH, PrOH). (e) N2 adsorption–desorption isotherms of ZIF-8 and Cu0.5@ZIF-8-MeOH precursors. (f) Pore size distribution of ZIF-8 and Cu0.5@ZIF-8-MeOH precursors. | ||
The formation of Cux@ZIF-8-y involved the coordination between the zinc atom and nitrogen atom on the imidazole ring, followed by the deprotonation of the imidazole ring producing 2-methylimidazole zinc salt. The organic linkers on the surface of ZIF-8 were partly dissolved in alcohol solvent and then Cu2+ penetrated into the ZIF-8 crystal and replaced Zn2+ to synthesize Cux@ZIF-8-y.29 During the grinding process, a small amount of alcohol acted as a structure directing agent and played an important role in the deprotonation of the imidazole ring.30 The alcohol with strong polarity promoted the deprotonation step, leading to the formation of high crystallinity Cux@ZIF-8-y. It is well-known that the polarity of alcohol decreased in the order of methanol > ethanol > 1-propanol. Therefore, Cu0.5@ZIF-8-MeOH exhibited the highest crystallinity, followed by Cu0.5@ZIF-8-EtOH and Cu0.5@ZIF-8-PrOH precursors.
FT-IR is applied to determine the functional groups of precursors. As in Fig. 1(c), the FT-IR spectrum of the synthesized ZIF-8 was consistent with that of ZIF-8 prepared by the conventional method and the wavenumber range of 800–1600 cm−1 had the characteristic vibration absorption peaks of the 2-methylimidazole organic ligand.29 Therefore, FT-IR further confirmed the formation of ZIF-8 crystals during the grinding process. The absorption peaks of Cux@ZIF-8-MeOH precursors with different Cu/(Cu + Zn) molar ratios were the same as those of ZIF-8, indicating that Cu doping did not change the functional groups of ZIF-8. As in Fig. 1(d), the absorption peaks of Cu0.5@ZIF-8-EtOH and Cu0.5@ZIF-8-PrOH were in accordance with those of Cu0.5@ZIF-8-MeOH, revealing that Cu0.5@ZIF-8-y precursors were successfully synthesized using a small amount of ethanol or 1-propanol as solvent, in good agreement with the previous XRD analysis.
Fig. 1(e) compares N2 adsorption–desorption isotherms of ZIF-8 and Cu0.5@ZIF-8-MeOH precursors. Type I hysteresis loops were observed, indicating that both of them were typical microporous materials. As in Fig. 1(f), ZIF-8 and Cu0.5@ZIF-8-MeOH displayed a narrow pore size distribution in the range of 0.5–1.0 nm. Table 1 summarizes specific surface area, average pore size and pore volume of ZIF-8 and Cu0.5@ZIF-8-MeOH precursors. Compared to ZIF-8, Cu0.5@ZIF-8-MeOH exhibited lower specific surface area, while both average pore size and pore volume remained almost unchanged, disclosing that Cu doping had no obvious influence on the pore structure but decreased the specific surface area.
| Precursors | Specific surface areaa (m2 g−1) | Average pore sizeb (nm) | Pore volumec (cm3 g−1) |
|---|---|---|---|
| a Calculated based on the Brunauer–Emmett–Teller (BET) method. b Calculated by the Horvath–Kawazoe (HK) method. c Total pore volume determined at P/P0 = 0.99. | |||
| ZIF-8 | 1932 | 0.72 | 1.40 |
| Cu0.5@ZIF-8-MeOH | 1470 | 0.65 | 1.39 |
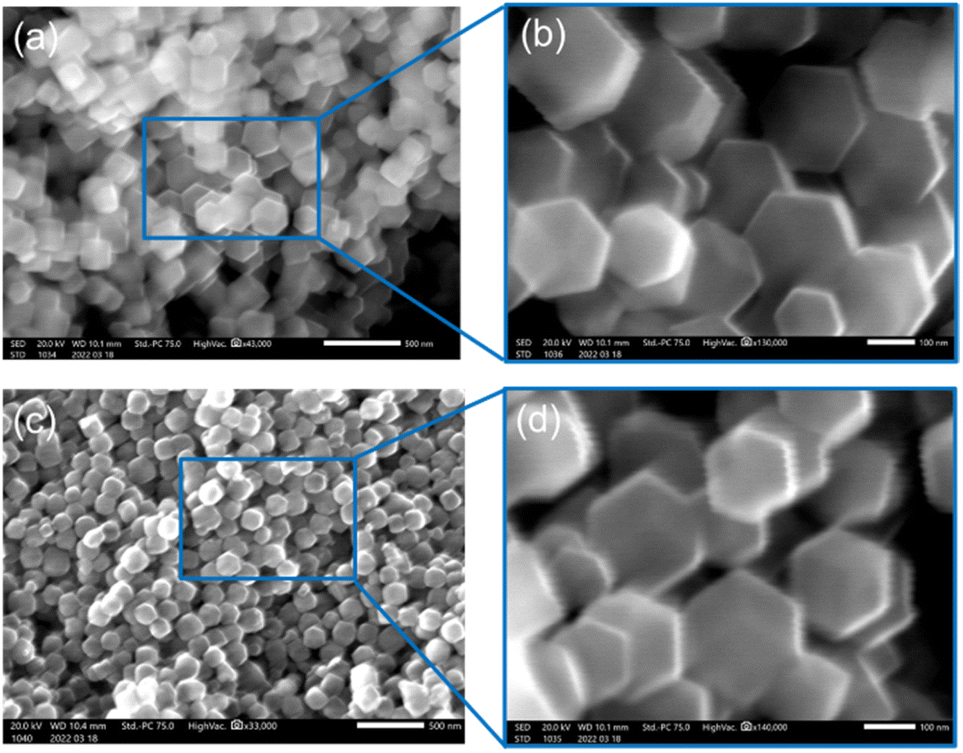
As in Fig. 2(a) and (b), ZIF-8 prepared by a mechanical grinding method displayed hexagonal shaped particles with uniform particle size distribution. The average particle size was about 160 nm. After in situ doping with Cu2+, the synthesized Cu0.5@ZIF-8-MeOH precursor inherited the original hexagonal morphology of ZIF-8 and the particle diameter remained almost the same, as exhibited in Fig. 2(c) and (d), indicating that Cu doping had no obvious influence on the ZIF-8 morphology.
 | ||
| Fig. 2 (a and b) SEM images of ZIF-8 with different magnification times. (c and d) SEM images of the Cu0.5@ZIF-8-MeOH precursor with different magnification times. | ||
The thermal decomposition performances of pure ZIF-8 and Cu0.3@ZIF-8-MeOH precursors were studied by TG under an air atmosphere. It was found that ZIF-8 was converted to ZnO at a temperature higher than 400 °C (Fig. S1†). The total weight loss for pure ZIF-8 reached 64.2%, almost in accordance with the theoretical calculation value (64.4%) of the conversion of ZIF-8 to ZnO.17 Interestingly, Cu doping damaged the thermal stability of ZIF-8, since the decomposition temperature of Cu0.3@ZIF-8-MeOH shifted to a lower temperature range.
Characterization of Cux@ZIF-8-y derived CuO/ZnO catalysts
CuO/ZnO catalysts were prepared by direct pyrolysis of Cux@ZIF-8-y precursors. As in Fig. 3(a) and (b), all calcined samples displayed typical CuO and ZnO phases, indicating that Cux@ZIF-8-y precursors decomposed completely after pyrolysis treatment. Table 2 summarizes crystallite sizes and specific surface area of the calcined catalysts. Although the Cu/(Cu + Zn) molar ratio was increased from 0.3 to 0.6, CuO and ZnO crystallite sizes maintained at 15 and 20 nm, respectively. When ethanol or 1-propanol was used as solvent during catalyst preparation, both CuO and ZnO crystallite sizes were still almost unchanged. These results disclosed that the Cu/(Cu + Zn) molar ratio and types of alcohol had negligible effect on the metal oxide crystallite sizes. Compared to CuO/ZnO catalysts derived from the conventional aurichalcite, zincian malachite or oxalate precursors in which CuO crystallite size increased obviously for Cu-rich catalysts while ZnO crystallite size raised clearly for Zn-rich samples,17,31 CuO/ZnO catalysts reported here displayed stable CuO and ZnO crystallite sizes, showing that MOF derived metal oxide catalysts had significant advantages in controlling crystallite sizes. Fig. S2† shows N2 adsorption–desorption isotherms of the calcined catalysts. The isotherms belong to the type IV curve with a H3 hysteresis loop, indicating the mesoporous structure of the calcined catalysts.32 The specific surface area was calculated based on adsorption–desorption data using the Brunauer–Emmett–Teller (BET) method. The specific surface area exhibited a volcanic shape by increasing the Cu/(Cu + Zn) molar ratio and decreased clearly with the increased carbon chain length of alcohol solvent. The CZ-0.5-C-MeOH catalyst showed the highest specific surface area of 35.6 m2 g−1. Table 2 also indicates that the real Cu/(Cu + Zn) molar ratio measured by XRF was consistent with the designed values.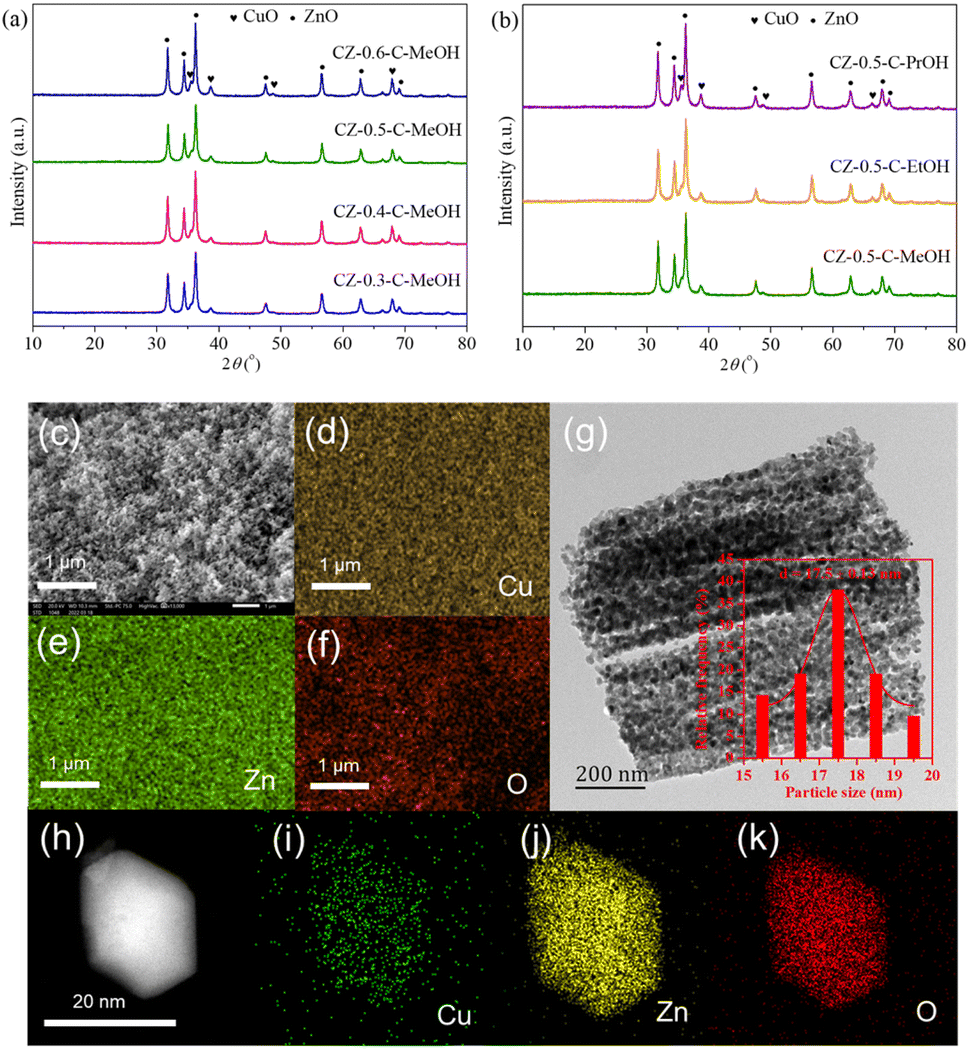 | ||
| Fig. 3 (a) XRD patterns of the calcined CZ-x-C-MeOH catalysts, where x represents the Cu/(Cu + Zn) molar ratio (x = 0.3, 0.4, 0.5, 0.6). (b) XRD patterns of the calcined CZ-0.5-C-y catalysts, where y represents different types of alcohol (y = MeOH, EtOH, PrOH). (c) SEM image, (d–f) EDS mapping (Cu, yellow; Zn, green; O, red) and (g) TEM image of the CZ-0.5-C-MeOH catalyst. (h) HAADF-STEM image and (i–k) EDS mapping of Cu (green), Zn (yellow) and O (red) for the CZ-0.5-C-MeOH catalyst. | ||
| Catalysts | Cu/(Cu + Zn) molar ratiob | Crystallite sizesc (nm) | Specific surface aread (m2 g−1) | |
|---|---|---|---|---|
| CuO | ZnO | |||
| a Prepared by the conventional impregnation method. b Determined by XRF. c Calculated using Scherrer's formula. d Calculated based on the Brunauer–Emmett–Teller (BET) method. | ||||
| CZ-0.3-C-MeOH | 0.29 | 15.1 | 19.7 | 30.6 |
| CZ-0.4-C-MeOH | 0.41 | 15.3 | 20.5 | 33.2 |
| CZ-0.5-C-MeOH | 0.50 | 15.5 | 19.9 | 35.6 |
| CZ-0.6-C-MeOH | 0.59 | 15.4 | 20.6 | 23.7 |
| CZ-0.5-C-EtOH | 0.49 | 15.2 | 19.6 | 34.5 |
| CZ-0.5-C-PrOH | 0.50 | 15.6 | 20.2 | 32.7 |
| CZ-0.5-C-IPa | 0.51 | 30.3 | 40.0 | 8.6 |
For comparison, we prepared a CuO/ZnO catalyst with equal Cu and Zn content by the conventional impregnation method (marked as CZ-0.5-C-IP). XRD patterns of CZ-0.5-C-MeOH and CZ-0.5-C-IP catalysts are compared in Fig. S3.†Table 2 compares crystallite sizes and specific surface area of CZ-0.5-C-IP samples. It was obvious that CZ-0.5-C-IP exhibited narrower CuO and ZnO diffraction peaks than CZ-0.5-C-MeOH, indicating that the CuO/ZnO catalyst prepared by the conventional impregnation method showed larger CuO and ZnO crystallite sizes. Moreover, the specific surface area of CZ-0.5-C-IP was only 8.6 m2 g−1, much lower than that of CZ-0.5-C-MeOH. For the impregnation method, the specific surface area of the CuO/ZnO catalyst decreased remarkably compared to the ZnO support (18.8 m2 g−1), since the impregnated copper covered most of the ZnO surface. It could be speculated that copper components on the surface of ZnO displayed poor dispersion and were also isolated from each other, leading to larger CuO crystallite size and weak CuO–ZnO interaction in the calcined catalyst. In contrast, the Cux@ZIF-8-y precursor had ultra-high specific surface area (Table 1), which provided more solid surface for the dispersion of copper components. Meanwhile, Zn2+ was replaced by Cu2+ during the synthesis of Cux@ZIF-8-y, implying that Cu2+ was encapsulated into ZIF-8 cages and connected via the organic ligand. Accordingly, Cux@ZIF-8-y derived CuO/ZnO catalysts had higher copper component dispersion, resulting in the formation of smaller CuO crystallite size and the exposure of more CuO–ZnO interface.
Fig. 3(c)–(f) display the SEM image and EDS mapping of the CZ-0.5-C-MeOH catalyst. CZ-0.5-C-MeOH showed uniform particles with numerous uniform pores, which was attributed to the major contribution of ZIF-8 to the porous structure of the calcined catalyst.26 EDS mapping clearly revealed that Cu and Zn components were distributed homogeneously. The TEM image (Fig. 3(g)) shows that the average particle size was 17.5 ± 0.13 nm with a narrow particle size distribution for the CZ-0.5-C-MeOH catalyst, which was close to the values calculated using Scherrer's formula. Fig. 3(h) exhibits the HAADF-STEM image of the CZ-0.5-C-MeOH catalyst. The calcined sample inherited the original hexagonal morphology of the Cu0.5@ZIF-8-MeOH precursor. EDS mapping (Fig. 3(i)–(k)) shows that the Cu element is distributed uniformly on the surface of the catalyst. Therefore, SEM-EDS and STEM-EDS demonstrated uniform CuO distribution of the CZ-0.5-C-MeOH catalyst with equal amounts of Cu and Zn. The HR-TEM image (Fig. S4†) of the CZ-0.5-C-MeOH sample exhibited lattice spacings of 0.23, 0.25 and 0.28 nm, which were assigned to CuO(111), ZnO(101) and ZnO(100) planes, respectively. In CZ-0.5-C-MeOH, a porous structure was formed with interlaced CuO and ZnO particles, wherein ZnO particles acted as spacers to separate CuO particles. Besides, CuO particles were partly embedded into the ZnO matrix, leading to close interface contact between CuO and ZnO. Therefore, it was deduced that the CZ-0.5-C-MeOH catalyst had strong CuO–ZnO interaction and exposed more CuO–ZnO interfaces, which promoted the reduction of CuO and prevented the agglomeration of CuO particles, resulting in the generation of smaller metallic Cu particles, higher Cu0 surface area and Cu dispersion in the reduced catalysts. For comparison, Fig. S5† exhibits the SEM image of the CZ-0.5-C-IP catalyst prepared by the conventional impregnation method. CZ-0.5-C-IP displayed both highly dispersed and bulk metal oxide particles on the surface. The particles were seriously agglomerated with uneven distribution. The average particle size of CZ-0.5-C-IP was much higher than that of CZ-0.5-C-MeOH. Moreover, metal oxide particles were isolated from each other, resulting in weak CuO–ZnO interaction and poor CuO dispersion, in accordance with our previous discussion. Therefore, SEM and HR-TEM analysis clearly disclosed that the MOF derived CZ-0.5-C-MeOH catalyst had uniform particle size distribution and an intimate CuO/ZnO interface contact.
The reducibility of the calcined catalysts was evaluated by H2-TPR analysis. As in Fig. 4(a), CZ-x-C-MeOH catalysts with different Cu/(Cu + Zn) molar ratios displayed a single reduction peak, which was assigned to the reduction of CuO to metallic Cu because ZnO was irreducible under the conditions studied.33 In comparison to other catalysts with more Cu or Zn content, CuO particles on the CZ-0.5-C-MeOH catalyst with equal amounts of Cu and Zn were much easier to reduce as evidenced by the shift of the reduction peak to a lower temperature range. Fig. 4(b) shows that the reducibility of CuO was different relying on the types of alcohol during the grinding process. The reduction temperature of CZ-0.5-C-PrOH was the highest, followed by CZ-0.5-C-EtOH and CZ-0.5-C-MeOH, which displayed a reverse variation tendency compared to that of specific surface area. These three catalysts had the same Cu/(Cu + Zn) molar ratio and similar CuO crystallite size (Table 2). Therefore, the specific surface area had a remarkable influence on CuO dispersion. Higher specific surface area resulted in greater CuO dispersion, which boosted the reduction of CuO, making the reduction peak shift to a lower temperature range.
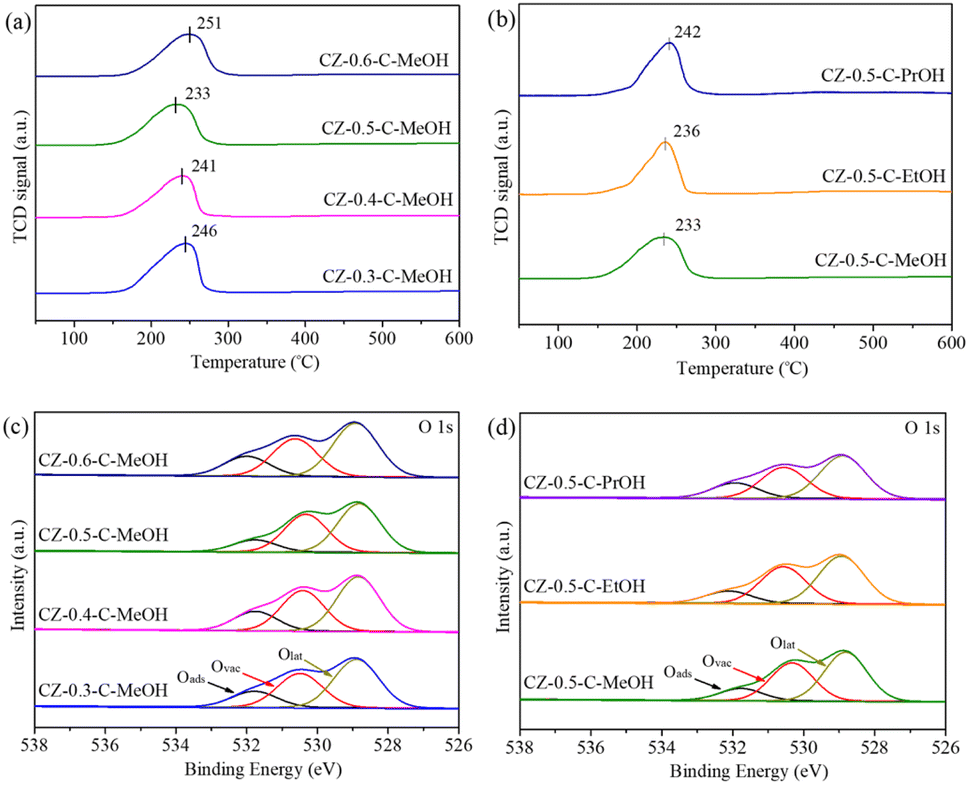 | ||
| Fig. 4 (a and c) H2-TPR profiles and O 1s XPS spectra of the calcined CZ-x-C-MeOH catalysts, where x represents the Cu/(Cu + Zn) molar ratio (x = 0.3, 0.4, 0.5, 0.6). (b and d) H2-TPR profiles and O 1s XPS spectra of the calcined CZ-0.5-C-y catalysts, where y represents different types of alcohol (y = MeOH, EtOH, PrOH). | ||
H2-TPR profiles of CZ-0.5-C-MeOH and CZ-0.5-C-IP catalysts are compared in Fig. S6.† The CZ-0.5-C-IP catalyst showed a broad reduction peak in the temperature range of 50–600 °C, which was deconvoluted into two Gaussian peaks, suggesting that CuO species were mixed in two morphologies including highly dispersed CuO and isolated CuO particles,34 in good agreement with the SEM image (Fig. S5†). It was obvious that the reduction temperature of CZ-0.5-C-IP was much higher than that of CZ-0.5-C-MeOH. On the one hand, CZ-0.5-C-MeOH had much smaller crystallite sizes and much higher specific surface area in comparison to CZ-0.5-C-IP, as displayed in Table 2. On the other hand, CZ-0.5-C-MeOH had more homogeneous CuO particle distribution, as confirmed by the former SEM and HR-TEM analysis. These factors in turn promoted the reduction of CuO, leading to a shift of the reduction peak to a lower temperature range.
XPS is used to identify the surface chemical states of the calcined catalysts. Fig. S7(a) and (b)† display Cu 2p and Zn 2p spectra of the calcined catalysts. The corresponding XPS parameters are summarized in Table S1.† As in Fig. S7(a),† there existed four Cu 2p XPS peaks. The peaks in the binding energy range of 932.7–932.9 eV and 953.2–953.3 eV were assigned to Cu 2p3/2 and Cu 2p1/2, respectively.35 The other two peaks located at 941.5 eV and 961.6 eV were the satellite peaks of Cu 2p3/2 and Cu 2p1/2. These features were consistent with those of CuO.36 As in Fig. S7(b),† two Zn 2p XPS peaks observed in the binding energy range of 1021.7–1021.8 eV and 1044.7–1044.9 eV were attributed to Zn 2p3/2 and Zn 2p1/2, indicating the presence of ZnO.37 Therefore, Cu 2p and Zn 2p XPS analyses clearly revealed that MOF precursors were decomposed to CuO and ZnO phases completely after pyrolysis treatment, in good agreement with the previous XRD analysis.
O 1s XPS spectra of the calcined catalysts are compared in Fig. 4(c) and (d). There existed a broad peak in the binding energy range of 538–526 eV, which was divided into three Gaussian peaks including the adsorbed oxygen (Oads), the oxygen vacancy (Ovac) and the lattice oxygen (Olat).38 The Ovac/Olat ratio, which could reflect the amount of oxygen vacancies on the catalyst surface, was calculated and listed in Table S1.† It was found that the Ovac/Olat ratio depended on the Cu/(Cu + Zn) molar ratio and types of alcohol, disclosing that both of them were important factors influencing the surface oxygen vacancy. The Ovac/Olat ratio increased in the following sequence: CZ-0.6-C-MeOH < CZ-0.3-C-MeOH < CZ-0.5-C-PrOH < CZ-0.4-C-MeOH < CZ-0.5-C-EtOH < CZ-0.5-C-MeOH, which showed a contrary change trend in comparison to that of maximum reduction temperature according to H2-TPR analysis (Fig. 4(a) and (b)). This suggested that more oxygen vacancies on the calcined catalysts led to the shift of the reduction peak to a lower temperature range. It has been reported that the increased amount of oxygen vacancies was favorable for charge transfer and electron rearrangement, which tuned electronic interaction between vacancy sites on ZnO and CuO, resulting in strong CuO–ZnO interaction.39 For CuO/ZnO catalysts, ZnO acted as a hydrogen reservoir and strong CuO–ZnO interaction resulted in the migration of more atomic hydrogen to the CuO surface, promoting the reduction of CuO.27,40
Characterization of the reduced Cu/ZnO catalysts
Fig. 5(a) and (b) exhibit XRD patterns of the reduced catalysts. Only metallic Cu and ZnO phases were observed for all the reduced samples. Cu 2p and Zn 2p XPS spectra of the reduced catalysts are displayed in Fig. S8(a) and (b).† Cu 2p spectra consisted of two peaks at about 932 and 952 eV which were mainly attributed to Cu 2p3/2 and Cu 2p1/2 of Cu0, respectively.41 The absence of Cu 2p satellite peaks disclosed that Cu2+ species were reduced to lower valence states (Cu0 or Cu+) after reduction at 260 °C. Because Cu0 and Cu+ have similar binding energy, it is difficult to identify them only via Cu 2p XPS spectra. Therefore, Cu LMM spectra were collected and are displayed in Fig. S9.† It was observed that all samples showed a single peak at a kinetic energy of 918.7 eV, which was assigned to Cu0, confirming that copper species are present as metallic Cu in the reduced catalysts.42 In addition, the Zn 2p3/2 and Zn 2p1/2 peaks at around 1021 and 1045 eV were assigned to Zn2+ species on the catalyst surface, revealing that Zn was still present as ZnO even after reduction. XPS analysis was in good agreement with the XRD results. The crystallite sizes are summarized in Table 3. Cu and ZnO crystallite sizes first decreased by increasing the Cu/(Cu + Zn) molar ratio, reaching the minimum values for the CZ-0.5-R-MeOH catalyst and then increased clearly by further enhancing the Cu/(Cu + Zn) molar ratio to 0.6. When the Cu/(Cu + Zn) molar ratio was set at 0.5, the crystallite sizes increased obviously with the extension of carbon chain length of alcohols. Cu0 surface area and Cu dispersion displayed a reverse variation trend compared to Cu crystallite size, indicating that smaller Cu crystallite size was favorable for obtaining higher Cu0 surface area and Cu dispersion. Among all the samples, CZ-0.5-R-MeOH showed the highest Cu0 surface area (9.0 m2 g−1) and Cu dispersion (3.1%).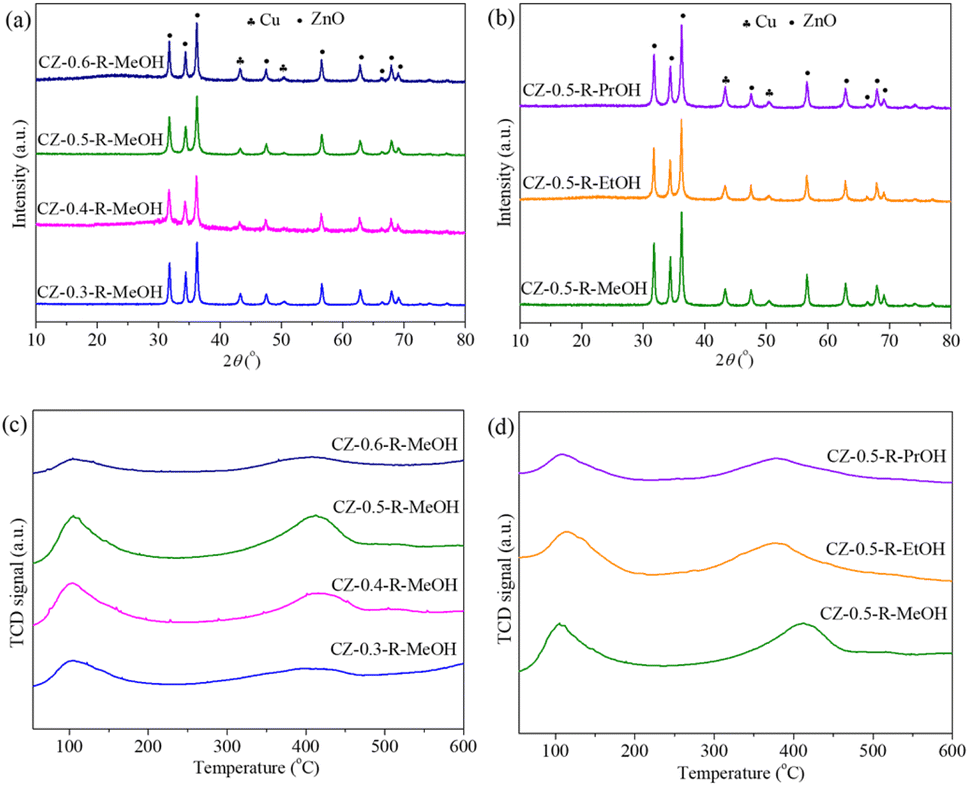 | ||
| Fig. 5 (a and c) XRD patterns and CO2-TPD profiles of the reduced CZ-x-R-MeOH catalysts, where x represents the Cu/(Cu + Zn) molar ratio (x = 0.3, 0.4, 0.5, 0.6). (b and d) XRD patterns and CO2-TPD profiles of the reduced CZ-0.5-R-y catalysts, where y represents different alcohols (y = MeOH, EtOH, PrOH). | ||
| Catalysts | Crystallite sizesb (nm) | Cu0 surface areac (m2 g−1) | Cu dispersionc (%) | |
|---|---|---|---|---|
| Cu | ZnO | |||
| a Prepared by the conventional impregnation method. b Calculated using Scherrer's formula. c Measured by the N2O chemisorption method. | ||||
| CZ-0.3-R-MeOH | 17.8 | 25.0 | 4.1 | 2.7 |
| CZ-0.4-R-MeOH | 16.5 | 23.0 | 6.3 | 2.9 |
| CZ-0.5-R-MeOH | 15.5 | 21.4 | 9.0 | 3.1 |
| CZ-0.6-R-MeOH | 18.4 | 26.1 | 2.6 | 0.9 |
| CZ-0.5-R-EtOH | 15.7 | 21.7 | 7.5 | 3.0 |
| CZ-0.5-R-PrOH | 17.1 | 24.6 | 5.4 | 2.8 |
| CZ-0.5-R-IPa | 23.9 | 34.1 | 1.6 | 0.5 |
The specific surface area and the reducibility of CuO and CuO–ZnO interaction had remarkable influences on the textural properties of the reduced catalysts. As in Table 2, all the calcined catalysts displayed similar CuO and ZnO crystallite sizes. Therefore, higher specific surface area resulted in higher CuO and ZnO dispersion, which prevented the agglomeration of CuO and ZnO particles during the reduction process, leading to the generation of smaller Cu and ZnO crystallite sizes in the reduced catalysts. In addition, strong CuO–ZnO interaction improved the reducibility of CuO, which made CuO particles able to be reduced at lower temperature, leading to higher Cu0 surface area and Cu dispersion. According to H2-TPR analysis, CuO particles in the CZ-0.5-C-MeOH catalyst were much easier to reduce compared to those in other samples. Furthermore, CZ-0.5-C-MeOH had higher specific surface area and stronger CuO–ZnO interaction, as confirmed in Table 2 and HR-TEM in Fig. S4.† Hence, the reduced CZ-0.5-R-MeOH catalyst exhibited smaller crystallite sizes, higher Cu0 surface area and Cu dispersion.
XRD patterns of the CZ-0.5-R-MeOH catalyst and the reduced Cu/ZnO catalyst synthesized by the conventional impregnation method (marked as CZ-0.5-R-IP) are compared in Fig. S10.† It was clear that CZ-0.5-R-IP exhibited much narrower Cu and ZnO diffraction peaks than CZ-0.5-R-MeOH. As in Table 3, CZ-0.5-R-IP displayed much larger Cu crystallite sizes and much lower Cu0 surface area and Cu dispersion compared to CZ-0.5-R-MeOH. As discussed above, the calcined CZ-0.5-C-MeOH exhibited much higher CuO dispersion because of higher specific surface area and smaller CuO crystallite size. Therefore, the CZ-0.5-R-MeOH catalyst after reduction maintained smaller Cu crystallite size, higher Cu0 surface area and Cu dispersion. Most of the researchers proposed that Cu0 species were active sites for CO2 hydrogenation to methanol and higher Cu0 surface area provided more active sites.43 It has also been reported that the decreased Cu and ZnO crystallite sizes favored the inverse hydrogen spillover from ZnO to Cu, promoting CO2 hydrogenation to methanol.27 Hence, CZ-0.5-R-MeOH exhibited higher catalytic activity than CZ-0.5-R-IP.
The surface basicity of the reduced catalysts was determined by CO2-TPD. The TPD profiles are shown in Fig. 5(c) and (d). CO2 desorption from all samples displayed a broad peak in the temperature range from 50 to 600 °C. The peak at low temperature represented the CO2 desorption from weakly basic sites related to the surface hydroxyl groups, while the peak at high temperature denoted the CO2 desorption from moderately basic sites, which were associated with metal–oxygen pairs such as Zn–O.44 The change in the Cu/(Cu + Zn) molar ratio did not influence the strength between CO2 molecules and the catalyst surface since the desorption peak is located at identical temperatures. However, the strength became weaker when methanol was changed to ethanol or 1-propanol during catalyst preparation, owing to the movement of the desorption peak to a lower temperature range. The variation in the number of weakly and moderately basic sites was clearly observed. As in Table 4, the number of weakly basic sites increased as the Cu/(Cu + Zn) molar ratio increased from 0.3 to 0.5 and then decreased remarkably. When the Cu/(Cu + Zn) molar ratio was fixed at 0.5, it decreased gradually by increasing the carbon chain length of alcohol. Similar trends were also observed for the number of moderately basic sites and total number of basic sites. In addition, the change tendency in the number of weakly and moderately basic sites was consistent with that of specific surface area of the calcined catalysts (Table 2). Considering similar CuO and ZnO crystallite sizes, the increased specific surface area improved the active component dispersion in the reduced catalysts as evidenced by N2O chemisorption analysis, which resulted in better contact between CO2 and active components, facilitating CO2 adsorption on the catalyst surface.33Table 4 also summarizes the proportion of single basic sites to total basic sites. It was found that the change in the proportion of moderately basic sites to total basic sites was in accordance with that of the number of moderately basic sites, while a contrary trend was observed for the weakly basic sites.
| Catalysts | Number of basic sites and contributionb (mmol g−1) | Total number of basic sites (mmol g−1) | |
|---|---|---|---|
| Weakly basic sites | Moderately basic sites | ||
| a Prepared by the conventional impregnation method. b The value in the parentheses is the proportion of single basic sites to total basic sites. | |||
| CZ-0.3-R-MeOH | 0.036 (64.3) | 0.020 (35.7) | 0.056 |
| CZ-0.4-R-MeOH | 0.061 (53.0) | 0.054 (47.0) | 0.115 |
| CZ-0.5-R-MeOH | 0.084 (38.7) | 0.133 (61.3) | 0.217 |
| CZ-0.6-R-MeOH | 0.015 (71.4) | 0.006 (28.6) | 0.021 |
| CZ-0.5-R-EtOH | 0.073 (42.9) | 0.097 (57.1) | 0.170 |
| CZ-0.5-R-PrOH | 0.050 (56.2) | 0.039 (43.8) | 0.089 |
| CZ-0.5-R-IPa | 0.007 (87.5) | 0.001 (12.5) | 0.008 |
CO2-TPD profiles of CZ-0.5-R-MeOH and CZ-0.5-R-IP catalysts are compared in Fig. S11.† It was clear that the desorption peak of CZ-0.5-R-IP shifted to a lower temperature range compared to that of CZ-0.5-R-MeOH, revealing the weak adsorption strength between CO2 molecules and the catalyst surface. This also suggested the lower interfacial contact between Cu and ZnO.33 Besides, the number of moderately basic sites on CZ-0.5-R-IP was much lower than that on CZ-0.5-R-MeOH (Table 4). These two catalysts had the same Cu and Zn content. For the CZ-0.5-R-IP catalyst prepared by the conventional impregnation method, the impregnated copper covered most of the ZnO surface as verified by markedly decreased specific surface area in comparison to that of the ZnO support, which might be unfavorable for exposing more Cu–ZnO interface that was responsible for adsorbing CO2, resulting in fewer moderately basic sites. In contrast, Cu2+ was encapsulated into ZIF-8 cages for the Cux@ZIF-8-y precursor. Therefore, Cux@ZIF-8-y derived Cu/ZnO catalysts had an intimate Cu–ZnO interfacial contact, high specific surface area and Cu dispersion, leading to a higher number of moderately basic sites on the catalyst surface.
Fig. S12† exhibits CO2-TPD profiles of CZ-0.5-R-MeOH and CZ-0.5-R-CP catalysts. Compared to CZ-0.5-R-CP, the desorption peak of CZ-0.5-R-MeOH shifted to a higher temperature range, indicating stronger CO2 adsorption strength on the catalyst surface. The total basic site amounts of both catalysts were almost the same, but the basic site distribution was different relying on preparation methods (Table S2†). The proportion of weakly basic sites to total basic sites of CZ-0.5-R-CP was higher than that of CZ-0.5-R-MeOH, but the proportion of moderately basic sites to total basic sites was lower than that of CZ-0.5-R-MeOH. A higher proportion of moderately basic sites to total basic sites was beneficial for obtaining higher methanol selectivity (Fig. 7(b)). Hence, CZ-0.5-R-MeOH displayed higher methanol selectivity compared to the CZ-0.5-R-CP catalyst prepared by the conventional coprecipitation method (Fig. S14†).
H2-TPD profiles of CZ-x-R-MeOH catalysts with varied Cu/(Cu + Zn) molar ratios are compared in Fig. S13.† All of the catalysts displayed a single desorption peak in the temperature range of 250–400 °C, which was derived from the atomic hydrogen on the Cu0 surface.45 The desorbed H2 amount is calculated based on the peak area and is listed in Table S3.† The desorbed H2 amount of the CZ-0.5-R-MeOH catalyst was highest, followed by CZ-0.4-R-MeOH, CZ-0.3-R-MeOH and CZ-0.6-R-MeOH catalysts, which was consistent with the variation of the exposed Cu0 surface area, suggesting that Cu0 active sites are the primary sites for hydrogen dissociation.
Catalytic activity and structure–activity relationships
Cu/ZnO is one of the efficient catalysts that has been widely used for methanol synthesis. It is generally accepted that the operation temperature, pressure and GHSV are in the range of 180–280 °C, 2.5–10.0 MPa and 2000–24000 h−1.46 High temperature (>300 °C) led to the sintering of copper nanoparticles due to lower Tammann temperature of copper,47 while high pressure resulted in high equipment costs. There are many studies paying attention to high-temperature methanol synthesis, but methanol synthesis at low temperature lacks a deep study. The aim of this work is to explore MOF derived Cu/ZnO for low-temperature methanol synthesis. Hence, we select a relatively low reaction temperature of 200 °C, a moderate reaction pressure and a GHSV of 5.0 MPa and 6000 mL gcat−1 h−1 as the reaction conditions.Methanol synthesis from CO2 hydrogenation to methanol was performed in a continuous fixed-bed reactor. Fig. 6(a) and (b) compare catalytic activity of Cux@ZIF-8-MeOH derived CZ-x-R-MeOH catalysts at 200 °C. CO2 conversion, methanol selectivity and space time yield (STY) of methanol increased by increasing the Cu/(Cu + Zn) molar ratio, attaining maximum values (9.0%, 69.5% and 128.7 g kgcat−1 h−1) for the CZ-0.5-R-MeOH catalyst and then decreasing clearly. Meanwhile, a contrary variation trend was observed for CO selectivity. These results indicated that the optimum Cu/(Cu + Zn) molar ratio was 0.5 for CO2 hydrogenation to methanol. The CZ-0.6-R-MeOH catalyst with excessive Cu content was unfavorable for methanol synthesis due to lower Cu0 surface area and larger Cu crystallite size (Table 3).
 | ||
| Fig. 6 (a and b) Effect of the Cu/(Cu + Zn) molar ratio on the catalytic activity of CZ-x-R-MeOH (x = 0.3, 0.4, 0.5, 0.6) catalysts. (c) Effect of alcohol types during catalyst preparation on the catalytic activity of CZ-0.5-R-y (y = MeOH, EtOH, PrOH) catalysts. (d) Catalytic activity comparison of the Cu0.5@ZIF-8-MeOH derived CZ-0.5-R-MeOH catalyst and catalyst prepared by the conventional impregnation method. Reaction conditions: catalyst weight = 0.25 g, reaction temperature = 200 °C, reaction pressure = 5.0 MPa, GHSV = 6000 mL gcat−1 h−1, feed gas: Ar/CO2/H2 = 4/24/72. | ||
Fig. 6(c) compares catalytic activity of CZ-0.5-R-y samples with a fixed Cu/(Cu + Zn) molar ratio but varied alcohol types during catalyst preparation. It was clear that CO2 conversion and STY of methanol decreased by extending carbon chain length of alcohols. Besides, methanol selectivity of CZ-0.5-R-MeOH was higher than that of CZ-0.5-R-EtOH and CZ-0.5-R-PrOH. These results indicated that methanol was an optimal alcohol for catalyst preparation via the mechanical grinding method. The catalytic performances of CZ-0.5-R-MeOH and CZ-0.5-R-IP catalysts are compared in Fig. 6(d). Methanol selectivity of CZ-0.5-R-MeOH attained 69.5%, higher than that of CZ-0.5-R-IP (42.6%). Meanwhile, STY of methanol of CZ-0.5-R-MeOH reached 128.7 g kgcat−1 h−1, six times higher than that of CZ-0.5-R-IP (21 g kgcat−1 h−1). CZ-0.5-R-MeOH also exhibited higher methanol selectivity and STY than the CZ-0.5-R-CP catalyst prepared by the conventional coprecipitation method (Fig. S14†). Therefore, metal organic framework (MOF) derived Cu/ZnO catalysts displayed excellent catalytic activity compared to Cu/ZnO catalysts prepared by the conventional impregnation and coprecipitation methods.
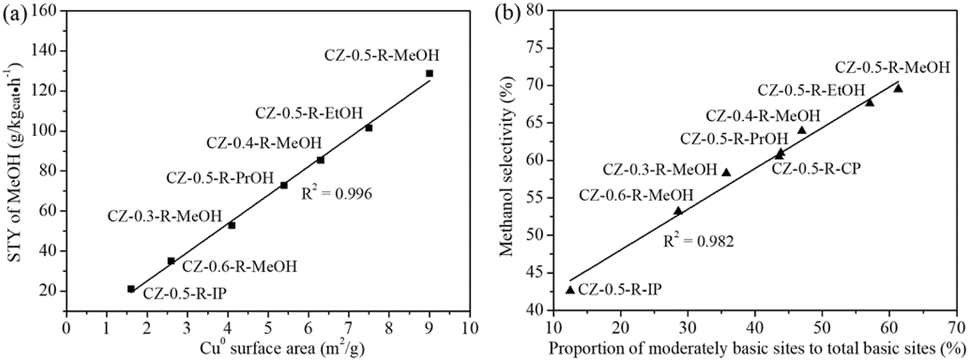
Based on the above experimental and characterization results, we tried to reveal the structure–activity relationships for CO2 hydrogenation to methanol. As in Fig. 7(a), it was apparent that STY of methanol was proportional to Cu0 surface area, providing clear evidence that metallic Cu was one of the critical factors influencing methanol synthesis. Previous studies proposed that dual active sites were involved in CO2 hydrogenation to methanol over binary Cu-based catalysts.48,49 The adsorption and dissociation of hydrogen took place on Cu0 active sites, while ZnO sites were mainly responsible for CO2 adsorption. The dissociated hydrogen transferred from the Cu surface onto the ZnO surface via spillover and hydrogenated the surface carbon-containing intermediates to produce methanol. Therefore, larger Cu0 surface area would promote the formation of atomic hydrogen on the Cu surface and accelerate the subsequent hydrogenation reaction, leading to the increased STY of methanol. Fig. 7(b) discloses that there existed a linear correlation between methanol selectivity and the proportion of moderately basic sites to total basic sites, indicating that moderately basic sites played an important role in controlling methanol selectivity. MOFs derived Cu/ZnO catalyst with a Cu/(Cu + Zn) molar ratio of 0.5 (CZ-0.5-R-MeOH, CZ-0.5-R-EtOH and CZ-0.5-R-PrOH) exhibited higher methanol selectivity than Cu/ZnO catalysts prepared by the conventional coprecipitation (CZ-0.5-R-CP) and impregnation (CZ-0.5-R-IP) methods with the same molar ratio, revealing that CO2 was more inclined to be converted to methanol on Cu/ZnO catalysts derived from MOF precursors. Formaldehyde (H2CO*) was a key intermediate in the reaction route where H2CO* either hydrogenated to methanol or decomposed to CO as a by-product.44 Compared to H2CO* species adsorbed on weakly basic sites, those adsorbed on moderately basic sites preferred to be converted to methanol via hydrogenation rather than to generate CO through dissociation. Therefore, a higher proportion of moderately basic sites to total basic sites led to higher methanol selectivity.
 | ||
| Fig. 7 Structure–performance relationships for methanol synthesis from CO2 hydrogenation. (a) Space time yield (STY) of methanol versus Cu0 surface area. (b) Methanol selectivity versus the proportion of moderately basic sites to total basic sites. Reaction conditions: catalyst weight = 0.25 g, reaction temperature = 200 °C, reaction pressure = 5.0 MPa, GHSV = 6000 mL gcat−1 h−1, feed gas: Ar/CO2/H2 = 4/24/72. | ||
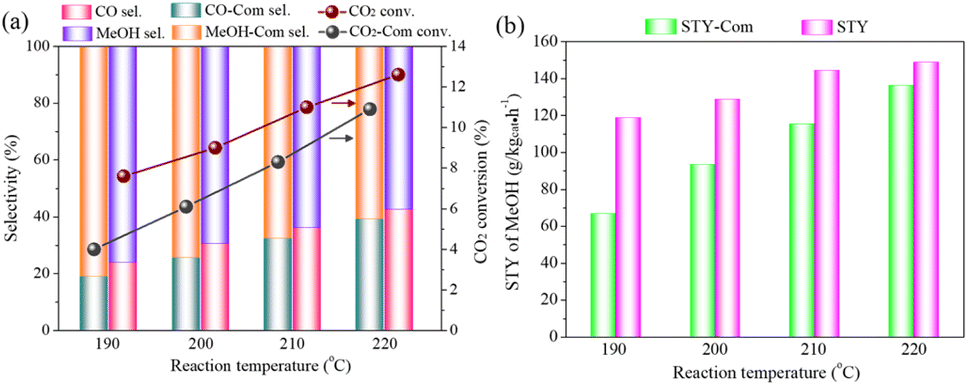
Fig. 8(a) and (b) compare catalytic activity of the CZ-0.5-R-MeOH catalyst and the commercial Cu/ZnO catalyst at different reaction temperatures. CO2 conversion and STY of methanol were only 4.0% and 66.7 g kgcat−1 h−1 at 190 °C for the commercial Cu/ZnO catalyst. The methanol selectivity reached 81.1%, since low temperature suppressed the competitive reverse water–gas shift (RWGS) reaction. Compared to the commercial Cu/ZnO catalyst, CO2 conversion and STY of methanol attained 7.5% and 118.8 g kgcat−1 h−1 at 190 °C for the CZ-0.5-R-MeOH catalyst. Similar results were also observed at reaction temperatures of 200, 210 and 220 °C, confirming that the CZ-0.5-R-MeOH catalyst showed higher methanol synthesis efficiency in comparison to the commercial Cu/ZnO catalyst. These existed a negative relationship between CO2 conversion and methanol selectivity for both catalysts (Fig. S15†), owing to the acceleration of the endothermic RWGS reaction at high temperature.50
 | ||
| Fig. 8 (a and b) Catalytic activity comparison of the CZ-0.5-R-MeOH catalyst and the commercial Cu/ZnO catalyst at different reaction temperatures. The labels for catalytic performance of the commercial Cu/ZnO catalyst are distinguished by “Com”. Reaction conditions: catalyst weight = 0.25 g, reaction pressure = 5.0 MPa, GHSV = 6000 mL gcat−1 h−1, feed gas: Ar/CO2/H2 = 4/24/72. | ||
Table S4† compares catalytic activity between the MOF derived CZ-0.5-R-MeOH catalyst and previously reported catalysts with similar Cu/Zn compositions but different preparation methods. It was found that the MOF derived CZ-0.5-R-MeOH catalyst displayed higher STY of methanol than Cu-based catalysts with a similar Cu/Zn molar ratio prepared by conventional methods.
Catalyst stability test
The time-on-stream test was performed to examine the long-term stability of the CZ-0.5-R-MeOH catalyst. As in Fig. 9, CO2 conversion remained at 9.0% with a methanol and CO selectivity of 69.5% and 30.5% without any deactivation even after 150 h of reaction, indicating that the CZ-0.5-R-MeOH catalyst exhibited excellent stability for CO2 hydrogenation to methanol. After the stability test, the CZ-0.5-R-MeOH catalyst was cooled down under N2 protection and afterwards carefully collected for further characterization. XRD patterns in Fig. S16† disclose that the crystal phases of the CZ-0.5-R-MeOH catalyst remained unchanged before and after 150 h of reaction. Besides, Cu crystallite size calculated based on Scherrer's formula was 15.5 nm for the fresh catalyst and 15.9 nm for the spent catalyst. The Cu dispersion results for the CZ-0.5-R-MeOH catalyst before and after stability testing are shown in Table S5.† It was obvious that both Cu0 surface area and Cu dispersion remained nearly unchanged even after stability testing, revealing that the active metallic Cu species retained stability even after the long-term reaction. SEM images in Fig. S17(a) and (b)† show that the surface morphology of the fresh and the spent CZ-0.5-R-MeOH catalysts remained nearly unchanged, containing both sphere-like and sheet-like particles with uniform particle size distribution. All of the above analyses confirmed the outstanding stability of the MOF derived CZ-0.5-R-MeOH catalyst for CO2 hydrogenation to methanol.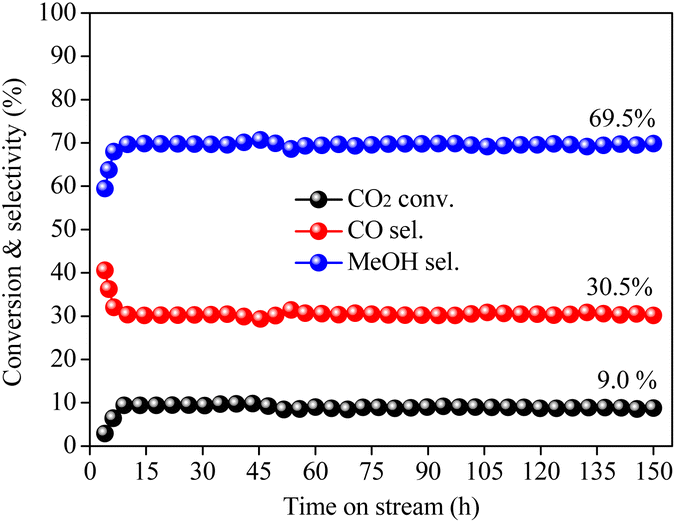 | ||
| Fig. 9 Stability test of the CZ-0.5-R-MeOH catalyst for CO2 hydrogenation to methanol. Reaction conditions: catalyst weight = 0.25 g, reaction temperature = 200 °C, reaction pressure = 5.0 MPa, GHSV = 6000 mL gcat−1 h−1, feed gas: Ar/CO2/H2 = 4/24/72. | ||
Study on the reaction mechanism
In situ DRIFTS was used to study the reaction mechanism of CO2 hydrogenation to methanol on the CZ-0.5-R-MeOH catalyst. After He purge and H2 pretreatment, IR spectra in the wavenumber range of 3200–2700 cm−1 (Fig. 10(a)) and 1700–800 cm−1 (Fig. 10(b)) were collected under a CO2/H2 (H2/CO2 = 3) atmosphere at 220 °C and 0.1 MPa. The vibration band assignment for the surface species is listed in Table S6.† The bands located at 1587 and 1370 cm−1 were assigned to asymmetric and symmetric O–C–O vibrations of formate species (HCOO*).51–53 The IR band of C–H deformation vibration of methoxy groups (H3CO*) was found at 1440 cm−1, while the C–O (1056, 1030 and 1008 cm−1) and C–H (2975, 2920, and 2840 cm−1) stretching vibration bands were also observed, indicating the formation of methanol.52,54,55 After the reaction proceeded for 5 min, typical vibration bands corresponding to formate species appeared, disclosing that the generation of formate species was very fast when the reduced catalyst was exposed to CO2/H2 mixture gas. The intensity of methanol vibration bands increased slowly at the beginning of the reaction and reached the steady state after the reaction was performed for 25 min. This indicated that methanol formation needs an induction period, since the stepwise hydrogenation of formate species produced methoxy and finally the methanol product. It should be noted that the carbonate species, which was also considered as an intermediate observed by in situ DRIFTS under lower pressure, was absent on the present catalyst, probably due to the rapid reaction of carbonate species with H2 to form stable formate species.53In situ DFIFTS indicated that CO2 hydrogenation to methanol on the CZ-0.5-R-MeOH catalyst obeys the formate pathway in which formate species hydrogenation is the key reaction step. | ||
| Fig. 10 In situ DRIFT spectra of CO2 hydrogenation to methanol on the CZ-0.5-R-MeOH catalyst at 220 °C and 0.1 MPa in the wavenumber range of (a) 3200–2700 cm−1 and (b) 1700–800 cm−1. | ||
Recently, progress has been made to identify the reaction intermediate, especially in the Cu-based catalyst system by combined in situ characterization technology and theoretical calculations. Up to now, three reaction pathways have been proposed for methanol synthesis, including the formate pathway, reverse water–gas shift (RWGS) followed by the CO hydrogenation pathway and the trans-COOH pathway.46,56 Different catalyst supports and reaction conditions show obvious influences on intermediate formation. Most of the studies favor the formate pathway. CO2 reacts with atomic H to form formate species (HCOO*), followed by stepwise hydrogenation of HCOO* that produces methoxy (H3CO*) and finally methanol. Copper nanoparticles supported on metal oxides (e.g. ZnO,57 ZrO2,58 ZnO–ZrO2![[thin space (1/6-em)]](https://www.rsc.org/images/entities/char_2009.gif) 59) or metal carbides (e.g. β-Mo2C60) obey the formate pathway. CO2 is first converted to CO via the RWGS reaction for the RWGS + CO-hydro pathway in which the carboxyl (COOH*) is a reaction intermediate, followed by CO hydrogenation to methanol with formyl (HCO*), formaldehyde (H2CO*) and methoxy (H3CO*) intermediates. The RWGS + CO-hydro pathway has been proposed for Cu/CeOx and Cu/TiO2 systems.61,62 The trans-COOH pathway occurs in H2O-mediated systems on single atom Cu supported on ZnO or Au/Cu–ZnO–Al2O3.63,64 The activated
59) or metal carbides (e.g. β-Mo2C60) obey the formate pathway. CO2 is first converted to CO via the RWGS reaction for the RWGS + CO-hydro pathway in which the carboxyl (COOH*) is a reaction intermediate, followed by CO hydrogenation to methanol with formyl (HCO*), formaldehyde (H2CO*) and methoxy (H3CO*) intermediates. The RWGS + CO-hydro pathway has been proposed for Cu/CeOx and Cu/TiO2 systems.61,62 The trans-COOH pathway occurs in H2O-mediated systems on single atom Cu supported on ZnO or Au/Cu–ZnO–Al2O3.63,64 The activated  reacts with atomic H derived from H2O to generate hydrocarboxyl (COOH*) species. The COOH* is further hydrogenated to yield dihydroxycarbene (COHOH*) and subsequent dissociation of COHOH* forms hydroxymethylidyne (COH*). Finally, methanol is produced via hydroxymethylene (HCOH) and hydroxymethyl (H2COH) intermediates. In the present work, Cu/ZnO is used as a catalyst for methanol synthesis and the reaction follows the formate pathway.
Conclusions
In summary, we have developed a facile mechanical grinding method to rapidly synthesize Cu/ZnO catalysts derived from Cux@ZIF-8-y precursors applied in CO2 hydrogenation to methanol. The cages of ZIF-8 were used to confine the growth of CuO and ZnO particles, obtaining stable metal oxide crystallite sizes (15 and 20 nm) after pyrolysis in air. The specific surface area of CuO/ZnO catalysts was closely related to the Cu/(Cu + Zn) molar ratio and alcohol types during catalyst preparation, thereby affecting Cu and ZnO crystallite sizes, Cu0 surface area and Cu dispersion in the reduced catalysts. Detailed characterization studies were used to disclose the structure–performance correlations. STY of methanol increased linearly by increasing Cu0 surface area, while there existed a linear relationship between methanol selectivity and the proportion of moderately basic sites to total basic sites. Among all of the catalysts, CZ-0.5-R-MeOH exhibited the best catalytic activity with a methanol STY of 128.7 g kgcat−1 h−1 at 200 °C, exceeding that of the CZ-0.5-R-IP catalyst prepared by the conventional impregnation method and the commercial Cu/ZnO catalyst. In situ DRIFTS revealed that formate species was the key reaction intermediate for CO2 hydrogenation to methanol. This work provides an opportunity for the development of MOF derived catalysts for high-performance methanol synthesis from CO2 hydrogenation.Experimental
Materials
Copper nitrate trihydrate (Cu(NO3)2·3H2O), zinc nitrate hexahydrate (Zn(NO3)2·6H2O), sodium carbonate (Na2CO3), zinc oxide (ZnO), methanol, ethanol and 1-propanol were purchased from FUJIFILM Wako Pure Chemical Corporation. 2-Methylimidazole was purchased from Sigma-Aldrich. All the reagents were used directly without further purification. The commercial Cu/ZnO catalyst was obtained from Thailand and reduced using H2/Ar (5/95, v/v) mixture gas at 260 °C for 4 h before the methanol synthesis reaction.Preparation of ZIF-8 and Cux@ZIF-8-y precursors
Cux@ZIF-8-y was prepared by a facile mechanical grinding method. In a typical experiment, 0.006–0.014 mol Cu(NO3)2·3H2O, 0.014–0.006 mol ZnO, 0.08 mol 2-methylimidazole and alcohols of 5.0 mL were added in a mortar and ground for 0.5 h in air until all of the raw materials were converted to a uniform dark blue precursor. The total molar number of Cu and Zn was fixed at 0.02 mol, while the Cu/(Cu + Zn) molar ratio was changed from 0.3 to 0.6. The molar ratio of 2-methylimidazole to (Cu + Zn) was set at 4/1. The alcohols included methanol, ethanol and 1-propanol, which were marked as MeOH, EtOH and PrOH, respectively. The precursor was washed with alcohols three times and then dried at 60 °C for 12 h to obtain Cux@ZIF-8-y precursors, where x represents the Cu/(Cu + Zn) molar ratio (x = 0.3, 0.4, 0.5, 0.6) and y stands for different alcohols (y = MeOH, EtOH and PrOH). ZIF-8 without Cu doping was synthesized in the same manner using 0.02 mol ZnO, 0.08 mol 2-methylimidazole and methanol of 5.0 mL as the starting materials.Preparation of Cux@ZIF-8-y derived Cu/ZnO catalysts
Cux@ZIF-8-y precursors were pyrolyzed in a muffle furnace at 400 °C for 6 h in air to obtain CuO/ZnO catalysts, denoted as CZ-x-C-y, followed by reduction at 260 °C for 4 h in H2/Ar (5/95, v/v) mixture gas which produced Cu/ZnO catalysts, labeled as CZ-x-R-y. In all situations, x represents the Cu/(Cu + Zn) molar ratio, where x = 0.3, 0.4, 0.5, 0.6. “C” and “R” stands for the calcined and reduced catalysts. y represents different alcohols, where y = MeOH, EtOH and PrOH.Preparation of a Cu/ZnO catalyst by the conventional impregnation method
0.01 mol Cu(NO3)2·3H2O (2.416 g) and 0.01 mol ZnO (0.814 g) were added into 5.0 mL of distilled water and stirred at room temperature for 4 h. Afterwards, the mixture was evaporated at 60 °C for 2 h and subsequently dried at 120 °C for 12 h. The dried precursor was calcined at 400 °C for 2 h in air, marked as CZ-0.5-C-IP, followed by reduction at 350 °C (based on H2-TPR analysis) for another 4 h in a H2/Ar (5/95, v/v) mixture gas resulting in a Cu/ZnO catalyst, noted as CZ-0.5-R-IP.Preparation of the Cu/ZnO catalyst by the conventional co-precipitation method
0.03 mol Cu(NO3)2·3H2O (7.248 g) and 0.03 mol Zn(NO3)2·3H2O (8.925 g) were dissolved in 300 mL of water, while 23 g sodium carbonate was dissolved in 300 mL of water. Then, an aqueous solution containing metal nitrates and a sodium carbon aqueous solution were added dropwise to a 2000 mL beaker containing water of 500 mL. The precipitation temperature and pH value were controlled at 60 °C and 8.5, respectively. After being aged at room temperature for 15 h, the precipitate was washed with 50 °C water four times in order to remove Na+ ions. The precipitate was dried at 120 °C for 12 h and then calcined at 350 °C for 2 h to obtain CuO/ZnO. Finally, the calcined catalyst was reduced at 260 °C for 4 h in H2/Ar (5/95, v/v) mixture gas resulting in the Cu/ZnO catalyst, marked as CZ-0.5-R-CP.Characterization of catalysts
Powder X-ray diffraction (XRD) was carried out on Rigaku RINT 2200 equipment (Cu Kα radiation). The scanning speed was 2° min−1 at 20 mA and 40 kV. The average CuO, Cu and ZnO crystallite sizes were calculated via Scherrer's equation.X-ray fluorescence (XRF) was used to determine the Cu/Zn molar ratio of the calcined catalysts.
The specific surface area, average pore size and pore volume were measured by N2 adsorption–desorption at −196 °C on a Quantachrome instrument. The samples were first degassed under vacuum. The specific surface area was calculated based on the Brunauer–Emmett–Teller (BET) method, while pore size distribution was calculated according to the Horvath–Kawazoe (HK) method.
Fourier transform infrared (FT-IR) spectra were collected on an IR Prestige-21 spectrometer within the region of 2000–500 cm−1.
The morphology of the catalysts was studied using a JEOL, JSM-IT 700 HR scanning electron microscope (SEM). Energy-dispersive X-ray spectroscopy (EDS) mapping was also performed on the same equipment.
Transmission electron microscopy (TEM), high-resolution transmission electron microscopy (HR-TEM), High-Angle Annular Dark Field Scanning Transmission Electron Microscopy (HAADF-STEM) were performed on a JEOL, JEM-F200 instrument operated at 200 kV.
Thermal gravimetric (TG) measurement was conducted on a Shimadzu instrument at a heating rate of 5 °C min−1 from 30 to 900 °C under an air atmosphere.
H2 temperature-programmed reduction (TPR) and CO2 temperature-programmed desorption (TPD) were conducted on a BELCAT-B instrument. For the H2-TPR test, the calcined sample was first pretreated at 150 °C for 2 h in He gas and afterwards decreased to 50 °C. Then, H2/Ar (5/95, v/v) mixture gas was introduced and the temperature was increased from 50 to 600 °C at a heating rate of 10 °C min−1. For the CO2-TPD test, the calcined sample was reduced using H2/Ar (5/95, v/v) mixture gas for 2 h and then cooled to 50 °C. Afterwards, the catalyst was exposed to pure CO2 gas for 1 h and then He gas passed through the catalyst bed for 0.5 h to remove the physically adsorbed CO2. The temperature was increased from 50 to 600 °C at a heating rate of 10 °C min−1 and a thermal conductivity detector (TCD) was used to analyze the desorbed CO2. CO2 pulses were used to quantitatively calibrate CO2 peak area.
H2 temperature-programmed desorption (TPD) was performed on the same instrument as that for CO2-TPD. The calcined catalyst of 50 mg was first reduced using H2/Ar (5/95, v/v) mixture gas at 300 °C for 1.5 h and then cooled to 50 °C in Ar gas. Afterwards, the reduced catalyst was exposed to H2/Ar (5/95, v/v) mixture gas for 1 h and then Ar gas was passed through the catalyst bed for 0.5 h to remove the physically adsorbed H2. Finally, the temperature was increased from 50 to 700 °C at a heating rate of 10 °C min−1 and a thermal conductivity detector (TCD) was used to analyze the desorbed H2 using Ar as carrier gas.
Cu0 surface area and Cu dispersion were measured by the N2O pulse chemisorption experiment. About 0.05 g of calcined catalyst was first reduced using pure H2 gas and afterwards cooled to 60 °C. Then, N2O of 1.0 mL was pulsed repeatedly via a quantitative tube until the N2O amount in the effluent gas increased to a constant value, indicating the complete conversion of metallic Cu to Cu2O (2Cu + N2O → Cu2O + N2). The outlet N2O and N2 were analyzed using a thermal conductivity detector (TCD).
X-ray photoelectron spectroscopy (XPS) was conducted on a Thermo ESCALAB 250 Xi instrument equipped with Al Kα radiation. The catalysts were first pretreated in the pretreatment chamber and afterwards transferred into the analysis chamber. Cu 2p, Zn 2p, C 1s and O 1s spectra were collected. The binding energy (BE) was calibrated by using the C 1s line.
In situ diffuse reflectance infrared Fourier transform spectra (DRIFTS) were recorded on a Nicolet Nexus 470 FTIR spectrometer equipped with a diffuse reflectance attachment and an MCT detector. About 15 mg of calcined catalyst was loaded in a diffuse reflectance infrared cell with a ZnSe window. Prior to measurement, the sample was pretreated at 260 °C for 1 h in He gas. Subsequently, He gas was switched to pure H2 gas to reduce the catalyst for another 1 h and then cooled to 220 °C. The background spectrum was collected after being kept for 0.5 h in He gas. Afterwards, CO2/H2 mixture gas (H2/CO2 = 3) was introduced into the IR cell and the IR spectra were recorded every 5 min at a resolution of 2 cm−1 with 32 scans.
Catalyst activity test
CO2 hydrogenation to methanol was conducted in a continuous fixed-bed reactor. In a typical experiment, 0.25 g catalyst diluted with 1 g quartz sand was placed in the middle of the reactor with quartz wool to hold the catalyst bed. The catalyst was reduced using H2/Ar (5/95, v/v) mixture gas at 260 °C for 4 h under atmospheric pressure and then cooled to room temperature. The feed gas with a composition of Ar/CO2/H2 = 4/24/72 (H2/CO2 = 3) was introduced into the reactor, followed by the reaction conducted at 190–220 °C with a total pressure of 5.0 MPa. The gas hourly space velocity (GHSV) was fixed at 6000 mL gcat−1 h−1. The gas products (CO, CO2, and Ar) were analyzed via an on-line gas chromatograph (GC-2014) equipped with an activated carbon column and a thermal conductivity detector (TCD). Methanol was analyzed via a gas chromatograph (GC-2014) equipped with a flame-ionization detector (FID).CO2 conversion (CCO2) was calculated using the formula (1):
 | (1) |
The selectivity of methanol (SMeOH) and CO (SCO) were calculated using the formulae (2) and (3):
 | (2) |
 | (3) |
The space time yield (STY) of methanol was calculated using the formula (4):
 | (4) |
Data availability
Data are available from the corresponding author upon reasonable request.Author contributions
F. Chen: data curation, methodology, writing – original draft; S. Liu: investigation; H. Huang: formal analysis; B. Wang: software; Z. Liu: resources; X. Jiang: visualization; W. Xiang: formal analysis; G. Yang: supervision; G. Liu: formal analysis; X. Peng: writing – review & editing; Z. Zhang: writing – review & editing; Z. Liu: writing – review & editing; N. Tsubaki: project administration, funding acquisition, writing – review & editing.Conflicts of interest
There are no conflicts to declare.Acknowledgements
This work was supported by the National Natural Science Foundation of China (No. U22A20392, 22478364, 22478365, and 22208314). Japan Society for the Promotion of Science (JSPS) grant-in-aid is greatly appreciated (22H01864 and 23H05404). The authors would like to thank the workers in Shiyanjia Lab (https://www.shiyanjia.com) for TEM and EDS mapping analysis.Notes and references
- K. Lee, U. Anjum, T. P. Araújo, C. Mondelli, Q. He, S. Furukawa, J. P. Ramirez, S. M. Kozlov and N. Yan, Appl. Catal., B, 2022, 304, 120994 CrossRef CAS.
- X. Cui, S. Chen, H. Yang, Y. Liu, H. Wang, H. Zhang, Y. Xue, G. Wang, Y. Niu, T. Deng and W. Fan, Appl. Catal., B, 2021, 298, 120590 CrossRef CAS.
- H. Zhao, X. Liu, C. Zeng, W. Liu and L. Tan, J. Am. Chem. Soc., 2024, 146, 23649–23662 CrossRef.
- J. Wei, Q. Ge, R. Yao, Z. Wen, C. Fang, L. Guo, H. Xu and J. Sun, Nat. Commun., 2017, 8, 15174 CrossRef.
- Y. Fang, F. Wang, Y. Chen, Q. Lv, K. Jiang, H. Yang, H. Zhao, P. Wang, Y. Gan, L. Wu, Y. Tang, X. Gao and L. Tan, J. Energy Chem., 2024, 93, 126–134 CrossRef.
- M. Sadeghinia, M. Rezaei, A. N. Kharat, M. N. Jorabchi, B. Nematollahi and F. Zareiekordshouli, Mol. Catal., 2020, 484, 110776 CrossRef.
- C. Wu, L. Lin, J. Liu, J. Zhang, F. Zhang, T. Zhou, N. Rui, S. Yao, Y. Deng, F. Yang, W. Xu, J. Luo, Y. Zhao, B. Yan, X. Wen, J. A. Rodriguez and D. Ma, Nat. Commun., 2020, 11, 5767 CrossRef PubMed.
- S. Xiong, Y. Lian, H. Xie and B. Liu, Fuel, 2019, 256, 115975 CrossRef.
- O. A. Ojelade, S. F. Zaman, M. A. Daous, A. A. Al-Zahrani, A. S. Malik, H. Driss, G. Shterk and J. Gascon, Appl. Catal., A, 2019, 584, 117185 CrossRef.
- Y. Pei, Z. Zhao, X. Qiu, A. Cui, X. Su, Y. Wang and S. Kawi, Ind. Eng. Chem. Res., 2024, 63, 20434–20447 CrossRef.
- Y. Men, X. Fang, Q. Gu, R. Singh, F. Wu, D. Danaci, Q. Zhao, P. Xiao and P. A. Webley, Appl. Catal., B, 2020, 275, 119067 CrossRef.
- M. H. Alabsi, X. Chen, X. Wang, M. Zhang, A. Ramirez, A. Duan, C. Xu, L. Cavallo and K. Huang, J. Catal., 2022, 413, 751–761 CrossRef.
- P. Zhang, W. Na, J. Zuo, J. Wen, Z. Huang, H. Huang, W. Gao, X. Qi, M. Zheng and H. Wang, Mol. Catal., 2023, 538, 112977 CrossRef.
- M. Yang, J. Yu, A. Zimina, B. B. Sarma, J. D. Grunwaldt, H. Zada, L. Wang and J. Sun, Angew. Chem., Int. Ed., 2024, 63, e202312292 CrossRef CAS PubMed.
- S. Wang, J. Yang, S. Wang, F. Xiao and N. Zhao, ChemCatChem, 2022, 14, e202200957 CrossRef CAS.
- E. Heracleous, V. Koidi and A. A. Lappas, Catal. Sci. Technol., 2021, 11, 1467 RSC.
- F. Chen, P. Zhang, L. Xiao, J. Liang, B. Zhang, H. Zhao, R. Kosol, Q. Ma, J. Chen, X. Peng, G. Yang and N. Tsubaki, ACS Appl. Mater. Interfaces, 2021, 13, 8191–8205 CrossRef CAS PubMed.
- Z. Li, T. Du, Y. Li, H. Jia, Y. Wang, Y. Song and X. Fang, Fuel, 2022, 322, 124264 CrossRef CAS.
- J. Xiao, D. Mao, G. Wang, X. Guo and J. Yu, Int. J. Hydrogen Energy, 2019, 44, 14831–14841 CrossRef CAS.
- Y. Mitsuka, N. Ogiwara, M. Mukoyoshi, H. Kitagawa, T. Yamamoto, T. Toriyama, S. Matsumura, M. Haneda, S. Kawaguchi, Y. Kubota and H. Kobayashi, Angew. Chem., Int. Ed., 2021, 60, 22283–22288 CrossRef CAS PubMed.
- H. Liu, Z. Chang, J. Fu and Z. Hou, Appl. Catal., B, 2023, 324, 122194 CrossRef CAS.
- B. An, J. Zhang, K. Cheng, P. Ji, C. Wang and W. Lin, J. Am. Chem. Soc., 2017, 139, 3834–3840 CrossRef CAS PubMed.
- T. Stolar, A. Prašnikar, V. Martinez, B. Karadeniz, A. Bjelic, G. Mali, T. Friščic, B. Likozar and K. Uzarevic, ACS Appl. Mater. Interfaces, 2021, 13, 3070–3077 CrossRef.
- H. Ye, W. Na, W. Gao and H. Wang, Energy Technol., 2020, 8, 2000194 CrossRef.
- M. Zhu, S. R. Venna, J. B. Jasinski and M. A. Carreon, Chem. Mater., 2011, 23, 3590–3592 CrossRef.
- Y. Yin, B. Hu, X. Li, X. Zhou, X. Hong and G. Liu, Appl. Catal., B, 2018, 234, 143–152 CrossRef.
- B. Hu, Y. Yin, Z. Zhong, D. Wu, G. Liu and X. Hong, Catal. Sci. Technol., 2019, 9, 2673–2681 RSC.
- V. K. Velisoju, J. L. Cerrillo, R. Ahmad, H. O. Mohamed, Y. Attada, Q. Cheng, X. Yao, L. Zheng, O. Shekhah, S. Telalovic, J. Narciso, L. Cavallo, Y. Han, M. Eddaoudi, E. V. Ramos-Fernández and P. Castaño, Nat. Commun., 2024, 15, 2045 CrossRef.
- S. Sun, Z. Yang, J. Cao, Y. Wang and W. Xiong, J. Solid State Chem., 2020, 285, 121219 CrossRef.
- E. L. Bustamante, J. L. Fernández and J. M. Zamaro, J. Colloid Interface Sci., 2014, 424, 37–43 CrossRef PubMed.
- C. Á. Galván, J. Schumann, M. Behrens, J. L. G. Fierro, R. Schlögl and E. Frei, Appl. Catal., B, 2016, 195, 104–111 CrossRef.
- H. Zheng, N. Narkhede, G. Zhang, H. Zhang, L. Ma and S. Yu, Mol. Catal., 2021, 516, 111984 CrossRef.
- T. Witoon, T. Numpilai, T. Phongamwong, W. Donphai, C. Boonyuen, C. Warakulwit, M. Chareonpanich and J. Limtrakul, Chem. Eng. J., 2018, 334, 1781–1791 CrossRef.
- G. Wang, D. S. Mao, X. M. Guo and J. Yu, Appl. Surf. Sci., 2018, 456, 403–409 CrossRef.
- L. C. Wang, Y. M. Liu, M. Chen, Y. Cao, H. Y. He, G. S. Wu, W. L. Dai and K. N. Fan, J. Catal., 2007, 246, 193–204 CrossRef.
- W. L. Dai, Q. Sun, J. F. Deng, D. Wu and Y. H. Sun, Appl. Surf. Sci., 2001, 177, 172–179 CrossRef.
- F. F. Cai, J. J. Ibrahim, Y. Fu, W. B. Kong, J. Zhang and Y. H. Sun, Appl. Catal., B, 2020, 264, 118500 CrossRef.
- P. P. Zhang, Y. Araki, X. B. Feng, H. J. Li, Y. Fang, F. Chen, L. Shi, X. B. Peng, Y. Yoneyama, G. H. Yang and N. Tsubaki, Fuel, 2020, 268, 117213 CrossRef.
- T. W. van Deelen, C. H. Mejía and K. P. de Jong, Nat. Catal., 2019, 2, 955–970 CrossRef.
- R. Burch and S. E. Golunski, J. Chem. Soc., Faraday Trans., 1990, 86, 2683–2691 RSC.
- S. Xiao, Y. F. Zhang, P. Gao, L. S. Zhong, X. P. Li, Z. Z. Zhang, H. Wang, W. Wei and Y. H. Sun, Catal. Today, 2017, 281, 327–336 CrossRef.
- W. Dai, Q. Sun, J. Deng, D. Wu and Y. Sun, Appl. Surf. Sci., 2001, 177, 172–179 CrossRef.
- J. H. Xu, X. Su, X. Y. Liu, X. L. Pan, G. X. Pei, Y. Q. Huang, X. D. Wang, T. Zhang and H. R. Geng, Appl. Catal., A, 2016, 514, 51–59 CrossRef.
- P. Gao, F. Li, H. J. Zhan, N. Zhao, F. K. Xiao, W. Wei, L. S. Zhong, H. Wang and Y. H. Sun, J. Catal., 2013, 298, 51–60 CrossRef.
- X. Wei, W. Su, Y. Shi, J. Wang, P. Lv, X. Song, Y. Bai, G. Xu and G. Yu, Int. J. Hydrogen Energy, 2024, 58, 128–136 CrossRef.
- X. Jiang, X. Nie, X. Guo, C. Song and J. G. Chen, Chem. Rev., 2020, 120, 7984–8034 CrossRef PubMed.
- D. Li, F. Xu, X. Tang, S. Dai, T. Pu, X. Liu, P. Tian, F. Xuan, Z. Xu, I. E. Wachs and M. Zhu, Nat. Catal., 2022, 5, 99–108 CrossRef.
- X. M. Guo, D. S. Mao, G. Z. Lu, S. Wang and G. S. Wu, J. Mol. Catal. A: Chem., 2011, 345, 60–68 CrossRef.
- F. Arena, G. Italiano, K. Barbera, S. Bordiga, G. Bonura and L. Spadaro, Appl. Catal., A, 2008, 350, 16–23 CrossRef.
- J. F. Yu, M. Yang, J. X. Zhang, Q. J. Ge, A. Zimina, T. Pruessmann, L. Zheng, J. D. Grunwaldt and J. Sun, ACS Catal., 2020, 10, 14694–14706 CrossRef.
- C. Wu, L. Lin, J. Liu, J. Zhang, F. Zhang, T. Zhou, N. Rui, S. Yao, Y. Deng, F. Yang, W. Xu, J. Luo, Y. Zhao, B. Yan, X. Wen, J. A. Rodriguez and D. Ma, Nat. Commun., 2020, 11, 5767 CrossRef PubMed.
- R. Yang, Y. Fu, Y. Zhang and N. Tsubaki, J. Catal., 2004, 228, 23–35 CrossRef.
- Y. Xu, Z. Gao, Y. Xu, X. Qin, X. Tang, Z. Xie, J. Zhang, C. Song, S. Yao, W. Zhou, D. Ma and L. Lin, Appl. Catal. B-Environ. Energy, 2024, 344, 123656 CrossRef.
- Y. Wang, S. Kattel, W. Gao, K. Li, P. Liu, J. G. Chen and H. Wang, Nat. Commun., 2019, 10, 1166 CrossRef.
- W. Wang, Z. Qu, L. Song and Q. Fu, J. Energy Chem., 2020, 47, 18–28 CrossRef.
- J. Zhong, X. Yang, Z. Wu, B. Liang, Y. Huang and T. Zhang, Chem. Soc. Rev., 2020, 49, 1385–1413 RSC.
- S. Kattel, P. J. Ramirez, J. G. Chen, J. A. Rodriguez and P. Liu, Science, 2017, 355, 1296–1299 CrossRef.
- I. A. Fisher and A. T. Bell, J. Catal., 1997, 172, 222–237 CrossRef CAS.
- Y. H. Wang, S. Kattel, W. G. Gao, K. Z. Li, P. Liu, J. G. Chen and H. Wang, Nat. Commun., 2019, 10, 1166 CrossRef.
- S. Posada-Perez, P. J. Ramirez, R. A. Gutierrez, D. J. Stacchiola, F. Vines, P. Liu, F. Illas and J. A. Rodriguez, Catal. Sci. Technol., 2016, 6, 6766–6777 RSC.
- J. Graciani, K. Mudiyanselage, F. Xu, A. E. Baber, J. Evans, S. D. Senanayake, D. J. Stacchiola, P. Liu, J. Hrbek, J. F. Sanz and J. A. Rodriguez, Science, 2014, 345, 546–550 CrossRef CAS PubMed.
- S. Kattel, B. H. Yan, Y. X. Yang, J. G. Chen and P. Liu, J. Am. Chem. Soc., 2016, 138, 12440–12450 CrossRef PubMed.
- W. Wu, Y. Wang, L. Luo, M. Wang, Z. Li, Y. Chen, Z. Wang, J. Chai, Z. Cen, Y. Shi, J. Zhao, J. Zeng and H. Li, Angew. Chem., Int. Ed., 2022, 61, e202213024 CrossRef PubMed.
- N. Pasupulety, H. Driss, Y. A. Alhamed, A. A. Alzahrani, M. A. Daous and L. Petrov, Appl. Catal., A, 2015, 504, 308–318 CrossRef.
Footnote |
| † Electronic supplementary information (ESI) available. See DOI: https://doi.org/10.1039/d4sc07418a |
| This journal is © The Royal Society of Chemistry 2025 |