 Open Access Article
Creative Commons Attribution 3.0 Unported Licence
Polymer dynamics at low molecular weight of poly(butylene oxide) star polymers†
Karin J.
Bichler‡
 *a,
Bruno
Jakobi
 a and
Gerald J.
Schneider
 *ab
*ab
aLouisiana State University, Department of Chemistry, Baton Rouge, 70803 LA, USA. E-mail: bichlerkj@ornl.gov
bLouisiana State University, Department of Physics and Astronomy, Baton Rouge, 70803 LA, USA. E-mail: gjschneider@lsu.edu
First published on 10th February 2025
Abstract
Star polymers are an interesting class of polymers to study based on their shape and dynamics. We use complementary techniques to study the polymer dynamics of star polymers with shorter side chains and compare them with linear counterparts. Using dielectric spectroscopy and rheology allows the extraction of the critical molecular weight using two different approaches. Furthermore, the reduction of the dielectric normal mode relaxation time shows a temperature as well as molecular weight dependent factor. Based on our dielectric spectroscopy results and taking  as the limiting case based on theory, a temperature of T = 201.5 K is required which translates into a corresponding factor of
  for low molecular weight, i.e., Mw < Mc. Fast field cycling NMR together with rheology allowed us to conclude that both techniques track the dynamics of the entire star polymer rather than the dynamics of single arm like dielectric spectroscopy. This is especially seen as the dynamic moduli of linPBO8.5 and starPBO3.7 overlap and therefore have the same relaxation time.
Introduction
Star polymers are among the simplest structures of branched polymers, where single side chains are chemically attached to one central point.1 Comparing them with linear polymers, i.e., unattached side chains, not only the structure is different, but also the dynamical behavior is altered by tethering.2–6While linear polymers are known to have a random coil conformation, star polymers tend to have a more spherical appearance including a so called blob region, which describes the internal side chain conformation.7
Dynamically speaking, as soon as one end of a linear chain is fixed to a central point, as is the case in star polymers as well as in other graft systems, the polymer dynamics, as well as segmental relaxation, experiences changes. On the more local scale, a reduction in relaxation time, depending on the molecular weight is visible, which eventually levels off for sufficiently long chains.8 This has been investigated recently by neutron scattering experiments on poly(dimethylsiloxane) based bottlebrush polymers.8–10 Furthermore, this feature depends on the backbone and side chain chemistry and their combination.11 Having a rather stiff backbone combined with flexible side chains, i.e., a stiff-g-flexible system, the trend as seen for flexible-g-flexible systems is reversed.12 This has been investigated theoretically and experimentally.11,12
Going over to the large-scale polymer dynamics, theoretical reduction of the relaxation time by a factor of 4 is routed in the Rouse model calculation of a tethered chain compared to unconstrained relaxation.13,14 Experimentally, it is verified for high molecular weight star polymers, having side chains beyond the entanglement threshold.2,3,6 Also, this effect is reported to be independent of the number of side chains.2 However, for shorter side chains, i.e., below the entanglement molecular weight, Me, molecular weight dependent effects are more prominent, but dynamical studies and comparisons for that region are not available so far.
We used star polymers based on poly(butylene oxide), PBO, with four arms, covering side chain lengths across the entanglement molecular weight, Me, i.e., below and above Me. Using this polymer enables the capability to use dielectric spectroscopy for tracking the large-scale polymer dynamics describing the relaxation of the chain end-to-end vector, i.e., dielectric normal mode relaxation, due to parallel alignment of the permanent dipole moments, μ.15–17 Additionally, rheological measurements were performed using the zero-shear viscosity, η0, as a second quantity to quantify the changes associated with the grafting process. These measurements were compared with respective measurements of linear PBO over an extended molecular weight range.
Theory
Dielectric spectroscopy
Dielectric spectroscopy measurements lead to frequency dependent storage, ε′(f), and loss permittivity, ε′′(f). Both quantities are combined to the complex dielectric function and can be written as ε*(f) = ε′(f) − iε′′(f), whereas both parts contain the same information due to the Kramers–Kronig relation. For ideal relaxation processes, which is the case for simple liquids or very low molecular weight polymers, the relaxation process can be described using a Debye function. | (1) |
However, most of the experiments cover materials showing non-ideal relaxation behavior. This is also the case for polymer systems, except for those mentioned before. Under these conditions, the empirical Havriliak–Negami function is widely used, which is a generalized version of the Debye function, accounting for the asymmetric broadening of the relaxation peak by incorporating the shape parameters, β, and γ, with limitations such as 0 < β ≤ 1 and 0 < β·γ ≤ 1.18–20
 | (2) |
Based on the description with the Havriliak–Negami function, the relaxation time, τHN, is obtained, which is still influenced by the asymmetric broadening of the relaxation peak. Therefore, the following correction formula needs to be applied to account for β and γ. The obtained corrected relaxation time, τ, coincides with the peak maximum position of the relaxation process.
 | (3) |
The shape parameters themselves can be seen as a measure of the relaxation time distribution. With values of β = β·γ = 1 the Debye relaxation is recovered, whereas values <1 indicate broader distributed relaxation times.
Independent of the number of occurring relaxation processes, the temperature dependence has a certain behavior. In the case of dielectric normal mode and segmental relaxation, as covered in this publication, the temperature dependence can be well described using the Vogel–Fulcher–Tammann equation, with τ∞ being the relaxation time for an infinitely high temperature, TVFT describing the ideal glass transition temperature which is usually assumed to be 70–100 K above the actual glass transition temperature and A describing a fitting parameter.8
 | (4) |
In the case of thermally activated processes, which would include secondary relaxation processes, occurring below Tg the Arrhenius equation will be used to describe the temperature behavior. Hereby, τ∞ has the same meaning as in the VFT equation, and the activation energy is described using Ea.21
 | (5) |
For the analysis of the dielectric spectra, in the case of the dielectric normal mode relaxation the real part of ε*(f) was taken whereas segmental relaxation was analyzed using the imaginary part. This allows consistency even at higher molecular weights, where conductivity contribution overwhelms the relaxation peak of the dielectric normal mode relaxation in the imaginary part.
Rheology
Rheology measures the dynamic storage, G′(ω), and loss moduli, G′′(ω), depending on the angular frequency, ω, for several temperatures as desired. However, the frequency range of one scan at one measurement temperature is limited to around three orders of magnitude. Therefore, the frequency temperature superposition (FTS) principle is commonly applied which leads to an increased frequency range. This is especially important considering polymer dynamics as it extends over several orders in time/frequency.For analyzing the dynamic moduli, the Rouse model is often used for low molecular weight polymers, M < Me. Besides that, for higher molecular weight polymers, M > Me, more complicated models considering the entanglement effect are used for describing the dynamical behavior. As seen in eqn (6) and (7), in the case of the Rouse model, the only parameters are the Rouse relaxation time, τR, describing the longest relaxation time in the system, which is obtained from the first relaxation mode, p = 1 via τp = τR/p2, and G0. The number of modes, N, depends on the molecular weight of the used samples and will be set for the fitting itself.
 | (6) |
 | (7) |
Fast field cycling NMR
Fast field cycling NMR measures the frequency dependent relaxation rate, R1(ω), which will be transferred into the dipolar susceptibility via, . This allows the application of the frequency temperature superposition (FTS) principle to increase the accessible frequency range, leading to information about the segmental relaxation as well as the large-scale polymer dynamics. The former quantity resembles a well pronounced peak towards higher frequencies, whereas the polymer dynamics is represented as a power law dependence, which can be seen as the envelope function of all the relaxation modes. Out of the peak maximum, the segmental relaxation time, τ, can be extracted with eqn (8) by using the Cole–Davidson,20 CD, function.
 | (8) |
 | (9) |
Subsequently using the shift parameters, aT, from the FTS principle, segmental relaxation times of all measured temperatures can be retrieved.22–24 This opens the possibility of combining the relaxation times with those obtained by dielectric spectroscopy in order to increase the covered temperature range.
Furthermore, having the relaxation rate, R1(ω), at hand, allows us to extract the temperature dependent diffusion coefficient, D(T), by using the following relation.25,26
 | (10) |
To be precise, this relation is valid for the intermolecular interaction of the relaxation rate only. However, to eliminate purely the intermolecular contribution from the relaxation rate or susceptibility, dilution experiments are required which necessitates deuterated polymers in matching molecular weights which is not readily available. For our sake, we assume that intermolecular interaction contributions are the dominant part of the susceptibility master curve at low frequencies27 and in good approximation apply eqn (10) to our data.
Synthesis
The linear poly(butylene oxide)s were synthesized following Chen et al. and Jakobi et al. via the ring opening polymerization of butylene oxide with the phosphazene base P2-tBu catalyzed by triethylborane.12,28 For the four arm star polymers a short chain precursor starPBO3.7 was made following the same procedure with pentaerythritol as an initiator. For the other star polymers only the phosphazene base P4-tBu was used following Isono et al.29Sample characteristics
(Table 1)| Linear PBO polymers | |||
|---|---|---|---|
| Name | M w (kg mol−1) | M n (kg mol−1) | PDI |
| linPBO2.6 | 2.6 | 2.5 | 1.04 |
| linPBO4.2 | 4.2 | 4.0 | 1.05 |
| linPBO8.5 | 8.5 | 8.0 | 1.06 |
| linPBO15.5 | 15.5 | 14.2 | 1.09 |
| linPBO23.5 | 23.5 | 21.0 | 1.12 |
| linPBO31.5 | 31.5 | 27.7 | 1.14 |
| linPBO44.4 | 44.4 | 40.0 | 1.11 |
| linPBO51.4 | 51.4 | 46.0 | 1.10 |
| linPBO62.4 | 62.4 | 56.8 | 1.11 |
| 4-Arm PBO star polymers | |||
|---|---|---|---|
| Name | M armw (kg mol−1) | M starw (kg mol−1) | PDIstar |
| starPBO3.7 | 3.7 | 14.6 | 1.11 |
| starPBO6.7 | 6.7 | 26.8 | 1.14 |
| starPBO11.7 | 11.7 | 46.8 | 1.13 |
| starPBO19.3 | 19.3 | 77.3 | 1.15 |
Experimental
A glovebox filled with argon ensuring oxygen and moisture levels below 0.5 ppm, and standard Schlenk and high vacuum techniques were used for all reactions or manipulations. Butylene oxide was dried over calcium hydride, degassed, and distilled before use. Toluene was dried over sodium-potassium alloy, degassed, and distilled prior to use. Pentaerythritol was dried via the evaporation of anhydrous toluene at 50 °C under high vacuum. Anhydrous methanol, phosphazene bases P2-tBu (1-tert-butyl-2,2,4,4,4-pentakis(dimethylamino)-2λ5,4λ5-catenadi(phosphazene)) and P4-tBu (1-tert-butyl-4,4,4-tris(dimethylamino)-2,2-bis[tris(dimethylamino)-phosphoranylidenamino]-2λ5,4λ5-catenadi(phosphazene)) and triethyl borane were used as received.Linear PBO: in a 20 mL vial, methanol (x eq.), butylene oxide (80 eq.), and triethyl borane (0.125 eq.) were mixed. After the addition of P2-tBu (0.05 eq.) the reaction mixture was stirred for 3 days at RT. The reaction is terminated via addition of acetic acid in pentane, filtered through basic alumina and dried under a N2 gas stream.
Precursor-star PBO: in a 20 mL vial, toluene, pentaerythritol (0.4 eq.), butylene oxide (80 eq.), and triethyl borane (0.8 eq.) were mixed. After the addition of P2-tBu (0.8 eq.) the reaction mixture was stirred for 3 days at RT. The reaction is terminated via addition of acetic acid in pentane, filtered through basic alumina and dried under a N2 gas stream.
Star-PBO: in a 20 mL vial the precursor polymer is dissolved in butylene oxide. After addition of P4-tBu the reaction is stirred for 3 days. The reaction is terminated via addition of acetic acid in pentane, filtered through basic alumina and dried under a N2 gas stream.
Dielectric spectroscopy
Dielectric spectroscopy measurements were performed using a broadband dielectric spectrometer from Novocontrol GmbH equipped with an Alpha A analyzer providing a frequency range of f = 10−2–106 Hz. The temperature with an accuracy of ΔT = 0.1 K is controlled using the Quattro cryosystem, using an evaporated liquid nitrogen stream to maintain the measurement temperature. For the isothermal experiments we used a frequency range of f = 10−1–106 Hz together with a temperature range of T = 200–320 K to shift the segmental relaxation as well as the dielectric normal mode relaxation through the frequency window. The samples were placed on a gold coated electrode and placed in a vacuum oven overnight to minimize humidity effects. To ensure a constant sample thickness, thin glass spacers with a predefined thickness of d = 0.1 mm were used.Rheology
Rheology measurements were performed using a DHR3 rheometer from TA Instruments equipped with an environmental test chamber (ETC) providing a constant measurement temperature, with an accuracy of ΔT = 0.1 K. The plate-plate geometry with a diameter of 25 mm was selected together with a gap size of 1 mm. Depending on the molecular weight of the used sample, the temperature range was adjusted to have viscous flow as well as relaxation features inside the frequency window of f = 10−1–102 Hz. Subsequently, the frequency temperature superposition (FTS) principle was applied to create a master curve for the dynamic storage, G′(ω), and loss moduli, G′′(ω).Fast field cycling NMR
Fast field cycling NMR measurements were performed using a SmartRacer FFC NMR from Stelar, equipped with a 0.25 T electromagnet providing a frequency range of f = 104–107 Hz. Replacing magnetizable parts close to the magnet as much as possible together with the separation of the magnet from the electric unit by roughly 1.5 m shifts the lower limit of the frequency range to f ∼ 5 × 10³ Hz. Depending on the temperature range, either a continuous nitrogen gas stream or an evaporated liquid nitrogen stream was used for temperature control. The sample was filled in an NMR tube with an outer diameter of 10 mm and vacuum sealed to maintain the sample quality over the entire experiment. To cover polymer dynamics as well as segmental relaxation a temperature range of T = 250–320 K was selected.Differential scanning calorimetry (DSC)
Differential scanning calorimetry measurements were performed using a TA Discovery DSC250 instrument with a refrigerated system cooling (RSC-90) providing a temperature range of T = (180–820) K. A method involving rapid cooling to T = 180 K with subsequently two cycles of heating–cooling–heating was performed with a controlled heating rate of 10 K min−1. Data of the glass transition temperature, Tg, were taken from the second cycle from the inflection point. Around 5–10 mg of sample was sealed in hermetic Tzero pans. The sealing itself was done in an argon filled glovebox to minimize humidity effects on the measurements.Gel permeation chromatography (GPC)
An Agilent 1260 Infinity II GPC with a dRI detector, isocratic pump, and autosampler together with three MZ Analysentechnik columns, and a Wyatt Dawn Helios II detector were used for all measurements with THF (1 mL min−1) as the solvent. The Astra software package was used for data collection and treatment.Results and discussion
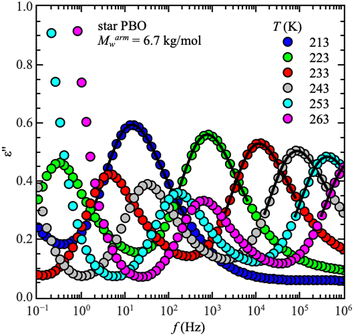
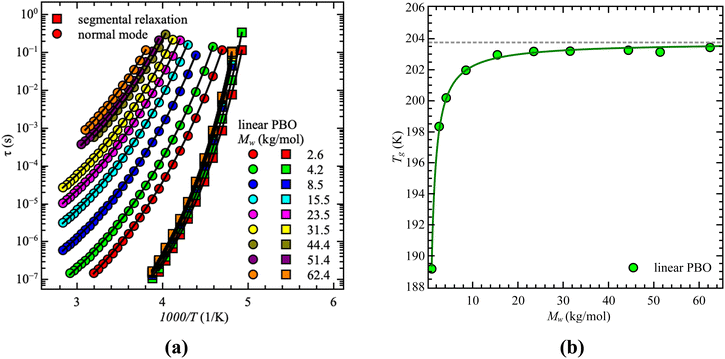
Starting with dielectric spectroscopy on star PBO, as illustrated for a selected sample in Fig. 1, shows dielectric normal mode relaxation toward lower frequencies as well as segmental relaxation at higher frequencies.Both relaxations initially have the same temperature-dependent behavior. Once the temperature increases the relaxation peak shifts to higher frequencies which is equivalent to a lower relaxation time at higher temperatures. This is seen independent of the molecular weight and architecture. As the dielectric normal mode relaxation depends on the molecular weight for all investigated Mw's, the separation of both relaxations increases by increasing the molecular weight, which can be well seen in the temperature dependence of the relaxation times by comparing all used samples, illustrated for the linear PBO samples in Fig. 2a. (Data for the star polymers can be found in the ESI.†) While the dielectric normal mode relaxation is different for each molecular weight, the segmental relaxation saturates for sufficiently long polymer chains. This effect can also be seen in the molecular weight dependence of the glass transition temperature Tg, due to the connection to the segmental relaxation (Fig. 2b).
Taking the molecular weight dependence of the dielectric normal mode relaxation from linPBO allows us to experimentally determine the critical molecular weight, Mc. This quantity is polymer specific and gives information about the onset of entanglement effects. Usually, Mc ∼ 2·Me is a good approximation, whereas Me indicates the entanglement molecular weight.
Using the pure large scale polymer dynamics, τpol, which can be generated by removing the molecular weight dependence of the monomeric friction coefficient, the molecular weight dependence can be examined, leading to the experimental critical molecular weight, Mc. For that, the following correction was applied to the relaxation times of the dielectric normal mode, τNM.30
 | (11) |
Eventually, taking τpol as a function of Mw leads to a power law dependence with a slope change, indicating the transition from Rouse dynamics into an entanglement effect. The transition point itself determines Mc. For linear polymers a transition from τ ∝ M2.0 to τ ∝ M3.4 is reported based on theory.18,31 However, experimentally slightly different power laws are reported.24,32 This is argued by different dynamical contributions.33
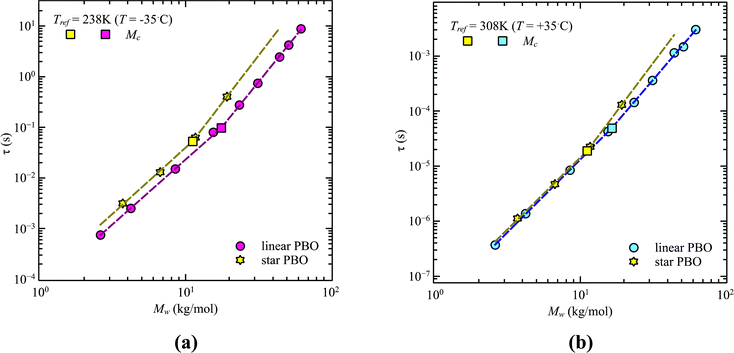
For our samples, the observed power law exponents, b, averaged over all temperatures, lead to 〈b〉Rouse = 2.6 ± 0.1 for the low molecular weight region and 〈b〉ent = 3.3 ± 0.2 with entanglement effects present. Doing this analysis for each temperature allows us to extract the temperature dependence of the critical molecular weight. As illustrated by the red line in Fig. 3a, only a slight temperature dependence is visible. This was already indicated by the power law exponents. Hence, within the experimental accuracy we consider the changes to be insignificant. Therefore, the critical molecular weight of linear PBO averaged over all temperatures comes up as 〈Mlinc〉 = (17.1 ± 0.4) kg mol−1.
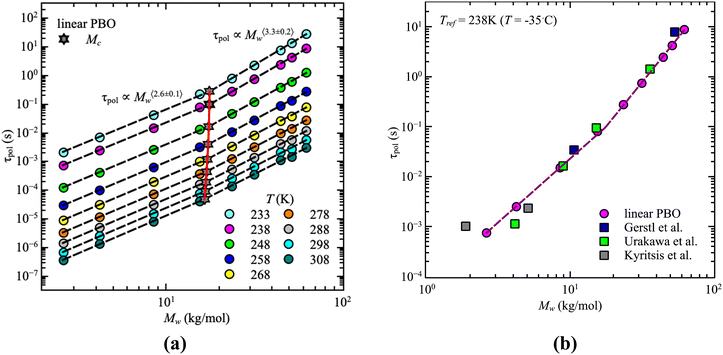 | ||
| Fig. 3 (a) Corrected dielectric normal mode relaxation time, τpol, as a function of weight average molecular weight, Mw, for linear PBO in the temperature range, T = 233–308 K as indicated. Dashed lines are the power law regions. The red solid line indicates the statistical fluctuations of the critical molecular weight, Mc (star symbols). (b) Corrected dielectric normal mode relaxation time, τpol, as a function of weight average molecular weight, Mw, for linear PBO together with literature data at Tref = 238 K.15,16,34 | ||
Gerstl et al. reported an entanglement molecular weight, Me, for PBO as Me = 8.8 kg mol−1, determined by using the number of entanglements, Z, and the Rouse, τR, as well as entanglement time, τe, obtained from rheology data.15 Considering Mc ∼ 2·Me, our result matches the literature value well. The consistency with literature data can further be confirmed by comparing the molecular weight dependence of the corrected dielectric normal mode relaxation times, τpol, at the same temperature, Tref = 238 K. For that, the correction factors obtained from the linear PBO samples (eqn (11)) were applied to all the respective molecular weights of the literature data. As shown in Fig. 3b, taking the correction into account, the literature data of linear PBO correspond well to our data of linear PBO.15,16,34
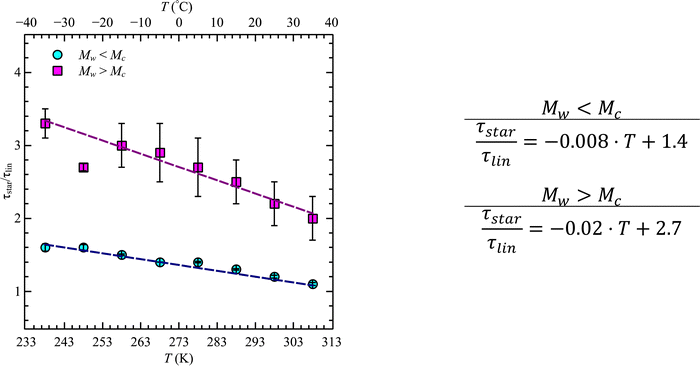
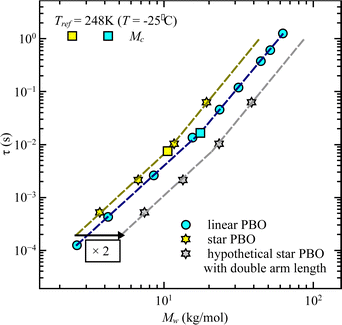
A similar analysis can be done for the star polymers. Only four different molecular weights were available. Within these limitations, we found that contrary to the linear PBO, the glass transition temperature of star PBO is almost constant over all four molecular weights. This can be translated to the segmental relaxation and indicates no molecular weight dependence, which leads to the conclusion that the correction factor, eqn (11), equals one and can therefore be omitted for the star PBO. As seen in Fig. 4, the reduction in relaxation time between linear and star polymers depends on temperature as well as on the molecular weight region.
While at low molecular weights, i.e., Mw < Mc, the relaxation time slows down by a factor of 1.6 for the lowest temperature T = 238 K, in the high molecular weight region, Mw > Mc, the slow down increases to a factor of 3.3. Comparing it with the highest temperature, T = 308 K, these factors come up to be 1.1 and 2.0 for the low and high molecular weight regions, respectively. What seems to be in common over all temperatures is the factor of roughly two between both molecular weight regions. This means that star polymers with an arm length below the critical molecular weight are reduced in relaxation time by only half compared to star polymers with arm lengths above Mc. Taking this into account, we can hypothesize that the factor of 4 can be seen as the limiting case at low temperatures for high molecular weights only, with a corresponding factor of roughly 2 for low molecular weights. Using a linear extrapolation allows us to extract the hypothetical temperature where the limits are reached (Fig. 5). Seeing  as the limiting case based on theory, a temperature of T = 201.5 K is required which translates into a corresponding factor of
  for Mw < Mc. This means that for the low molecular weight region, the theoretical factor of
  cannot be reached, at least with our PBO star polymer.
In common over all temperatures is the constant power law exponent for the two different regions showing up as bRouse = 2.6 ± 0.1 and bent = 3.6 (no standard deviation is available due to the limited number of points in that region). These two match well with theoretical predictions for Rouse dynamics and entanglement effects and are also similar to those obtained for linear PBO. Furthermore, the critical molecular weight is almost constant over all temperatures and can be taken as Mstar-armc = (11.1 ± 0.2) kg mol−1 and is ∼5 kg mol−1 below the value for linear PBO.
Usually, branching shifts the entanglement molecular weight to higher values, considering the overall molecular weight of the polymer. The critical molecular weight determined here, corresponds to the Mc of the attached side chains only and not to the entire star polymer. However, by accounting for a four arm star, we can calculate the critical molecular weight for the entire star to be Mstarc = 44.4 kg mol−1, which translates into Mstare ≈ 22.2 kg mol−1 and is therefore around 4 times the value known for linear PBO.15
In addition to dielectric spectroscopy, rheological measurements were performed to get information on how viscoelastic properties change. This allows further to extract the critical molecular weight with a second method and gives information about the influence of the star architecture on the zero-sheer viscosity, η0.
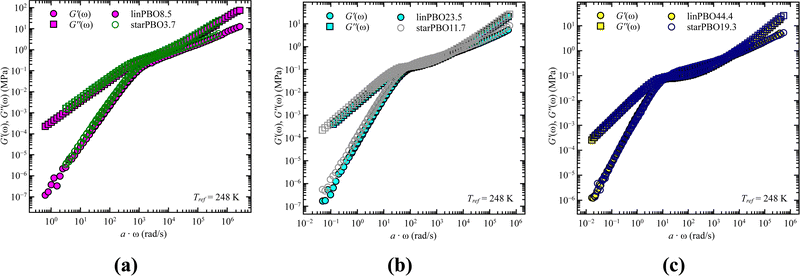
Using the frequency temperature superposition principle leads to the master curves of storage, G′(ω), and loss moduli, G′′(ω), at a selected reference temperature. As seen in Fig. S2 (ESI†), it can be successfully applied to all investigated samples and results in an enlarged frequency range, which includes a transition from non-entangled to entangled dynamics with an increase in molecular weight. Herein, G′(ω) and G′′(ω) have the characteristic frequency dependencies of ∝ ω2 and ∝ ω1, indicating the terminal region.
As we cover non-entangled, i.e., Rouse dynamics, and entangled dynamics in both architectures, we can apply the Rouse model for low molecular weight samples allowing to extract the relaxation time. In contrast to dielectric spectroscopy, where in the case of star polymers the obtained relaxation time corresponds to the dynamics of an arm, in rheology we are tracking the dynamics of the entire star polymer. Fig. 6 shows the analysis approach for two selected samples, well within the Rouse regime. In both cases the description with eqn (6) and (7) works well and leads to the single adjustable fitting parameter, the Rouse relaxation time τR.
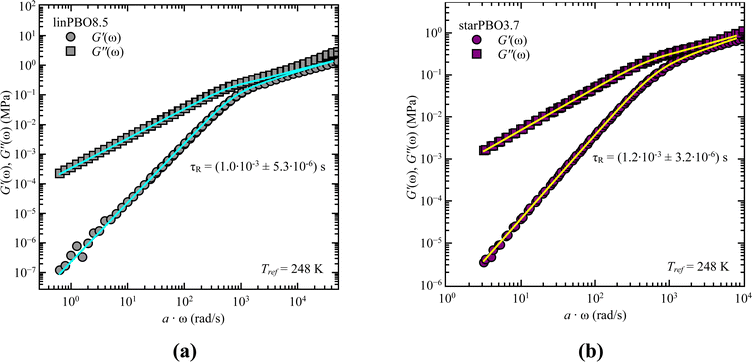 | ||
| Fig. 6 Storage, G′(ω), and loss moduli, G′′(ω), as a function of frequency, ω, for (a) linear PBO and (b) star PBO at the reference temperature, Tref = 248 K. Solid lines are the best description of the Rouse model, eqn (6) and (7). | ||
As stated earlier, we compare now the dynamics of a linear PBO with the dynamics of an entire PBO star, rather than of the single arm only. Interestingly, as seen in Fig. 6, the two selected samples, linPBO8.5 and starPBO3.7 have the same relaxation time. In this case, the linear PBO is roughly double the length of the single arm from the star PBO. Such a comparison of molecular weights can also be done for the other two star polymers investigated with rheology, i.e., starPBO11.7 vs. linPBO23.5 and starPBO19.3 vs. linPBO44.4 (Fig. 7). A comparison of those three linear and star PBOs shows similar relaxation times within each pair. This leads to the conclusion that the dynamics of a star polymer tracked by rheology, which is mostly the dynamics of the entire polymer, is similar to the dynamics of a linear polymer having double the length of a star arm.
This finding is contrary to the results of dielectric spectroscopy. In this case, the linear polymer would need to be 3.5–4 times faster in relaxation time in order to match the condition concluded from rheology. It can be illustrated by taking the molecular weight dependence of the relaxation times and representing it for the double arm length. As seen in Fig. 8, the generated relaxation times (grey star symbols), which would fulfill the find from rheology do not correspond to the experimentally determined relaxation times of the respective molecular weight. This supports the assumption that rheology does track different dynamics compared to dielectric spectroscopy, i.e. dynamics of the entire star polymer in the case of rheology and dynamics of the star arm in the case of dielectric spectroscopy.
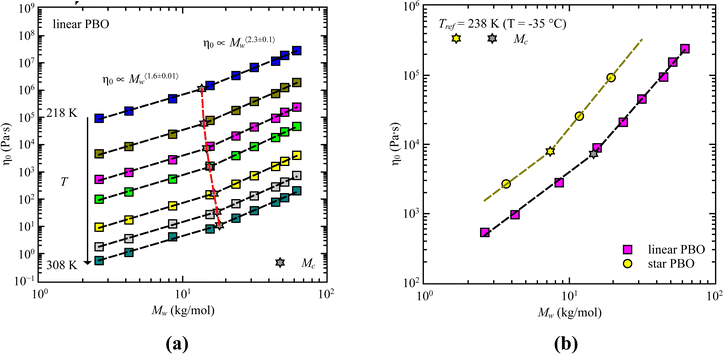
Nevertheless, taking the zero-shear viscosity, η0, from the rheology data still allows us to determine the critical molecular weight with a second approach. Similar to dielectric spectroscopy, η0vs. Mw shows up with two different power law regions which determine the different dynamical regimes, i.e., Rouse and entangled dynamics.
Viscosity is known to be related to segmental relaxation. Therefore, to correct for the molecular weight dependence of the monomeric friction coefficient, we used the same correction factor determined from the segmental relaxation times, as we used for correcting the relaxation times of dielectric spectroscopy. This is similar to a free volume correction, which mostly affects low molecular weights.
Based on theory, in terms of zero-shear viscosity, Rouse dynamics is characterized by η0 ∝ Mw while entanglement effects are indicated by η0 ∝ Mw3.4.31 Doing this analysis for all the samples leads to an averaged power law of η0 ∝ Mw〈1.6±0.01〉 at low molecular weights, followed by η0 ∝ Mw〈2.3±0.1〉 for high molecular weights (Fig. 9). Compared to theory, both regions do not directly match the expected values. However, taking the frequency dependence of G′(ω) and G′′(ω) into account we can safely say that we track different dynamical regions with our molecular weights, which can be attributed to Rouse like dynamics and dynamics influenced by entanglement effects. The same can be assumed for the star PBO samples.
The intersection between both regimes determines the critical molecular weight, Mc. As presented in Fig. 9a, a slight temperature dependent effect is visible for the critical molecular weight; however, we do not manifest it to any significant effects. Therefore, the temperature averaged critical molecular weight determined via rheology can be taken as 〈Mc〉 = (15.6 ± 1.7) kg mol−1. For the star polymer we can extract a value of Mc = 7.4 kg mol−1.
Within the rheology results, by comparing Mc from linear and star PBO, the factor of 2 is again resembled, similar to the results obtained based on the relaxation times. Taking dielectric spectroscopy into account for comparison leads to almost matching values of Mc in the case of linear PBO, while for the star PBO, a difference of around 4 kg mol−1 is noticeable. The biggest difference in the analysis between both techniques is that in the case of dielectric spectroscopy an averaged value over several temperatures is used, which is due to the limited temperatures measured at rheology, together with the reduced number of star polymers not possible. This might explain the large discrepancy in the critical molecular weight in the case of star PBO.
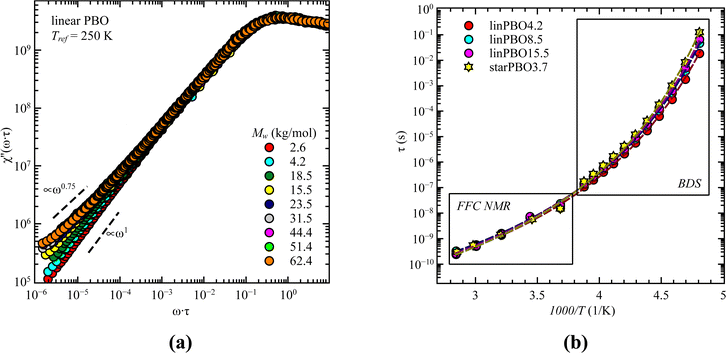
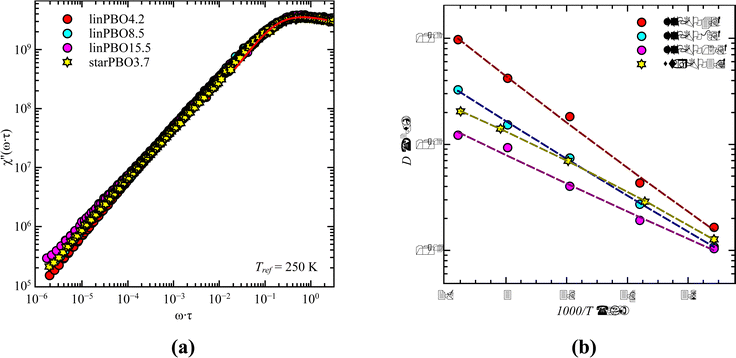
Previous analysis revealed that different parts of the dynamics can be tracked by different techniques. One technique at hand that can track both, i.e., segmental relaxation and large scale polymer dynamics, independent of the alignment of the permanent dipole moment, is fast field cycling (FFC) NMR. The obtained frequency dependent relaxation rates, R1(ω), at different temperatures can be transformed into the susceptibility, χ′′(ω) = ω·R1(ω), which allows the creation of master curves by using the frequency temperature superposition principle. This is shown for all linear PBO samples in Fig. 10a. Two features are prominent. At high frequencies, the relaxation peak is representative of rotational dynamics, and at lower frequencies, a power law region. Out of the relaxation peak, the relaxation time for the segmental relaxation can be extracted by applying eqn (8), which can further be used to calculate the relaxation times for each temperature and subsequentially to extend the temperature/time range accessible by dielectric spectroscopy (Fig. 10b).
With the power law at low frequencies, we can draw conclusions regarding the large-scale polymer dynamics. As seen for the lowest molecular weight of the linear PBO, a power law of χ′′ ∝ ω1 is present, indicating simple diffusional behavior, because of the low molecular weight. Increasing M changes the power law to χ′′ ∝ ω0.75 indicative of Rouse dynamics and additionally, the upswing at very low frequencies is a sign of entanglement effects. These observations support the results obtained by dielectric spectroscopy and rheology, i.e., with the molecular weight of the linear PBO we cover Rouse dynamics as well as dynamics influenced by entanglement effects.
Taking the results of rheology into account, i.e., the viscous flow of a star polymer has a similar behavior to a linear PBO with double the length of one arm, it seems to be the next step to compare the dynamical behavior, tracked by FFC across the star polymer and linear PBO with molecular weights roughly matching the single arm length, double arm length, and the entire star polymer. This is shown in Fig. 11a in the case of the susceptibility master curve. Similar to rheology, the relaxation data for the star PBO match well with those of linPBO8.5, which is roughly double the size of one single arm. Further support to this finding is given by extracting the diffusion coefficient from the relaxation rate via a linear fit of  vs.
vs. , (eqn (10)).
As seen in Fig. 11b, also the diffusion coefficient of the star PBO is similar to the values obtained for linPBO8.5 having Mw ∼ 2·Marmw. Based on that, we can assume that FFC NMR sees similar dynamics to rheology.
Summary and conclusion
The dynamics of polymers change depending on their architecture and is mostly affected by conformational changes. One change can be generated by grafting linear polymer chains to a center point which leads to the star polymer architecture. This grafting process not only leads to a spherical shape compared to a random coil known for linear polymers, but also the segmental relaxation as well as the polymer dynamics' slow down. While the slowdown process of the segmental relaxation levels off for sufficiently long arms of the star polymer, the reduced polymer dynamics remains.Earlier studies mostly focused on arm lengths beyond the entanglement molecular weight, Me, of a corresponding linear chain and confirmed the theoretical reduction factor of 4 with the experiment. We set the focus to lower molecular weight arms and found a lower reduction factor of the normal mode detected by dielectric spectroscopy, which additionally depends on temperature. Within a molecular weight series, the reduction factor is smaller for Marm < Me and eventually approximates 4 at low temperatures for Marm > Me. The determined critical molecular weight, Mc, separating non-entangled dynamics from dynamics influenced by entanglement effects, matches the reported literature values of Me by considering Mc ∼ 2·Me.
A similar comparison was done by rheology by using the frequency dependence of the zero-shear viscosity of the different architectures. Herein, higher values are reported for the star polymer, whereas the critical molecular weight comes back roughly at the same value as that for dielectric spectroscopy. Based on the relaxation behavior, we concluded that rheology detects the dynamics of the entire star polymer rather than of a single arm as in dielectric spectroscopy. Therefore, the dynamics of the star polymer in rheology is similar to those of a linear polymer with double the arm length of the star polymer. This finding is also present in fast field cycling measurements, confirmed by the frequency dependence of the susceptibility and the temperature dependence of the diffusion coefficient.
Data availability
The data supporting this article have been included in the Main Manuscript and in the ESI.† Further information can be requested from the corresponding authors.Conflicts of interest
There are no conflicts to declare.Acknowledgements
The reported research was funded by the U.S. Department of Energy (DoE) under Grant DE-SC0019050.References
- G. Polymeropoulos, G. Zapsas, K. Ntetsikas, P. Bilalis, Y. Gnanou and N. Hadjichristidis, 50th Anniversary Perspective: Polymers with Complex Architectures, Macromolecules, 2017, 50(4), 1253–1290, DOI:10.1021/acs.macromol.6b02569.
- D. Boese, F. Kremer and L. J. Fetters, Molecular dynamics in linear and multiarmed star polymers of cis-polyisoprene as studied by dielectric spectroscopy, Macromolecules, 1990, 23(6), 1826–1830 CrossRef CAS.
- D. Boese, F. Kremer and L. J. Fetters, Further investigation on the molecular dynamics in linear and multiarmed star polymers of cis-polyisoprene studied by dielectric spectroscopy, Polymer, 1990, 31(10), 1831–1837, DOI:10.1016/0032-3861(90)90004-I.
- G. S. Grest, L. J. Fetters, J. S. Huang and D. Richter, Star polymers: Experiment, Theory, and Simulation, Adv. Chem. Phys.: Polym. Syst., 1996, 94, 67–163 CAS.
- A. Ressia Jorge, A. Villar Marcelo and M. Vallés Enrique, Synthesis and rheological characterization of linear and star-shaped polydimethylsiloxanes, Macromol. Symp., 2001, 168(1), 43–54, DOI:10.1002/1521-3900(200103)168:1<43:AID-MASY43>3.0.CO;2-Y , (acccessed 2018/06/21).
- A. Schönhals and F. Kremer, Amorphous Polymers, Polym. Sci., 2012, 1, 201–226, DOI:10.1016/B978-0-444-53349-4.00010-8.
- M. Daoud and J. P. Cotton, Star Shaped Polymers: A Model for the Conformation and its Concentration Dependence, J. Phys., 1982, 43(3), 531–538 CrossRef CAS.
- B. Jakobi, K. J. Bichler, A. Sokolova and G. J. Schneider, Dynamics of PDMS-g-PDMS Bottlebrush Polymers by Broadband Dielectric Spectroscopy, Macromolecules, 2020, 53(19), 8450–8458, DOI:10.1021/acs.macromol.0c01277.
- K. J. Bichler, B. Jakobi, A. Klapproth, T. Tominaga, R. A. Mole and G. J. Schneider, Side Chain Dynamics of Poly(norbornene)-g-Poly(propylene oxide) Bottlebrush Polymers, Macromol. Rapid Commun., 2023, 44(7), 2200902 CrossRef CAS PubMed.
- K. J. Bichler, B. Jakobi, V. G. Sakai, A. Klapproth, R. A. Mole and G. J. Schneider, Short-Time Dynamics of PDMS-g-PDMS Bottlebrush Polymer Melts Investigated by Quasi-Elastic Neutron Scattering, Macromolecules, 2020, 53(21), 9553–9562, DOI:10.1021/acs.macromol.0c01846.
- X. Xu, J. F. Douglas and W.-S. Xu, Influence of Side-Chain Length and Relative Rigidities of Backbone and Side Chains on Glass Formation of Branched Polymers, Macromolecules, 2021, 54(13), 6327–6341, DOI:10.1021/acs.macromol.1c00834.
- B. Jakobi, K. J. Bichler, F. Juranyi and G. J. Schneider, Reversed dynamics of bottlebrush polymers with stiff backbone and flexible side chains, J. Chem. Phys., 2024, 160(8) DOI:10.1063/5.0184429.
- W. W. Graessley, Entangled linear, branched and network polymer systems—Molecular theories. Synthesis and Degradation Rheology and Extrusion, Springer, 2005, pp. 67–117 Search PubMed.
- W. W. Graessley, Entangled linear, branched and network polymer systems—Molecular theories. Synthesis and Degradation Rheology and Extrusion, Springer, Berlin, Heidelberg, 1982, pp. 67–117 Search PubMed.
- C. Gerstl, G. J. Schneider, W. Pyckhout-Hintzen, J. Allgaier, D. Richter, A. Alegría and J. Colmenero, Segmental and Normal Mode Relaxation of Poly(alkylene oxide)s Studied by Dielectric Spectroscopy and Rheology, Macromolecules, 2010, 43(11), 4968–4977, DOI:10.1021/ma100384j.
- O. Urakawa, M. Yamane, S. Tomie, T. Inoue, T. Shikata and K. Adachi, Relationship between global and segmental dynamics of poly(butylene oxide) studied by broadband dielectric spectroscopy, J. Chem. Phys., 2018, 148(3) DOI:10.1063/1.5006364.
- M. Yamane, Y. Hirose and K. Adachi, Dielectric Normal and Segmental Modes in Undiluted Poly(butylene oxide), Macromolecules, 2005, 38(22), 9210–9215, DOI:10.1021/ma0516384.
- F. Kremer, Broadband Dielectric Spectroscopy to Study the Molecular Dynamics of Polymers Having Different Molecular Architectures. in Physical Properties of Polymers Handbook, ed. J. E. Mark, Springer, New York, 2007, pp. 385–393 Search PubMed.
- F. Kremer and A. Loidl, The scaling of relaxation processes, Springer, 2018 Search PubMed.
- F. Kremer and A. Schönhals, Broadband Dielectric Spectroscopy, Springer, Berlin Heidelberg, 2012 Search PubMed.
- K. J. Bichler, B. Jakobi and G. J. Schneider, Segmental relaxation of sequence defined polymers, J. Phys.:Condens. Matter, 2024, 36(11), 115101, DOI:10.1088/1361-648X/ad11aa.
- R. Kimmich, Principle, Purpose and Pitfalls of Field-cycling NMR Relaxometry. Field-cycling NMR Relaxometry, 2018, pp. 1–41 Search PubMed.
- K. J. Bichler, B. Jakobi and G. J. Schneider, Dynamical Comparison of Different Polymer Architectures-Bottlebrush vs. Linear Polymer, Macromolecules, 2021, 54(4), 1829–1837, DOI:10.1021/acs.macromol.0c02104.
- K. J. Bichler, B. Jakobi and G. J. Schneider, Chain dynamics of alternating polymers P(CnEG4), J. Phys.:Condens. Matter, 2024, 36(31), 315101, DOI:10.1088/1361-648X/ad443f.
- K. J. Bichler, Morphology and Dynamics of Bottlebrush Polymers, Springer International Publishing, 2021 DOI:10.1007/978-3-030-83379-4.
- B. Kresse, M. Hofmann, A. F. Privalov, N. Fatkullin, F. Fujara and E. A. Rössler, All Polymer Diffusion Regimes Covered by Combining Field-Cycling and Field-Gradient 1H NMR, Macromolecules, 2015, 48(13), 4491–4502, DOI:10.1021/acs.macromol.5b00855.
- A. Herrmann, B. Kresse, M. Wohlfahrt, I. Bauer, A. F. Privalov, D. Kruk, N. Fatkullin, F. Fujara and E. A. Rössler, Mean Square Displacement and Reorientational Correlation Function in Entangled Polymer Melts Revealed by Field Cycling 1H and 2H NMR Relaxometry, Macromolecules, 2012, 45(16), 6516–6526, DOI:10.1021/ma301099h.
- Y. Chen, J. Shen, S. Liu, J. Zhao, Y. Wang and G. Zhang, High Efficiency Organic Lewis Pair Catalyst for Ring-Opening Polymerization of Epoxides with Chemoselectivity, Macromolecules, 2018, 51(20), 8286–8297, DOI:10.1021/acs.macromol.8b01852.
- T. Isono, K. Kamoshida, Y. Satoh, T. Takaoka, S.-I. Sato, T. Satoh and T. Kakuchi, Synthesis of Star- and Figure-Eight-Shaped Polyethers by t-Bu-P4-Catalyzed Ring-Opening Polymerization of Butylene Oxide, Macromolecules, 2013, 46(10), 3841–3849, DOI:10.1021/ma4006654.
- K. Adachi, H. Yoshida, F. Fukui and T. Kotaka, Comparison of dielectric and viscoelastic relaxation spectra of polyisoprene, Macromolecules, 1990, 23(12), 3138–3144 CrossRef CAS.
- M. Rubinstein and R. H. Colby, Polymer Physics, OUP, Oxford, 2003 Search PubMed.
- E. Schlosser and A. Schönhals, Relation between main- and normal-mode relaxation. A dielectric study on poly(propyleneoxide). in Application of Scattering Methods to the Dynamics of Polymer Systems, ed. B. Ewen, E. W. Fischer and G. Fytas, Steinkopff, 1993, pp. 158–161 Search PubMed.
- K. Ngai, A. Schönhals and E. Schlosser, An explanation of anomalous dielectric relaxation properties of polypropylene glycol, Macromolecules, 1992, 25(19), 4915–4919 CrossRef CAS.
- A. Kyritsis, P. Pissis, S.-M. Mai and C. Booth, Comparative Dielectric Studies of Segmental and Normal Mode Dynamics of Poly(oxybutylene) and Poly(oxyethylene)−Poly(oxybutylene) Diblock Copolymers, Macromolecules, 2000, 33(12), 4581–4595, DOI:10.1021/ma990429e.
Footnotes |
| † Electronic supplementary information (ESI) available. See DOI: https://doi.org/10.1039/d4sm01179a |
| ‡ Current address: Oak Ridge National Laboratory, Oak Ridge, 37831, TN, USA. |
| This journal is © The Royal Society of Chemistry 2025 |

