Preparation of layered carbon nitride/titanium-based metal skeleton materials and study on their electrorheological properties†
Liangkun
Chen
,
Xiang
Ji
,
Haochun
Yan
,
Liyue
Wang
,
Yusheng
Lin
,
Baoxiang
Wang
 * and
Chuncheng
Hao
 *
*
College of Materials Science and Engineering, Qingdao University of Science and Technology, Qingdao, 266042, P. R. China. E-mail: bxwang@qust.edu.cn; hao@qust.edu.cn; Fax: +86-532-84022509; Tel: +86-532-84022509
First published on 27th November 2024
Abstract
Background: as an intelligent material, electrorheological fluids (ERFs) comprise a suspension system consisting of dielectric particles and/or their composites dispersed in an insulating liquid. In this article, MOF/g-C3N4 composite nanoparticles were successfully synthesized and demonstrated an excellent ER effect. Methods: first, the precursor for g-C3N4 was synthesized using a high-temperature calcination method, followed by the in situ synthesis of MIL-125 (MOF-Ti) on the surface of layered graphitic carbon nitride using a solvothermal approach. Scanning electron microscopy (SEM) and transmission electron microscopy (TEM) analyses were used to reveal the presence of numerous MOF particles deposited onto the surfaces of layered g-C3N4 nanosheets. X-ray powder diffraction confirmed the growth of MOF particles on the g-C3N4 precursor. The chemical composition and states were characterized through Fourier-transform infrared (FT-IR) spectroscopy and X-ray photoelectron (XPS) analyses. Additionally, BET analysis indicated the presence of abundant pore structures in the MOF/g-C3N4 composite nanoparticles. Results: lastly, rheological and dielectric properties were investigated. The ER behavior demonstrated their excellent performance, with a 10 wt% mass fraction suspension of the MOF/g-C3N4-0.4 based composite material and dimethyl silicone oil exhibiting a yield stress of 300 Pa at 2 kV mm−1.
1. Introduction
The ER effect is crucial for controlling the response of materials through an electric field. Discovered by Winslow in 1947, the ER effect has garnered significant interest and remains an attractive research topic.1 An electrorheological fluid (ERF) is a suspension composed of an insulating liquid and dispersed dielectric particles and/or their composite materials.2 Depending on whether an electric field is applied or removed, this system can achieve solid–liquid phase transitions, which are quick and reversible.3–5 This implies that the ER properties of ERFs change with the external electric field. When an electric field is applied, the solid particles contained in the ER fluid will be aligned along the direction of the electric field, forming a chain-like or columnar structure. This causes the ER fluid to transition from a liquid to a solid, significantly enhancing its rheological properties. Once the electric field is removed, the ERF reverts to its original state, which is characterized by a random distribution of dispersed particles throughout the medium. With highly ordered structures and ultra-high specific energy conversion, ER fluids hold vast application prospects in the industrial fields such as clutches, dampers, and actuators.6–8 However, a series of problems such as low shear stress, poor anti-sedimentation performance, weak temperature effects and high production cost still constrain the further development of electrorheological fluids. Therefore, suitable new materials were hoped to synthesize to alleviate the above-mentioned problems.Graphitic carbon nitride (g-C3N4) is a non-metallic polymer semiconductor with a layered structure similar to graphite, exhibiting excellent chemical and thermal stability.9 It possesses a distinctive two-dimensional, non-localized, conjugated framework composed of either s-triazine or tri-s-triazine as the basic building unit, which contributes to its larger specific surface area compared to other polymer semiconductors.10,11 Additionally, carbon nitride has a moderate bandgap (Eg) of 2.7 eV, allowing for the design of materials to meet the requirements of the oxidation–reduction reaction, which can make it widely applicable in photocatalysis and antimicrobial fields.12 Moreover, it is facile to fabricate using the inexpensive precursors through a simple heat treatment. Due to its unique conductive mechanism, carbon nitride has become a potential material for preparing ERFs. However, due to the low shear stress of carbon nitride ER materials under electric field conditions, carbon nitride is not used alone in the field of ERFs. Fortunately, it is a two-dimensional material with a large specific surface area, making it easy to composite with other materials to compensate for its low shear stress.
Metal–organic frameworks (MOFs) represent a class of porous coordination polymers that resulted from the self-assembly process involving metal ions or clusters and organic ligands.13,14 They possess large pore volumes and specific surface areas, exhibiting anisotropic polyhedral morphology. In addition, significant achievements have been made in the modification of MOFs in various aspects. For example, by controlling the directional growth of MOFs into nanorods through a magnetic field, interface polarization is significantly improved. Adding end capped ligands during the crystallization process to synthesize a monodisperse polyhedral metal organic framework with a size of 5 μm also results in achieving electrical rheological properties.15–17 COFs were synthesized by Ruijing Ma et al. using a thermal cracking method at different temperatures, which not only exhibited high ER efficiency, but also demonstrated low leakage density and a wide temperature range. Covalent organic frameworks (COFs) are a class of organic materials connected by covalent bonds, which can be functionalized to create organic–inorganic hybrids. Together with MOFs, COFs are considered to be of great significance in constructing bridges between two phases in the field of electrocatalysis.18,19
As a nanomaterial with significantly lower conductivity compared to other conductive materials, MOFs meet the requirement of appropriate leakage current density in ER fluids. The lower conductivity can reduce the possibility of direct current conduction, preventing the dispersed samples from being broken down in an electric field. As the report in the literature,20 A. N. Murashkevich et al. prepared high shear stress fillers with a leakage density in the range of 20–25 μA cm−2. Moreover, the small size effect and quantum size effect of nanomaterials impart unique dielectric characteristics. Combining the 2D materials of g-C3N4 with MOFs enhances the polarization ability. Through the variation of the g-C3N4 to MOF raw material ratio, the yield strength of the final composite filler can be further influenced.21,22
The precursor of layer-like carbon nitride was first prepared via a molten calcination method, and subsequently, the MOF/g-C3N4 nanomaterials were synthesized utilizing a solvothermal technique. By altering the dosage of the precursor, the ER behavior of the MOF/g-C3N4 composite materials was adjusted, and appropriate experimental ratios were determined through ER and dielectric performance tests.
2. Experimental
2.1. Experimental materials
Sodium nitrate, melamine, and titanium butoxide (TBT) were purchased from Shanghai Maclin Biotech Co., Ltd. Anhydrous ethanol was obtained from Tianjin Fuyu Fine Chemical Co., Ltd. Acetic acid was obtained from Tianjin Yongda Chemical Reagent Co., Ltd. Benzene-1,4-dicarboxylic acid (BDC) was obtained from Shanghai Haohong Biomedical Technology Co., Ltd. Methanol, N,N-dimethylformamide (DMF), and cetyltrimethylammonium bromide (CTAB) were obtained from China National Pharmaceutical Group Corporation. Dimethyl silicone oil was obtained from Tianjin BASF Chemical Co., Ltd. The viscosity of the silicone oil is 500 ± 55 (25 °C)/(mm2 s−1), and its molecular weight is 240 kDa.The purity of the aforementioned reagents is of analytical grade (AR).
2.2. The synthesis of the g-C3N4 template
Under ambient conditions, 0.28 g of sodium nitrate and 6.24 g of melamine were thoroughly mixed and transferred into a semi-closed crucible with a lid. The crucible was subsequently positioned within a muffle furnace and subjected to heating at 500 °C for a duration of four hours. The resulting product was purified by centrifugation using anhydrous methanol and anhydrous ethanol five times to remove impurities and then it was dried in a 75 °C oven for 10 hours. The dried sample obtained was graphite-like carbon nitride.2.3. The synthesis of MOF/g-C3N4 composites
MOF/g-C3N4 based nanocomposites were synthesized using a solvothermal method. Typically, MOF/g-C3N4-0.4 was synthesized as follows: 0.4 g of obtained graphitic carbon nitride, 3.5 g of terephthalic acid, 0.7 g of cetyltrimethylammonium bromide, 10 mL of anhydrous methanol, and 65 mL of DMF were stirred for 10 minutes. Subsequently, to prevent the hydrolysis of TBT, 3.5 mL of acetic acid was introduced. After stirring for 30 minutes, 2 mL of TBT as the titanium source was added. The mixture was continuously stirred for a period of one hour before being transferred to a sealed reactor vessel. This vessel was then positioned in an oven for a solvothermal reaction, conducted at 150 °C for a duration of 24 hours. The product obtained was washed with DMF, methanol, and ethanol to remove impurities. Then, the final product was obtained through drying treatment. The content ratio of g-C3N4 to MOF in the final composite filler MOF/g-C3N4-0.4 is 0.35 w/w. The obtained product was denoted as MOF/g-C3N4-x, where x represents the mass of g-C3N4 added. Samples with different levels of carbon nitride (0.15 g, 0.2 g, and 0.3 g) were synthesized using the same method and labeled as MOF/g-C3N4-0.15, MOF/g-C3N4-0.2 and MOF/g-C3N4-0.3, respectively.2.4. Preparation of MOF/g-C3N4 ER suspension
The dimethyl silicone oil was dried in an oven at 75 °C for 6 hours and thoroughly mixed with the sample from the previous step to prepare an ERF with a mass fraction of 10 wt%.22,232.5. Characterization
The characterization of the obtained samples involved examining their microstructure, compositional structure, and constituent chemical elements through the application of the subsequent methodologies.The microstructure of the experimental samples was analyzed using field emission scanning electron microscopy (SEM, JSM-6700F, accelerating voltage of 20 kV) and transmission electron microscopy (TEM, JSM-F200, accelerating voltage of 200 kV). A dynamic light scattering instrument (Zetasizer Nano ZS) was used to test particle size distribution by the physical phenomenon of laser scattering caused by particles. The crystal structure of the experimental samples was determined using X-ray diffraction (XRD, D/Max-2500/2500PC, λ = 0.154056 nm). An analysis was conducted using nitrogen adsorption–desorption apparatus to examine the pore volume, pore size, and surface area of the samples (BET, Micromeritics, ASAP 2020). Fourier transform infrared spectroscopy (FT-IR, Nicolet IS10) was employed to identify the chemical functional groups and molecular bonds in the samples. X-ray photoelectron spectroscopy (XPS, ESCALAB XI+) was utilized to analyze the chemical states and compositions of elements within a 10 nm depth from the sample surface.
The ER fluid was subjected to rheological property testing using a HAKKE RheoStress 6000 rheometer. The capacitor plates of the rheometer possess a diameter measuring 3.5 cm, with a separation distance of 1 mm. An ER fluid with a concentration of 10 weight percent (wt%) was placed between the high-voltage electrodes. During the CSR experimentation, the ER fluid was measured at different voltages with a growth rate of 0.5 kV until the sample is broken down. As the shear rate increases, the corresponding values of strong shear stress and shear viscosity are obtained. During the CSS experiment process, the applied voltage range is 0–2 kV, the rate variation curve is obtained by gradually increasing the shear stress. To determine the dielectric parameters of the ER fluids, frequency-dependent measurements were conducted using a variable frequency dielectric spectrometer (Novo-control Concept 40), with the frequency ranging from 10−1 to 107 Hz.
3. Results and discussion
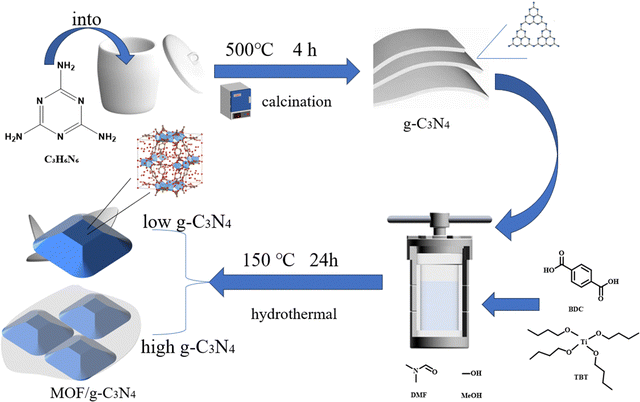
The synthesis method of MOF/g-C3N4-based nanocomposite particles is depicted in Fig. 1, which involves a two-step process. Initially, layer-like carbon nitride was prepared using a melt-calcination method. Subsequently, a MOF/g-C3N4 composite was synthesized using a solvothermal method at 150 °C. Finally, MOF/g-C3N4 nanocomposite particles were obtained through washing and drying.As depicted in Fig. 2, the morphological features of MOF/g-C3N4 and MOF particles were characterized using SEM and TEM techniques. The morphology of the MOF particles appeared approximately spherical in shape, while their sizes are mostly between 200 and 500 nm (Fig. 2a and b). As obtained from the TEM images of Fig. 2(c) and (d), the morphology of pure MOF nanoparticles is consistent with that of the SEM images. And an irregular porous structure can be found. Metal–organic framework (MOF) nanoparticles were prepared and then the material's specific surface area was significantly increased.
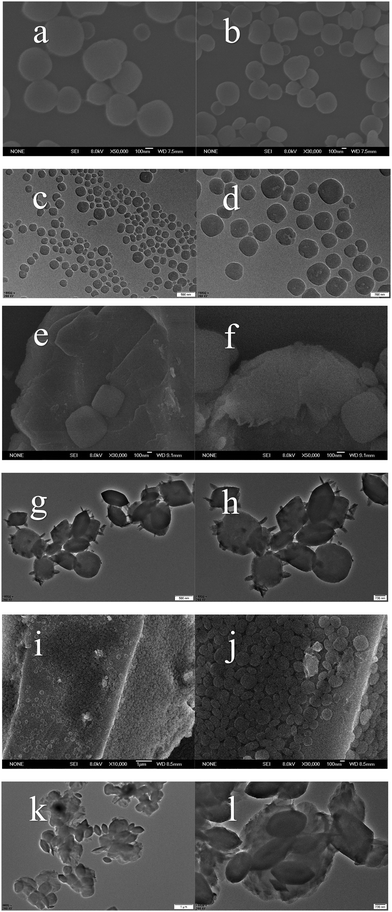 | ||
| Fig. 2 SEM and TEM images of MOF (a, b) and (c, d), MOF/g-C3N4-0.15 (e, f) and (g, h) and MOF/g-C3N4-0.4 (i, j) and (k, l). | ||
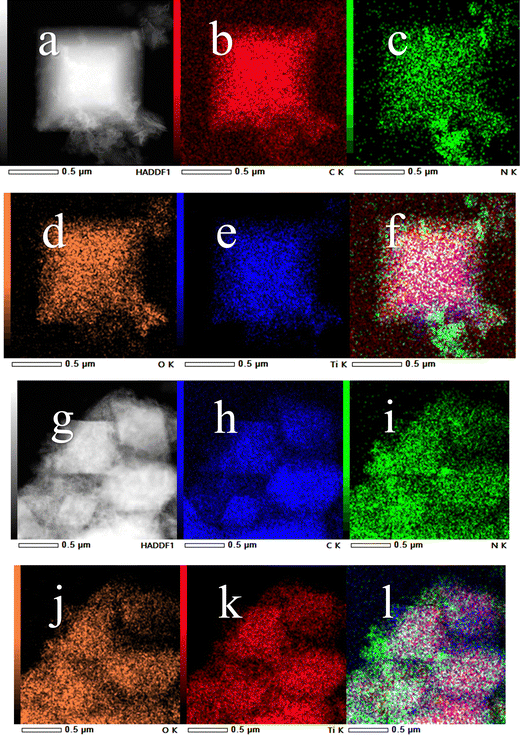
In Fig. 2(e)–(l), a distinctive composite structure is evident, where numerous MOF particles stably hybridized with carbon nitride nanosheets. As shown in Fig. 2(g) and (h), rod-like or needle-like g-C3N4 particles appeared on the surface of MOF nanoparticles. Due to the larger surface area and interaction force, it is shown that the 2D layered structure of g-C3N4 can be loaded or hybrid with MOF nanoparticles. Furthermore, the MOF particles in composite materials still retained their pore structure, providing a larger specific surface area and effectively enhancing the interfacial polarization ability, thereby improving the ER performance. The level of carbon nitride doping during the preparation process can affect the morphological development of MOFs in composite materials. For the pure MOF, it can be seen that its surface is smooth. From the above TEM images, the MOF/g-C3N4 nanoparticles showed a distinctive morphology (Fig. 2g and h) compared to that of MOFs. When a small amount of carbon nitride is added, g-C3N4 forms needle-like or rod-like g-C3N4 structures loaded on the surface of the MOF; when the amount of added carbon nitride is increased, it was found that in addition to the structure shown above, there was also a carbon nitride layer structure covering several MOF particles, as shown in Fig. 2(k) and (l). In Fig. 4, the elemental distribution in the sample of MOF/g-C3N4 is shown, confirming the perfect combination of MOFs (mainly as C, O, and Ti) with g-C3N4 (as C and N). The elemental mapping of MOF/g-C3N4-0.15 (a)–(f) and MOF/g-C3N4-0.4 (g)–(l) reveals the loading of g-C3N4 on the surface of MOF particles. In addition, the mapping also proves the existence of two different structures.
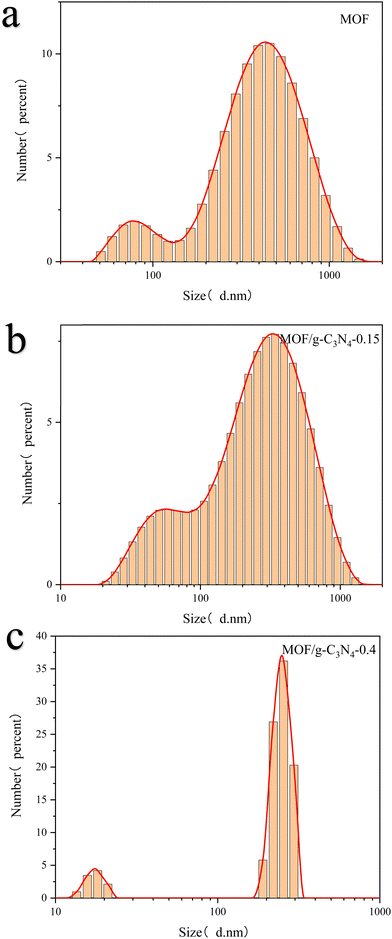
Particle size distribution analysis was conducted on both pure MOF and composite particles (Fig. 3). The particle size of pure MOFs is mostly around 470 nm, while the particle size of MOFs with 0.15 g of carbon nitride added is mostly 350 nm, and the particle size of MOFs with 0.4 g of carbon nitride added is mostly 250 nm. It can be inferred that the addition of carbon nitride in the next solvothermal synthesis will affect the formation of MOFs, manifested as a reduction in the size of the MOF particles.
The crystal structures of MOF, MOF/g-C3N4 and g-C3N4 were analyzed using an XRD technique (Fig. 5a). The diffraction pattern of the synthesized MIL-125 (MOF-Ti) exhibited diffraction peaks at 2θ = 6.7°, 9.7°, 11.6°, 14.9°, 15.3°, 16.6°, 17.9°, and 19.5°, consistent with the previously reported peaks for MIL-125 (Ti). The successful synthesis of MOF nanoparticles and their successful hybridization with g-C3N4 are proved.24,25 The diffraction peaks of graphite-like nitrogen-doped carbon appear at distinct angles of 2θ = 12.7° and 27.3°, corresponding to the characteristic peaks of (100) and (002) conjugated aromatic planes.26,27 Carbon nitride was also subjected to hydrothermal treatment at the same temperature and pressure without the introduction of MOF, and its scattering spectra were obtained. It was found that there was not much difference compared to the previous curve (Fig. S2, ESI†). The results indicate that the solvothermal method did not affect the structure of carbon nitride. In addition, when the content of carbon nitride is low (e.g. MOF/g-C3N4-0.15, MOF/g-C3N4-0.2), the strong scattering property of MOF makes the characteristic peak of carbon nitride invisible. After the increase of carbon nitride content (e.g. MOF/g-C3N4-0.5), the presence of carbon nitride affects the growth of MOF, making its characteristic peaks observable in the composite material. Further observation of the SEM image of MOF/g-C3N4-0.6 revealed a large number of amorphous TiO2 particles (Fig. S1, ESI†). The reason for this is that a large number of nitrogen-doped carbon particles affect the formation of MOFs. During the reaction stage, TBT is first hydrolyzed to generate TiO2 particles, resulting in very little MOF formation. As a result, the characteristic peaks of MOF particles are not visible. The diffraction peaks of the MOF/g-C3N4 composite particles showed no significant shift in position but exhibited a slight decrease in peak intensity. This suggests that the fundamental framework of MIL-125 (Ti) remained without the significant disruption.
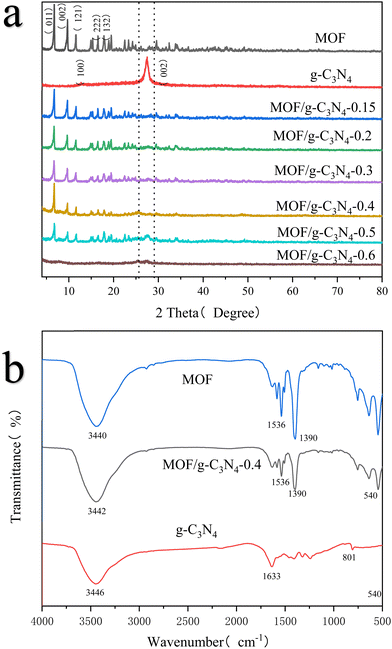 | ||
| Fig. 5 XRD patterns of MOF, MOF/g-C3N4 composites and g-C3N4 nanoparticles (a) and FT-IR spectra of MOF, MOF/g-C3N4-0.4, and g-C3N4 (b). | ||
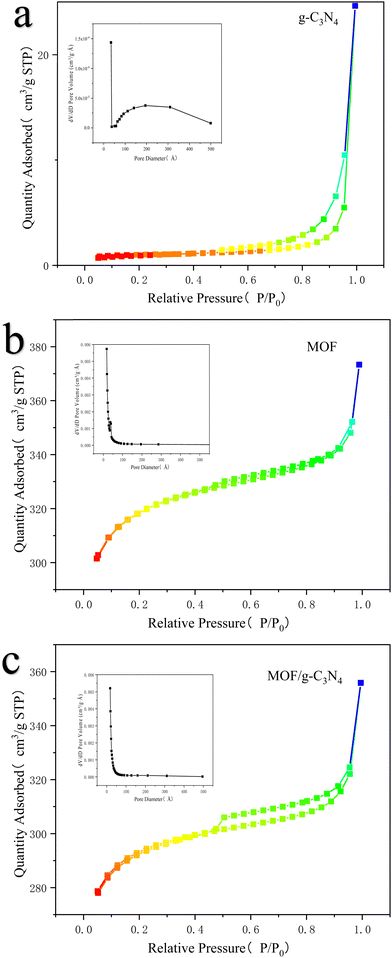
In order to analyze the pore size distribution of g-C3N4, MOF and MOF/g-C3N4-0.4 based nanomaterials, BET analysis was performed along with using adsorption/desorption isotherms. The adsorption–desorption isotherm of MOF and MOF/g-C3N4-0.4-based nanomaterials exhibited type IV isotherms (Fig. 6). This indicates that these are mesoporous materials. The calculated specific surface area of MOF/g-C3N4 using the t-plot algorithm was 897.00 m2 g−1, with a pore volume of 0.54 cm3 g−1, and an average pore diameter of approximately 2.4 nm. In addition, the t-plot algorithm indicates that the specific surface areas of g-C3N4 and MOF are 3.25 and 942.46 m2 g−1, respectively, and the pore sizes are 42 and 5.20 nm, respectively.
FTIR technology was used to analyze the molecular information and functional groups of nanoparticles (Fig. 5b). For pure carbon nitride, characteristic peaks appeared at 801 cm−1 corresponding to the stretching vibration of the N–(C)3 or C–NH–C triazine derivative, the peak at 1230–1700 cm−1 indicated the hybridized stretching vibrations of C–N bonds, and 3446 cm−1 associated with stretching vibrations of N–H bonds.28,29The peaks related to O–Ti–O vibrations both of MOF and MOF/g-C3N4 composite particles were observed in the range of 500–800 cm−1. A peak at 1390 cm−1 indicated bending vibrations of –CH groups, while peaks near 1536 cm−1 were due to asymmetric vibrations of carboxylic acids. The broad peak around 3440 cm−1 was associated with stretching vibrations of –OH and –NH groups.30,31 Comparison of the characteristic peaks of MOF/g-C3N4-0.4 with those of MOF particles revealed a decrease in peak intensities for various peaks, indicating changes in the molecular environment or interactions within the composite structure.
Through XPS technology, the chemical states and electronic interactions among MOF/g-C3N4-0.4, g-C3N4, and MOF were investigated (Fig. S3, ESI†). Spectra of carbon (C), nitrogen (N), oxygen (O), and titanium (Ti) were observed in the measured spectra of MOF/g-C3N4 composite particles. Fig. S3b (ESI†) displays the high-resolution C 1s spectrum pertaining to MOF/g-C3N4-0.4, and three peaks were identified at 284.8 eV, 286.41 eV, and 288.61 eV, attributed to the sp3 hybridization of C–C bonds, sp2 hybridization of C![[double bond, length as m-dash]](https://www.rsc.org/images/entities/char_e001.gif) N bonds, and carbon (–COO) on carboxylic acid groups, respectively. A slight degree of offset compared to the corresponding peaks in MOF spectra was noted, which indicated the interactions between carbon nitride species and MOF particles. In the N 1s spectrum of g-C3N4 (Fig. S3c, ESI†), two peaks corresponding to sp2 hybridized orbitals were observed: C–N
N bonds, and carbon (–COO) on carboxylic acid groups, respectively. A slight degree of offset compared to the corresponding peaks in MOF spectra was noted, which indicated the interactions between carbon nitride species and MOF particles. In the N 1s spectrum of g-C3N4 (Fig. S3c, ESI†), two peaks corresponding to sp2 hybridized orbitals were observed: C–N![[double bond, length as m-dash]](https://www.rsc.org/images/entities/char_e001.gif) C within the triazine ring (398.36 eV) and N bonding with H atoms in C–N–H (400.65 eV). Spectra of O 1s (Fig. S3d, ESI†) in both MOF/g-C3N4 and MOF exhibited two typical peaks at 528.85 eV and 531.49 eV attributed to the lattice oxygen in MOF and atomic bonding of –C
C within the triazine ring (398.36 eV) and N bonding with H atoms in C–N–H (400.65 eV). Spectra of O 1s (Fig. S3d, ESI†) in both MOF/g-C3N4 and MOF exhibited two typical peaks at 528.85 eV and 531.49 eV attributed to the lattice oxygen in MOF and atomic bonding of –C![[double bond, length as m-dash]](https://www.rsc.org/images/entities/char_e001.gif) O with oxygen, respectively.32,33 The spectrum of Ti 2p (Fig. S3e, ESI†) in the material depicted Ti's spin-split peaks, indicating the presence of Ti4+ in MOF (Ti). Weak shifts in peak values of composite particles compared to MOF further demonstrated interactions between MOF and g-C3N4 atoms.
O with oxygen, respectively.32,33 The spectrum of Ti 2p (Fig. S3e, ESI†) in the material depicted Ti's spin-split peaks, indicating the presence of Ti4+ in MOF (Ti). Weak shifts in peak values of composite particles compared to MOF further demonstrated interactions between MOF and g-C3N4 atoms.
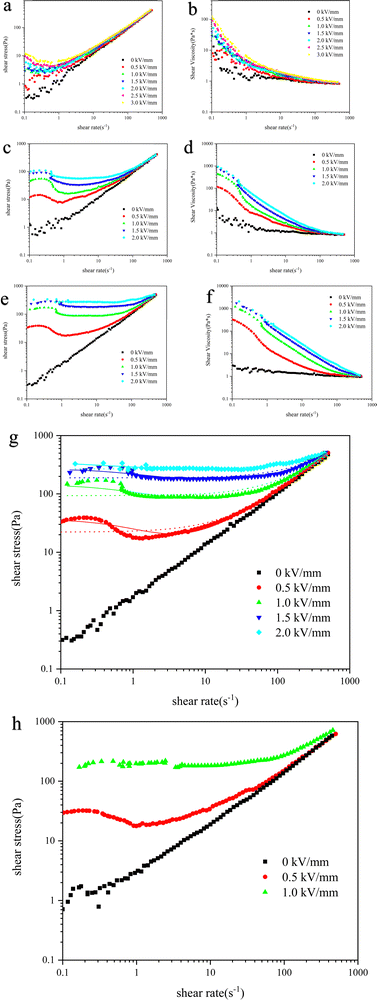
The obtained MOF/g-C3N4 composite material was uniformly dispersed in silicone oil to prepare a 10 wt% ER fluid. The composite particles were thoroughly ground to ensure uniform dispersion in dimethyl silicone oil. The ER performance of MOF/g-C3N4 was evaluated using a torque rheometer as shown in Fig. 7 and Fig. S4 (ESI†). The initial voltage was set at 0 kV mm−1 and increased at a rate of 0.5 kV mm−1 until reaching 2.0 kV mm−1. As shown in Fig. 7(a) and (b), the g-C3N4 suspension exhibits a weak ER effect; however, the composite particles formed after hybridization with MOF demonstrate the excellent ER properties. T. Plachy et al. reported an ER fluid based on g-C3N4 particles.34 In the experiment, the g-C3N4 fluid exhibited a negative ER effect, which is different from the ER performance shown in this work. On the one hand, the synthesis process of carbon nitride varies. On the other hand, under the condition of an electric field, the nitrogen-doped carbon in the previous work only exhibited electrophoretic phenomena without forming a chain structure. The carbon nitride studied in this article exhibits a weak chain structure under electric field conditions (Fig. 8a). By combining with two-dimensional materials with a large specific surface area, the carrier concentration is enriched, and the interfacial polarization ability is improved, thus the ER behavior is enhanced.35 By altering the dosage of the precursor, the shear stress of the materials was adjusted, and appropriate experimental ratios were determined as shown in Fig. S4 (ESI†) and Fig. 7. The experimental data show that MOF/g-C3N4-0.4-based nanocomposites have both high shear stress and a stable platform region. As shown in Fig. 7(e), the MOF/g-C3N4-0.4 composite field exhibited Newtonian fluid characteristics in the absence of an external field. The shear stress–shear rate curves of the ER fluid based on MOF/g-C3N4-0.4 indicated a significant increase in shear stress upon applying the electric field. At elevated field intensities, the initial shear stress was also larger, but the increase in the stress initial value gradually slowed with increasing field strength. For a comparison, a pure MOF suspension was studied and the results are shown in Fig. 7c(shear stress) and d(shear viscosity). It can be seen that the MOF/g-C3N4 suspension showed better ER behavior than that of the pure MOF suspension, wherein the composite of MOF and g-C3N4 can improve the ER activities as shown in Fig. S4a, c and e (ESI†).
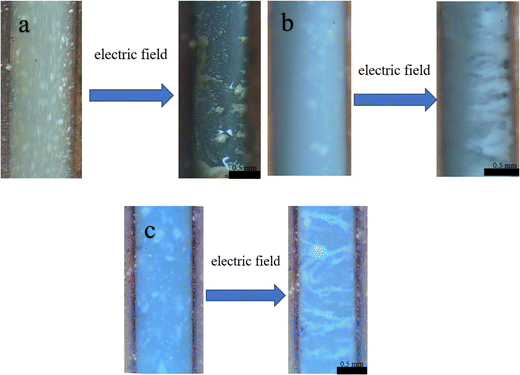 | ||
| Fig. 8 Macroscopic images of g-C3N4 (a), MOF (b) and MOF/g-C3N4-0.4 (c) based nanocomposite particles under high-magnification microscopy. | ||
Under the applied electric fields, the ER curve of the ERF gradually forms a plateau region. With increasing electric field strength, the stable region advanced gradually and its intensity increased progressively. This phenomenon arises from the gradual formation of a certain chain-like or column-like structure within the system under the influence of the external electric field, while the chain structures formed at higher field strengths, developing faster and exhibiting greater anti-shear strength. At high shear rates, the electrorheological fluid exhibits an increase in shear stress due to the high mechanical shear forces induced by the high shear rate, which disrupted the chain-like structure formed under the electric field, thereby disrupting the equilibrium within the system and leading to an increase in shear stress.
In electrorheology, normally, the shear stress–shear rate curve can be roughly divided into three forms of trends. One is “rising first and then falling”, similar to pure MOF ER behavior. It has weak shear stress and is easily damaged by hydrodynamic forces. The second type is a longer platform area, similar to the ER curves of MOF/g-C3N4-0.4. The generation of this curve is due to the dynamic equilibrium between the shear stress generated by the polarization of the dispersed particles and the destruction of hydrodynamic force. The third type is a slow rising curve, similar to the MOF/g-C3N4-0.15 ER curves (Fig. S4a and b, ESI†). This is due to the complex polarization behavior in the composite material. When a voltage is applied, a portion will polarize first, while the rest will slowly polarize, then showing an upward trend.
Dimethyl silicone oil, as a continuous phase in ERFs, exhibits strong physical and chemical stability to ensure that it does not decompose or undergo chemical reactions under high electric field strength. 10 wt% concentration is a commonly used concentration in the ER test. At this lower concentration, it can better reflect the ER performance of the material.36 For the 10 wt% MOF/g-C3N4 ER suspension, the leaking current is around 1 mA at 2 kV mm−1, indicating relatively high conductivity. Under high concentration conditions, such as 20 wt%, the ER behavior was studied and is shown as follows. The shear stress vs. shear rate curve at 20 wt% particle concentration is shown in Fig. 7(h). It can be seen that the external electric field strength can only be applied at 1 kV mm−1 due to high leaking current. The high particle concentration leads to high leaking current and breakdown occurs at lower electric field strength.
In the absence of an external electric field, the variation in shear viscosity with respect to the rate is minimal. In the presence of an electric field, there is a noticeable increase in the initial value of shear viscosity, accompanied by shear-thinning behavior.
In order to define the functional relationship between shear stress (τ) and apparent viscosity (η), the researchers propose a simple Bingham fluid model, where the shear stress at zero field is obtained by the extrapolation from the graph,37 expressed by eqn (1):
τ = τy + η![[small gamma, Greek, dot above]](https://www.rsc.org/images/entities/i_char_e0a2.gif) | (1) |
The fitted shear stress–shear rate curves of MOF/C3N4-0.4-based materials analyzed through the Bingham fluid model are represented by the dashed lines in Fig. 7(g). However, this model cannot explain the phenomenon of shear stress increasing first and then decreasing in the curve with the increase of shear rate. Therefore, another useful Cho Choi Jhon (CCJ) model was adopted to analyze the curve.38,39 It comprises six parameters: yield stress (τ0), shear viscosity (η∞), time parameters (t1, t2), and exponents (α, β). Formula (2) is given as follows:
 | (2) |
The shear stress curves of MOF/g-C3N4-based materials determined by CCJ analysis are depicted by solid lines in Fig. 7(g) and the relevant fitting parameters are presented in Table 1. Under the measurement conditions of 1.5 kV mm−1 and 2.0 kV mm−1, there is not much difference in the curves fitted by the two models. But at low electric field strength, it can be seen that the CCJ model fits the curve better, so the CCJ model is more in line with the actual tested ER behavior.
| Electric field strength [kV mm−1] | |||||
|---|---|---|---|---|---|
| Model | Parameter | 0.5 | 1.0 | 1.5 | 2.0 |
| Bingham | τ 0 (Pa) | 22.15 | 93.49 | 188.78 | 268.82 |
| η | 0.96 | 0.80 | 0.63 | 0.52 | |
| CCJ | τ 0 (Pa) | 34.12 | 75.98 | 111.25 | 554.67 |
| t 1 | 1 | 1 | 0.86 | 1 | |
| α | 1 | 1 | 1 | 0.17 | |
| η ∞ | 0.94 | 0.91 | 0.72 | 0.26 | |
| t 2 | 0.07 | 1.33 × 10⁻² | 4.58 × 10⁻³ | 5.47 × 10⁻⁴ | |
| β | 0.74 | 1 | 1 | 0.51 | |
Fig. 8 shows the macroscopic morphology of fluids under both applied electric and no electric field conditions for three ERFs. In the absence of an electric field, dispersed phase particles are uniformly distributed in silicone oil. Upon the application of an electric field, the particles comprising the dispersed phase within both MOF and MOF/g-C3N4 fluids undergo migration, aligning with the direction of the imposed electric field, ultimately forming a “chain bridge” structure (Fig. 8b and c). The augmentation of shear stress in an ER fluid, under the influence of an external electric field, is attributed to the presence of this particular structure. However, the carbon nitride suspension exhibits weak ER characteristics. Its chain-like structure is not clearly formed and the dispersed phase particles just gather towards both ends after being electrified (Fig. 8a).
In order to obtain the static yield stress, the CSS model was used to study the shear rate–shear stress relationship. As shown in Fig. S5a (ESI†), the CSS flow curves were investigated under the application of an electric field with an enhancing and controlling shear stress. The static yield stress has been obtained from such curves as the shear stress at which a clear jump in shear rate can be observed. To further investigate the ER effect, CSS and CSR models were used to measure the data.40 Three repeated measurements on the samples were conducted in both CSS and CSR models to see the reproductivity and check the error of the obtained shear stress, as shown in the following figures (Fig. S5b and c, ESI†). From this, shear stress and yield stress accompanying their errors can be obtained. It can be seen that the curves in the CSR model have good repeatability and so the error bar is smaller than that of the CSS model, while the curves in the CSS model have some slight differences. Therefore, the CSR model is more suitable for analyzing the ER performance of samples.
Fig. 9a illustrates the influence of the electric field intensity on the yield stress of the MOF/g-C3N4-based ER fluid. The relationship between them is analyzed using CSR and CSS models, where the yield stress (τy) is related to the electric field intensity (E) through the formula, which includes the exponent factor (a). The yield stress was extrapolated from the electrorheological curve.
| τy ∝ Ea | (3) |
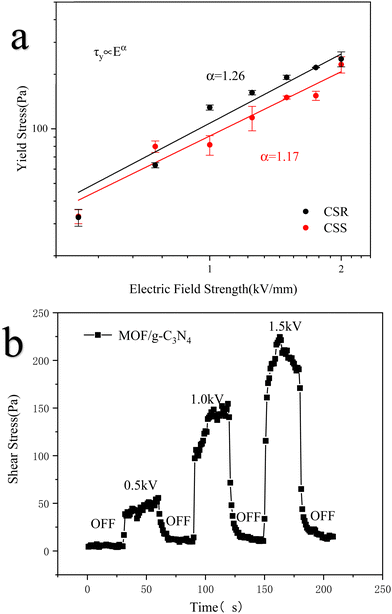 | ||
| Fig. 9 Yield stress curves of MOF/g-C3N4 composites in CSR and CSS models (a) and the ON–OFF curve of the MOF/g-C3N4-0.4-based ERF (b). | ||
The value of “a” in the equation determines the model form of the electrorheological fluid. When the value of “a” approaches 1.5, the ER fluid belongs to the conductivity model; when the value of “a” approaches 2, the ER fluid belongs to the molecular polarization model. The yield stress was tested in both CSS and CSR models, and the obtained data were fitted. The resulting curves are shown in Fig. 9a. After linear fitting of the data, the “α” values calculated for the CSR and CSS models were 1.26 and 1.17, respectively, indicating that this ER fluid belongs to the conductivity model.
A HAKKE electro-rheometer was used to detect the switching effect of ER materials by periodically applying and removing an electric field to the sample at a constant shear rate of 1 s−1 with intervals of 30 data points to obtain the relationship curve, thus analyzing the sensitivity of materials under the external electric field. With and without an electric field, the shear stress response was quick. During the ER test, we simultaneously recorded the current data generated at different electric field strengths. As observed in Table 3, when the applied electric field strength is 2 kV mm−1, the generated leaking current has exceeded the measurement limit (1 mA). In other words, the test sample has been broken down. The shear stress obtained at this time is inaccurate, so it cannot measure the response values of 2 kV mm−1 and subsequent electric field strength. As depicted in Fig. 9b, the switch effect curve of the MOF/g-C3N4-based ER fluid is obtained by periodically applying and withdrawing the electric field to the sample at an invariable shear rate. The shear stress changes of the ER fluid at three electric field strengths of 0.5 kV mm−1, 1 kV mm−1, and 1.5 kV mm−1 were recorded in the figure. The MOF/g-C3N4-based ER fluid demonstrates a rapid response and achieves a specific shear stress when applying an electric field. After removing the electric field, the shear stress rapidly reduced to the zero-field value.
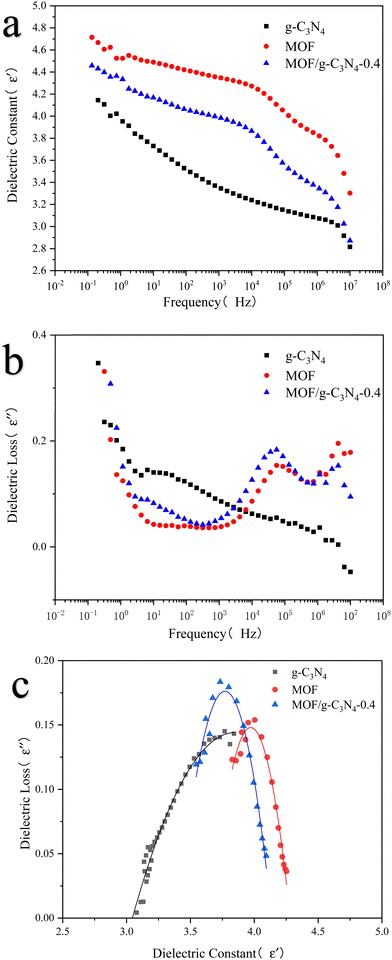
The dielectric curve of the ER fluid, along with its Cole–Cole curve model,41 is depicted in Fig. 10. The dielectric performance is explored in relation to the ER effect through the analysis of the dielectric curve, as detailed in formula (4).
 | (4) |
Here, ε′ and ε′′ respectively denote the dielectric constant and dielectric loss, where Δε = ε0 − ε∞ represents the difference in dielectric constants, with ε0 and ε∞ denoting the dielectric constants at frequencies close to 0 and frequencies close to infinity, respectively. λ refers to the corresponding relaxation time, expressed as  , where fmax is the frequency corresponding to the dielectric loss peak, and “a” represents the relaxation time distribution factor. These parameters characterize the dielectric properties of the MOF/g-C3N4 composite ER fluid.
From Table 2, it can be seen that the MOF/g-C3N4 composite material has a larger Δε, indicating that a stronger chain structure is generated under the influence of an electric field. The composite of MOF and g-C3N4 makes the interface of the composite filler complex. The combination of the two highly active materials enriches the interface polarization of nanoparticles. Furthermore, the new interface between them further increases the interface polarization ability of nanoparticles, resulting in a larger Δε of the composite filler. As is known, slow polarization, especially interfacial polarization, is useful to enhance the ER effect. It can be seen that a strong loss peak appeared at 5.62 × 10⁴ Hz within the range of 102–105 Hz, which means a stronger interfacial polarization. The second loss peak appears in a high frequency range of 106–107 Hz, which has a weak peak due to the complex composite structure of the material.42,43 The calculated relaxation time is 2.83 × 10⁻⁶ s, indicating that the transformation of the ER fluid is extremely rapid upon the application or removal of the electric field. The addition of carbon nitride enhances the dielectric interface polarization of composite materials to a certain extent and improves the ER properties. Furthermore, the frequency dependence of real and imaginary conductivity spectra was also observed as shown in Fig. S6a and b (ESI†). The real imaginary conductivity (σ′) shows that the dielectric conductivity (σ′) of the MOF/g-C3N4 composite mainly originates from the MOF matrix, while the contribution of g-C3N4 is small.
| Sample | ε 0 | ε ∞ | Δε | f max (Hz) | λ (s) |
|---|---|---|---|---|---|
| MOF | 4.61 | 3.28 | 1.33 | 5.62 × 10⁴ | 2.83 × 10⁻⁶ |
| g-C3N4 | 4.15 | 2.88 | 1.27 | — | — |
| MOF/g-C3N4-0.4 | 4.55 | 3.04 | 1.51 | 5.62 × 10⁴ | 2.83 × 10⁻⁶ |
Moreover, conductivity is also a crucial factor influencing the ER effect, as the magnitude of conductivity affects the polarization rate and conductivity mismatch of the ER fluid.44 Typically, conductivity (δ) is determined by the ratio of current density (j) to electric field intensity (E), expressed as δ = j/E. During the previous rheological measurements, the leaking current values of MOF and MOF/g-C3N4 were recorded under different voltages, and the calculated conductivity is presented in Table 3 below. According to relevant studies, when the material exhibits a conductivity approximately in the range of 10−9 S cm−1, it exhibits strong interfacial polarization capability, thereby demonstrating excellent ER effects. As observed in Table 3, MOF/g-C3N4 demonstrates desirable conductivity, confirming its remarkable ER properties.
| Sample | E (kV mm−1) | I (μA) | j (μA cm−2) | δ (S cm−1) |
|---|---|---|---|---|
| MOF/g-C3N4-0.15 | 0.5 | 50 | 5.20 | 1.04 × 10⁻⁹ |
| 1 | 290 | 30.14 | 3.01 × 10⁻⁹ | |
| 1.5 | 850 | 88.35 | 5.89 × 10⁻⁹ | |
| 2 | >1000 | |||
| MOF/g-C3N4-0.2 | 0.5 | 20 | 2.08 | 4.16 × 10⁻¹⁰ |
| 1 | 110 | 11.43 | 1.14 × 10⁻⁹ | |
| 1.5 | 510 | 53.00 | 3.53 × 10⁻⁹ | |
| 2 | >1000 | |||
| MOF/g-C3N4-0.3 | 0.5 | 30 | 3.12 | 6.23 × 10⁻¹⁰ |
| 1 | 190 | 19.75 | 1.98 × 10⁻⁹ | |
| 1.5 | 610 | 63.40 | 4.23 × 10⁻⁹ | |
| 2 | >1000 | |||
| MOF/g-C3N4-0.4 | 0.5 | 40 | 4.16 | 8.32 × 10⁻¹⁰ |
| 1 | 150 | 15.59 | 1.56 × 10⁻⁹ | |
| 1.5 | 460 | 47.81 | 3.19 × 10⁻⁹ | |
| 2 | >1000 |
The dried MOF/g-C3N4-based nanomaterial and MOF-based nanomaterial are uniformly mixed with silicone oil at a mass ratio of 10%. The density of silicone oil is 0.966–0.974 (25 °C, g cm−3), and the density of the MOF/g-C3N4-0.4 filler measured using the specific gravity bottle method is found to be 1.2 g cm−3. The obtained ERFs were placed in a 5 mL graduated cylinder. After several days of observation and measurement, the sedimentation volume was determined, as shown in Fig. S7 (ESI†). The data indicate excellent anti-settling performance of the MOF/g-C3N4 suspension, with a particle sedimentation rate of 2%. Pure MOF and MOF/g-C3N4 composite ERF achieved stability and no longer sinking can be observed after 400 h and 200 h, respectively. This is attributed to the porous structure and small particle density of MOF/g-C3N4, facilitating the infiltration of dimethyl silicone oil, thus enhancing sedimentation resistance. The porous structure endows the material with a high surface area, resulting in elevated interfacial polarization under external field strength.45 The shear stress would be decreased accompanied with the sedimentation of dispersed particles. Excellent anti settling performance is one of the conditions to ensure the reusability of ER fluids for the industrial application. In a short duration, the dispersed phase of the ER fluids undergoes anti-sedimentation and does not undergo agglomeration, and re-shearing the ER fluid will not reduce its shear stress and response speed. The better the anti-settling property of the ER fluids, the more stable the ER system. Both pure MOF and MOF/g-C3N4 composite material ERF have good anti settling properties.
4. Conclusion
MOF/g-C3N4 composite nanoparticles were prepared using a solvothermal method, which involves loading MOF nanoparticles with layer-like carbon nitride. The rheological and dielectric properties of MOF/g-C3N4-based nanocomposites were studied by dispersing in silicone oil. This design not only endows the composite particles with a large specific surface area and low density of MOF particles but also enriches the layered structure and interfacial polarization, thereby enhancing the ER behavior of the material. Through comparative experiments on different component ratios, it was found that when the content of carbon nitride is 0.4 g, the MOF/g-C3N4-based composite not only shows good ER performance but also has high sensitivity to electric fields and good anti settling properties, which can satisfy the shear stress requirements for long-term use in practical applications. The analysis of the ER effect reveals its outstanding performance, with a maximum shear stress of 300 Pa at a particle concentration of 10 wt%. In the analysis of dielectric properties, larger Δε and a stronger dielectric loss peak are observed in the MOF/g-C3N4-based nanocomposite suspension. In conclusion, the MOF/g-C3N4-based nanocomposite material shows promising prospects as an ER material.Data availability
The data presented in this article (e.g., in figures or tables) are available at https://doi.org/10.1039/d4sm01247j).Conflicts of interest
There are no conflicts to declare.Acknowledgements
This work was supported by the Shandong Provincial Natural Science Foundation (Grant No. ZR2019MEM051).References
- P. Sheng and W. Wen, Electrorheological fluids: mechanisms, dynamics, and microfluidics applications, Annu. Rev. Fluid Mech., 2012, 44, 143–174 CrossRef.
- M. Eshaghi, R. Sedaghati and S. Rakheja, Dynamic characteristics and control of magnetorheological/electrorheological sandwich structures: a state-of-the-art review, J. Intell. Mater. Syst. Struct., 2016, 27(15), 2003–2037 CrossRef CAS.
- M. Mrlik, M. Cvek and J. Osicka, et al., Surface-initiated atom transfer radical polymerization from graphene oxide: A way towards fine tuning of electric conductivity and electro-responsive capabilities, Mater. Lett., 2018, 211, 138–141 CrossRef CAS.
- W. L. Zhang, Y. D. Liu and H. J. Choi, Field-responsive smart composite particle suspension: materials and rheology, Korea-Australia Rheol. J., 2012, 24, 147–153 CrossRef.
- B. Xue, F. He and Q. Lei, et al., Electrorheology and dielectric polarization of backbone, pendant and cross-linked poly (ionic liquid) s, Polymer, 2022, 241, 124559 CrossRef CAS.
- Y. D. Liu and H. J. Choi, Recent progress in smart polymer composite particles in electric and magnetic fields, Polym. Int., 2013, 62(2), 147–151 CrossRef CAS.
- K. Zhang, Y. D. Liu and H. J. Choi, Surfactant effect on functionalized carbon nanotube coated snowman-like particles and their electro-responsive characteristics, Mater. Res. Bull., 2012, 47(10), 2752–2755 CrossRef CAS.
- Y. Liang, D. Huang and X. Zhou, et al., Efficient electrorheological technology for materials, energy, and mechanical engineering: From mechanisms to applications, Engineering, 2022, 24, 151–171 CrossRef.
- Z. Cui, H. Yang and X. Zhao, Enhanced photocatalytic performance of g-C3N4/Bi4Ti3O12 heterojunction nanocomposites, Mater. Sci. Eng., B, 2018, 229, 160–172 CrossRef CAS.
- S. Wang, L. Wang and H. Cong, et al., A review: g-C3N4 as a new membrane material, J. Environ. Chem. Eng., 2022, 10(4), 108–189 Search PubMed.
- L. Yu, T. Xuecai and W. Yeyu, et al., Two-dimensional nanomaterial g-C3N4 in application of electrochemiluminescence, Prog. Chem., 2021, 34(4), 898 Search PubMed.
- J. Qie, M. Li and L. Liu, et al., Research of photocatalyst g-C3N4 using first principles, Prog. Chem., 2016, 28(10), 1569 CAS.
- S. N. Kim, J. Kim and H. Y. Kim, et al., Adsorption/catalytic properties of MIL-125 and NH2-MIL-125, Catal. Today, 2013, 204, 85–93 CrossRef CAS.
- N. D. Mcnamara, G. T. Neumann and E. T. Masko, et al., Catalytic performance and stability of (V) MIL-47 and (Ti) MIL-125 in the oxidative desulfurization of heterocyclic aromatic sulfur compounds, J. Catal., 2013, 305, 217–226 CrossRef CAS.
- Y. D. Liu, J. Kim and W. S. Ahn, et al., Novel electrorheological properties of a metal–organic framework Cu 3 (BTC) 2, Chem. Commun., 2012, 48(45), 5635–5637 RSC.
- N. Yanai, M. Sindoro and J. Yan, et al., Electric field-induced assembly of monodisperse polyhedral metal–organic framework crystals, J. Am. Chem. Soc., 2013, 135(1), 34–37 CrossRef CAS PubMed.
- F. Cheng, A. J. Young and J. S. G. Bouillard, et al., Dynamic electric field alignment of metal–organic framework microrods, J. Am. Chem. Soc., 2019, 141(33), 12989–12993 CrossRef CAS PubMed.
- R. J. Ma, W. Y. Nie and Y. D. Wang, et al., Mixed Ionic-Electronic Covalent Organic Frameworks as a Platform for High-Performance Electro-Responsive Smart Materials, Chem Mater., 2024, 36(14), 6961–6972 CrossRef CAS.
- J. Y. Tang, C. Su and Z. P. Shao, Covalent Organic Framework (COF)-Based Hybrids for Electrocatalysis: Recent Advances and Perspectives, Small Methods, 2021, 5(12), 29 Search PubMed.
- A. N. Murashkevich, K. M. Chechura and M. S. Novitskaya, et al., Synthesis and physicochemical and electrorheological properties of modified nanodisperse titanium dioxide, Inorg. Mater., 2018, 54, 1223–1230 CrossRef CAS.
- H. Li, L. Jiang and Q. Cheng, et al., MnO2 nanoflakes/hierarchical porous carbon nanocomposites for high-performance supercapacitor electrodes, Electrochim. Acta, 2015, 164, 252–259 CrossRef CAS.
- K. Yue, X. Zhang and S. Jiang, et al., Recent advances in strategies to modify MIL-125 (Ti) and its environmental applications, J. Mol. Liq., 2021, 335, 116108 CrossRef CAS.
- B. Zhang, Y. Chen and H. Zheng, et al., Composites of co-doped graphitic C3N4 nanosheets and TiO2 nanoparticles for electrorheological fluid applications, ACS Appl. Nano Mater., 2022, 5(1), 1003–1015 CrossRef CAS.
- X. Liu, J. Fei and X. Peng, et al., Novel AgI/MIL-125 (Ti) heterojunction for efficient photocatalytic degradation of organic pollutants under visible light: Interfacial electron transfer pathway and degradation mechanism, Water, Air, Soil Pollut., 2023, 234(4), 278 CrossRef CAS.
- J. Du, J. Zhang and T. Yang, et al., The Research on the Construction and the Photocatalytic Performance of BiOI/NH2-MIL-125(Ti) Composite, Catalysts, 2020, 11(1), 24 CrossRef.
- F. Hu, S. Sun and H. Xu, et al., Investigation on g-C3N4/rGO/TiO2 nanocomposite with enhanced photocatalytic degradation performance, J. Phys. Chem. Solids, 2021, 156, 110181 CrossRef CAS.
- A. Sharma, M. Varshney and K. H. Chae, et al., Mechanistic investigations on emission characteristics from g-C3N4,g-C3N4@Pt and g-C3N4@Ag nanostructures using X-ray absorption spectroscopy, Curr. Appl. Phys., 2018, 18(11), 1458–1464 CrossRef.
- J. Zheng, G. Liu and X. Feng, et al., Enhanced Photocatalytic Performance of Z-Scheme Design of Bi2O2CO3/Ag/g-C3N4 Photocatalyst, Catal. Lett., 2023, 1–10 Search PubMed.
- P. Lu, X. Hu and Y. Li, et al., Novel CaCO3/g-C3N4 composites with enhanced charge separation and photocatalytic activity, J. Saudi Chem. Soc., 2019, 23(8), 1109–1118 CrossRef CAS.
- R. M. Abdelhameed and M. El-Shahat, Fabrication of ZIF-67@MIL-125-NH2 nanocomposite with enhanced visible light photoreduction activity, J. Environ. Chem. Eng., 2019, 7(3), 103194 CrossRef CAS.
- M. Fiaz, M. Kashif and S. Majeed, et al., Facile fabrication of highly efficient photoelectrocatalysts MxOy@ NH2-MIL-125 (Ti) for enhanced hydrogen evolution reaction, ChemistrySelect, 2019, 4(23), 6996–7002 CrossRef CAS.
- S. Yin, Y. Chen and C. Gao, et al., In-situ preparation of MIL-125 (Ti)/Bi2WO6 photocatalyst with accelerating charge carriers for the photodegradation of tetracycline hydrochloride, J. Photochem. Photobiol., A, 2020, 387, 112149 CrossRef CAS.
- S. X. Wu, Z. C. Gao and L. Y. Li, et al., High-efficient visible light photocatalytic degradation by nano-Ag-doped NH2-MIL-125 (Ti) composites, Inorg. Chim. Acta, 2023, 544, 121233 CrossRef CAS.
- T. Plachy, M. Masar and M. Mrlik, et al., Switching between negative and positive electrorheological effect of g-C3N4 by copper ions doping, Adv. Powder Technol., 2019, 30(4), 714–723 CrossRef CAS.
- Y. Gun Ko and U. Su Choi, Negative electrorheological fluids, J. Rheol., 2013, 57(6), 1655–1667 CrossRef CAS.
- Y. Liang, D. Huang and X. Zhou, et al., Efficient electrorheological technology for materials, energy, and mechanical engineering: From mechanisms to applications, Engineering, 2022, 24, 151–171 CrossRef.
- F. He, Q. Lei and X. Zhao, et al., Polyelectrolyte-based electrorheological materials, Polymer, 2022, 254, 125042 CrossRef CAS.
- L. Wang, C. Li and R. Wang, et al., The preparation and smart electrorheological behavior of MOF-Ti@PANI core-shell nanoparticles, J. Mol. Liq., 2023, 121373 CrossRef CAS.
- M. S. Cho, H. J. Choi and M. S. Jhon, Shear stress analysis of a semiconducting polymer based electrorheological fluid system, Polymer, 2005, 46(25), 11484–11488 CrossRef CAS.
- N. M. Kuznetsov, V. V. Kovaleva and S. I. Belousov, et al., Electrorheological fluids: from historical retrospective to recent trends, Mater. Today Chem., 2022, 26, 101066 CrossRef CAS.
- Y. He, Q. Cheng and V. Pavlinek, et al., Synthesis and structural characterization of polyaniline/mesoporous carbon nanocomposite, Int. J. Polym. Anal. Charact., 2008, 13(1), 25–36 CrossRef CAS.
- C. Zheng, Y. Liu and Y. Dong, et al., Low-Temperature Interfacial Polymerization and Enhanced Electro-Responsive Characteristic of Poly (ionic liquid) s@ polyaniline Core-shell Microspheres, Macromol. Rapid Commun., 2019, 40(17), 1800351 CrossRef.
- J. Yuan, Y. Wang and L. Xiang, et al., Understanding the enhanced electrorheological effect of reduced graphene oxide-supported polyaniline dielectric nanoplates by a comparative study with graphene oxide as the support core, IET Nanodielectr., 2021, 4(3), 143–154 CrossRef.
- M. Stěnička, V. Pavlínek and P. Sáha, et al., The electrorheological efficiency of polyaniline particles with various conductivities suspended in silicone oil, Colloid Polym. Sci., 2009, 287, 403–412 CrossRef.
- J. Wang, G. Chen and J. Yin, et al., Enhanced electrorheological performance and antisedimentation property of mesoporous anatase TiO2 shell prepared by hydrothermal process, Smart Mater. Struct., 2017, 26(3), 035036 CrossRef.
Footnote |
| † Electronic supplementary information (ESI) available. See DOI: https://doi.org/10.1039/d4sm01247j |
| This journal is © The Royal Society of Chemistry 2025 |

