 Open Access Article
Creative Commons Attribution 3.0 Unported Licence
The effect of cholesterol on the bending modulus of DOPC bilayers: re-analysis of NSE data†
Frank
Heinrich
 *ab and
John F.
Nagle
 *a
*a
aDepartment of Physics, Carnegie Mellon University, 5000 Forbes Ave., Pittsburgh, PA 15213, USA. E-mail: fheinrich@cmu.edu; nagle@cmu.edu
bCenter for Neutron Research, National Institute of Standards and Technology, Gaithersburg, MD 20899, USA
First published on 19th February 2025
Abstract
The effect of cholesterol on the bending modulus KC of DOPC lipid bilayers has been controversial. Previous analysis of dynamic neutron spin echo (NSE) data reported that 50% cholesterol increased KC by a factor of three in contrast to earlier studies using four different static methods that reported essentially no increase. We reanalyzed the previous NSE data using new developments in NSE analysis. We find that the same NSE data require non-zero viscosity in pure DOPC and they are consistent with no increases in KC with cholesterol. Instead, we find more than a five-fold increase in the membrane viscosity ηm. We have further added diffusional softening dynamical theory to the basic phenomenological model. This generally decreases the 5-fold increase in viscosity, but the NSE data are not sufficient to determine by how much.
1 Introduction
Biomembranes generally are mechanically flexible, thereby facilitating shape changes in biological functions. Mammalian membranes have many lipid components, including cholesterol. The conventional wisdom of twenty years ago was that cholesterol stiffened membranes. This was based on its effect on lipid bilayers composed of lipids with saturated hydrocarbon chains. Adding cholesterol thickens such bilayers by straightening the hydrocarbon chains, and it increases the bending modulus KC, which is an important measure of mechanical flexibility. In contrast, about fifteen years ago it was found that, while cholesterol conformed to the conventional wisdom for saturated chains,1,2 it did not increase KC of bilayers of lipids with unsaturated chains,1–5 thereby maintaining membrane flexibility while allowing the incorporation of cholesterol, which is also necessary for mammalian biological function.In contrast, more recent work using neutron spin echo (NSE) reported that cholesterol increases KC of the di-unsaturated lipid DOPC substantially by a factor of three with 50% cholesterol.6 A new theoretical development in NSE data analysis provides the opportunity to address this discrepancy as it considers the influence of membrane viscosity ηm on the small vesicles employed in these studies.7 Using this updated model, we have re-analyzed the NSE data,6 also including the effect of vesicle diffusion that was previously neglected. Our re-analysis aligns with earlier findings2–5 indicating that KC of DOPC lipid bilayers does not increase with the addition of cholesterol. According to our phenomenological analysis, the slowing down of the NSE data with cholesterol is instead due to an increase in viscosity ηm.
The concept of diffusional softening is becoming central for discussing the bending modulus of lipid bilayers consisting of mixtures of lipids on a more fundamental level.8–12 Accordingly, we have extended our analysis to include a recent dynamical theory of diffusional softening,11 modified for NSE samples, and find that it readily fits the NSE data with no increase in KC with added cholesterol. However, the NSE data do not extend to long enough times to distinguish between different ways of incorporating diffusional softening.
Section 2 reviews the pertinent equations in the phenomenological model and how these parameters affect the underlying dynamics. Section 3 visualizes the data, which is important for applying a correction for the diffusion of the vesicles in the NSE sample. Section 4 presents the results of fitting the NSE data to the basic phenomenological model, and Section 5 extends the analysis to include diffusional softening. Discussion ensues in Section 6.
2 Spherical dynamics model
Starting from the Helfrich–Canham free energy, the thermally averaged mean square equilibrium amplitude 〈hl2〉 of the lm spherical harmonic mode of the membrane undulations of a vesicle of radius R under zero tension is7 | (1) |
 | (2) |
The new development7 recognizes that, dynamically, the modal relaxation rates are affected by the membrane viscosity, according to
 | (3) |
| 〈hl(t)hl(0)〉 = 〈hl2〉e−ωlt | (4) |
A commonly used expression for the neutron spin echo intermediate structure factor S(q,t) is7,13
| S(q,t)/S(q,0) ≃ exp[−q2〈Δh2(t)〉]exp(−q2Dt) | (5) |
 | (6) |
The first factor in eqn (5) is an approximation7 that could be improved upon, but with little numerical difference, as we have verified. We also note that eqn (5) assumes that the neutron beam is laterally coherent over the diameter of the vesicles. Corrections for typical coherence lengths of 20 nm or more are quite small for vesicles of radius 30 nm pertinent to this paper.
It is illuminating to look at calculations for pertinent values of the parameters. Calculations of S(q,t) are q dependent but
 | (7) |
![[thin space (1/6-em)]](https://www.rsc.org/images/entities/char_2009.gif) m
m![[thin space (1/6-em)]](https://www.rsc.org/images/entities/char_2009.gif) s. At long times, both curves saturate to the equilibrium membrane roughness given by eqn (2). Comparing them shows that membrane viscosity ηm slows the dynamics considerably. The dotted lines in Fig. 1 show pertinent power laws that are expected to hold before saturation. The curve with viscosity has an extended range from 5 to 500 ns during which the expected t1/2 power law7 is followed before saturation sets in. At shorter times, 〈Δh2(t)〉 falls below the power law line because the number of modes lmax is limited due to the in-plane molecular granularity of lipid molecules. An estimate of the effective in-plane spacing of 1.8 nm from X-ray diffuse scattering18 gives lmax = 52. Similarly, the curve without viscosity also deviates from the Zilman–Granek (ZG) t2/3 power law19 at short times, but it also deviates more quickly at longer times due to faster saturation.
s. At long times, both curves saturate to the equilibrium membrane roughness given by eqn (2). Comparing them shows that membrane viscosity ηm slows the dynamics considerably. The dotted lines in Fig. 1 show pertinent power laws that are expected to hold before saturation. The curve with viscosity has an extended range from 5 to 500 ns during which the expected t1/2 power law7 is followed before saturation sets in. At shorter times, 〈Δh2(t)〉 falls below the power law line because the number of modes lmax is limited due to the in-plane molecular granularity of lipid molecules. An estimate of the effective in-plane spacing of 1.8 nm from X-ray diffuse scattering18 gives lmax = 52. Similarly, the curve without viscosity also deviates from the Zilman–Granek (ZG) t2/3 power law19 at short times, but it also deviates more quickly at longer times due to faster saturation.
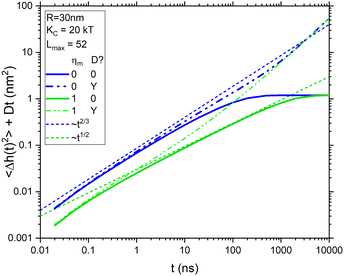 | ||
Fig. 1 Dynamics from eqn (7) that illustrate the effect of viscosity (blue vs. green) and diffusion (solid vs. dash–dot–dot) for a fixed value of KC = 20 kT and 52 modes for R = 30 nm, compared to two power laws (dotted). The radius used for diffusion is 42 nm and the viscosity units are nPa![[thin space (1/6-em)]](https://www.rsc.org/images/entities/char_2009.gif) s s![[thin space (1/6-em)]](https://www.rsc.org/images/entities/char_2009.gif) m. m. | ||
Fig. 1 also shows dash–dot–dot curves for the total displacements sensed by NSE by adding Dt for vesicle diffusion, where D in water was calculated from the Stokes–Einstein equation. The curve for ηm = 0 appears to follow the ZG t2/3 power law to much later times. However, by 100 ns, it has already reached a value that exceeds the saturation limit set by eqn (2). In contrast, the total NSE curve with non-zero viscosity never follows the t1/2 power law, but it could be construed to follow the ZG t2/3 power law in limited time ranges. In either case, these curves emphasize that diffusion has to be considered in analyzing data. The most direct way to do that is to correct for vesicle diffusion by dividing out the last factor in eqn (5) from S(q,t) data.
3 Data visualization
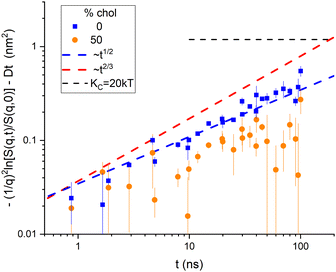
Although it is typical for NSE papers to show S(q,t)/S(q,0) curves for a dozen q values on the same plot, it is more illuminating to plot the left-hand side of eqn (7) as shown for the NSE data for DOPC6 in Fig. 2. (The typical plots are shown in ESI† and the TOC figure.) The data were reported for eight values of q in the range 0.339 nm−1 to 0.682 nm−1 with times from 0.657 ns to 100 ns.6 The S(q,t) for three of the q values did not extend over the full time range. The other five were averaged and shown in Fig. 2 as upward-pointing triangles. There were also four values of q in the range 0.729 nm to 1.01 nm−1 with times from 0.871 ns to 45.1 ns for three of these, and their averages are shown by downward pointing triangles in Fig. 2. See page 2 of ESI† for more details.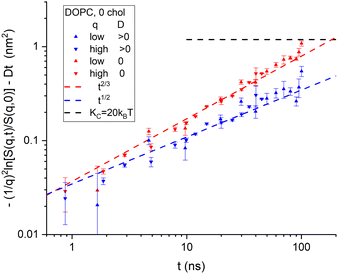 | ||
| Fig. 2 Log–log plot of the time dependence of NSE data6 binned into low q and high q ranges. No diffusion correction was made for the data labeled in the legend by D = 0. A diffusion correction using a radius of 42 nm was made for the same data and labeled D > 0 in the legend. The horizontal dashed line shows the value given by eqn (2) for KC = 20 kT. Uncertainties, here and throughout the manuscript, represent one standard deviation. | ||
To apply the diffusion correction, the coefficient of diffusion of the vesicles was calculated from the Stokes–Einstein equation using an appropriate vesicle radius. The vesicles were reported to have been extruded with a standard 50 nm diameter filter.6 Although no direct measurement of the actual size was reported,6 another recent study using the same filter size and extruder model reported 30 nm radii,7 and earlier studies have reported similar values.20 One expects a larger effective radius for vesicle diffusion that includes the edge of the outer monolayer and any immobilized water. Also, interactions between neighboring vesicles decrease their mobility,16 which is taken into account by increasing the radius. We used a diffusional radius of 42 nm that was also recently reported using dynamic light scattering while using the reported 30 nm from SANS analysis7 for the undulational radius for the theory in Section 2.
Fig. 2 reiterates the point in Fig. 1 that taking vesicle diffusion into account, as we do above makes a major difference. Doing so, Fig. 2 clearly indicates membrane viscosity in the data because the log–log slope is close to 1/2. On the other hand, if it is supposed that vesicle diffusion should not be taken into account, as appears to have been the case in the previous analysis,6 then extrapolation of the data to long times would exceed the level shown by the horizontal dashed curve in Fig. 2. That level is given by eqn (2) and the long-time, static, equilibrium value of KC. To raise that level sufficiently would require, noting that Fig. 2 is a log plot, using considerably smaller values of KC and/or larger values of R.
We finish this visualization of the data by comparing 50% cholesterol with 0% in Fig. 3. Although the high cholesterol data are much noisier, it is clear that the time course is slower, and it seems closer to a 1/2 power than to a 2/3 power.
What this section has done is to re-emphasize that a correction for vesicle diffusion is essential16,17 even for pure DOPC before any consideration of cholesterol. Furthermore, a correction based on a diffusion radius of 42 nm for the Stokes estimate of D is reasonable. We have also tried using the SANS radius of 30 nm for the diffusion correction, but it leads to these plots failing to approach saturation and even decreasing at the longest times, which is inconsistent with the relaxation of the undulation modes, as shown in Fig. S4 (ESI†). This preliminary analysis is, therefore, helpful to the detailed fitting of the S(q,t) data to which we turn next.
4 Fitting the data
While the perspective in the preceding section is revealing, there is no substitute for fitting the S(q,t)/S(q,0) data to the model in Section 2. Although the main physical quantities of interest in the model are the membrane viscosity ηm and the bending modulus KC, let us first explain the choices we made for other parameters that also affect the fits. The data have a normalization factor S(q,0) in eqn (5) for each q.17 Accordingly, we have here allowed S(q,0) to rescale to best fit the data. Rescaling typically amounted to less than 2% deviation from unity, which hardly affects the data at long times but may alleviate noisy short time S(q,t)/S(q,0) values that often exceed unity. As mentioned, the number of modes also affects the noisy short-time data. After fitting with different numbers of modes, no substantial differences emerged, so we have chosen Lmax = 52 as already mentioned. Extruded unilamellar vesicles also have a distribution of radii with dispersions of order 30%.7 However, calculations that had this degree of polydispersity differ negligibly from those that simply use the mean radius of 30 nm, so a polydispersity parameter was not used.The data6 include uncertainties for each q and t, which were used to calculate the total reduced χ2 and χ2(q) for each q. A recent NSE analysis excluded low q data,7 but the χ2(q) values here were rather random for the different q and cholesterol concentrations, so we have included all twelve q values in our simultaneous fitting of the parameters. However, we have not included in our figures the results from the fits to the 40% cholesterol data because they had considerably larger χ2, the values of the parameters were out of line with the monotonic sequence of values from the other concentrations, and the 40% data had different time and q values.
Ideally, one would like to obtain both KC and ηm by fitting the data. Our attempt to do this is shown in Fig. 4. Although one might discern an increase in both KC and ηm, the uncertainties in the parameters are about as large as their best values. The underlying reason is that increases in both parameters have similar effects on S(q,t) as shown in Fig. 5. Therefore, the uncertainties in these parameters are highly correlated, and it is essentially impossible to disentangle reliable values. Basically, the data are too noisy to obtain valid numbers for both parameters.
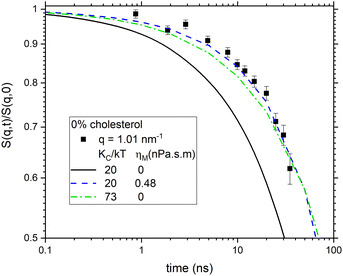 | ||
| Fig. 5 Comparison of the effect of increasing KC and ηm on S(q,t). For clarity only one q value is shown. | ||
However, the data are good enough to fit one parameter when the other is held fixed. Fig. 6 shows our results. The filled circles show the values for the bending modulus when the viscosity ηm was set to 0. This is labeled KCD in the legend because it is conceptually similar to what was done earlier,6 as explained in Section 6.1. Even with no cholesterol, this KCD is much larger than the static value of KC, and it increases by a factor of 2.5 for 50% cholesterol, similarly to what was earlier reported.6 In contrast, the black squares in Fig. 6 show the result of fitting the data when KC/kT was fixed to 20, consistent with the static value.2 In this case, the viscosity ηm increases by over a factor of 5 for 50% cholesterol. The χ2 plots in Fig. 6 show that the latter fit is better for all cholesterol concentrations, thereby suggesting that the better model for the effect of cholesterol on NSE data is a constant KC and increasing ηm. ESI† shows traditional S(q,t) figures with detailed statistics.
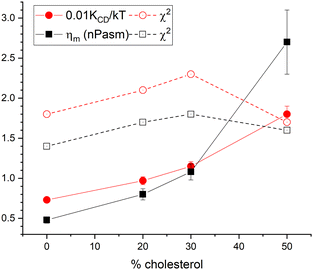 | ||
| Fig. 6 Filled symbols show results of fitting either to KCD (circles) with ηm fixed to 0 or to ηm (squares) with KC/kT fixed to 20. Open symbols show the corresponding reduced χ2. | ||
Fig. 7 compares the time evolution of 〈Δh2(t)〉 of the two models to each other and to the experimental NSE data. Both models fit the NSE data reasonably well in its available time window. NSE alone would be a better discriminator of the two models if it had a longer time window or if the lipid more quickly approached its long time limit. However, it is not necessary to use NSE alone because the long time limit in Fig. 7 is given by the equilibrium static bending modulus using eqn (2). The value KC/kT ≈ 20 that everyone agrees on when there is no cholesterol in DOPC gives the long time limit of the model with non-zero ηm in Fig. 7 whereas the ηm = 0 model shown by the red line has 〈Δh2(∞)〉 that is far smaller than what is required by eqn (2). Therefore, for the two extant models, only the one with viscosity accommodates the data for both time scales.
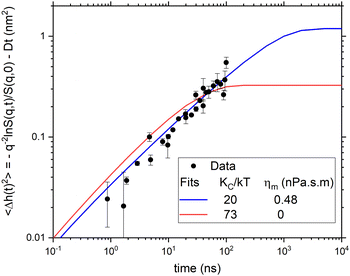 | ||
| Fig. 7 Comparison of the two salient models to the averaged experimental data in Fig. 3 for DOPC with no cholesterol. | ||
The difference between the 30 nm structural radius and the 42 nm diffusional radius seems rather large. Along with the 30 nm radius, a second structural radius of 40.3 nm has been given that used a different analysis.16 We have also fit the data with this larger structural radius. This does not change the main conclusions. In particular, the χ2 are almost unchanged. The fitted ηm and KCD/kT become larger. For no cholesterol, the 0.48 nPa![[thin space (1/6-em)]](https://www.rsc.org/images/entities/char_2009.gif) s
s![[thin space (1/6-em)]](https://www.rsc.org/images/entities/char_2009.gif) m in Fig. 7 becomes 0.88 nPa
m in Fig. 7 becomes 0.88 nPa![[thin space (1/6-em)]](https://www.rsc.org/images/entities/char_2009.gif) s
s![[thin space (1/6-em)]](https://www.rsc.org/images/entities/char_2009.gif) m, and the 73 for KCD/kT becomes 116. Detailed results are given in Fig. S2(6) and S2(8) in ESI.†
m, and the 73 for KCD/kT becomes 116. Detailed results are given in Fig. S2(6) and S2(8) in ESI.†
5 Lateral lipid diffusional softening
The concept of diffusional softening is central for discussing the bending modulus of lipid bilayers consisting of mixtures of lipids.8–12 The title of this section emphasizes that the diffusion involved is that of lipids within the bilayer and not the diffusion of the vesicles in the NSE experiments that we focused on earlier. Briefly, thermally excited undulations create local regions of curvature to which lipids of similar spontaneous curvature diffuse, exchanging with lipids of dissimilar spontaneous curvature that diffuse to undulational regions of the opposite curvature; this couples lateral diffusion and undulations, enabling further curvature and reducing the bending modulus. For two lipids, each with the same value of KC in their single component bilayers, straightforward equilibrium theory obtains a decrease in the modulus of the mixture that is proportional to the square of the difference ΔC0 in their effective spontaneous curvatures.11 There is not yet experimental confirmation for mixtures of two lipids that each alone has the same KC value, and there is no derivation when the individual KC have different values. In any case, for cholesterol, there is the experimental problem that pure cholesterol does not form bilayers.Importantly, a dynamical theory of diffusional softening has been developed and applied to the dynamics of giant unilamellar vesicles of POPC/DOPE (GUVs) with radii of order 10 μm.11 Like cholesterol mixtures, that system also has no pure DOPE endpoint, so the dynamical theory was necessary to detect diffusional softening. Let us see how this theory might apply to the effect of cholesterol on much smaller NSE vesicles. The first difference compared to the theory in Section 2 is that the coupling of diffusion and undulations leads to two rate constants kl,± for the decay of each mode l of the autocorrelation function
| 〈hl(t)hl(0)〉 = (1 − α)·exp(−tkl,+) + α·exp(−tkl,−), | (8) |
 | (9) |
| κ = KC/(1 − α). | (10) |
Adding cholesterol increases kl,+ (note the sign error in eqn (36) in that paper11) by α times D0l(l + 1)/R2; this latter diffusion factor for a typical coefficient of lipid, not vesicle, lateral diffusion21,22D0 of 10−7 cm2 s−1 is only about (15![[thin space (1/6-em)]](https://www.rsc.org/images/entities/char_2009.gif) 000 ns)−1 for the largest l = 2 mode, so kl,+ in eqn (8) is hardly affected by the coupling to diffusion. The kl,− rate in eqn (8) is 1 − α times the same lateral diffusion factor; it is much slower than kl,+, so qualitatively, this slows down 〈Δh2(t)〉 as cholesterol is added. Most importantly, the increase in the amplitude of this slow rate and the decrease in the amplitude of the fast rate in eqn (8) slows down the overall decay of the autocorrelation function.
000 ns)−1 for the largest l = 2 mode, so kl,+ in eqn (8) is hardly affected by the coupling to diffusion. The kl,− rate in eqn (8) is 1 − α times the same lateral diffusion factor; it is much slower than kl,+, so qualitatively, this slows down 〈Δh2(t)〉 as cholesterol is added. Most importantly, the increase in the amplitude of this slow rate and the decrease in the amplitude of the fast rate in eqn (8) slows down the overall decay of the autocorrelation function.
It is first important to appreciate that there is a problem with this theory, as written,11 that is revealed by applying it to zero cholesterol. Then, the kl,+ used in eqn (8) is the same as ωl in eqn (3) when ηm is set to zero and the slow term in eqn (8) doesn't matter because α is zero, so the fit to the NSE data gives the same result as our ηm = 0 model that gives the red curve in Fig. 7. There it was emphasized that this contradicts the static, equilibrium value of KC/kT ≈ 20 when there is no cholesterol. What appears to be missing from the diffusional softening dynamic theory is membrane viscosity. It is fine to ignore ηm in eqn (3) for GUVs until ηm becomes very large23 because the second term in the denominator of eqn (3) is small compared to the first term. For DOPC, the ratio of those terms is less than 0.1, even for the lowest l = 2 mode. But this is not so for smaller NSE vesicles.
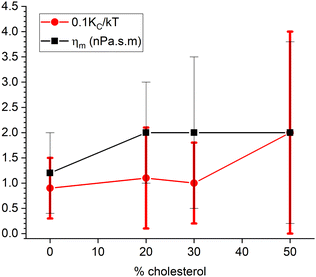
We have taken diffusional softening into account in fitting the NSE data in two ways. Both ways use Achol = 0.35 nm2 and ADOPC = 0.70 nm2 to obtain the area fractions χ. Although the dominant mode is l = 2, we follow precedent by using the ratio of the l factors to be unity.11 We have also fixed the coefficient of lipid lateral diffusion D0 to 3 × 10⁻⁸ cm2 s−1 as a typical value from other experiments.21 Finally, we continue to fix KC/kT to 20 to match the long-time equilibrium value. In the first way, we have used an estimate of ΔC0 = 0.481 nm−1 (Alex Sodt, private communication) and a similar value of 0.401 nm−1 can be obtained from the literature.24 Combining eqn (10) with eqn (9) gives a quadratic equation that determines the α values shown by the upward pointing triangles in Fig. 8. Fitting used the autocorrelation functions in eqn (8) with kl,+ amended to include viscosity as in eqn (3). Fig. 8 shows that ηm increases with increasing cholesterol, but only about half as much compared to Fig. 6 where diffusional softening was not included. This comparison would imply that the effect of cholesterol on NSE dynamics is about half due to increasing viscosity and about half due to lipid diffusion.
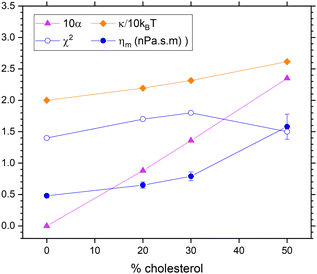 | ||
| Fig. 8 Results that include dynamical diffusional softening theory in fits to the NSE data using an estimate ΔC0 = 0.481 nm−1 for the spontaneous curvature difference. The estimated values of α (times 10, upward triangles) were used to fit the data resulting in the membrane viscosity (circles) and the unsoftened κ obtained from eqn (10). | ||
In our second way to include diffusional softening, we fit the diffusional α parameter in eqn (9) while holding KC and ηm fixed. (As before, NSE data are only good enough to fit one parameter.) Results are shown in Fig. 9. The spontaneous curvature difference ΔC0 is larger than estimated in the first way above, and it decreases from 0.68 nm−1 to 0.57 nm−1 as cholesterol concentration increases from 20% to 50%. Importantly, χ2 is practically the same as it is in Fig. 8, and both are the same as for the case shown in Fig. 6 by black squares that has viscosity and no diffusional softening.
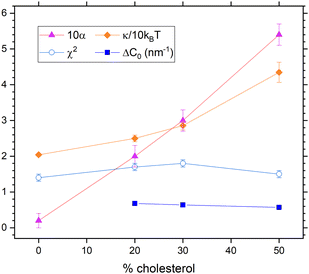 | ||
| Fig. 9 Results that include dynamical diffusional softening theory in fits that constrained ηm to its value with no cholesterol. The obtained values of α (times 10, upward triangles) were used to fit the data resulting in the membrane viscosity (circles) and the unsoftened κ obtained from eqn (10). | ||
6 Discussion
6.1 Fuller discussion of differences with original analysis of these data
The earlier analysis6 relied on three foundations. The first employed the Zilman–Granek theory19 for flat plaquettes which gave t2/3 power law behavior for 〈Δh2(t)〉. However, for many years, the viscosity of water ηw had to be chosen three times larger than the actual value in order to obtain reasonable values of KC.25The second foundation alleviated that problem by a theory26 that included membrane viscosity and found that what is measured in the NSE experimental regime was a dynamic KCD modulus which satisfied
| KCD = KC + h2KA | (11) |
The third foundation was to employ the polymer brush relation
| KA = 24KC/(2DC)2 | (12) |
6.2 Moving forward
It recently became apparent that the first foundation for NSE data analysis of biomembranes employed in many NSE papers is flawed. While the Zilman–Granek theory of flat plaquettes has usually been assumed, the typical NSE systems have been unilamellar vesicles. This distinction and its likely importance to NSE analysis was discussed earlier.32 It has been shown more recently for POPC/POPS (90/10) vesicles that it does indeed matter greatly how shape is taken into account.7 Using all three foundations in the preceding subsection resulted in values of KCD and KC an order of magnitude too large. In contrast, replacing the traditional Zilman–Granek formula in the first foundation with the spherical model in Section 2 resulted in acceptable values of KCD assuming that eqn (11) in the second foundation remains valid. That paper also emphasized that it is very important to take vesicle diffusion into account;7 not doing so apparently accounts for why some earlier papers had been able to obtain sensibly smaller values of the bending moduli using the Zilman–Granek theory of flat plaquettes.6,33That recent paper7 only presented results assuming ηm = 0, in order to focus on the shape issue by comparing to the original Zilman–Granek flat plaquette theory that also had no membrane viscosity.19 We have also analyzed the POPC/POPS data in that paper and, similar to our results for the DOPC/cholesterol data, we find smaller χ2 when KC is constrained to the experimental 26 kT of POPC34 and ηm is allowed to fit. We obtain 0.8 nPa![[thin space (1/6-em)]](https://www.rsc.org/images/entities/char_2009.gif) s
s![[thin space (1/6-em)]](https://www.rsc.org/images/entities/char_2009.gif) m, compared to our 0.48 nPa
m, compared to our 0.48 nPa![[thin space (1/6-em)]](https://www.rsc.org/images/entities/char_2009.gif) s
s![[thin space (1/6-em)]](https://www.rsc.org/images/entities/char_2009.gif) m for DOPC with no cholesterol in Fig. 6.
m for DOPC with no cholesterol in Fig. 6.
The analysis for spherical vesicles outlined in Section 2 conceptually bypasses the second and third foundations of the original analysis6 discussed in the previous subsection. Although the data are not good enough to obtain both KC and ηm, we propose that the way forward is to constrain KC to values obtained from other experiments and use NSE to find the best value for the viscosity. It would be especially relevant to do NSE experiments on DMPC where the equilibrium values of KC increase dramatically with added cholesterol.2 We predict that the best fit would have an increase in both viscosity and KC.
However, a casualty of this proposal is that it loses the handle on the determination of the neutral surface h in bilayers viaeqn (11). Since the χ2 values are not very much higher in Fig. 6, would it be legitimate to invoke eqn (11) as an alternative way to take into account the viscosity? If it were, then using the values of KCD in Fig. 6 and the values of KA and KC from the literature2 in eqn (11) gives values of h/DC to be 0.66, 0.65 and 0.57 for 0%, 30% and 50% cholesterol, respectively. The ratio for DOPC is close to the value 0.65 obtainable from a simulation that reported h at 0.94 nm (ref. 35) and the experimental DC at 1.44 nm.36 These values of h/D are rather smaller than the value of unity often assumed.6 Even if we use R = 40 nm, h/DC is only 0.88 for DOPC. The decrease in h/DC with cholesterol towards the center of its rigid rings also seems intuitively plausible. For comparison, our analysis of the POPC/POPS data7 gives h/DC = 0.75 for R = 30 nm. It might also be mentioned that a finite lateral compressibility 1/KA is central to this approach, whereas the theory in Section 2 assumes zero compressibility. Therefore, further theoretical development has been called for23 that might allow for using NSE to obtain the neutral surface and maybe provide better fits to NSE data.
6.3 Perspectives
The first perspective of the dynamical theory in Section 2 is that a lipid bilayer has a single bending modulus embodied in the Helfrich–Canham theory for the free energy of undulations. The H–C theory has no dynamics, so the conventional bending modulus pertains to the free energy required to perform a static deformation, as measured by electrodeformation3 and tether pulling4,5 experiments. It also pertains to the thermally induced average mean square 〈hl2〉 in eqn (2) measured by shape fluctuations3 and X-ray diffuse scattering.2 These equilibrium measurements obtain the traditional H–C bending modulus KC that has no time or length scale dependence. A refinement recognizes that the H–C free energy is a continuum theory that should be modified to include tilt and a tilt modulus Kt that become important at short length scales,37 including the shorter ends of both X-ray diffuse scattering and NSE length scales. Although this has only been taken into account in the analysis of X-ray data,18,38 it is small enough that it is not likely to be a major concern for the broader issues regarding NSE analysis that we address here. Interestingly, re-analysis of the original X-ray data2 shows that the tilt modulus increases with cholesterol, as shown in Fig. (S3) (ESI†), and this may be connected with NMR data,6 as discussed earlier.28The second perspective of the dynamical theory in Section 2 is that adding a single linear transport property, namely membrane viscosity ηm, suffices to describe undulational dynamics through the time-dependent relaxation of spontaneous or imposed fluctuations, such as for the autocorrelation function in eqn (4). Viscosity is a traditional quantity for characterizing time-dependent material properties of soft matter. Of course, this perspective recognizes that short-time, high-frequency responses are attenuated, such as in dielectrics. Likewise, for an overdamped spring, there is a single modulus, the spring constant, while the dynamics vary with the viscosity, both internal, analogous to ηm, and external, analogous to water viscosity ηw. It would seem that this latter perspective is more fundamental than just invoking a frequency/time-dependent modulus. It also allows for predictions for relaxation time regimes that have not yet been measured.
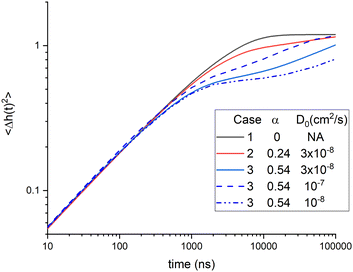
It may be interesting to speculate on why the viscosity might increase with cholesterol. Cholesterol increases the bilayer thickness and the lateral chain packing order parameter and decreases the area per lipid,2 Hence, the hydrocarbon chains pack more tightly, thereby providing more steric hindrance to their conformational dynamics. The tighter packing of both the chains and the headgroups would also impede the flow of lipids within the bilayer, making it less fluid. Such lateral fluidity could also be reduced by increased mini-interdigitation of chains near the bilayer center; this would be brought about because cholesterol is too short to reach the midplane, and chains from the other monolayer could fill the gap. In any case, more ordered structures are generally less fluid, which is typically described in soft matter physics as having higher viscosity. However, even though the zero cholesterol case requires viscosity, as emphasized in connection with Fig. 7, we do not necessarily believe that viscosity increases with cholesterol, as will be discussed next.
6.4 Diffusional softening
The theory in Section 2 is a phenomenological theory that does not explain either the bending modulus or the membrane viscosity in more basic terms. Of course, one would like to understand what affects these phenomenological parameters, so we have extended the phenomenological theory to include the dynamical theory of diffusional softening. Since the bending modulus KC has to match its equilibrium value, we focus on how diffusional softening affects the viscosity with added cholesterol. Two ways to fit the data with diffusional softening are described in Section 5. Unfortunately, the χ2 are essentially the same for these two ways and also for not including diffusional softening at all, so we can not report a best result. Nevertheless, it is interesting to compare these three cases in Table 1, which summarizes the 50% cholesterol results. The amount of diffusional softening is quantified by α, and the influence of viscosity is quantified by the ratio of its value at 50% cholesterol to no cholesterol. For equally good fits to these NSE data, one can increase the importance of either one by reducing the importance of the other. This is illustrated in Fig. 10 by the close agreement of the three cases for times less than 300 ns.Table 1 also compares the results for the theoretical stiffened modulus κ that would pertain if lipid lateral diffusion could be frozen. This might also pertain to short-time NSE dynamics before lipid lateral diffusion occurs, although diffusion begins at time zero, and the early NSE relaxation is dominated by the shortest-length scale modes. Nevertheless, κ is easily obtained from the values of α and the equilibrium KCviaeqn (10). A comparison is the inclusion of DOPE in POPC, where, like cholesterol, the small PE headgroup induces a large negative spontaneous curvature. In that case, adding 40% DOPE gave a ratio of about 1.3 for κ/KC,11 similar to what is obtained for cholesterol in case 2 in Table 1. Case 3 in Table 1 has a larger value of κ/KC that is suggestive of the three-fold increase in the bending modulus reported earlier.6 However, the intrinsic non-softened κ is not the same as the KCD obtained by setting ηm to zero because KCD/KC is a much larger 8.5 with the addition of 50% cholesterol One might consider using the polymer brush model to extract κ from KCD, but this step has no basis in the theory in Section 2, and it would involve the questionable use of eqn (12) in eqn (11).
It may be noted that a recent simulation shows diffusion of cholesterol that is coupled to undulations.12 That paper also shows that flip–flop is a parallel pathway to couple cholesterol concentration to undulations, and it reported that the kinetics are faster in DOPC bilayers than in DPPC bilayers, consistent with enabling greater diffusional softening. Incidentally, another recent simulation paper, although not reporting lateral diffusion, also found strongly non-universal effects of cholesterol on the static bending modulus with little change in KC when cholesterol was added to DOPC.39
It is also necessary to appreciate how it is possible that cholesterol increases KC for DMPC and DPPC, with saturated chains, and not for unsaturated DOPC even though, alone, these PC lipids likely have values of spontaneous curvature that are all small compared to cholesterol or to PE lipids. If diffusion could be suppressed, then cholesterol would increase KC for both DMPC and DOPC, but likely more for DMPC because cholesterol has a larger effect on the structure of saturated chains.1,2 Then, diffusional softening would decrease KC, but the amounts could also be different because it has been argued that the effective spontaneous curvature of lipids in a mixture are non-additive and therefore can be quite different depending upon the other lipid(s).40
While Fig. 10 emphasizes that the time regime available to NSE is unlikely to discriminate between the three cases, it suggests that they might be discriminated by their behavior at longer times. However, unsurprisingly, the coefficient of lateral diffusion D0 also affects the time course of 〈Δh2(t)〉 as shown for the three case 3 calculations with different values of D0. It should also be mentioned that the traditional inclusion of compression modes26,27,29 would also affect the dynamics at longer times, both for pure lipids and for mixtures. That would make it even more difficult to disentangle the parameters involved in diffusional softening. However, such a theory might justify providing experimental values of the neutral surface h if eqn (11) remains valid.
6.5 Comparison of viscosity to literature values
We obtain 0.48 ± 0.1 nPa![[thin space (1/6-em)]](https://www.rsc.org/images/entities/char_2009.gif) s
s![[thin space (1/6-em)]](https://www.rsc.org/images/entities/char_2009.gif) m for DOPC. We also find 0.8 ± 0.1 nPa
m for DOPC. We also find 0.8 ± 0.1 nPa![[thin space (1/6-em)]](https://www.rsc.org/images/entities/char_2009.gif) s
s![[thin space (1/6-em)]](https://www.rsc.org/images/entities/char_2009.gif) m for POPC/POPS vesicles but defer a detailed analysis to the authors of this recent study.7 We should note that these values were obtained using a structural radius R = 30 nm. When we use a larger radius of 40.3 nm for DOPC, we obtain 0.88 nPa
m for POPC/POPS vesicles but defer a detailed analysis to the authors of this recent study.7 We should note that these values were obtained using a structural radius R = 30 nm. When we use a larger radius of 40.3 nm for DOPC, we obtain 0.88 nPa![[thin space (1/6-em)]](https://www.rsc.org/images/entities/char_2009.gif) s
s![[thin space (1/6-em)]](https://www.rsc.org/images/entities/char_2009.gif) m, so this difference may be a better estimate of our uncertainty. Literature results for membrane viscosity of DOPC bilayers have been reported as low as ηm = 0.15 nPa
m, so this difference may be a better estimate of our uncertainty. Literature results for membrane viscosity of DOPC bilayers have been reported as low as ηm = 0.15 nPa![[thin space (1/6-em)]](https://www.rsc.org/images/entities/char_2009.gif) s
s![[thin space (1/6-em)]](https://www.rsc.org/images/entities/char_2009.gif) m to as high as 16.7 nPa
m to as high as 16.7 nPa![[thin space (1/6-em)]](https://www.rsc.org/images/entities/char_2009.gif) s
s![[thin space (1/6-em)]](https://www.rsc.org/images/entities/char_2009.gif) m as can be seen in the appendix of a recent paper.41 That paper studied transient deformation of GUVs and reported ηm = 4.11 ± 2.63 nPa
m as can be seen in the appendix of a recent paper.41 That paper studied transient deformation of GUVs and reported ηm = 4.11 ± 2.63 nPa![[thin space (1/6-em)]](https://www.rsc.org/images/entities/char_2009.gif) s
s![[thin space (1/6-em)]](https://www.rsc.org/images/entities/char_2009.gif) m for DOPC, 7.00 ± 4.77 nPa
m for DOPC, 7.00 ± 4.77 nPa![[thin space (1/6-em)]](https://www.rsc.org/images/entities/char_2009.gif) s
s![[thin space (1/6-em)]](https://www.rsc.org/images/entities/char_2009.gif) m for DOPC
m for DOPC![[thin space (1/6-em)]](https://www.rsc.org/images/entities/char_2009.gif) :
:![[thin space (1/6-em)]](https://www.rsc.org/images/entities/char_2009.gif) Chol(1
Chol(1![[thin space (1/6-em)]](https://www.rsc.org/images/entities/char_2009.gif) :
:![[thin space (1/6-em)]](https://www.rsc.org/images/entities/char_2009.gif) 1) and 9.32 ± 5.95 nPa
1) and 9.32 ± 5.95 nPa![[thin space (1/6-em)]](https://www.rsc.org/images/entities/char_2009.gif) s
s![[thin space (1/6-em)]](https://www.rsc.org/images/entities/char_2009.gif) m for POPC. Given the large reported uncertainties, the trends with cholesterol and saturation are consistent with our results, but the values themselves are an order of magnitude larger. Perhaps this could be due to viscosity having a length scale dependence. On the other hand, the largest value of 16.7 nPa
m for POPC. Given the large reported uncertainties, the trends with cholesterol and saturation are consistent with our results, but the values themselves are an order of magnitude larger. Perhaps this could be due to viscosity having a length scale dependence. On the other hand, the largest value of 16.7 nPa![[thin space (1/6-em)]](https://www.rsc.org/images/entities/char_2009.gif) s
s![[thin space (1/6-em)]](https://www.rsc.org/images/entities/char_2009.gif) m also came from NSE on small vesicles,6 but a different protocol and analysis were used, and the deuterated data were different than the protonated data we have reanalyzed. Interestingly, ηm more than doubled with only 20% cholesterol, even more than we report in Fig. 6 and much more than in Fig. 8 when diffusional softening was included. The literature value closest to our DOPC value is 0.59 ± 0.2 nPa
m also came from NSE on small vesicles,6 but a different protocol and analysis were used, and the deuterated data were different than the protonated data we have reanalyzed. Interestingly, ηm more than doubled with only 20% cholesterol, even more than we report in Fig. 6 and much more than in Fig. 8 when diffusional softening was included. The literature value closest to our DOPC value is 0.59 ± 0.2 nPa![[thin space (1/6-em)]](https://www.rsc.org/images/entities/char_2009.gif) s
s![[thin space (1/6-em)]](https://www.rsc.org/images/entities/char_2009.gif) m from probe diffusion in GUVs.42 Values from smaller vesicles include 0.20 nPa
m from probe diffusion in GUVs.42 Values from smaller vesicles include 0.20 nPa![[thin space (1/6-em)]](https://www.rsc.org/images/entities/char_2009.gif) s
s![[thin space (1/6-em)]](https://www.rsc.org/images/entities/char_2009.gif) m,43 0.84 nPa
m,43 0.84 nPa![[thin space (1/6-em)]](https://www.rsc.org/images/entities/char_2009.gif) s
s![[thin space (1/6-em)]](https://www.rsc.org/images/entities/char_2009.gif) m,44 and 0.15 nPa
m,44 and 0.15 nPa![[thin space (1/6-em)]](https://www.rsc.org/images/entities/char_2009.gif) s
s![[thin space (1/6-em)]](https://www.rsc.org/images/entities/char_2009.gif) m,45 and simulations gave 0.197 ± 0.007 nPa
m,45 and simulations gave 0.197 ± 0.007 nPa![[thin space (1/6-em)]](https://www.rsc.org/images/entities/char_2009.gif) s
s![[thin space (1/6-em)]](https://www.rsc.org/images/entities/char_2009.gif) m.46 It appears that our result for DOPC is closer to these latter values, but we are loathe to discount the results of the electrodeformation method41 that clearly observes relaxation on a large length scale. Aside from the magnitudes, it seems likely that there is an increase in ηm with cholesterol but how much is still to be determined.
m.46 It appears that our result for DOPC is closer to these latter values, but we are loathe to discount the results of the electrodeformation method41 that clearly observes relaxation on a large length scale. Aside from the magnitudes, it seems likely that there is an increase in ηm with cholesterol but how much is still to be determined.
7 Conclusions
Neutron spin echo provides a valuable but limited time window into the dynamics of lipid bilayers. This limitation and the statistical quality of current NSE data restrict the application of NSE data to determining essentially only one physical quantity. Although NSE practitioners have hitherto focused on obtaining the equilibrium bending modulus,6,7,13–17,33 this paper maintains that NSE is better suited to obtaining the non-equilibrium viscosity. Importantly, the new phenomenological theory applied to DOPC with no cholesterol requires non-zero viscosity to fit the NSE data and the equilibrium KC.For the interesting case of cholesterol in DOPC bilayers, we find that the inclusion of viscosity fits the NSE data better while constraining KC to the value obtained from equilibrium measurements. This supports the perspective embedded in the phenomenological theory in Section 2 that a single time-independent bending modulus suffices. Our extension of that theory to include diffusional softening allows us to refine how membrane viscosity may change with the addition of cholesterol. While keeping the same equilibrium KC modulus that does not change when adding cholesterol to DOPC bilayers, the general diffusional softening theory generates a stiffened modulus that has a stiffening factor for 50% cholesterol ranging from 1 to 2.2 for different assumptions that fit the NSE data equally well. Dynamical data at longer times would be required to resolve this ambiguity and, more generally, to determine how much of the effect of cholesterol can be attributed to diffusional softening versus changes in membrane viscosity.
Author contributions
J. N. conceptualized the work, F. H. and J. N. analyzed the data and wrote the manuscript.Data availability
The data were previously published in ref. 6 and were accessed at Virginia Tech's Data Repository (VTechData; DOI: 10.7294/v8w6-7760). The software used for the NSE data analysis shown in the ESI was published in Kirby et al.47Conflicts of interest
There are no conflicts to declare.Acknowledgements
J. N. thanks Markus Deserno and Alex Sodt for discussions of diffusional softening, Michi Nagao and Liz Kelley for NSE discussions, and especially the latter for sending the recent POPC/POPS data and for collaborative fitting of older unpublished data. F. H. acknowledges support from the U.S. Department of Commerce Awards 70NANB17H299 and 70NANB24H248. Certain commercial materials, equipment, and instruments are identified in this work to describe the experimental procedure as completely as possible. In no case does such an identification imply a recommendation or endorsement by NIST, nor does it imply that the materials, equipment, or instruments identified are necessarily the best available for the purpose.References
- J. Pan, T. T. Mills, S. Tristram-Nagle and J. F. Nagle, Phys. Rev. Lett., 2008, 100, 198103 CrossRef PubMed.
- J. Pan, S. Tristram-Nagle and J. F. Nagle, Phys. Rev. E: Stat., Nonlinear, Soft Matter Phys., 2009, 80, 021931 CrossRef PubMed.
- R. S. Gracia, N. Bezlyepkina, R. L. Knorr, R. Lipowsky and R. Dimova, Soft Matter, 2010, 6, 1472–1482 RSC.
- A. Tian, B. R. Capraro, C. Esposito and T. Baumgart, Biophys. J., 2009, 97, 1636–1646 CrossRef CAS PubMed.
- B. Sorre, A. Callan-Jones, J.-B. Manneville, P. Nassoy, J.-F. Joanny, J. Prost, B. Goud and P. Bassereau, Proc. Natl. Acad. Sci. U. S. A., 2009, 106, 5622–5626 CrossRef CAS PubMed.
- S. Chakraborty, M. Doktorova, T. R. Molugu, F. A. Heberle, H. L. Scott, B. Dzikovski, M. Nagao, L.-R. Stingaciu, R. F. Standaert and F. N. Barrera, et al. , Proc. Natl. Acad. Sci. U. S. A., 2020, 117, 21896–21905 CrossRef CAS PubMed.
- R. Granek, I. Hoffmann, E. G. Kelley, M. Nagao, P. M. Vlahovska and A. Zilman, Eur. Phys. J. E: Soft Matter Biol. Phys., 2024, 47, 12 CrossRef CAS PubMed.
- S. Leibler, J. Phys., 1986, 47, 507–516 CrossRef CAS.
- P. V. Bashkirov, P. I. Kuzmin, J. Vera Lillo and V. A. Frolov, Annu. Rev. Biophys., 2022, 51, 473–497 CrossRef CAS PubMed.
- H. J. Lessen, K. C. Sapp, A. H. Beaven, R. Ashkar and A. J. Sodt, Biophys. J., 2022, 121, 3188–3199 CrossRef CAS PubMed.
- K. Sapp, M. Aleksanyan, K. Kerr, R. Dimova and A. Sodt, Phys. Rev. E, 2023, 107, 054403 CrossRef PubMed.
- M. Pöhnl, M. F. Trollmann and R. A. Böckmann, Nat. Commun., 2023, 14, 8038 CrossRef PubMed.
- S. Gupta and G. J. Schneider, Soft Matter, 2020, 16, 3245–3256 RSC.
- B. Brüning, R. Stehle, P. Falus and B. Farago, Eur. Phys. J. E: Soft Matter Biol. Phys., 2013, 36, 1–8 CrossRef PubMed.
- M. Mell, L. H. Moleiro, Y. Hertle, P. Fouquet, R. Schweins, I. López-Montero, T. Hellweg and F. Monroy, Eur. Phys. J. E: Soft Matter Biol. Phys., 2013, 36, 1–13 CrossRef PubMed.
- E. G. Kelley, E. E. Blick, V. M. Prabhu, P. D. Butler and M. Nagao, Front. Phys., 2022, 10, 866024 CrossRef.
- I. Hoffmann, Front. Phys., 2021, 8, 620082 CrossRef.
- M. S. Jablin, K. Akabori and J. Nagle, Phys. Rev. Lett., 2014, 113, 248102 CrossRef CAS PubMed.
- A. Zilman and R. Granek, Phys. Rev. Lett., 1996, 77, 4788 CrossRef CAS PubMed.
- N. Kucerka, J. Pencer, J. N. Sachs, J. F. Nagle and J. Katsaras, Langmuir, 2007, 23, 1292–1299 CrossRef CAS PubMed.
- E. Wu, K. Jacobson and D. Papahadjopoulos, Biochemistry, 1977, 16, 3936–3941 CrossRef CAS PubMed.
- N. Kahya, D. Scherfeld, K. Bacia, B. Poolman and P. Schwille, J. Biol. Chem., 2003, 278, 28109–28115 CrossRef CAS PubMed.
- H. A. Faizi, R. Granek and P. M. Vlahovska, Proc. Natl. Acad. Sci. U. S. A., 2024, 121, 1–7 CrossRef PubMed.
- B. Kollmitzer, P. Heftberger, M. Rappolt and G. Pabst, Soft Matter, 2013, 9, 10877–10884 RSC.
- I. Hoffmann, C. Hoffmann, B. Farago, S. Prévost and M. Gradzielski, J. Chem. Phys., 2018, 148, 104901 CrossRef PubMed.
- M. C. Watson, Y. Peng, Y. Zheng and F. L. Brown, J. Chem. Phys., 2011, 135, 194701 CrossRef PubMed.
- U. Seifert and S. A. Langer, Biophys. Chem., 1994, 49, 13–22 CrossRef CAS.
- J. F. Nagle, Phys. Rev. E, 2021, 104, 044405 CrossRef CAS PubMed.
- A. Yeung and E. Evans, J. Phys. II, 1995, 5, 1501–1523 CrossRef CAS.
- J. F. Nagle, E. A. Evans, P. Bassereau, T. Baumgart, S. Tristram-Nagle and R. Dimova, Proc. Natl. Acad. Sci. U. S. A., 2021, 118, e2025011118 CrossRef CAS PubMed.
- W. Rawicz, K. C. Olbrich, T. McIntosh, D. Needham and E. Evans, Biophys. J., 2000, 79, 328–339 CrossRef CAS PubMed.
- M. Mell, L. H. Moleiro, Y. Hertle, I. López-Montero, F. J. Cao, P. Fouquet, T. Hellweg and F. Monroy, Chem. Phys. Lipids, 2015, 185, 61–77 CrossRef CAS PubMed.
- M. Nagao, E. G. Kelley, R. Ashkar, R. Bradbury and P. D. Butler, J. Phys. Chem. Lett., 2017, 8, 4679–4684 CrossRef CAS PubMed.
- N. Kučerka, S. Tristram-Nagle and J. F. Nagle, J. Membr. Biol., 2006, 208, 193–202 CrossRef PubMed.
- R. M. Venable, F. L. Brown and R. W. Pastor, Chem. Phys. Lipids, 2015, 192, 60–74 CrossRef CAS PubMed.
- N. Kučerka, J. F. Nagle, J. N. Sachs, S. E. Feller, J. Pencer, A. Jackson and J. Katsaras, Biophys. J., 2008, 95, 2356–2367 CrossRef PubMed.
- M. Hamm and M. Kozlov, Eur. Phys. J. E: Soft Matter Biol. Phys., 2000, 3, 323–335 CrossRef CAS.
- J. F. Nagle, Chem. Phys. Lipids, 2017, 205, 18–24 CrossRef CAS PubMed.
- G. Fiorin, L. R. Forrest and J. D. Faraldo-Gómez, PNAS nexus, 2023, 2, pgad269 CrossRef PubMed.
- A. J. Sodt, R. Venable, E. Lyman and R. Pastor, Phys. Rev. Lett., 2016, 117, 138104 CrossRef CAS PubMed.
- H. A. Faizi, R. Dimova and P. M. Vlahovska, Biophys. J., 2022, 121, 910–918 CrossRef CAS PubMed.
- C. Herold, P. Schwille and E. P. Petrov, Phys. Rev. Lett., 2010, 104, 148102 CrossRef CAS PubMed.
- Y. Nojima and K. Iwata, J. Phys. Chem. B, 2014, 118, 8631–8641 CrossRef CAS PubMed.
- Y. Wu, M. Štefl, A. Olzyńska, M. Hof, G. Yahioglu, P. Yip, D. R. Casey, O. Ces, J. Humpolčková and M. K. Kuimova, Phys. Chem. Chem. Phys., 2013, 15, 14986–14993 RSC.
- G. Chwastek, E. P. Petrov and J. P. Sáenz, ChemBioChem, 2020, 21, 836–844 CrossRef CAS PubMed.
- A. Zgorski, R. W. Pastor and E. Lyman, J. Chem. Theory Comput., 2019, 15, 6471–6481 CrossRef CAS PubMed.
- B. J. Kirby, P. A. Kienzle, B. B. Maranville, N. F. Berk, J. Krycka, F. Heinrich and C. F. Majkrzak, Phase-sensitive specular neutron reflectometry for imaging the nanometer scale composition depth profile of thin-film materials, Curr. Opin. Colloid Interface Sci., 2012, 17, 44–53 CrossRef CAS.
Footnote |
| † Electronic supplementary information (ESI) available. See DOI: https://doi.org/10.1039/d4sm01312c |
| This journal is © The Royal Society of Chemistry 2025 |

