 Open Access Article
Creative Commons Attribution 3.0 Unported Licence
Development of colorimetric PEG-based hydrogel sensors for urea detection†
Spyridon
Efstathiou
a,
Alan M.
Wemyss
 b,
Despina
Coursari
 a,
Rachel A.
Hand
 a,
Emmett Cullen
Tinley
c,
Jane
Ford
c,
Stephanie E.
Edwards
 c,
Susan
Bates
c,
Richard L.
Evans
c,
Susan
Bates
c,
Richard L.
Evans
 c,
Ezat
Khoshdel
ac and
David M.
Haddleton
 *a
*a
aDepartment of Chemistry, University of Warwick, Gibbet Hill Road, Coventry CV4 7AL, UK. E-mail: d.m.haddleton@warwick.ac.uk
bInternational Institute for Nanocomposite Manufacturing, WMG, University of Warwick, CV4 7AL Coventry, UK
cUnilever Research & Development, Port Sunlight, Bebington CH63 3JW, UK
First published on 18th February 2025
Abstract
Urea has environmental, agricultural and clinical importance being present in many bodily fluids including blood, urine, tears and sweat. Monitoring urea levels is crucial, serving as an early warning for many health issues such as dehydration, kidney and liver malfunctions. Herein, semi-interpenetrating network (semi-IPN) poly(ethylene glycol) (PEG) based hydrogels (PEG700-DA/PEGx, x = Mn) were developed as sensors for the colorimetric detection of urea. Urea was detected using the urease/phenol red assay where a colorimetric change to fuchsia occurred due to pH shifts. Hydrogels were synthesised through photo-induced free radical polymerisation where the phenomenon of polymerisation-induced phase separation (PIPS) occurred. Both pristine and sensor gels were characterised. Stability and kinetic experiments on free urease were performed giving further insights into the sensors response to urea. Finally, the detection of urea by the naked-eye from model sweat mixtures was successful for concentrations as low as 0.3 mM, while preliminary results from a proposed smartphone-based RGB quantification demonstrated an LOD of 0.8 mM and an LOQ of 2.7 mM in the green channel.
Introduction
Biosensors play a crucial role in clinical diagnosis and pharmaceutical development, providing insights into biological interactions at the molecular level. Their versatility can, for example, enable rapid and routine monitoring of critical care patients, eliminating the need for visits to clinical laboratories.1 Among the many different types of biosensors, enzyme-based ones prevail due to their high specificity, sensitivity and rapid response. They usually operate with biological recognitions facilitated by enzymes which selectively catalyse biochemical reactions with targeted analytes.2 Preserving the structure and activity of the enzymes is essential for both analyte detection and sensor sensitivity.3 Common immobilisation techniques include physical adsorption, covalent binding, covalent crosslinking, and physical entrapment. Well-known commercially available enzyme-based biosensors are those for glucose and urea detection with the former usually utilising glucose oxidase and the latter urease enzyme.4,5Urea is the primary nitrogenous waste compound of many living organisms discarded mainly by the kidneys and via perspiration.6 Although it is mostly associated with biological processes, it is also present in natural ecosystems such as in soil and as synthetic fertiliser for agriculture. The concentration of urea in plasma serum, saliva and sweat varies depending on human activity, surroundings or even sample collection for analysis. The concentration of sweat urea in healthy subjects at ambient temperature ranges from 5.4–8.9 mM.7 A study by Huang et al.8 reported that the concentration of sweat urea after physical exercise and external heat is close to 22.2 mM.
The rapid and efficient detection of urea levels is important for individual health. Elevated urea levels can cause nerve damage with severe side effects such as blockage of the urinary tract and dehydration, while low levels are associated with the risk of liver and kidney failure.9 The detection and quantification of urea in biofluids has so far been achieved by various analytical approaches including colorimetry. Although the most traditional colorimetric approaches such as the Jung, the Berthelot and the urease/phenol red method suffer from quite tedious sample preparation, they have recently been incorporated into smart sensing devices due to their fast response times. In a recent study, the Berthelot method (indophenol detection at λ = 540 nm) was used to detect and quantify urea using poly-electrolyte microcapsules with entrapped urease. The sensor demonstrated a detectable range of 5–50 mM.10 The urease/phenol red method stands out as the most prevalent biochemical assay for detecting urea in biological samples. This assay relies on the enzymatic activity of urease which catalyses the hydrolysis of urea into ammonia and carbon dioxide. The released ammonia increases the local pH inducing a distinct red/fuchsia colour change owing to the pH sensitivity of the indicator thus providing a reliable method for urea detection. In 2018, Soni et al.11 introduced a simple strategy for detecting the levels of urea in saliva after immobilising urease and phenol red on filter paper strips. The filter papers turned pink upon the addition of urea and the colour change was detected by smartphone spectroscopy with a limit of detection (LOD) of 1.7 mM.
Hydrogels are often used in the sensing field as stimuli-responsive materials or host matrices for biomolecules and recognition elements. Their 3D structure provides a large surface area for immobilisation whilst their hydrated microenvironment mimics biological tissue, helping enzymes to retain their activity.12 Hydrogel sensors have been developed for the monitoring of urea. A urea-responsive hydrogel biosensor was formulated by Erfkamp et al.13 able to change its swelling properties upon exposure to urea. The pH-sensitive hydrogel was formulated from acrylic acid (AA) and dimethylaminoethyl methacrylate (DMAEMA) using a bisacrylamide (Bis) crosslinker. Urease was physically entrapped in the matrix upon polymerisation catalysing the hydrolysis of urea into ammonia. The increase in pH induced electrostatic repulsions between the side groups of the network leading to swelling. The sensor demonstrated a large sensitivity range (1–20 mM) with long term stability (8 weeks) while the swelling alternations were transformed into a voltage signal using a piezoresistive sensor. In a further example, a colorimetric urea sensor strip was prepared by combining PEG-based hydrogels, urease, and commercial pH-indicator papers.14 Urease was physically entrapped in poly(ethylene glycol) (PEG)-based gels which were coated on the surface of pH strips by UV photocuring. Addition of urea once again triggered its hydrolysis from urease making it visually detectable on the surface of the strip. The sensor exhibited a fast response (1 min) with good reproducibility while incorporation of urease did not alter the thermal and swelling properties of the gels. Quantification of the colorimetric change was based on an RGB (red, green, blue intensities) methodology using a colour analyser. The strip demonstrated a good linear range between 3.3–33.3![[thin space (1/6-em)]](https://www.rsc.org/images/entities/char_2009.gif) mM with an LOD of 3.3
mM with an LOD of 3.3![[thin space (1/6-em)]](https://www.rsc.org/images/entities/char_2009.gif) mM when observed by the naked eye, and 0.57
mM when observed by the naked eye, and 0.57![[thin space (1/6-em)]](https://www.rsc.org/images/entities/char_2009.gif) mM by the colour analyser. Recently, a flexible wearable urea sensor patch was developed by incorporating upconversion optical nanoparticles and p-dimethylaminocinnamaldehyde (p-DMAC) in a polyacrylamide hydrogel matrix.15 Urea was detected by fluorescence signals emitted after interaction of the molecule first with p-DMAC and then with the nanoparticles under near-infrared (NIR) excitation. The sensing methodology demonstrated benefits against traditional colorimetric approaches which are susceptible to interferences from ambient light and skin colour, showcasing improved resolution and accuracy. The in situ quantification of urea was achieved by determining the upconversion luminescence RGB values on the surface of the patches using a modified smartphone with a low LOD of 30 μM.
mM by the colour analyser. Recently, a flexible wearable urea sensor patch was developed by incorporating upconversion optical nanoparticles and p-dimethylaminocinnamaldehyde (p-DMAC) in a polyacrylamide hydrogel matrix.15 Urea was detected by fluorescence signals emitted after interaction of the molecule first with p-DMAC and then with the nanoparticles under near-infrared (NIR) excitation. The sensing methodology demonstrated benefits against traditional colorimetric approaches which are susceptible to interferences from ambient light and skin colour, showcasing improved resolution and accuracy. The in situ quantification of urea was achieved by determining the upconversion luminescence RGB values on the surface of the patches using a modified smartphone with a low LOD of 30 μM.
Hydrogel biosensors with tuneable mechanical properties can provide both design flexibility as well as ensure effective monitoring of analytes. Among hydrogels, a distinct category are chemically crosslinked PEG networks, typically formed through radical polymerisation of poly(ethylene glycol) diacrylate (PEG-DA) crosslinkers. These materials are a common source of artificial hydrogels for tissue engineering, drug and cell delivery, showcasing high biocompatibility, water solubility, and anti-fouling properties.16 Studies have demonstrated that although PEG-DA hydrogels have comparable stiffness to the human cartilage (Young's modulus ∼ 104–107 Pa), their toughness is much lower as the strain at break decreases by increasing crosslinker content.17 Nevertheless, PEG-DA crosslinkers have been widely used in hydrogel sensor formulations due to their high resistance, controlled swelling, and cost-effective synthesis. In 2018, Yetisen et al.18 introduced hydrogel optical fibres that can continuously sense glucose in interstitial fluid. The hydrogel fibres consisted of a poly(acrylamide)-co-poly(ethylene glycol) diacrylate core functionalised by phenylboronic acid that could complex with glucose molecules. More recently, Yang et al.19 developed wearable microfluidic contact lenses capable of detecting analytes including urea, glucose and chloride ions from human tears via colorimetric changes. The contact lens was based on a UV-curable hydrogel composed of poly(dodecanediol citrate) (mPDC) and PEG-DA as crosslinker (to increase the hydrophilicity). It was found that the curing time and PEG-DA concentration affected the mechanical properties of the crosslinked material while in vitro tests were successful serving as a future multi-target device for diagnostics.
Macroporous PEG hydrogel arrays were developed by both Lee et al.20 and Decock et al.21 for microfluidic applications. PEG-DA semi-interpenetrating polymer networks (semi-IPNS) were photocured after the incorporation of PEG homopolymer chains with various molecular weights as porogens. The introduction of PEG in the PEG-DA networks caused polymerisation-induced phase separation (PIPS) leading to microporous opaque hydrogels with high permeability to both small and macromolecules, limited swelling characteristics, enhanced sensitivity to proteins due to increased solute diffusion and retention of mechanical properties after use. Removal of the free PEG chains was pivotal to attaining micro or microporous structures. Nevertheless, to our knowledge, the mechanical, viscoelastic and thermal characteristics of such materials have not been thoroughly explored, nor has their potential application as sensor platforms investigated.
Herein, our goal was to develop an inexpensive/affordable, readily prepared and user-friendly colorimetric hydrogel biosensor capable of detecting urea in biological fluids. PEG-DA hydrogels mixed with PEG homopolymer chains were a suitable material choice not only due to limited material characterisation in literature but also due to the PIPS phenomenon. This phenomenon would lead to opaque gels which was seen as a positive feature to amplify the contrast and signal during analysis. The urea detection mechanism relied on the well-established urease/phenol red assay simplifying the detection process whilst reducing the overall cost of goods. Pristine and hydrogel sensors (containing urease/phenol red) of poly(ethylene glycol) diacrylate/poly(ethylene glycol), PEG700-DA/PEGx (x = 600 or 1000 or 3000 g mol−1) were prepared through a photoinduced free radical polymerisation process. The effect of phenol red and PEGx concentration was explored. The sensors response was evaluated using standard solutions of urea and artificial sweat mixtures, while the stability of free urease in solution after exposure to high intensity UV light was also investigated by circular dichroism (CD). Finally, in situ quantification of urea on the surface of sensors was achieved by the determination of the RGB values using a regular smartphone.
Results and discussion
Synthesis of PEG700-DA/PEGx hydrogel formulations
The initial goal was to formulate PEG-DA/PEGx (where x = PEG's number average molecular weight, Mn) hydrogels and study the impact of PEGx, including both concentration and molecular weight, on the properties of these materials. Three different PEGx homopolymers were chosen (Mn = 600, 1000 and 3000 g mol−1) and incorporated at various concentrations giving hydrogels containing 24.6, 39.5 and 52.1 vol% of PEGx. Photocure was chosen due to rapid crosslinking times, spatial control and the low temperature requirement. The photoinitiator of choice was Irgacure®1173 (2-hydroxy-2-methylpropiophenone) used at a concentration of 0.4 mol%. Water content was crucial for phase separation in PEG-DA/PEG networks requiring a solid content >60 wt% to occur.22 Thus, relatively high solid contents were used to ensure the formation of translucent gels. Finally, a PEG700-DA (Mn = 700 g mol−1) crosslinker was chosen as it had previously demonstrated high protein permeability without the formation of brittle materials.20 The optimum crosslinker concentration was found to be ∼3.4 mol% after viscoelastic evaluation and swelling tests on formulations with 0.5, 1.0, 2.0 and 3.5 mol% of PEG700-DA (Fig. S2 and S3, ESI†). A summary of the hydrogel formulations studied is provided in Table 1.| x/Mn (g mol−1) | PEG700-DA (mol%) | PEGx (vol%) | PEGx (wt%) | Irgacure®1173 (mol%) | Solid content (wt%) |
|---|---|---|---|---|---|
| 600 | 3.4 | 24.6 | 25.6 | 0.4 | 69.7 |
| 600 | 3.3 | 39.5 | 40.9 | 0.4 | 75.9 |
| 600 | 3.2 | 52.1 | 53.5 | 0.4 | 81.1 |
| 1000 | 3.4 | 24.6 | 26.8 | 0.4 | 70.2 |
| 1000 | 3.4 | 39.5 | 42.3 | 0.4 | 76.5 |
| 1000 | 3.3 | 52.1 | 55.0 | 0.4 | 81.7 |
| 3000 | 3.5 | 24.6 | 27.0 | 0.4 | 70.2 |
| 3000 | 3.5 | 39.5 | 42.5 | 0.4 | 76.6 |
| 3000 | 3.4 | 52.1 | 55.2 | 0.4 | 81.7 |
Hydrogels were cast into polytetrafluoroethylene (PTFE) disc moulds and cured for 10 s using a high intensity UV irradiated conveyor belt (λ = 200–280 nm) without any prior deoxygenation. Gels were crosslinked through free radical photopolymerisation mechanism, Scheme 1, where the initially homogeneous solution of PEG700-DA and PEGx phase separated and through the competition between gelation and phase separation, translucent semi-IPN heterogeneous networks were formed.23 The polymerisation conversion was monitored by 1H-NMR showing >99% monomer conversion with the disappearance of the vinyl proton peaks at δ = 6.0–7.0 ppm (Fig. S4, ESI†).
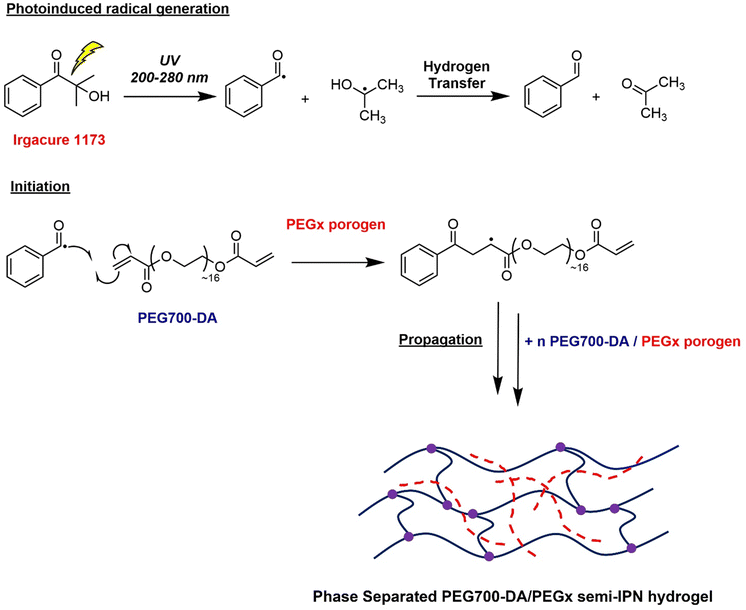 | ||
| Scheme 1 UV-initiated free radical crosslinking polymerisation process for the synthesis of PEG700-DA/PEGx semi-IPN networks. | ||
Swelling kinetics
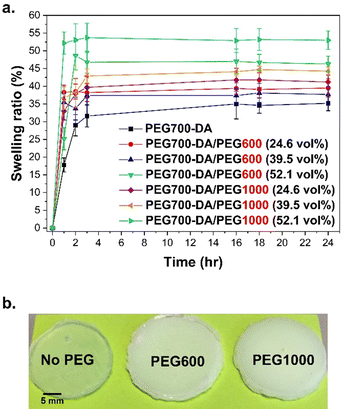
The swelling kinetics were measured over 24 h using PEG700-DA/PEG1000 and PEG700-DA/PEG600 formulations. A comparison with PEG700-DA hydrogels (3.5 mol% crosslinker with no free PEGx) was conducted which led to brittle materials with differing opacity in comparison to the semi-IPN networks due to the absence of phase separation, Fig. 1(b).All hydrogels showed an initial increase in swelling within the first 3 h, finally reaching a plateau that was dependent on the content and molecular weight of the PEGx, Fig. 1(a). PEG700-DA hydrogels demonstrated the lowest swelling profile reaching ∼35.0%, because of higher crosslink density. An increase in the PEGx content increased swelling due to higher interactions (hydrogen bonds) between water molecules and the hydrophilic sites (–O–, –OH) of PEGx homopolymers.24 Specifically, formulations containing PEG600 at 24.6 and 52.1 vol% plateaued at ∼38.0 and ∼47.0% respectively. Similar trends were found with PEG1000 containing formulations. A further factor of importance was the molecular weight of PEGx, with those containing PEG600 demonstrating lower swelling ratios relative to those containing PEG1000 for all comparable concentrations. For example, at 39.5 vol%, hydrogels containing PEG600 reached a swelling ratio of ∼37.0% whilst PEG1000 reached ∼45.0%. This trend was once more attributed to the higher interactions of longer PEG chains with water molecules.
Evaluation of mechanical and viscoelastic properties of pristine gels
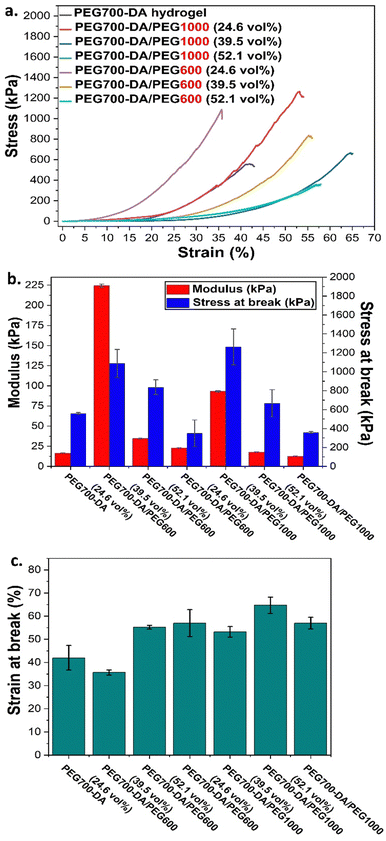
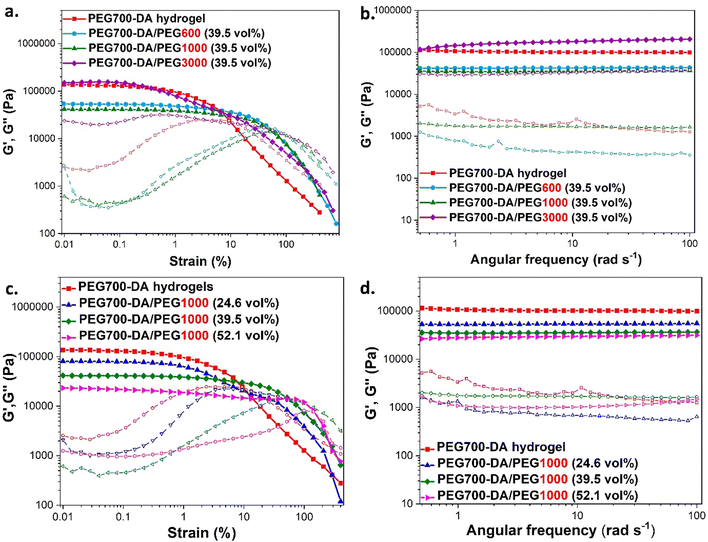
Pristine PEG700-DA/PEGx hydrogels were evaluated by compression testing to investigate the effect of concentration and molecular weight of PEG on the mechanical properties (Fig. 2). We required a material which is elastomeric with a low modulus and high strain at break. Compression was chosen against tensile strength testing considering it more relevant to the targeted application. Hydrogels were cast in cylindrical button moulds with the plain PEG700-DA gels developing macroscopic cracks after crosslinking indicative of a brittle character, Fig. S5 (ESI†). More specifically, PEG700-DA hydrogels demonstrated a low strain at break (∼42.0%) with a comparatively low compressive modulus (∼16.5 kPa) at 10% deformation attributing that to existing macrocracks before the analysis. Nevertheless, values agreed well with reported literature with PEG-DA hydrogels demonstrating compressive modulus values in the range of 7–70 kPa.25 An increase in the vol% of PEGx raised the elasticity as depicted by the lower compressive modulus and the higher strains at break noticed for both PEG1000 and PEG600 formulations. Specifically, PEG700-DA/PEG1000 (24.6 vol%) showcased a compressive modulus of ∼93.3 kPa which decreased by 7.4-fold when the PEG1000 content reached 52.1 vol% (∼12.6 kPa). Furthermore, the molecular weight of PEGx was an additional parameter affecting the materials properties with formulations containing PEG600 was stiffer compared to the ones containing PEG1000 at any examined concentration. Amongst the various hydrogel formulations, PEG700-DA/PEG1000 (39.5 vol%) demonstrated the highest compressive strain (∼65%) with a modulus of ∼18 kPa.The viscoelastic behaviour of these materials was assessed by plate-to-plate oscillatory rheology at 37 °C (to imitate skin temperature) monitoring the progress of the storage (G′) and loss (G′′) moduli with the data tabulated in Table S3 (ESI†). Initially, amplitude sweep experiments were conducted at a shear strain range of γ = 0.01–400% and a constant angular frequency of ω = 10 rad s−1 to determine the linear viscoelastic region (LVER), Fig. 3(a) and (c). Hydrogels exhibited varying crossover points between G′ and G′′, indicating a range of behaviours at high shear strains. There was no difference between the flow points of PEG700-DA and PEG700-DA/PEG1000 (39.5 vol%), however, an increase in the PEG1000 content raised the resistance to high shear strain with PEG700-DA/PEG1000 (52.1 vol%) demonstrating the highest crossover point at γ = 142%. The same trend was noticed by increasing molecular weight with PEG700-DA/PEG600 (39.5 vol%) formulations showing a lower strain at break (γ = 42%) compared to PEG700-DA/PEG1000 (39.5 vol%) (γ = 55%). Formulations with PEG3000 showed significantly lower crossover points attributed to the low solubility of the polymer in the pre-cured hydrogel mixture at 76.6 wt% solid content.
Frequency sweep experiments were conducted at ω = 0.5–100 rad s−1 using a constant strain of γ = 0.1%, Fig. 3(b) and (d). In all cases, the G′ values exceeded the values of G′′ indicating the formation of stable crosslinked networks with a G′ plateauing across the entire range of angular frequencies. Increasing the PEGx content resulted in network relaxation, as evident by the lower G′ values that supported the formation of softer gels. Specifically, PEG700-DA hydrogels demonstrated a relatively high G′ value ∼104![[thin space (1/6-em)]](https://www.rsc.org/images/entities/char_2009.gif) 600 Pa that decreased by 0.5 and 0.3-folds after incorporation of PEG1000 at 24.6 and 52.1 vol% respectively. A decrease in the crosslink density was also observed by incorporating higher molecular weight PEGxs with PEG700-DA/PEG600 (39.5 vol%) demonstrating a G′ value of ∼42
600 Pa that decreased by 0.5 and 0.3-folds after incorporation of PEG1000 at 24.6 and 52.1 vol% respectively. A decrease in the crosslink density was also observed by incorporating higher molecular weight PEGxs with PEG700-DA/PEG600 (39.5 vol%) demonstrating a G′ value of ∼42![[thin space (1/6-em)]](https://www.rsc.org/images/entities/char_2009.gif) 000 Pa that decreased by 0.8-fold after the addition of PEG1000 at the same concentration. Hydrogels containing PEG3000 continued to showcase inconsistencies due to existing insoluble parts.
000 Pa that decreased by 0.8-fold after the addition of PEG1000 at the same concentration. Hydrogels containing PEG3000 continued to showcase inconsistencies due to existing insoluble parts.
A reduction in the crosslink density following the addition of PEGx porogens has been previously reported.20 The free radical crosslinking of diacrylates gives heterogeneous networks (loops, entanglements, unreacted functionalities),26 forming areas with low and high crosslink density. A higher concentration or a larger PEGx possibly increased the heterogeneity of the network by excluding the polymerisation of PEG700-DA thus dropping the crosslink density. Compression results seemed to complement the rheology data as hydrogels with higher crosslink densities also demonstrated higher compressive modulus with lower strain at break.
Thermal characterisation
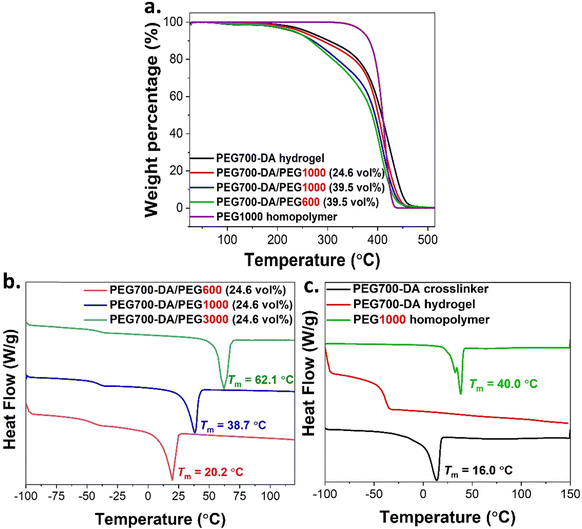
The thermal properties were investigated by thermogravimetric analysis (TGA) and differential scanning calorimetry (DSC). Initially, the weight loss of fully crosslinked PEG700-DA and PEG700-DA/PEGx hydrogels was assessed in the temperature range of 25–600 °C, Fig. 4(a) and Fig. S6 (ESI†), while for comparison, PEG1000 homopolymers were also analysed showing a 97% mass loss at 414 °C. This loss was attributed to the scission reactions of the main (–CH2CH2–O–) backbone.27 The degradation profiles of PEG700-DA hydrogels demonstrated two decomposition peaks at 270 °C (10% mass loss) and 425 °C (82% mass loss). Similarly, the 82% mass loss was attributed to the degradation of the main PEG backbone though the 10% mass loss required further investigation. A similar weight loss at 250 °C was also reported by Ponnuvelu et al.28 and Li et al.,29 attributing it to either impurities or a mismatch respectively. To obtain additional information, PEG700-DA was analysed by MALDI-ToF, Fig. S7 (ESI†), showing the existence of PEG monoacrylate species potentially originating from its commercial synthesis. Likewise, the thermal stability of the semi-IPN networks was assessed showing the same 70% mass loss in the temperature range of 340–480 °C being independent of molecular weight and vol% variations of PEGx chains. A 1.0% mass loss at ∼100 °C was attributed to trapped water evaporation while the 20–23% mass loss at 250 °C arose from crosslinked PEG monoacrylate species.DSC analysis revealed the absence of glass transition temperature (Tg) for PEG700-DA crosslinker but instead the appearance of a distinct melting peak at Tm = 16.0 °C characteristic of semi crystallinity, Fig. 4(c) and Table S4 (ESI†). After curing to a PEG700-DA hydrogel, the formation of a stable polymer network caused the disappearance of Tm and the appearance of a Tg = −39.2 °C, explained by the restricted polymer chains movement. A negative glass transition temperature was characteristic of elastomeric materials indicating softness and flexibility at room temperature.30 Similarly, PEG1000 homopolymer showed no Tg but rather a bimodal melting peak of the PEG crystal phase at Tm = 40.0 °C attributing the bimodality to different folding numbers of lamellar domains.31
The DSC profiles of selected PEG700-DA/PEGx formulations, containing 24.6 vol% of different PEGx chains, revealed characteristics of both their constituent components with the appearance of a Tg and a Tm, Fig. 4(b). Incorporation of PEGx in PEG700-DA networks had a minor effect on their Tg. The Tm values ranged between 16–62 °C complementing the results obtained from previous studies on PEGs.32 An increase in the MWt of PEGx chains raised the Tm, a trend associated with the tendency of higher MWt chains to form crystalline phases due to their lower segmental motion.33
Developing the hydrogel urea sensor
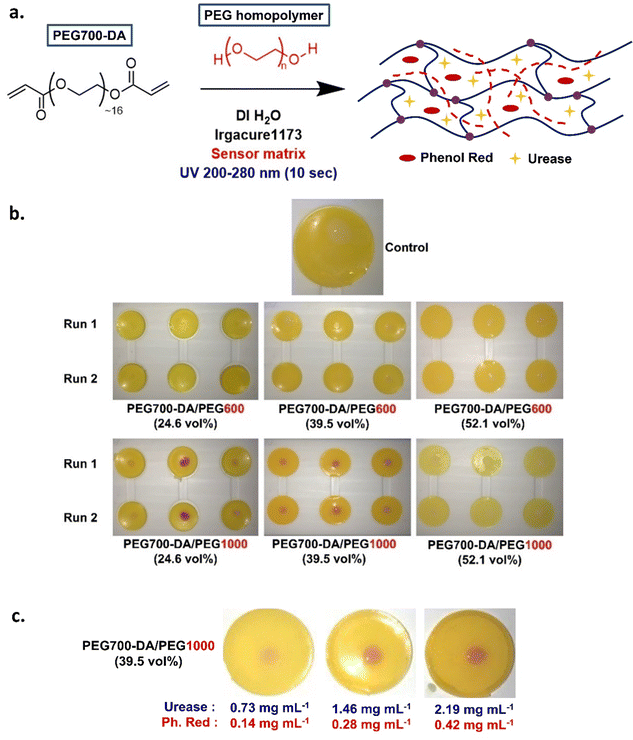
As mentioned previously, the urea sensor was based on the urease/phenol red assay, Fig. S8 and S9 (ESI†).Pristine PEG700-DA/PEGx hydrogels were converted into sensors by incorporating urease and phenol red in the precured hydrogel mixture, Fig. 5(a). In a preliminary test, a mixture containing PEG700-DA crosslinker, PEG1000 (24.6 vol%), deionised water (DI H2O) and photoinitiator was mixed with “sensor matrix” (solution containing urease and phenol red at a predetermined concentration in DI H2O) to a final concentration of 0.73 mg mL−1 urease and 0.14 mg mL−1 phenol red. The dilution factor of the precured mixture was 1.1 and used in all sensor formulations giving optimum results. After 10 s of UV curing, yellow hydrogels were formed which were easily removed from their casting molds. The sensor's fuchsia response to 0.015 M of urea was clear demonstrating limited droplet diffusion, Fig. S10 (ESI†). Directly dissolving these components in the precured hydrogel mixture was ineffective due to solubility issues.
PEG700-DA/PEG600 and PEG700-DA/PEG1000 sensors were prepared at a thickness of 1.43 mm to examine their response to different urea concentrations. Hydrogels contained 0.73 mg mL−1 of urease and 0.14 mg mL−1 of phenol red were cast and their colorimetric response tested with 0.002, 0.015, and 0.02 M urea solutions in duplicates. Images were taken after 10 min of exposure to ensure the reaction completion, Fig. 5(b) with response times tabulated in Table S5 (ESI†). Due to the high opacity of the sensors, UV-vis monitoring of the colorimetric changes was not possible, thus preliminary response times were based on naked-eye detection of the fuchsia colour appearance.
None of PEG700-DA/PEG600 responded to urea while among the PEG700-DA/PEG1000 sensors, only those containing 24.6 and 39.5 vol% of PEG1000 developed a fuchsia colour at different response times and intensities. PEG700-DA/PEG1000 (24.6 vol%) sensors had a slower response time (∼8 min) than PEG700-DA/PEG1000 (39.5 vol%) (∼4 min) with the former showing colour intensity inconsistencies and variable droplet diffusion. In contrast, PEG700-DA/PEG1000 (39.5 vol%) sensors exhibited minor droplet diffusion with an increasing colour intensity with higher urea concentration, indicating potential for quantification. The PEG700-DA/PEG1000 (52.1 vol%) sensors only responded to the highest concentration of urea with a delayed response time of over 15 min.
The exact reasons for the non-responsiveness of some of the sensors are unknown but speculated to relate to the diffusion of urea, the distribution of urease in the network and the crosslink density of the hydrogels. As reported by Lee et al.20 PEG porogens in PEGDA gels permit the diffusion of small solutes and large macromolecules by inducing microporosity after removal of the porogen. It was hypothesised that since PEG porogens were not removed, they acted as barriers within the heterogeneous network reducing the interactions between molecules simultaneously concentrating most of the enzyme and indicator on the surface of the sensors. PEG600 likely created a smaller barrier than PEG1000, easing the distribution of components within the network core thus delaying the interactions of urea with urease on the surface leading to no visible response. Conversely, PEG1000 possibly created an appropriate barrier concentrating urease and phenol red on the surface, inducing a colorimetric response with urea. PEG700-DA/PEG1000 (39.5 vol%) appeared to be the most appropriate sensor formulation to focus on, as it demonstrated the lowest response time and highest strain % at break in its pristine form.
To understand the effect of the concentration of urease and phenol red, their amounts were varied to examine response times and colour intensity against 0.02 M of urea. Representative images are shown in Fig. 5(c). By doubling both the concentration of urease and phenol red, the response time was reduced to half (2 min) demonstrating a higher intensity due to an accelerated enzymatic reaction.34 Further increasing the concentration of urease and phenol red (at 2.19 and 0.42 mg mL−1 respectively) did not improve response time.
The effect of gel thickness was evaluated by casting 0.65 mm thick PEG700-DA/PEG1000 (39.5 vol%) sensors containing 1.46 mg mL−1 urease and 0.28 mg mL−1 phenol red, Fig. S11 (ESI†). The response time was 4 minutes, which was longer than expected. This delay was attributed to higher UV exposure affecting urease activity.
Phenol red effect on hydrogel sensors
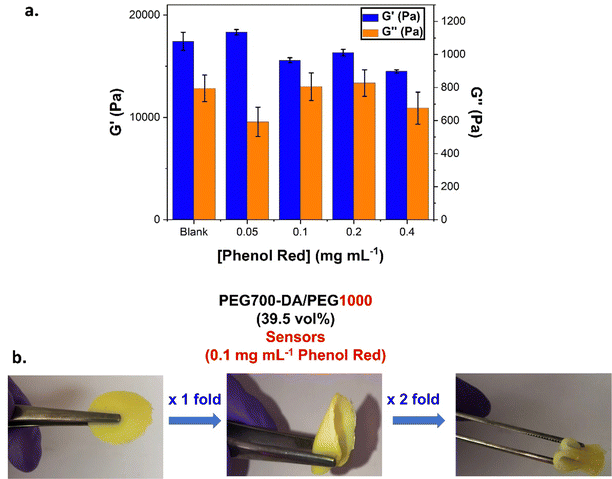
The impact of chromophoric phenol red on the UV curing and properties of the gels was investigated. PEG700-DA/PEG1000 (39.5 vol%) were cast containing different concentrations of phenol red (0.05, 0.1, 0.2 and 0.4 mg mL−1). A blank hydrogel was also formulated by dilution with water. Due to the small dilution factor, there was no change in the mol% of the photoinitiator, however, the mol% of PEG700-DA dropped from 3.5% in the pristine gels to 2.5% in the sensors, Table S6 (ESI†). The viscoelastic properties were next determined by oscillatory rheology, Fig. 6(a) and Fig. S12 (ESI†). Amplitude sweeps, Fig. S12(a) (ESI†), revealed an increase in the crossover points in comparison to the pristine analogues (γ = 55.3%). This was the same for both the blank and the phenol red containing samples indicating that this raise was not caused by phenol red but by the lower solid content and reduced mol% of crosslinker. The reduction of the mol% crosslinker led to more flexible materials with higher tolerance to deformation, Fig. 6(b). Frequency sweeps, Fig. S12(b) (ESI†), showed stable crosslinked networks with G′ always exceeding G′′. Blank samples showcased an expected 0.5-fold decrease in their G′ compared to pristine formulations. Interestingly, raising the concentration of phenol red, led to a decreasing trend which was indicative of interference with the free radical crosslinking process. Sensors containing 0.1 mg mL−1 of phenol red gave a G′ = 18![[thin space (1/6-em)]](https://www.rsc.org/images/entities/char_2009.gif) 300 Pa which dropped by 0.8-fold at 0.4 mg mL−1, (G′ = 14
300 Pa which dropped by 0.8-fold at 0.4 mg mL−1, (G′ = 14![[thin space (1/6-em)]](https://www.rsc.org/images/entities/char_2009.gif) 500 Pa), Table S6 (ESI†). To further support this finding, a higher concentration of phenol red (10 mg mL−1) was used eventually leading to no curing, Fig. S13 (ESI†).
500 Pa), Table S6 (ESI†). To further support this finding, a higher concentration of phenol red (10 mg mL−1) was used eventually leading to no curing, Fig. S13 (ESI†).
Further 1H-NMR analysis revealed that neither the dilution of the mixture nor phenol red up to 0.2 mg mL−1 affected monomer conversion due to absence of monomer proton peaks in the range of δ = 6.3–7.0 ppm, Fig. S14 (ESI†). In contrast, formulations with 0.4 mg mL−1 phenol red showed incomplete polymerisation as seen by the presence of monomer peaks in the vinyl region.
The absorption spectra for both Irgacure®1173 and phenol red were recorded at different concentrations, Fig. S15(a) and (b) (ESI†). PEG700-DA and PEGx were not considered due to a low molar extinction coefficient.35 The gels were formed using UV light in the range of λ = 200–280 nm. Both Irgacure®1173 and phenol red showed distinct absorption peaks at λ = 270 nm. The molar extinction coefficients (ε) of each molecule were thus determined for λ = 270 nm, Fig. S15(c) and (d) (ESI†), with phenol red showing a much higher value (ε270nm = 13![[thin space (1/6-em)]](https://www.rsc.org/images/entities/char_2009.gif) 200 L mol−1 cm−1) compared to that of the photoinitiator (ε270nm = 4900 L mol−1 cm−1). Results indicated that phenol red absorbed significantly more UV light than the photoinitiator which affected radical generation, monomer conversion and crosslink density. The reduced concentration of radicals possibly led to the formation of higher molecular weight chains between crosslinks, thereby dropping the crosslink density.26
200 L mol−1 cm−1) compared to that of the photoinitiator (ε270nm = 4900 L mol−1 cm−1). Results indicated that phenol red absorbed significantly more UV light than the photoinitiator which affected radical generation, monomer conversion and crosslink density. The reduced concentration of radicals possibly led to the formation of higher molecular weight chains between crosslinks, thereby dropping the crosslink density.26
Tack properties of pristine and sensor gels
Tack was initially evaluated qualitatively by “finger tack testing” and found to be relatively low. The inverted probe technique was used for quantification using the metal plate of a rheometer. The force required to separate the materials was measured, resulting in negative normal force peaks (indicative of tack) while the area under the curves represented adhesion.Initially, pristine PEG700-DA/PEG1000 hydrogels with different PEG1000 amounts were compared, Fig. S16(a) (ESI†) with data in Table S7 (ESI†). Samples with 52.1 vol% PEG1000 demonstrated the highest tack (−23.02 ± 2.16 N) and adhesion attributed to a lower crosslink density,36 while formulations with 24.6 vol% showed no detectable negative force peaks indicative of low tack. Tests at 37 °C showed no differences compared to 25 °C, Fig. S16(b) (ESI†). Finally, sensors with 0.73 mg mL−1 urease and 0.14 mg mL−1 phenol red showed no differences from the pristine gels, Fig. S16(c) (ESI†).
Urease stability and kinetic studies
Factors affecting the enzymatic activity of free urease after exposure to high temperature and UV, were subsequently investigated. Experiments did not represent the actual curing conditions of the gels where thickness and rate of radical formation may alter the enzymatic activity.Circular dichroism (CD) was employed to study the secondary structure of free urease at various conditions. Initially, experiments were conducted at 25 °C showing an expected CD spectrum,37 with one positive sharp band at 197 nm characteristic of a dominant α-helix along with two broad negative bands of close magnitude at λ = 208 and 220 nm attributed to α-helix and α-helix/β-sheet contributions respectively, Fig. S17(a) (ESI†). Storing the enzyme for 6 days at ambient temperature led to a conformational loss suggesting a low stability. Conformational changes were also temperature dependent, Fig. S17(b) (ESI†). Specifically, by increasing the temperature from 25 to 37 °C, a minor decrease in the intensity of the peak at 197 nm peak was observed indicating a reduction of α-helical character with the two negative bands at 208 and 220 nm remaining unaltered.
At higher temperatures, small changes in the negative bands at 208 and 220 nm appeared along with a continuous reduction of the 197 nm peak suggesting continuous reductions of the α-helical character. Although these data did not provide clear information about the enzymatic activity of urease, there was no total loss of conformation at any examined temperature. Furthermore, increasing the UV exposure time did not affect the conformation at 208 and 220 nm, Fig. S17(c) (ESI†). However, the negative trend at 197 nm indicated that extensive exposure could damage the α-helical character without completely losing its conformation.
Urease kinetics were monitored by UV-vis keeping the concentration of urease and phenol red constant at 0.68 mg mL−1 and 0.03 mg mL−1 respectively. The urea hydrolysis was monitored at λ = 559 nm corresponding to the unprotonated form of phenol red. Raising the concentration of urea led to steeper kinetic curves finally reaching a plateau, Fig. S18(a) (ESI†). The enzymatic velocity was determined by the slope of the linear range of the kinetic curves.38 First order kinetics were found by plotting the substrate's concentration against velocity, Fig. S18(b) (ESI†), with a rate of 3.2 ± 0.4 M min−1 at 0.0008 M and 5.5 ± 0.1 M min−1 at 0.006 M. At 0.01 M, the rate plateaued due to saturation of the active sites.
The effect of UV light was studied after irradiation for 10 s prior to the addition of urea. The reaction rates reduced by 4.2 and 4.7-fold for 0.002 and 0.038 M of urea respectively agreeing with the observed conformational changes by CD, Fig. S18(c) and (d) (ESI†). Urease was not able to regain its activity after letting an assay mixture settle for 1 h showing a velocity of 1.05 ± 0.03 M min−1. These data suggested that gel UV curing potentially decreased the urea response though sensors were still operatable.
Model sweat experiments
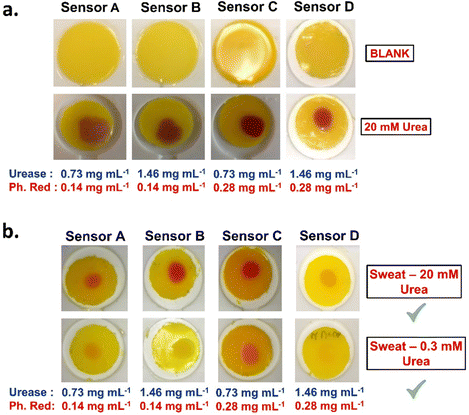
To simulate a real-life scenario, urea detection was examined in a model sweat mixture containing a fixed concentration of salts, proteins and urea. Three model sweat mixtures were prepared with 0.0 mM, 0.3 mM and 20 mM of urea. The mixtures were tested on PEG700-DA/PEG1000 (39.5 vol%) sensors with varying concentrations of urease and phenol red. These sensors are referred to as sensor A (0.73 mg mL−1 urease and 0.14 mg mL−1 phenol red), sensor B (1.46 mg mL−1 urease and 0.14 mg mL−1 phenol red), sensor C (0.73 mg mL−1 urease and 0.28 mg mL−1 phenol red) and sensor D (1.46 mg mL−1 urease and 0.28 mg mL−1 phenol red). Data on the viscoelastic properties of the fully formulated sensors are provided in Fig. S19 (ESI†) showing lower crosslink densities compared to their pristine equivalent.Sensors were initially tested against 20 mM of urea to confirm colorimetric response. All sensors turned fuchsia within 5 min with those containing higher concentrations of urease and phenol responding faster, Fig. 7(a). The controlled sweat solution without urea showed no colorimetric response, Fig. S20 (ESI†). Next, 20 μL from the rest model sweat mixtures were applied on the surface of the sensors showing a successful response to both sweat mixtures as assessed by naked-eye detection, Fig. 7(b). Differences in response times and colour intensities were observed, with sensor D responding faster and more intense to the 20 mM of urea (∼7 s) compared to the 0.3 mM of urea model sweat (∼1 min).
Smartphone-based quantification of urea
The change in colour intensity suggested that a potential quantification method might be achieved using smartphone spectroscopy. After capturing an image with a smartphone, the RGB (red, green, and blue) levels of a selected region were measured and correlated to the concentration of urea by converting them into absorbance intensity using eqn (1):| Absorbance = −log(Is/IB) | (1) |
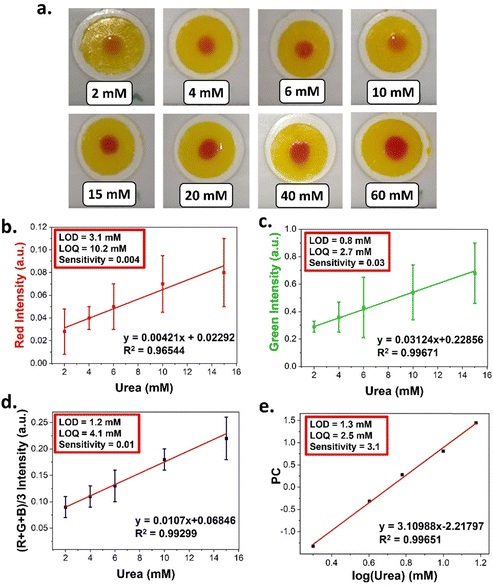
PEG700-DA/PEG1000 (39.5 vol%) sensors were formulated and tested against a range of urea solutions (2–60 mM). To minimise light interference, pictures were taken in a dark room using the LED flash of the smartphone as a single light source with an exposure time of 10 s while keeping a 25 cm distance between the samples and the smartphone. Representative images from the above experiments are provided in Fig. 8(a). The RGB levels of each fuchsia spot, were determined and converted into absorption intensities resulting in standard curves for red, green and (R + G + B)/3, Fig. S21 (ESI†). The blue channel demonstrated poor linearity hence was not considered.
Standard curves revealed that urea concentrations higher than 20 mM could not be differentiated due to signal saturation. Linear regions were observed in the 2–15 mM for the red, green, and average channel with a good linearity (R2 > 0.96) as shown in Fig. 8(b)–(d). An apparent drawback of the developed quantification methodology was the relatively high error bars attributed to reflections from the gel surfaces.
Finally, the sensitivity of each channel was found based on the slopes of their respective standard curves. The green channel exhibited the highest sensitivity to urea (0.03), while the red the lowest (0.004). The (R + G + B)/3 intensities had a sensitivity of 0.01 with an LOD (1.2 mM), LOQ (4.1 mM) and relatively lower error bars. The green channel demonstrated the lowest LOD (0.8 mM) and LOQ (2.7 mM) with commercial urea colorimetric assay kits operating over a range of 0.01–0.1 mM.40
As a further comparison, the RGB data were subjected to principal component analysis (PCA) to reduce the three variables into one principal component (PC).41 The calculated PC values were therefore used to attain a standard curve to the concentration of urea, Fig. 8(e) and Table S8 (ESI†). This approach demonstrated an LOD of 1.3 mM which was comparable to the average channel and an LOQ of 2.5 Mm which was the lowest attained. In addition, this method demonstrated the highest sensitivity (3.1).
Leachables and microstructure characterisation
Preliminary leachable experiments were performed by incubating PEG700-DA/PEG1000 (39.5 vol%) sensor gels on top of polydimethylsiloxane (PDMS) based artificial skin (Bioskin®) for 1 h at 37 °C. Pictures from the leachable study are provided in Fig. S22 (ESI†). After 1 h, the gels were extracted in DI H2O for 24 h to assure complete extraction of all soluble components. 1H-NMR spectroscopy, Fig. S23(a) (ESI†), confirmed the presence of PEG1000 (–CH2CH2–O– PEG backbone at δ = 3.4 and 3.5 ppm). The absence of proton signals in the δ = 6.0–7.0 ppm range indicated that the PEG700-DA crosslinker was not present, and no peaks corresponding to the photoinitiator were detected. Further confirmation of the absence of the photoinitiator was obtained through GC-FID with the missing peak at t = 9.3 min, Fig. S23(b) (ESI†). A calibration curve for the photoinitiator was attained using GC-FID with an LOD = 8.2 μM, Fig. S24 (ESI†). The PEG1000 content extracted was measured gravimetrically resulting in an extraction yield of 22.8%.The inner structure of the pristine materials was investigated by dry-state scanning electron microscopy (SEM). Hydrogels were analysed before and after Soxhlet extraction cycles in methanol to remove all free PEG chains revealing the true microstructure of the crosslinked network. SEM images are shown in Fig. S25 (ESI†). The comparison between a PEG700-DA and a pristine PEG700-DA/PEG1000 (39.5 vol%) gel prior extraction revealed that PEG700-DA had a much smoother interior with the latter having a much rougher and amorphous nonporous structure. Removal of PEG1000 after extraction seemed to form pores in all analysed PEG700-DA/PEG1000 pristine gels revealing a concentration trend. More specifically, the pores diameter seemed to increase at higher concentrations of PEG1000 with PEG700-DA/PEG1000 (24.6 vol%) demonstrating pores of 0.180 ± 0.110 μm, PEG700-DA/PEG1000 (39.5 vol%) of 0.319 ± 0.050 μm and PEG700-DA/PEG1000 (52.1 vol%) having a more interconnected interior with 1.420 ± 0.708 μm macroporous voids. Finally, SEM analysis of two PEG700-DA/PEG1000 (39.5 vol%) sensors with varying concentrations of urease and phenol red, Fig. S26 (ESI†), showed that the sensor with the lower concentration of both substances exhibited a much smoother interior. In contrast, the other sensor demonstrated a rougher structure possibly due to urease disrupting the formation of crosslinks during polymerisation.
Conclusions
PEG700-DA/PEGx hydrogels were developed as potential colorimetric urea sensors operating based on the urease/phenol red assay. Both the molecular weight and the content of PEGx altered the crosslink density of these materials tuning their viscoelastic, mechanical and thermal characteristics. Out of the formulated gels, the pristine PEG700-DA/PEG1000 (39.5 vol%) demonstrated relatively low swelling characteristics and good elasticity with a compressive modulus of ∼18 kPa and a strain at break of ∼65%. Same sensor gels achieved the lowest response time at ∼2 min for 1.46 mg mL−1 urease and 0.28 mg mL−1 phenol red. An interference between the indicator and photoinitiator was also observed, a consequence of overlapping absorption peaks leading to decreased crosslink densities and low monomer conversions for concentrations higher than 0.4 mg mL−1 of indicator. This interference increased the elasticity and strain at break of the materials based on rheology.Experiments conducted on free urease in solution revealed a limited lifespan when stored at ambient temperature as shown by CD. Reduction in both activity and velocity were observed after multiple UV exposures without however without comp denaturation. Finally, studies using model sweat mixtures were a strong indication that the developed sensor can detect urea from multicomponent mixtures with clear colorimetric changes to as low as 0.3 mM. Preliminary results from a smartphone-based approach showed the potential of this as a tool for quantitative analysis. According to the RGB analysis of PEG700-DA/PEG1000 (39.5 vol%) sensors with 1.46 and 0.28 mg mL−1 urease and phenol red respectively, an LOD of 0.8 mM and an LOQ of 2.7 mM was achieved in the green channel. While the highest sensitivity was achieved by processing statistically the RGB levels. This approach yielding the highest sensitivity (3.1) along with the lowest LOQ (2.5 mM). Commercial colorimetric urea assay kits based on the Jung's method exhibit a much lower LOD of <0.01 mM while kits based on the phenylalanine assay demonstrate an LOD of 0.01 mM with a low linear detection range of 0.01–0.1 mM.40 In contrast, the linear detection range of the developed sensor was 2–15 mM. Further work is required to reduce light interference and experimental errors by using either a dark box or a scanner for image capturing. Furthermore, optimising the image capturing by backlighting photography or 45° angled lighting could reduce interferences and improve the accuracy of the RGB analysis.42 Finally, a conjugation strategy for urease may also provide a viable solution to improve its stability and activity.
Author contributions
SE conducted the investigation, contributed to the conceptualisation and was responsible for writing the manuscript. AMW, DC, and RH contributed to the investigation and methodology. ECT contributed to the investigation. JF and SEE contributed to the investigation, methodology and supervision. RLE contributed to the investigation, methodology and conceptualisation. SB, EK and DMH were responsible for conceptualisation, supervision and funding acquisition.Data availability
The data supporting this article have been included as part of the ESI.†Conflicts of interest
Emmett Cullen Tinley, Jane Ford, Stephanie E. Edwards and Richard L. Evans are employees at Unilever Research & Development. Susan Bates and Ezat Khosdel were employees at Unilever Research & Development at the time this study was completed.Acknowledgements
SE, AW, DC and RH would like to thank Unilever for funding. We would like to thank the Warwick Polymer Characterisation Research and Technology Platform (RTP) for the provided characterisation equipment funded in part by EPSRC EP/V036211/1 and EP/V007688/1 and more specifically Dr Daniel Lester and Dr James S. Town for their help and support. We would also like to thank Dr Lucas Al-Shok for conducting the MALDI experiments. We are also grateful to the University of Warwick, the EPSRC Centre of Doctoral Training in Molecular Analytical Science and the Electron Microscopy RTP.References
- J. Tavakoli and Y. Tang, Polymers, 2017, 9, 364 CrossRef PubMed.
- G. Rocchitta, A. Spanu, S. Babudieri, G. Latte, G. Madeddu, G. Galleri, S. Nuvoli, P. Bagella, M. I. Demartis, V. Fiore, R. Manetti and P. A. Serra, Sensors, 2016, 16, 780 CrossRef PubMed.
- V. Naresh and N. Lee, Sensors, 2021, 21, 1109 CrossRef CAS PubMed.
- H. Lee, Y. J. Hong, S. Baik, T. Hyeon and D.-H. Kim, Adv. Healthcare Mater., 2018, 7, 1701150 CrossRef PubMed.
- E. F. Renny, D. K. Daniel, A. I. Krastanov, C. A. Zachariah and R. Elizabeth, Biotechnol. Biotechnol. Equip., 2005, 19, 198–201 CrossRef.
- Y. Y. Al-Tamer, E. A. Hadi and I. E. I. Al-Badrani, Urol. Res., 1997, 25, 337–340 CrossRef CAS PubMed.
- T. C. Boysen, S. Yanagawa, F. Sato and K. Sato, J. Appl. Physiol. Respir. Environ. Exercise Physiol., 1984, 56, 1302–1307 CAS.
- C. T. Huang, M. L. Chen, L. L. Huang and I. F. Mao, Chin. J. Physiol., 2002, 45, 109–115 CAS.
- S. Singh, M. Sharma and G. Singh, IET Nanobiotechnol., 2021, 15, 358–379 CrossRef PubMed.
- A. L. Kim, E. V. Musin, A. V. Dubrovskii and S. A. Tikhonenko, Anal. Methods, 2019, 11, 1585–1590 RSC.
- A. Soni, R. K. Surana and S. K. Jha, Sens. Actuators, B, 2018, 269, 346–353 CrossRef CAS.
- A. Herrmann, R. Haag and U. Schedler, Adv. Healthcare Mater., 2021, 10, 2100062 CrossRef CAS PubMed.
- J. Erfkamp, M. Guenther and G. Gerlach, Sensors, 2019, 19, 2858 CrossRef CAS PubMed.
- B. Alev-Tuzuner, A. Beyler-Cigil, M. Vezir Kahraman and A. Yarat, Int. J. Polym. Mater. Polym. Biomater., 2019, 68, 597–606 CrossRef CAS.
- B. Hu, X. Kang, S. Xu, J. Zhu, L. Yang and C. Jiang, Anal. Chem., 2023, 95, 3587–3595 CrossRef CAS PubMed.
- J. C. Bragg, H. Kweon, Y. Jo, K. G. Lee and C.-C. Lin, J. Appl. Polym. Sci., 2016, 133, 9551–9561 CrossRef.
- S. Gäbler, J. Stampfl, T. Koch, S. Seidler, G. Schüller and H. Redl, Int. J. Mater. Eng. Innovation, 2009, 1, 3–20 CrossRef.
- A. K. Yetisen, N. Jiang, A. Fallahi, Y. Montelongo, G. U. Ruiz-Esparza, A. Tamayol, Y. S. Zhang, I. Mahmood, S. A. Yang, K. S. Kim, H. Butt, A. Khademhosseini and S. H. Yun, Adv. Mater., 2017, 29, 1606380 CrossRef PubMed.
- X. Yang, H. Yao, G. Zhao, G. A. Ameer, W. Sun, J. Yang and S. Mi, J. Mater. Sci., 2020, 55, 9551–9561 CrossRef CAS.
- A. G. Lee, C. P. Arena, D. J. Beebe and S. P. Palecek, Biomacromolecules, 2010, 11, 3316–3324 CrossRef CAS PubMed.
- J. Decock, M. Schlenk and J.-B. Salmon, Lab Chip, 2018, 18, 1075–1083 RSC.
- Y.-H. Wu, H. B. Park, T. Kai, B. D. Freeman and D. S. Kalika, J. Membr. Sci., 2010, 347, 197–208 CrossRef CAS.
- A. Kwok, G. Qiao and D. Solomon, Polymer, 2003, 44, 6195–6203 CrossRef CAS.
- L. Huang and K. Nishinari, J. Polym. Sci., Part B:Polym. Phys., 2001, 39, 496–506 CrossRef CAS.
- J. R. Choi, K. W. Yong, J. Y. Choi and A. C. Cowie, Biotechniques, 2019, 66, 40–53 CrossRef CAS PubMed.
- N. A. Peppas, in Hydrogels in Medicine and Pharmacy, ed. N. A. Peppas, CRC Press Taylor & Francis Group, London, 2019, vol. I, ch. 1, pp. 19–21 Search PubMed.
- S. L. Madorsicy and S. Straus, J. Polym. Sci., 1959, 36, 183–194 CrossRef.
- D. Ponnuvelu, S. Kim and J. Lee, Micro Nano Syst. Lett., 2017, 5, 21 CrossRef.
- B. Li, X. Y. Zhang, J. Z. Yang, Y. J. Zhang, W. X. Li, C. H. Fan and Q. Huang, Int. J. Nanomed., 2014, 9, 4697–4707 CrossRef PubMed.
- H. Stutz, K.-H. Illers and J. Mertes, J. Polym. Sci., Part B:Polym. Phys., 1990, 28, 1483–1498 CrossRef CAS.
- B. Bogdanov, A. Vidts, A. Van Den Buicke, R. Verbeeck and E. Schacht, Polymer, 1998, 39, 1631–1636 CrossRef CAS.
- R. Paberit, E. Rilby, J. Göhl, J. Swenson, Z. Refaa, P. Johansson and H. Jansson, ACS Appl. Energy Mater., 2020, 3, 10578–10589 CrossRef CAS.
- K. Pielichowski and K. Flejtuch, Polym. Adv. Technol., 2002, 13, 690–696 CrossRef CAS.
- P. K. Robinson, Essays Biochem., 2015, 59, 1–41 CrossRef PubMed.
- T. Pelras, S. Glass, T. Scherzer, C. Elsner, A. Schulze and B. Abel, Polymer, 2017, 9, 639 Search PubMed.
- V. A. Inozemtsev, A. L. Gamov and A. P. Moscalets, Soft Matter, 2018, 14, 2184–2193 RSC.
- S. N. R. Kutcherlapati, N. Yeole and T. Jana, J. Colloid Sci., 2016, 463, 164–172 CrossRef CAS PubMed.
- H. Bisswanger, Perspect. Sci., 2014, 1, 41–55 CrossRef.
- S. U. Haq, M. Aghajamali and H. Hassanzadeh, RSC Adv., 2021, 11, 24387–24397 RSC.
- Y. Zhang, H. Guo, S. B. Kim, Y. Wu, D. Ostojich, S. H. Park, X. Wang, Z. Weng, R. Li, A. J. Bandodkar, Y. Sekine, J. Choi, S. Xu, S. Quaggin, R. Ghaffari and J. A. Rogers, Lab Chip, 2019, 19, 1545–1555 RSC.
- S. Vallejos, A. Muñoz, S. Ibeas, F. Serna, F. C. García and J. M. García, J. Mater. Chem. A, 2013, 1, 15435–15441 RSC.
- S. Vallejos, J. A. Reglero, F. C. García and J. M. García, J. Mater. Chem. A, 2017, 5, 13710–13716 RSC.
Footnote |
| † Electronic supplementary information (ESI) available: Includes all synthetic procedures and additional characterisation data. See DOI: https://doi.org/10.1039/d4sm01500b |
| This journal is © The Royal Society of Chemistry 2025 |

