
 Open Access Article
 This Open Access Article is licensed under a
 Creative Commons Attribution 3.0 Unported Licence
Carbon emission reduction strategy planning and scheduling for transitioning process plants towards net-zero emissions†
Yuen Xiu
Lye
a,
Yick Eu
Chew
a,
Dominic C. Y.
Foo
b,
Bing Shen
How
a and
Viknesh
Andiappan
 *a
*a
aResearch Centre for Sustainable Technologies, Faculty of Engineering, Computing and Science, Swinburne University of Technology Sarawak, Jalan Simpang Tiga, Kuching, Sarawak 93350, Malaysia. E-mail: 101225820@students.swinburne.edu.my; yechew@swinburne.edu.my; BSHow@swinburne.edu.my; vmurugappan@swinburne.edu.my
bDepartment of Chemical and Environmental Engineering, Centre for Green Technologies, University of Nottingham Malaysia, Broga Road, Semenyih, 43500 Selangor, Malaysia. E-mail: Dominic.Foo@nottingham.edu.my
First published on 18th December 2024
Abstract
In recent years, the imperative to minimise carbon dioxide (CO2) emissions has become a central concern for both government and business organisations. To address this challenge, process integration tools such as pinch analysis have been widely applied for carbon management. However, existing tools do not consider CO2 emissions, operating costs, and capital costs alongside optimal scheduling for decarbonisation strategies. To address this gap, this paper aims to present a methodology for screening cost-effective decarbonisation strategies and planning these strategies to achieve net-zero emissions in chemical process plants. The effectiveness of the methodology is demonstrated through two case studies on refinery and methanol processes. In the refinery case study, the average carbon intensity was 18.81 t CO2 per k USD of operating cost, with a total CO2 emission of 3722.97 t CO2. Three main CO2 emissions reduction strategies were deployed to achieve a 32% reduction in CO2 emissions which include biomass combined heat and power, hydrogen recycling, and water electrolysis. In the methanol case study, the average carbon intensity was 0.72 t CO2 per k USD, with a total CO2 emission of 19![[thin space (1/6-em)]](https://www.rsc.org/images/entities/char_2009.gif) 678 t CO2 per day. To achieve a 49% reduction in emissions, strategies such as heat integration, compressor ratio adjustments, and recycle ratio adjustments were employed. The scheduling of these decarbonisation strategies was conducted to evaluate the respective economic feasibility of the payback period and loan required. The results indicate that implementing all strategies simultaneously results in the shortest payback period but incurs a high investment cost, leading to high financial risk. In order to lower the financial risk, the strategies are scheduled one by one by dispersing the investment costs.
678 t CO2 per day. To achieve a 49% reduction in emissions, strategies such as heat integration, compressor ratio adjustments, and recycle ratio adjustments were employed. The scheduling of these decarbonisation strategies was conducted to evaluate the respective economic feasibility of the payback period and loan required. The results indicate that implementing all strategies simultaneously results in the shortest payback period but incurs a high investment cost, leading to high financial risk. In order to lower the financial risk, the strategies are scheduled one by one by dispersing the investment costs.
Sustainability spotlightIn response to the call for emission reduction in the process industry, this paper presents a novel methodology that identifies and schedules CO2 emissions reduction strategies for process plants to transition towards net-zero emissions by combining the strengths of carbon emission pinch analysis and mathematical optimisation. The methodology is easy to adapt for non-specialists in the field and can be implemented for informed decision support. This work promotes sustainable industrial energy use and notable reductions in CO2 emissions, aligning with UN Sustainable Development Goal 7 (Affordable and Clean Energy) and Goal 13 (Climate Action). |
1 Introduction
The rise in carbon dioxide (CO2) emissions, surging from 22.76 billion tonnes in 1990 to 37.15 billion tonnes in 2022, underscores the urgent need for emissions reduction strategies.1 Emissions, categorised into direct and indirect emissions, are predominantly generated during the combustion of fossil fuels for industrial processes.2 The chemical industry has a 37% share in global fossil fuel consumption, which contributes to global CO2 emissions.3 Recognising this pressing issue, the Conference of the Parties in 2015 (COP21)4 and 2023 (COP28)5 have set ambitious targets to curb CO2 emissions and transition to low-emission energy resources.6 From the chemical industry perspective, it is timely to develop CO2 emissions reduction strategies at the process level. These strategies may entail, but are not limited to, investments in renewable energy, electrification, recycling, low-carbon fuels, waste heat recovery, and carbon capture, utilisation, and storage.7 However, limited tools have been developed for visualising, planning and scheduling CO2 emissions reduction at the process level. As such, it is imperative to develop a methodology for scheduling CO2 emissions reduction strategies in process plants to transition towards net-zero emissions.Carbon emission pinch analysis (CEPA) was developed initially by Tan and Foo8 as a tool to visualise and plan CO2 emissions reduction strategies for carbon-constrained energy planning for geographical regions. Its adaptation of traditional pinch analysis9 facilitates the evaluation of environmental impact and the identification of minimum low-carbon energy sources for achieving specific carbon emission reductions. With intuitive graphical tools, CEPA facilitates effective communication among stakeholders and decision-makers.10 Subsequent research has expanded CEPA's applications across various contexts. For instance, studies have been published to minimise carbon footprints focused on electricity planning in Ireland,11 India,12 New Zealand,13 Malaysia,14 Trinidad and Tobago,15 Canada,16 and Bangladesh.17 However, existing CEPA applications have primarily focused on macro-scale planning from a top–down perspective, overlooking process level carbon reduction planning. Knowing this, Tjan et al.18 modified the CEPA to cater to planning process retrofits or feedstock adjustments in chemical processes for CO2 emissions reduction. Qin et al.19 further extended CEPA for low-carbon chemical production planning to simultaneously meet the energy demand and carbon emissions limit. However, it was limited to single-product plants. Yap et al.20 addressed this limitation by adapting CEPA for multi-product plants, distinguishing emissions sources into shared and dedicated facilities to rank decarbonisation alternatives at the process level. However, the diverse costs and scalability of these options pose challenges, necessitating a careful evaluation of economic viability, environmental impact, and investment time. The existing methodologies have yet to fully consider the associated capital costs, operating costs, and CO2 emissions, highlighting a crucial area for further development. For instance, most studies at the process level only consider the operating cost for utility expenses. Operating costs must include aspects such as savings from efficiency measures, raw material expenses, and utility costs associated with the decarbonisation strategy. Moreover, the annualised capital cost of these decarbonisation options was not included in past studies (only one study conducted by Ramanath et al.21 has considered this aspect). Lastly, CO2 emissions resulting from these decarbonisation strategies were also omitted. This is vital because it provides a comprehensive understanding of the emissions, costs, and potential cost savings associated with these strategies. On top of that, the existing methodologies are unable to answer the question of “when the identified emission reduction technologies should be installed”. Scheduling, which concerns the timing and sequence of emission reduction strategies is crucial to ensure that the transition plan is economically feasible and can meet the set emission target.
Thus, this paper aims to fill these research gaps by developing a methodology that will consider CO2 emissions, capital, and operating costs related to CO2 emissions reduction strategies, as well as the time required for implementation. This is essential for gaining a comprehensive understanding of emissions, costs, potential cost savings, and the economic feasibility of transition plans, ensuring that emission reduction targets can be effectively achieved. The impact of deployment time has yet to be considered in previous studies and hence, serves as the key novelty of this research work.
2 Methodology
The methodology combines graphical methods and mathematical programming to optimise carbon emissions reductions. While mathematical programming offers precision by incorporating multiple variables and constraints, its complexity and the need for specialised programming skills can limit accessibility, especially for larger-scale problems. To address this, this work emphasises graphical tools that simplify the framework, making it accessible to decision-makers without technical expertise, while still leveraging mathematical programming to enhance precision. This balance ensures a practical and effective approach to decarbonisation planning. Fig. 1 shows the mentioned methodology. The following sub-sections describe step 1 to step 5 in the methodology in more detail.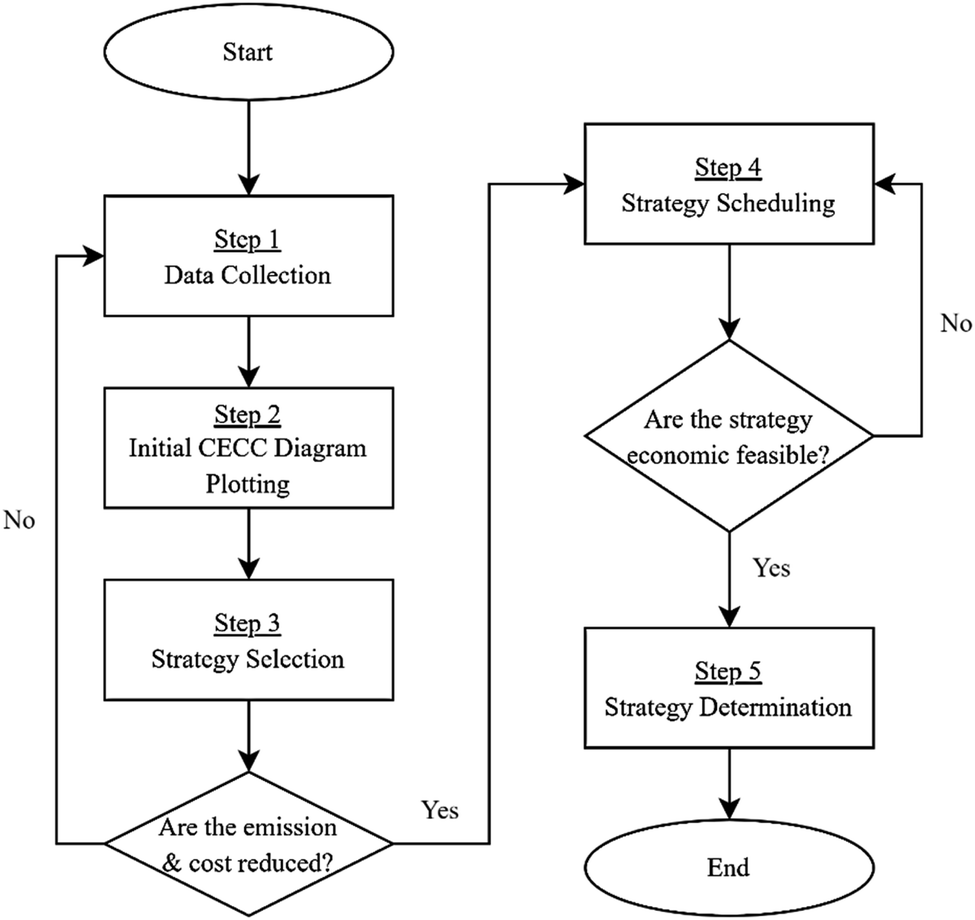 | ||
| Fig. 1 Flowchart of methodology. | ||
2.1 Step 1 – data collection
The methodology starts with data collection. The collected data consists of information on existing and emerging reduction technologies identified through the desktop study. The information included cost, energy consumption, and carbon reduction capabilities. Furthermore, the rate of CO2 emissions, mass and energy flow in the chemical process plant, and the cost of utilities used in the chemical process were also collected. The data were collected from reliable sources such as journals, published books, and industrial reports. Furthermore, a case study was identified from these sources, which involves refinery processes that have been studied in this project.2.2 Step 2 – initial CECC diagram plotting
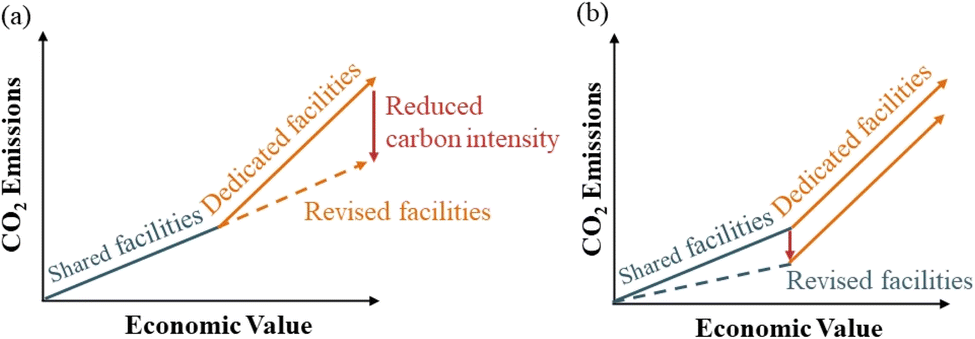
After the data are collected, a specific carbon emission composite curve (CECC) diagram can be plotted following the methodology proposed by Yap et al.20Fig. 2 shows that the CO2 emissions are plotted against economic values in two separate line segments, forming the CECC. The economic value refers to the utility and operating costs, including expenses associated with electricity, steam, and other fuel utilisation. The two separated line segments reflect shared and dedicated facilities, providing a comprehensive overview of the relationship between CO2 emissions and economic value.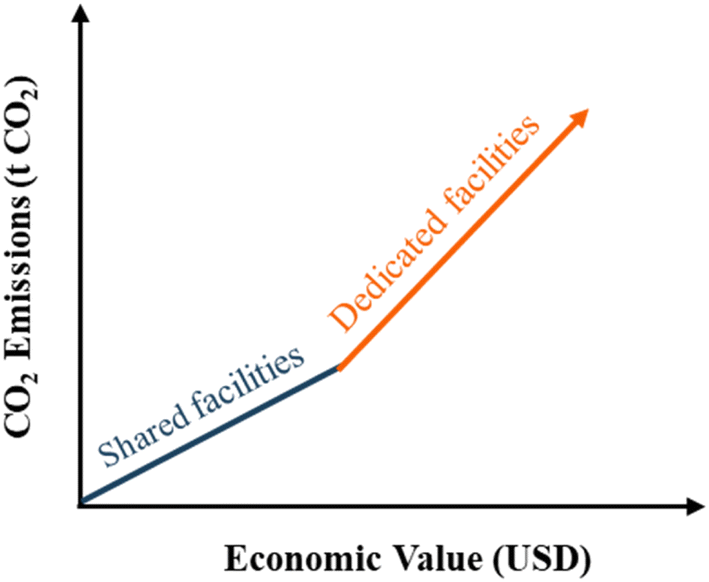 | ||
| Fig. 2 Illustrative example of the initial CECC diagram (Yap et al.20). | ||
The carbon intensity of the corresponding facility is defined as the ratio of CO2 emissions to economic value (slope of the line segment). As a result, the facilities with the highest carbon intensity represent the main contributors of CO2 emissions in the process. Therefore, in order to mitigate the emissions effectively, the CO2 emissions reduction strategies were applied to these facilities with steeper slopes.
2.3 Step 3 – strategy selection
The potential CO2 emissions reduction capacity and the cost savings from purchasing fresh utilities were initially calculated. Furthermore, the CO2 emissions, capital expenditure (CAPEX), and operational expenditure (OPEX) associated with these strategies have also been evaluated. CAPEX includes buying new equipment and rerouting pipe lines, while OPEX includes utility costs for deploying CO2 emissions reduction strategies. Subsequently, all the proposed CO2 emissions reduction strategies are evaluated and selected via an optimisation model to select strategies that meet the CO2 emissions reduction target while minimising both CAPEX and OPEX. The objective is set to minimise total annualised cost (TAC) (see eqn (1)) while meeting all constraints. These constraints (as shown in eqn (2)–(4)) are set to ensure that the achieved total CO2 emissions reduction meets the target values. The binary variable bi is used to represent the selection of a CO2 emissions reduction strategy (“1” indicates it is selected and “0” otherwise), where i represents the corresponding CO2 emissions reduction strategy. Furthermore, the fractional factor fi represents the operational capacity of each CO2 emissions reduction strategy (“1” indicates it operates at full capacity and “0” means not choosing the strategy). The binary variable is introduced to CAPEX as the cost consists of fixed cost, while the fractional factor is introduced to OPEX, which consists of proportional cost. Besides, binary variables and fractional factors are introduced to minimise the total annualised cost (TAC) (see eqn (1)). This allows the solver to minimise TAC by altering the binary variable and fractional factor. The binary variable is constrained using the fractional factor (see eqn (2)), where its value will be “1” when fi is larger than “0”; otherwise, its value will be forced to “0” in order to minimise the TAC in accordance with (eqn (2)).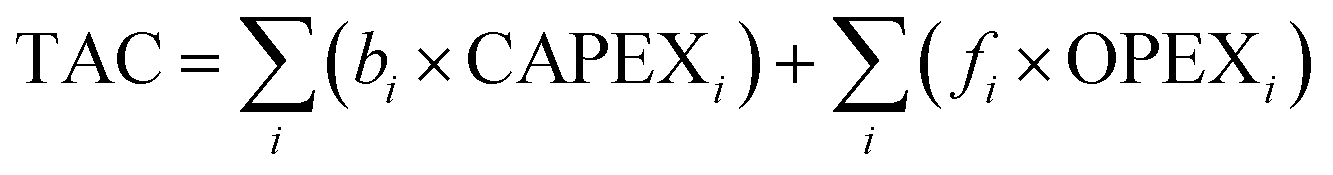 | (1) |
| 0 ≤ fi ≤ bi, ∀i | (2) |
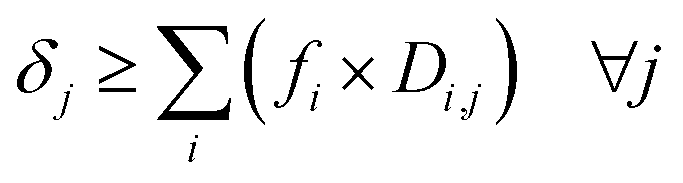
Additionally, the fi is also introduced to the CO2 emissions reduction capacity Ci and the utility demand Di,j. Ci refers to the ability of a CO2 emissions reduction strategy to reduce emissions, measured in terms of the amount of CO2 reduced. Di,j corresponds to the utility (i.e., electric, medium-pressure (MP) steam, high-pressure (HP) steam, and hydrogen), where j represents the corresponding demand utility.
 | (3) |
 | (4) |
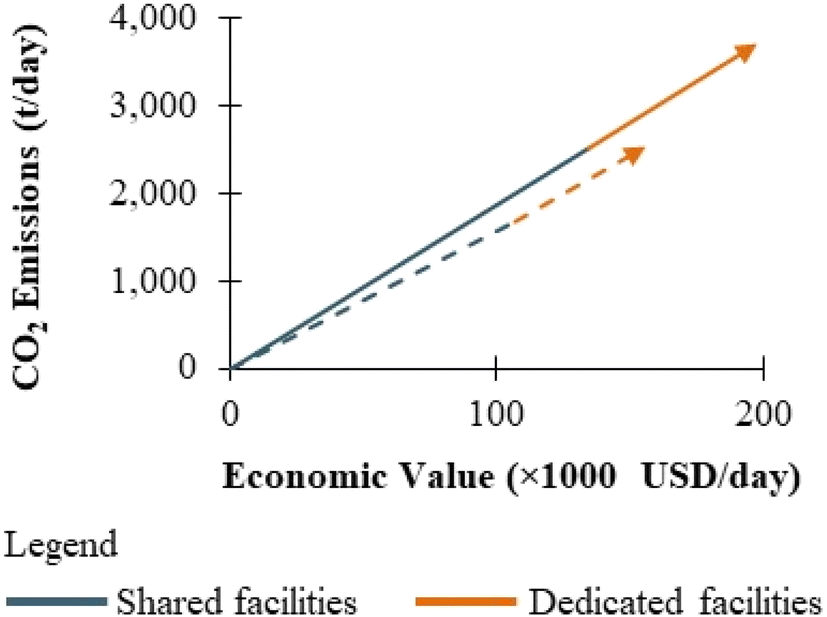
These constraints (eqn (3) and (4)) ensure that the total CO2 emissions reduction equals the reduction target t, while the capability to produce utility is limited by the utility demand δj. The utility levels are constrained to be less than or equal to the demand since CO2 emissions are calculated based on the utility demand. Finally, the strategies selected in the previous section play a pivotal role in shaping the final CECC diagram shown in Fig. 3. Fig. 3(a) shows the final CECC diagram, focusing on reducing carbon intensity in dedicated facilities, while Fig. 3(b) focuses on shared facilities.
 | ||
| Fig. 3 Illustrative example of the final CECC diagram: (a) reduced on dedicated facilities and (b) reduced on shared facilities. | ||
This diagram illustrates the reduction of CO2 emissions and operating costs, thus encapsulating the outcomes achieved. Following the plotting of the final CECC diagram, the dominant slope mentioned in Section 2.2 should be lowered. If the result is insufficient to meet the CO2 emissions reduction target, one should consider additional decarbonisation efforts for the second steepest slope. Then, the results were validated to ensure the data on emissions, energy usage, utilisation cost, and other relevant variables were accurate and up-to-date. Concurrently, the validation process scrutinised whether the outcomes led to reductions or escalations in emissions and savings or increases in costs. If the results are reasonable while the set emissions targets are met, the findings will be documented. Otherwise, if the results are found to be invalid, the data collection and analysis phase should be revisited. The CO2 emissions reduction strategy should be adjusted and refined as necessary. Next, the CECC diagram should be replotted to reflect the updated data and strategies, ensuring that it accurately represents the current state of emissions and potential improvements.
2.4 Step 4 – strategy scheduling
In this stage, graphical methods are used to show the scheduling of the decarbonisation strategy. The validated and selected decarbonisation strategies have been scheduled to determine the optimal project timeline and the initial investment cost, considering that an enterprise may lack the financial resources to implement all decarbonisation strategies simultaneously. As shown in Fig. 4, the project cost is plotted against the project timeline. A negative project cost signifies the investment costs associated with decarbonisation strategies, while a positive project cost corresponds to revenue. The revenue is obtained from savings on fresh resources attributed to emission reductions. Besides, the payback period (PBP) signifies the time required to receive actual profit after all amendments are deployed.22 The payback period for each strategy is calculated based on eqn (5).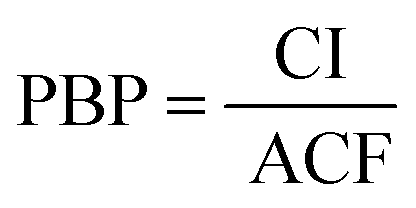 | (5) |
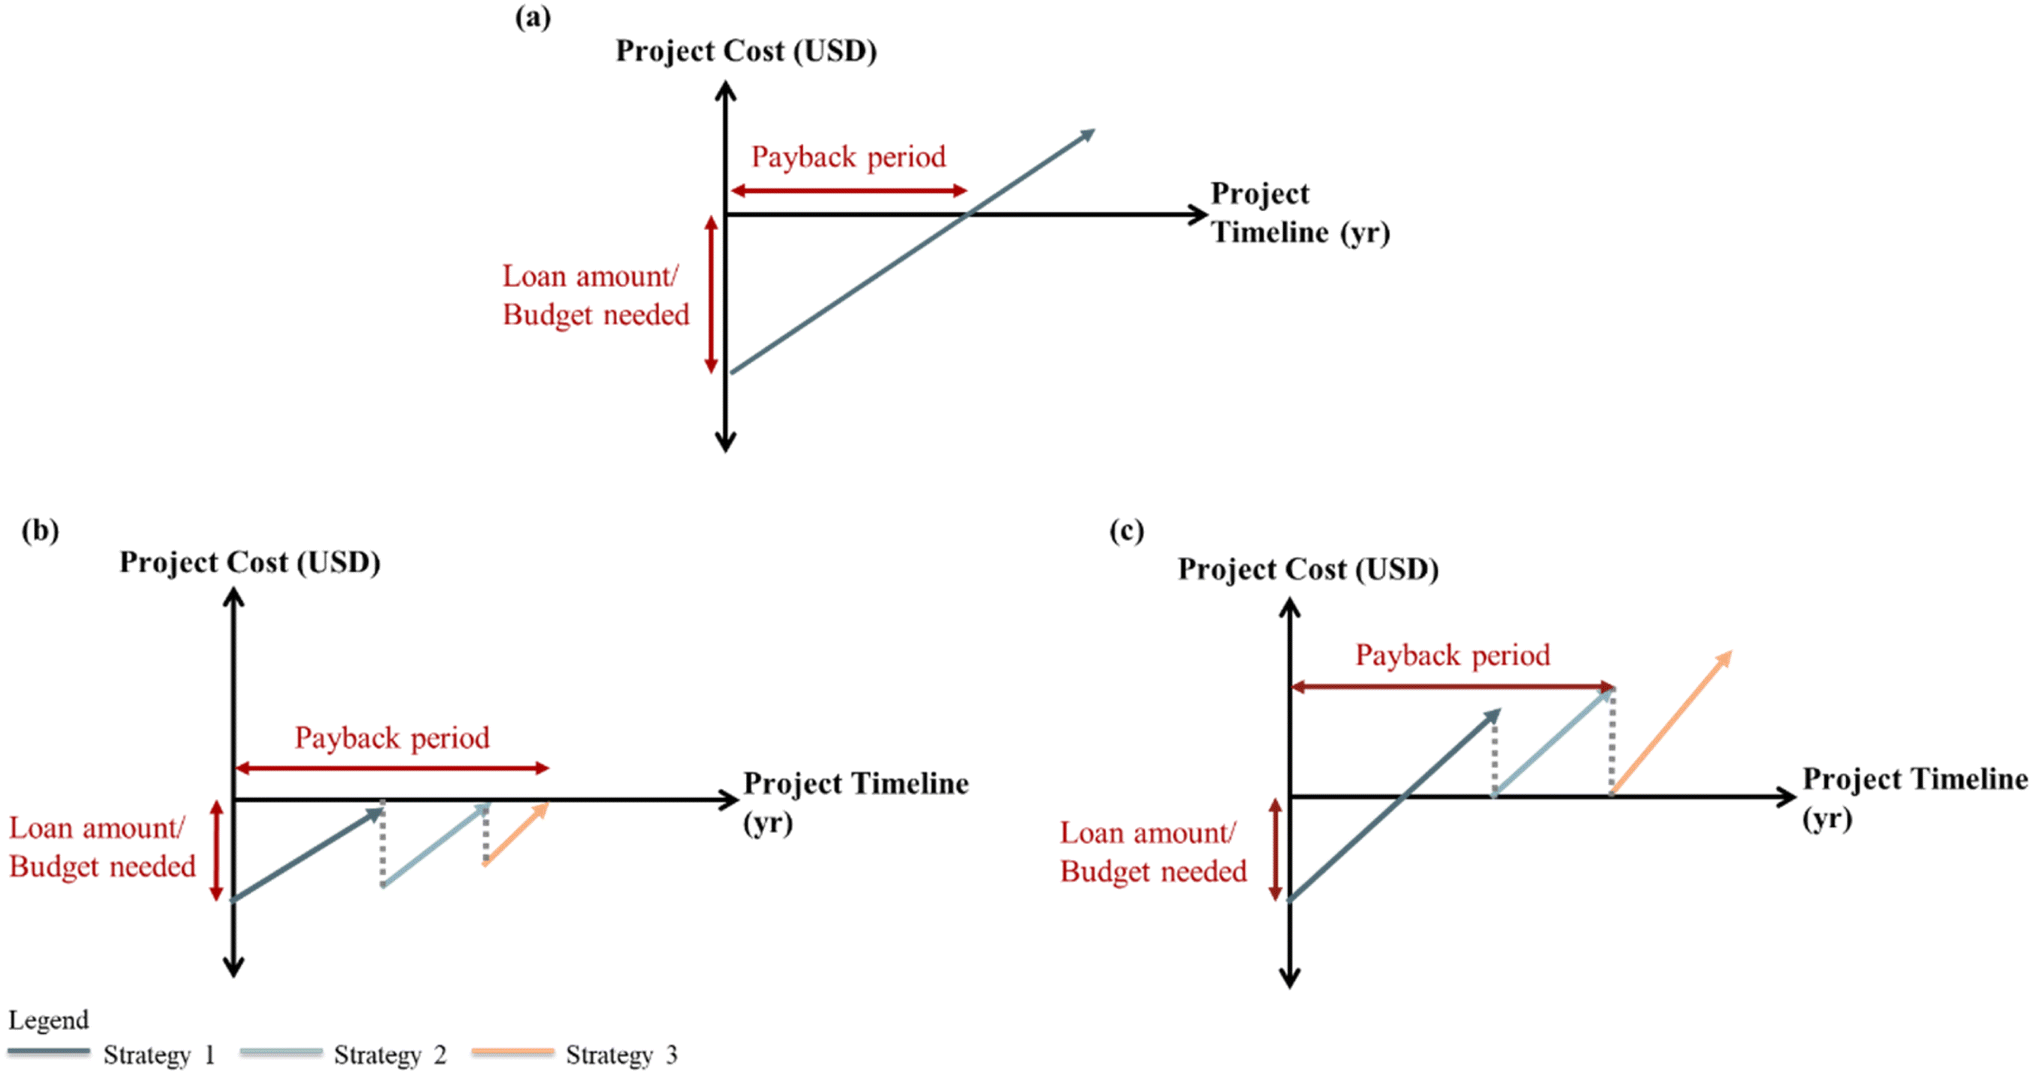 | ||
| Fig. 4 Decarbonisation strategy scheduling (a) option 1 – all together, (b) option 2 – step-by-step, and (c) option 3 – generating revenue. | ||
The investment costs (CI) are calculated by assessing the capital cost associated with implementing the CO2 emissions reduction strategies. For example, it may include buying the equipment or rerouting the pipeline. Meanwhile, the annual cash flows (ACFs) are calculated by determining the operating costs associated with the utilisation expenses. This may consist of cost reduction due to a reduction in the need for fresh feed and grid electricity. As mentioned earlier, decarbonisation strategies have cost and revenue implications. These strategies can also be deployed in multiple ways based on the timeline to show the initial investment cost and the total payback period of the reduction planning. The following are three deployment strategies to implement the decarbonisation strategies, accounting for their implementation time.
• Option 1: Implement all decarbonisation strategies together at one time, as shown in Fig. 4(a). The line starts from a negative project cost due to the capital and initial operating costs associated with the CO2 emissions reduction strategies. The line then touches the x-axis at the payback period and continues upward, generating revenue.
• Option 2: Implement the decarbonisation strategies one by one after they reach the break-even point (intercept on the x-axis) shown in Fig. 4(b). Each slope on the graph represents a distinct decarbonisation strategy, with three strategies exemplified here. Similar to the 1st option, the line starts with a negative project cost and reaches the first breakeven point. Then, the second strategy is applied along the ongoing project timeline at the negative project cost (capital cost of the second strategy). This step is repeated until all targeted reduction strategies are implemented.
• Option 3: Implement the decarbonisation strategies one by one after accumulating sufficient revenue to cover the investment cost of the subsequent strategy, as shown in Fig. 4(c). Unlike option 2, upon reaching the first breakeven point, this option continues with the same set-up for a longer duration in order to collect sufficient revenue to cover the budget needed for the next strategy. Subsequently, the second strategy is applied along the ongoing project timeline, starting with a zero-project cost. The same mechanism will then be applied for scheduling of the remaining emissions reduction strategies.
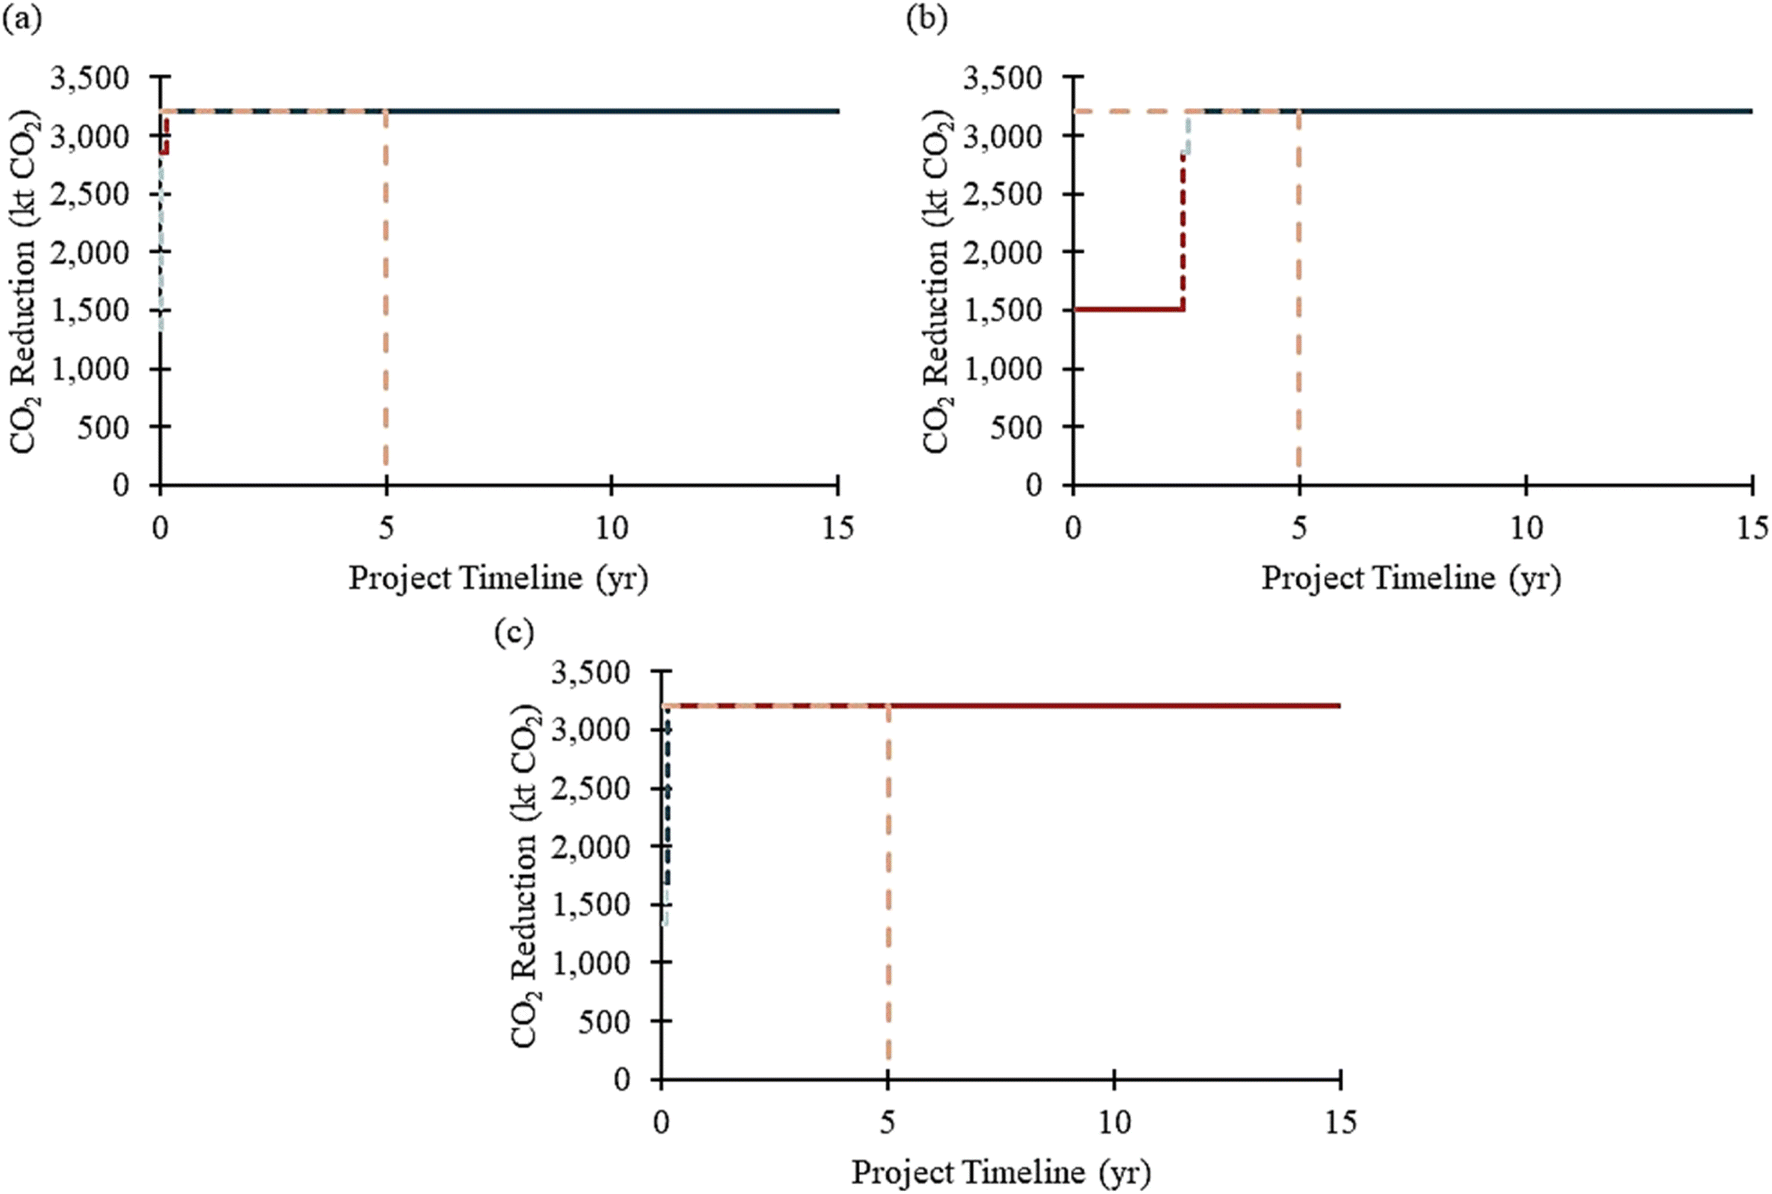
In fact, the specific sequence in each applied strategy would significantly impact the economic feasibility. Note that the negative project cost shown in Fig. 4 indicates a potential need for bank loans, which can lead to economic losses due to interest payments. Therefore, the strategy's sequence must consider loan requirements and the actual payback period. In order to visualise the capability of each strategy scheduling option in meeting the emission reduction targets, the resultant emission reduction graph is plotted as shown in Fig. 5.
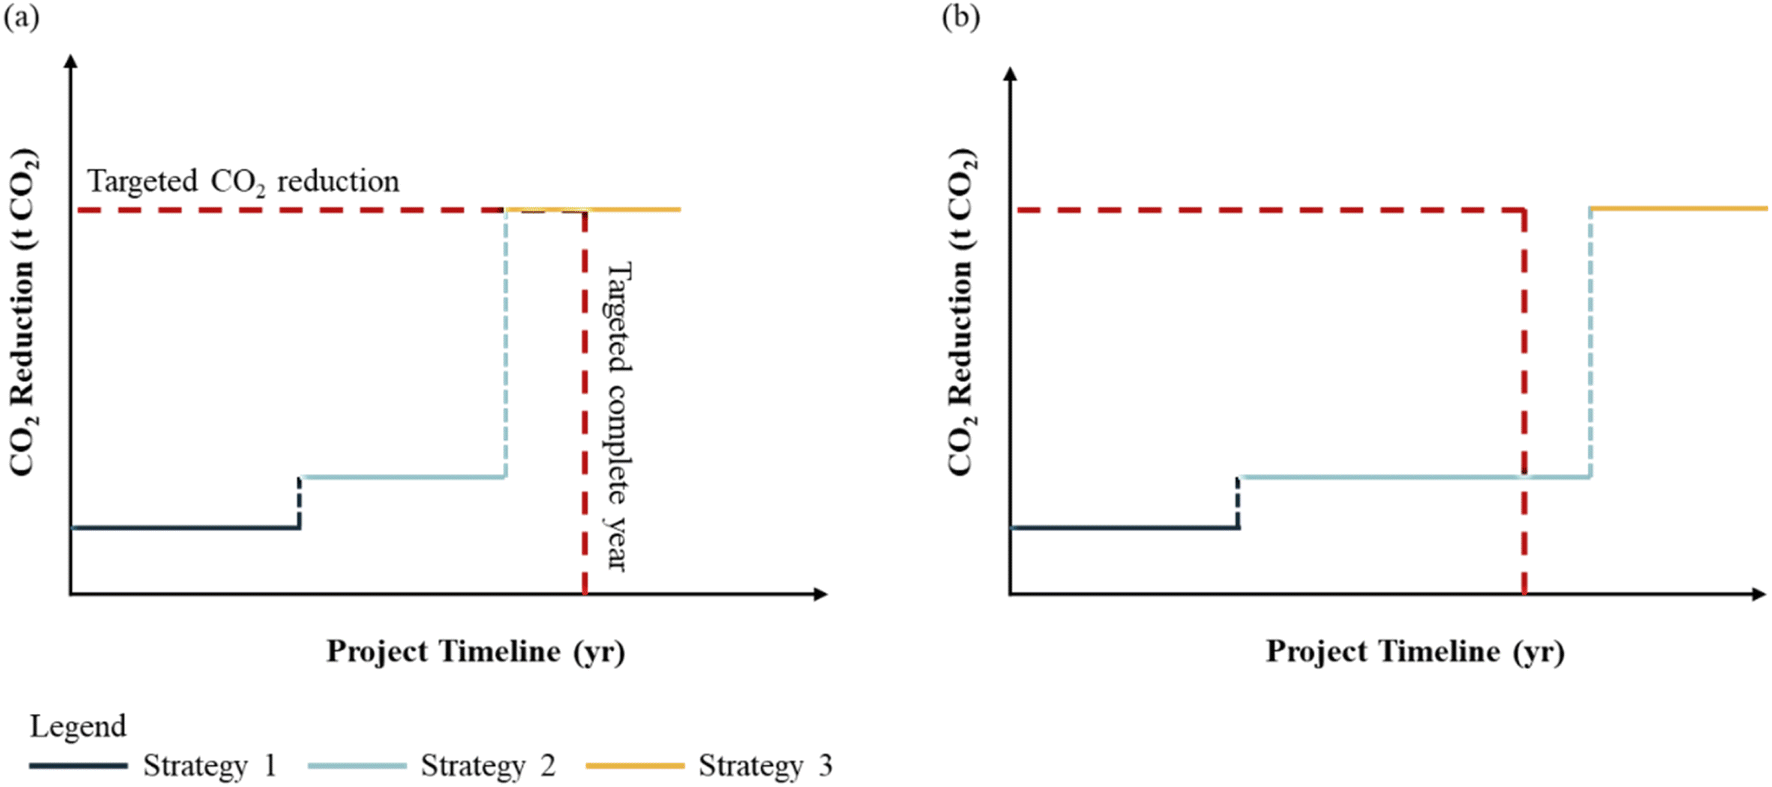 | ||
| Fig. 5 Illustrative emission reduction performance of strategy scheduling, where the emission reduction target is (a) satisfied, and (b) not satisfied. | ||
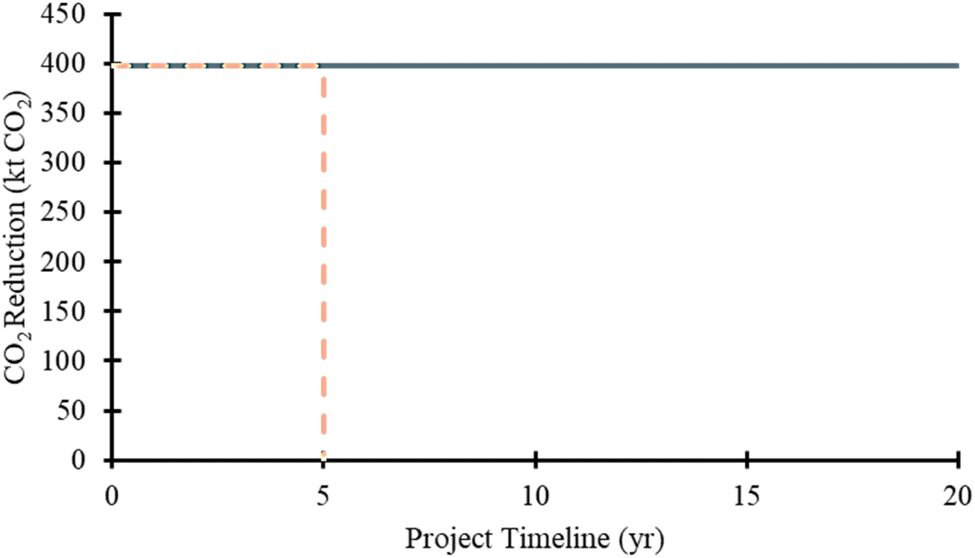
CO2 emissions reduction is plotted against the project timeline, with the red line representing the emission reduction target and the expected completion year for decarbonisation efforts. The step line represents the deployment of each CO2 emissions reduction strategy over the implementation years. When the step line is above the red line, it implies that the strategy scheduling has met the criteria for completing the project within the targeted timeline and achieving the reduction target, as shown in Fig. 5(a). Conversely, if the step line is below the red line, the corresponding strategy scheduling does not meet the reduction target in the expected completion year, as shown in Fig. 5(b).
2.5 Step 5 – strategy determination
After the scheduling plots are finished, the results are compared, and the outcomes are discussed. The primary objective of this comparison is to determine the optimal scheduling that meets the emission target, considering the minimal payback period and financial risk. In this analysis, the results are evaluated to determine the combination of strategies that offer the shortest payback period, and the minimal loan needed (the negative cash flow in the scheduling plots is deemed as an indicator for potential loans or investments required) to ensure that the deployment of CO2 emissions reduction strategies is economically viable. Moreover, their capabilities of meeting the emission reduction target are evaluated, where the options that are incapable of meeting the target should then be omitted. The strategy determination can be categorised into two types to account for different decision-making factors: (1) shortest payback period and (2) lowest maximal investment at a time. Optimal scheduling is determined based on specific conditions. For instance, option 1 (see Fig. 4) would be the best strategy scheduling if there is no budget constraint; conversely, if there is a budget constraint, options 2 and 3 would be suitable strategy scheduling. Besides, the capability of meeting emission goals should serve as a constraint that narrows down the available scheduling alternatives, especially if there is a target year for project completion. Finally, the chosen strategy scheduling is applied and developed in the process plant to reduce CO2 emissions effectively.The effectiveness of the aforementioned methodology is demonstrated through two case studies, i.e., the refinery case (Section 3) and the methanol production case (Section 4).
3 Case study 1: decarbonising a refinery process
In 2022, global refineries emitted 970 million metric tonnes of CO2, solidifying their position as the third largest emitter.23 This surge in emissions can be attributed to the escalating demand for petroleum products, prompting refineries to enhance their processes to meet this demand. Such emissions pose a significant environmental threat, exacerbating climate issues and presenting a formidable obstacle to achieving net-zero emissions. Thus, urgent action is imperative, necessitating robust CO2 emissions reduction strategies within the refining sector. These refineries, which comprise more than 70% of all US and European refineries, release almost four times as much CO2 per barrel of oil as the more straightforward conversion refineries.24 EPA25 reported that the primary emission sources in the refineries are stationary fuel combustion, representing over two-thirds of emissions. The refinery processes heavy crude oil (Lloyd Blend, LLB) into lighter final products: gasoline, jet fuel, ultra-low sulfur diesel (ULSD), heavy fuel oil, and coke.26 Fig. S1 in the ESI† shows the process mass flow depicting the transformation of crude oil into various commercial-grade fuels and the production of refinery fuel gas (RFG). The emissions data are summarised in Table S1,† and the process units are categorised into shared and dedicated facilities and summarised in Table S2 in the ESI.† These categories are utilised to construct the CECC diagram, facilitating the analysis of total CO2 emissions about the economic value, which refers to the utility costs (Table S1†). The mass flow for each process unit is quantified in kg per day. Besides, the process energy flow and the corresponding CO2 emissions from utility requirements are detailed in Tables S3 and S4,† respectively. Table S3† outlines the utility demands for power, natural gas, medium-pressure steam, high-pressure steam, and hydrogen across each process unit obtained from Abella et al.27 Additionally, it includes the energy outputs for hydrogen production. The carbon factor is then applied to the utility demand to calculate the CO2 emissions for each process unit, as summarised in Table S4.† Notably, a negative value in Table S3† indicates that utility production occurs within the processing unit itself and is subsequently utilised within the process. This results in negative emission values, as shown in Table S4.† The carbon factor refers to the CO2 emissions per unit of steam, hydrogen, natural gas, and electricity sourced from the petroleum refinery life cycle inventory model (PRELIM) v1.4 by Abella et al.27Sections 3.1–3.4 present the results, discussion, and analysis of applying the step-by-step procedure outlined in Section 2 to the refinery process case study.
3.1 Initial CECC diagram
At first, the initial CECC diagram is plotted as shown in Fig. 6. This is done by plotting the CO2 emissions data from the refinery process, as shown in Table 4, against the economic value represented by utility costs. The utility costs on the x-axis include power, natural gas, steam, and hydrogen, totaling 197.93k USD per day. The y-axis depicts the CO2 emissions from the refinery process, totaling 3722.97 t CO2 per day, resulting in a carbon intensity of 18.81 t CO2 per k USD (=3722.97 t CO2 per day ÷ 197.93k USD per day). As mentioned earlier, the steepest slope with more carbon intensity will be targeted first for decarbonisation. However, Fig. 6 shows that the slope of shared (i.e., blue line) and dedicated (i.e., orange line) facilities are similar in this case study, indicating that both require equal focus. Therefore, the decarbonisation efforts are focused on both shared and dedicated facilities to achieve the reduction target rather than focusing solely on the facilities with the steepest slope.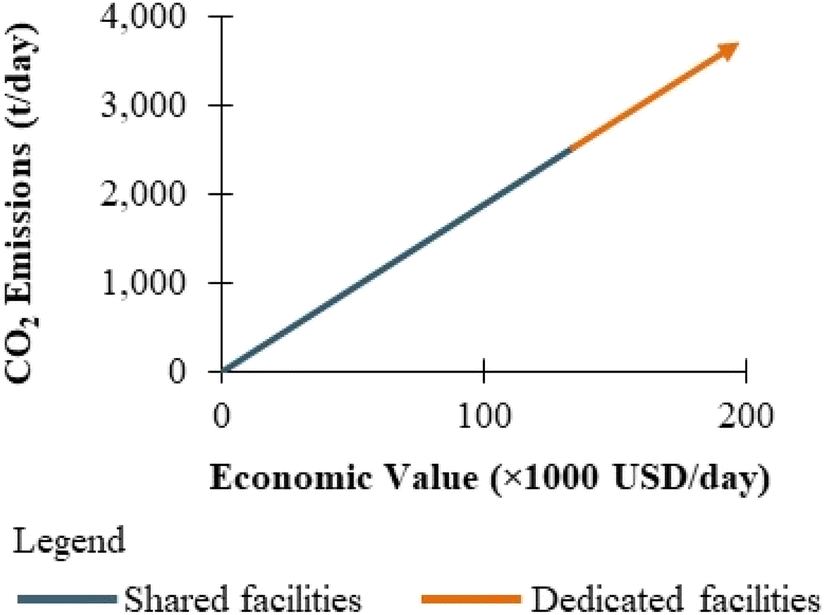 | ||
| Fig. 6 Refinery process initial CECC diagram. | ||
3.2 Strategy selection
Five CO2 emissions reduction strategies have been proposed for consideration in the refinery process case study. The following outlines the details of these CO2 emissions reduction strategies.• Natural gas combined heat and power (NG-CHP): CHP systems, also known as cogeneration systems, use a single energy source to produce heat and power. In the NG-CHP system, NG is burned as fuel to drive turbines or reciprocating engines, powering electricity generators. The heat generated by the engine or turbine is captured for heat recovery through devices.28
• Biomass-CHP: Similar to NG-CHP, this system converts heat into thermal energy that may be used to produce steam. Utilising waste heat for heating can reduce CO2 emissions by decreasing the need for additional utility inputs.28
• H2 recycling: H2 recycling involves reusing H2 produced during the process as a raw material for the hydrogen-consuming units. For example, the catalytic naphtha reformer in the refinery process produces H2, as shown in Table 4; this H2 can be recycled back into the gas oil hydrocracker process unit. This recycling reduces emissions by minimising the need to generate fresh H2 from coal gasification.
• Water electrolysis: Water electrolysis contributes to CO2 emissions reduction by producing carbon-free H2 using renewable energy sources, such as solar power. This process splits water into H2 and O2 using electricity, thereby reducing CO2 emissions compared to generating H2 by heating natural gas. Water electrolysis leverages renewable energy sources, reducing reliance on coal gasification.29
• Waste heat recovery: Heat integration involves reusing heat energy that would otherwise be wasted or released into the atmosphere. Recovering this waste heat lowers energy costs and CO2 emissions while enhancing energy efficiency.30
The calculations for CO2 emissions reduction capacity, associated costs, and emissions are detailed in the ESI,† with the data summarised in Table 1.
| Strategy | CO2 emissions reduction t CO2 per year | Saving cost Mil USD per year | Capital cost Mil USD |
|---|---|---|---|
| NG-CHP (S1) | 47444.70 |
18.85 | 45.51 |
| Biomass-CHP (S2) | 83259.52 |
2.95 | 15.49 |
| H2 recycling (S3) | 84648.96 |
1.33 | 1.13 |
| Water electrolysis (S4) | 306678.80 |
12.18 | 40.72 |
| Waste heat recovery (S5) | 2047.42 | 0.12 | 0.19 |
The data, equations, constraints, and objectives are input into Excel Solver. Based on the five proposed reduction strategies, a 32% reduction target is set as their maximum reduction capability has been reached. In case if a higher reduction target is needed, one can consider adding more emissions reduction strategies. The results indicate that the most cost-effective CO2 emissions reduction strategies were selected to achieve the 32% reduction target with minimal TAC. Table 2 presents the outcomes of this analysis, wherein it is observed that S2, S3, and S4 have been selected, with fractional factors fi of 1 for S2, 0.70 for S3, and 0.83 for S4. Besides, the results were found to have a minimum TAC of −1.99 Mil USD (=12.04 + (−14.03) Mil USD), which meets the 32% reduction target (397911.2 t CO2 per year). The negative value of OPEX signifies generated revenue or cost savings as the utility cost of the CO2 emissions reduction strategy is lower than that of procuring fresh utility demand, thereby implying cost savings. Moreover, the selected strategies supplied 3.77 MW of power, 844.46 tons of MP steam, 48.95 tons of HP steam, and 126.61 tons of H2. In summary, three CO2 emissions reduction strategies were ultimately selected as the most economically viable: biomass-CHP, H2 recycling, and water electrolysis. The results indicate a full capacity allocation for biomass-CHP, 69.7% capacity for H2 recycling, and 83.4% capacity for water electrolysis.
| Strategy | b i | Annualised CAPEXa Mil USD | f i | OPEX Mil USD | CO2 emission reduction t CO2 per year | D i,j | |||
|---|---|---|---|---|---|---|---|---|---|
| Power MW | MP t | HP t | H2 t | ||||||
a Calculated by multiplying the CAPEX with annual capital charge ratio (ACCR). Note:  , where i refers to interest rate (taken as 20%) and n denotes lifespan (taken as 20 years). , where i refers to interest rate (taken as 20%) and n denotes lifespan (taken as 20 years).
|
|||||||||
| S1 | 0 | 0.00 | 0 | 0.00 | 0.00 | — | — | — | — |
| S2 | 1 | 3.25 | 1 | −2.95 | 83259.50 |
3.77 | 844.46 | 48.95 | — |
| S3 | 1 | 0.24 | 0.70 | −0.93 | 59019.26 |
— | — | — | 21.07 |
| S4 | 1 | 8.55 | 0.83 | −10.15 | 255632.40 |
— | — | — | 105.54 |
| S5 | 0 | 0.00 | 0 | 0.00 | 0.00 | — | — | — | — |
| Result | 12.04 | — | −14.03 | 397911.20 |
3.77 | 844.46 | 48.95 | 126.61 | |
These results were then applied to the refinery case study to visualise the decarbonisation efforts by plotting the final CECC diagram shown in Fig. 7.
 | ||
| Fig. 7 Final CECC diagram for the refinery process. | ||
Fig. 7 shows that the initial slope and length have decreased, reducing CO2 emissions from 3722.97 t per day to 2531.63 t per day and decreasing the economic value from 197.93k USD per day to 156.00k USD per day. Shared facilities contributed 23% CO2 emissions reduction to the total emissions, while dedicated facilities contributed 9%, achieving a total CO2 emissions reduction of 32% in the refinery process. These reductions have saved 27k USD per day and 15k USD per day from shared and dedicated facilities. Thus, this result is feasible as the reduction target has been met and the economic cost has been decreased, resulting in a decrease in carbon intensity from 18.81 to 16.23 t CO2 per k USD.
3.3 Strategy scheduling
This section presents and discusses the strategy scheduling for the case study. This step evaluated the effect of multiple scheduling approaches for the three selected CO2 emissions reduction strategies (i.e., S2, S3, and S4) on the required investment costs and payback period. As mentioned in Section 3, option 1 involves implementing all selected CO2 emissions reduction strategies together at one time. This is shown in Fig. 8.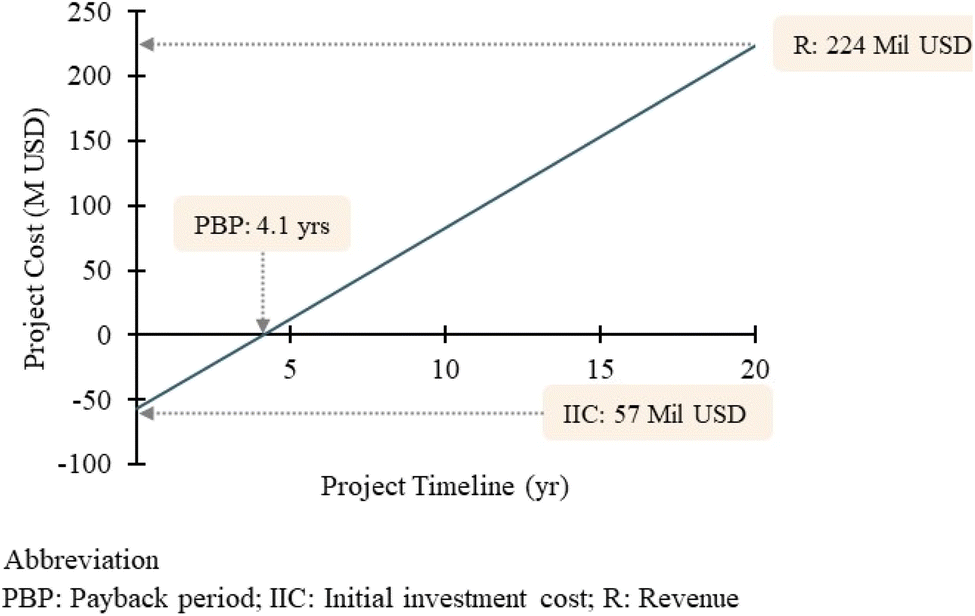 | ||
| Fig. 8 Strategy scheduling for option 1 – refinery process. | ||
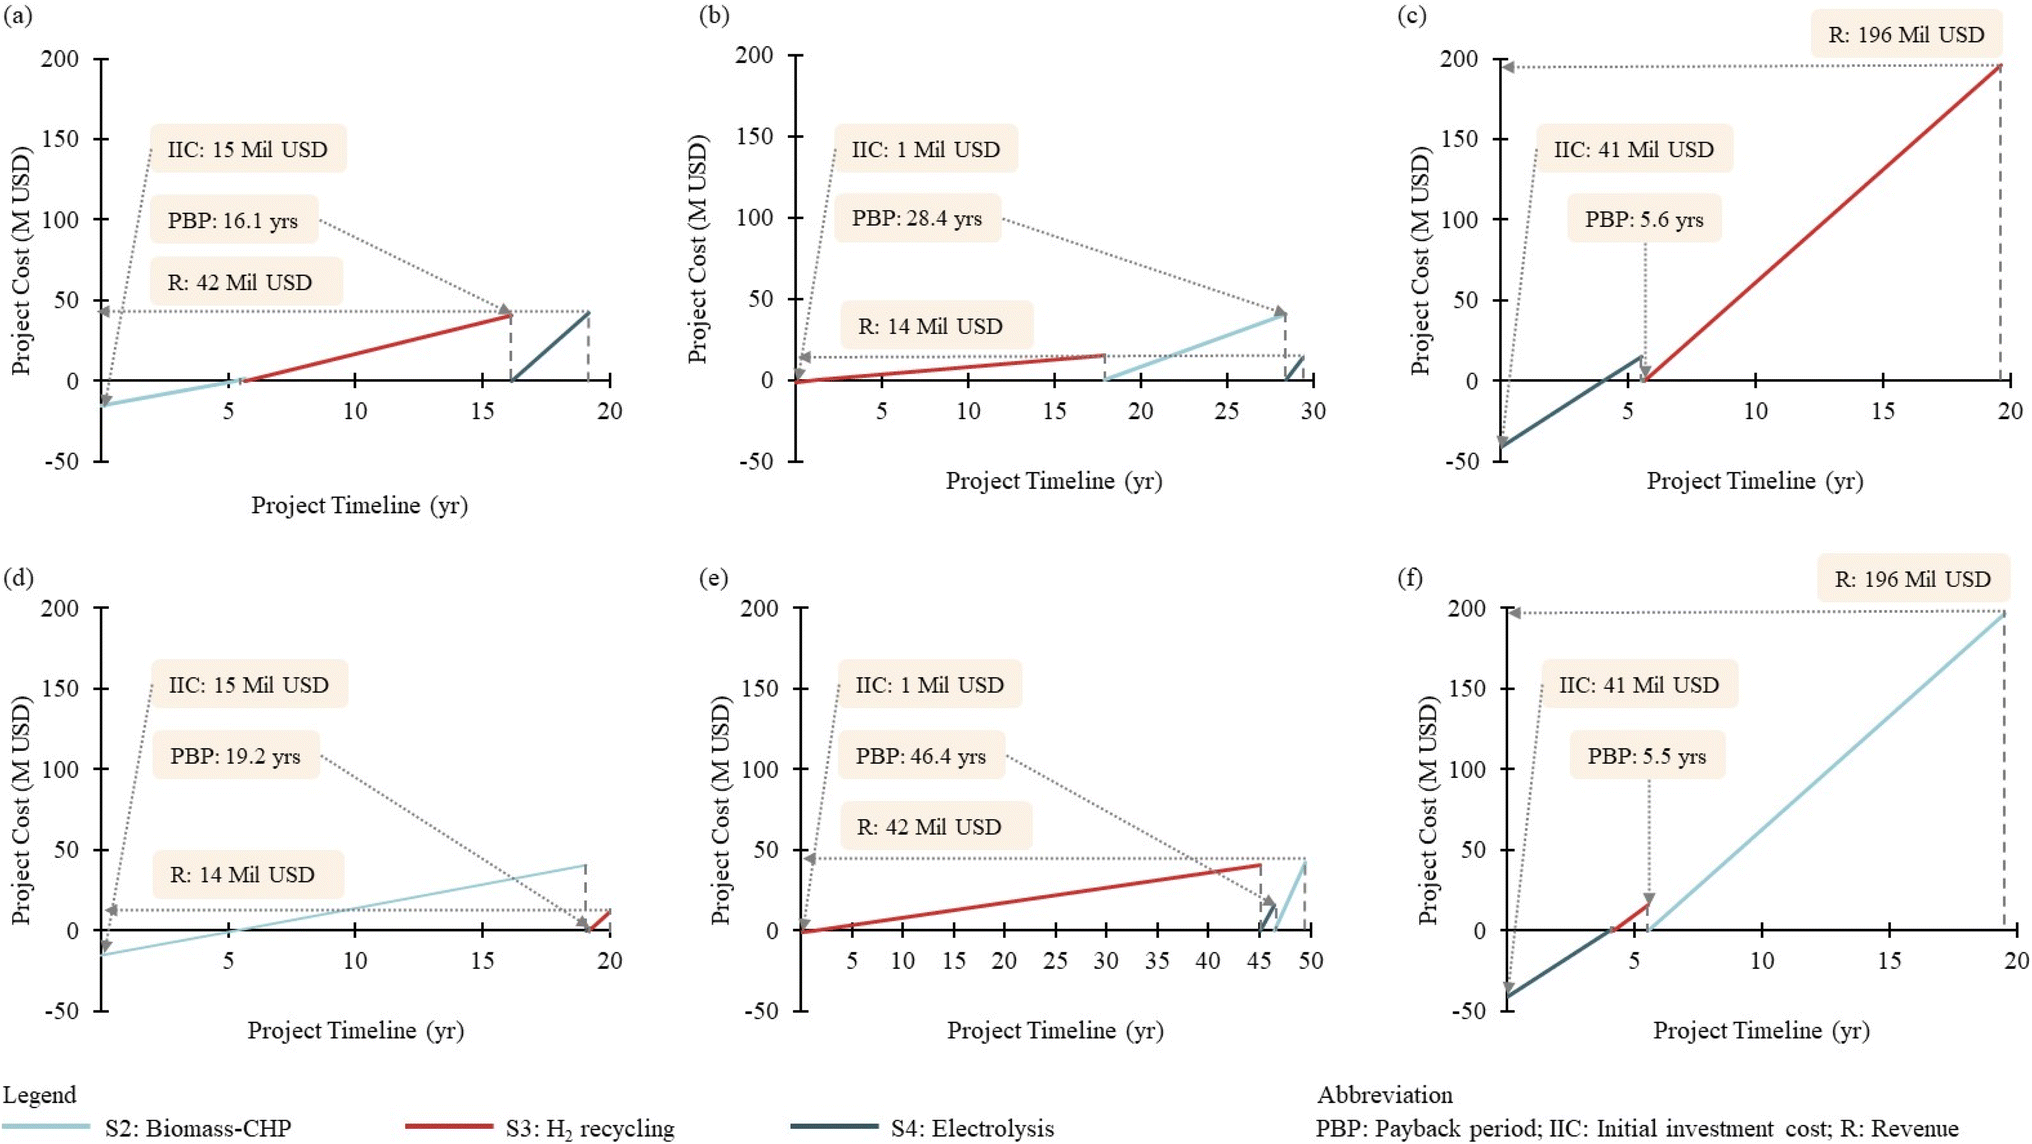
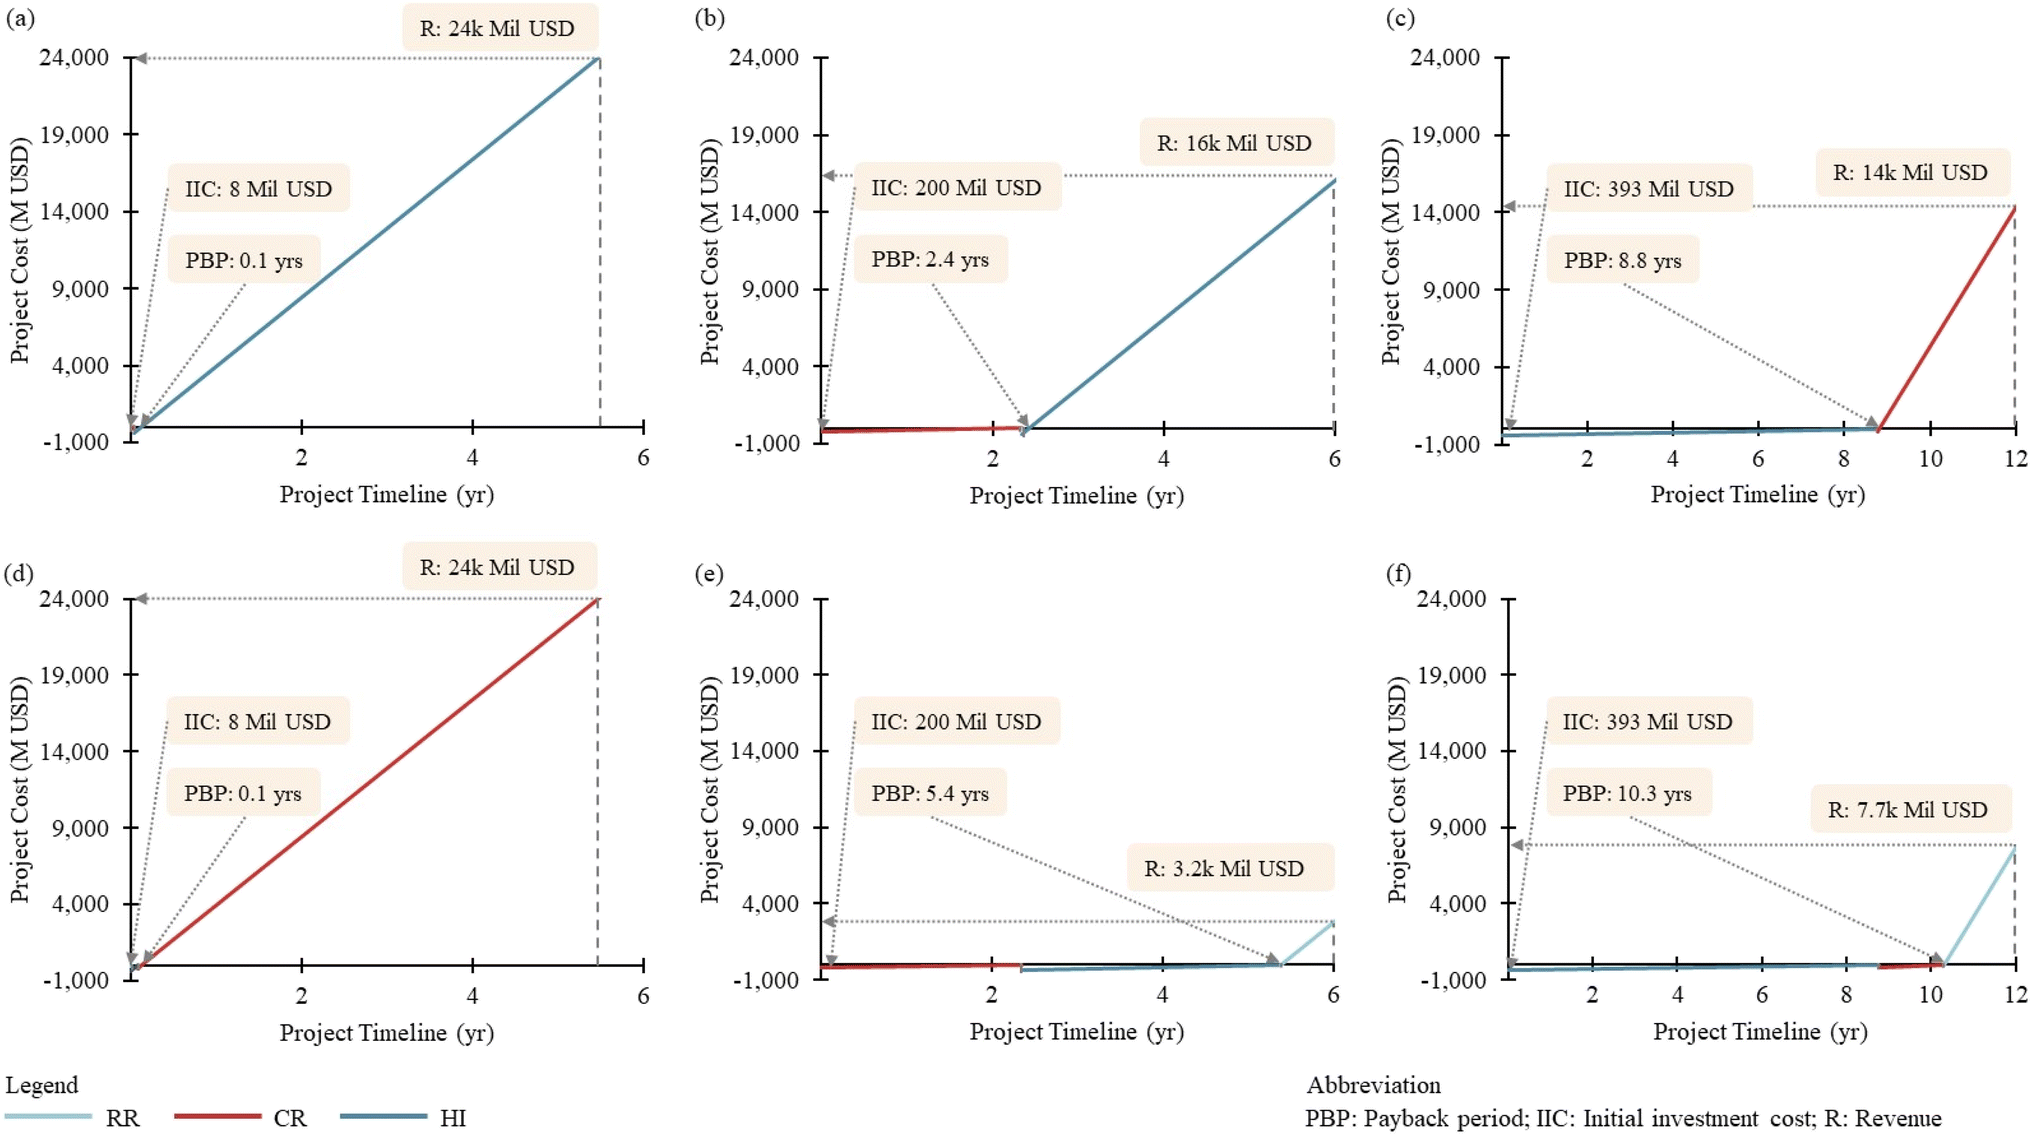
As shown in Fig. 9, the line commences at the negative side of the y-axis, denoting the initial investment cost (IIC) of 57 Mil USD to implement all the strategies, which also represents the maximum potential loans required. As time progresses (i.e., along the x-axis), the line ascends, indicating a growth in savings generated from reduced purchases of fresh utilities, reaching around 224 Mil USD by year 20. Ultimately, the graph underscores the efficacy of implementing all strategies simultaneously, highlighting a payback period (PBP) of 4.1 years. However, requiring an enormous loan (i.e., 57 Mil USD) may expose decision-makers to a higher business risk. Thus, other strategy scheduling options are considered. For instance, financial risk can be lowered by progressively implementing each strategy (see Fig. 9). The investment cost is spread across the project lifespan, therefore minimising the maximum potential loan needed for a given time.
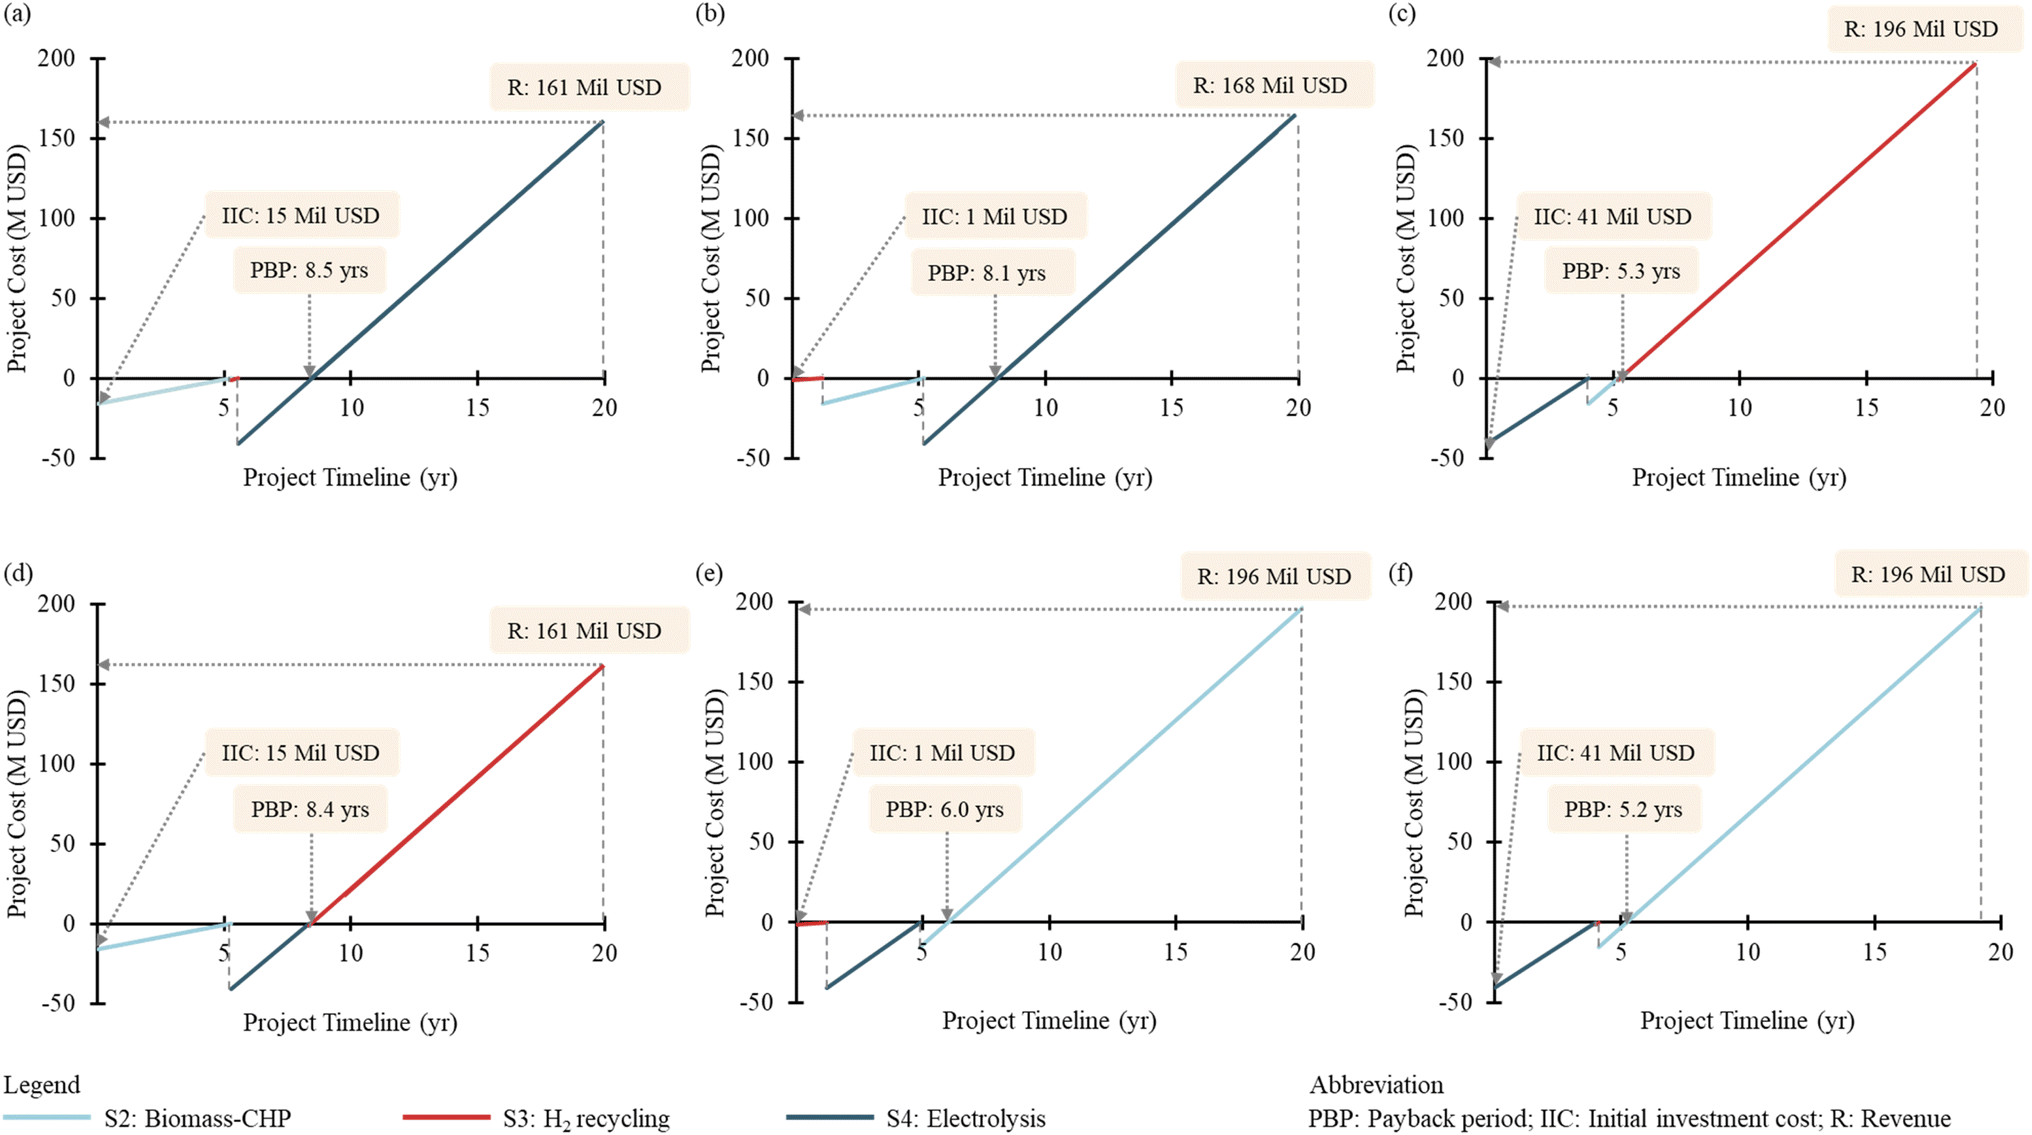 | ||
| Fig. 9 Strategy scheduling in option 2 – refinery process, with (a) and (d) S2 deployed first, (b) and (e) S3 deployed first, and (c) and (f) S4 deployed first. | ||
Fig. 9(a) and (d) show the schedule beginning with the implementation of biomass-CHP (S2); Fig. 9(b) and (e) show schedules that start with H2 recycling (S3), while those in Fig. 9(c) and (f) start with water electrolysis (S4). As an example, the scheduling option in Fig. 9(a) begins with the deployment of S2, which incurs an initial investment cost of 15 M USD with a payback duration of 5.3 years. Subsequently, S3 is implemented, starting with an investment of 1 Mil USD and generating returns by year 5.5. Finally, S4, with an investment cost of 41 Mil USD, is implemented last, reaching the payback period for this schedule by year 8.5. This implies that this scheduling began to generate profit after 8.5 years, with a revenue of 161 Mil USD by year 20. Among all six results, Fig. 9(c) and (f), which deploy S4 first, result in the shortest payback period of 5.3 years and 5.2 years, respectively. This is due to S4 having the steepest slope, indicating a higher profit rate (10.15 Mil USD per year). Conversely, Fig. 9(a) and (d), which deploy S2 first, result in longer payback periods of 8.5 years and 8.4 years, respectively. This is due to its relatively lower profit rate of 2.95 Mil USD per year compared to that of S4. Besides, by comparing Fig. 9(a) and (d) (and Fig. 9(c) and (f)), one can observe that the deployment sequence of S3 does not significantly impact the payback period. This is different from S2 and S4, where their deployment sequence plays a critical role in the duration of the payback period (see Fig. 9(b) and (e)), which are 8.1 and 6 years, respectively. This is due to the fact that strategy 3 has a lower investment cost (0.237 Mil USD) and profit rate (0.93 Mil USD per year). Besides, option 2 has the lowest maximum investment at a time compared to option 1, indicating lower financial risk. However, options 1 and 2 have the same requirement of total investment costs, potentially leading to high loans. Therefore, other strategy scheduling options are considered. For instance, high loans can be minimised by generating revenue from the reduction strategy, as shown in option 3 (see Fig. 10).
 | ||
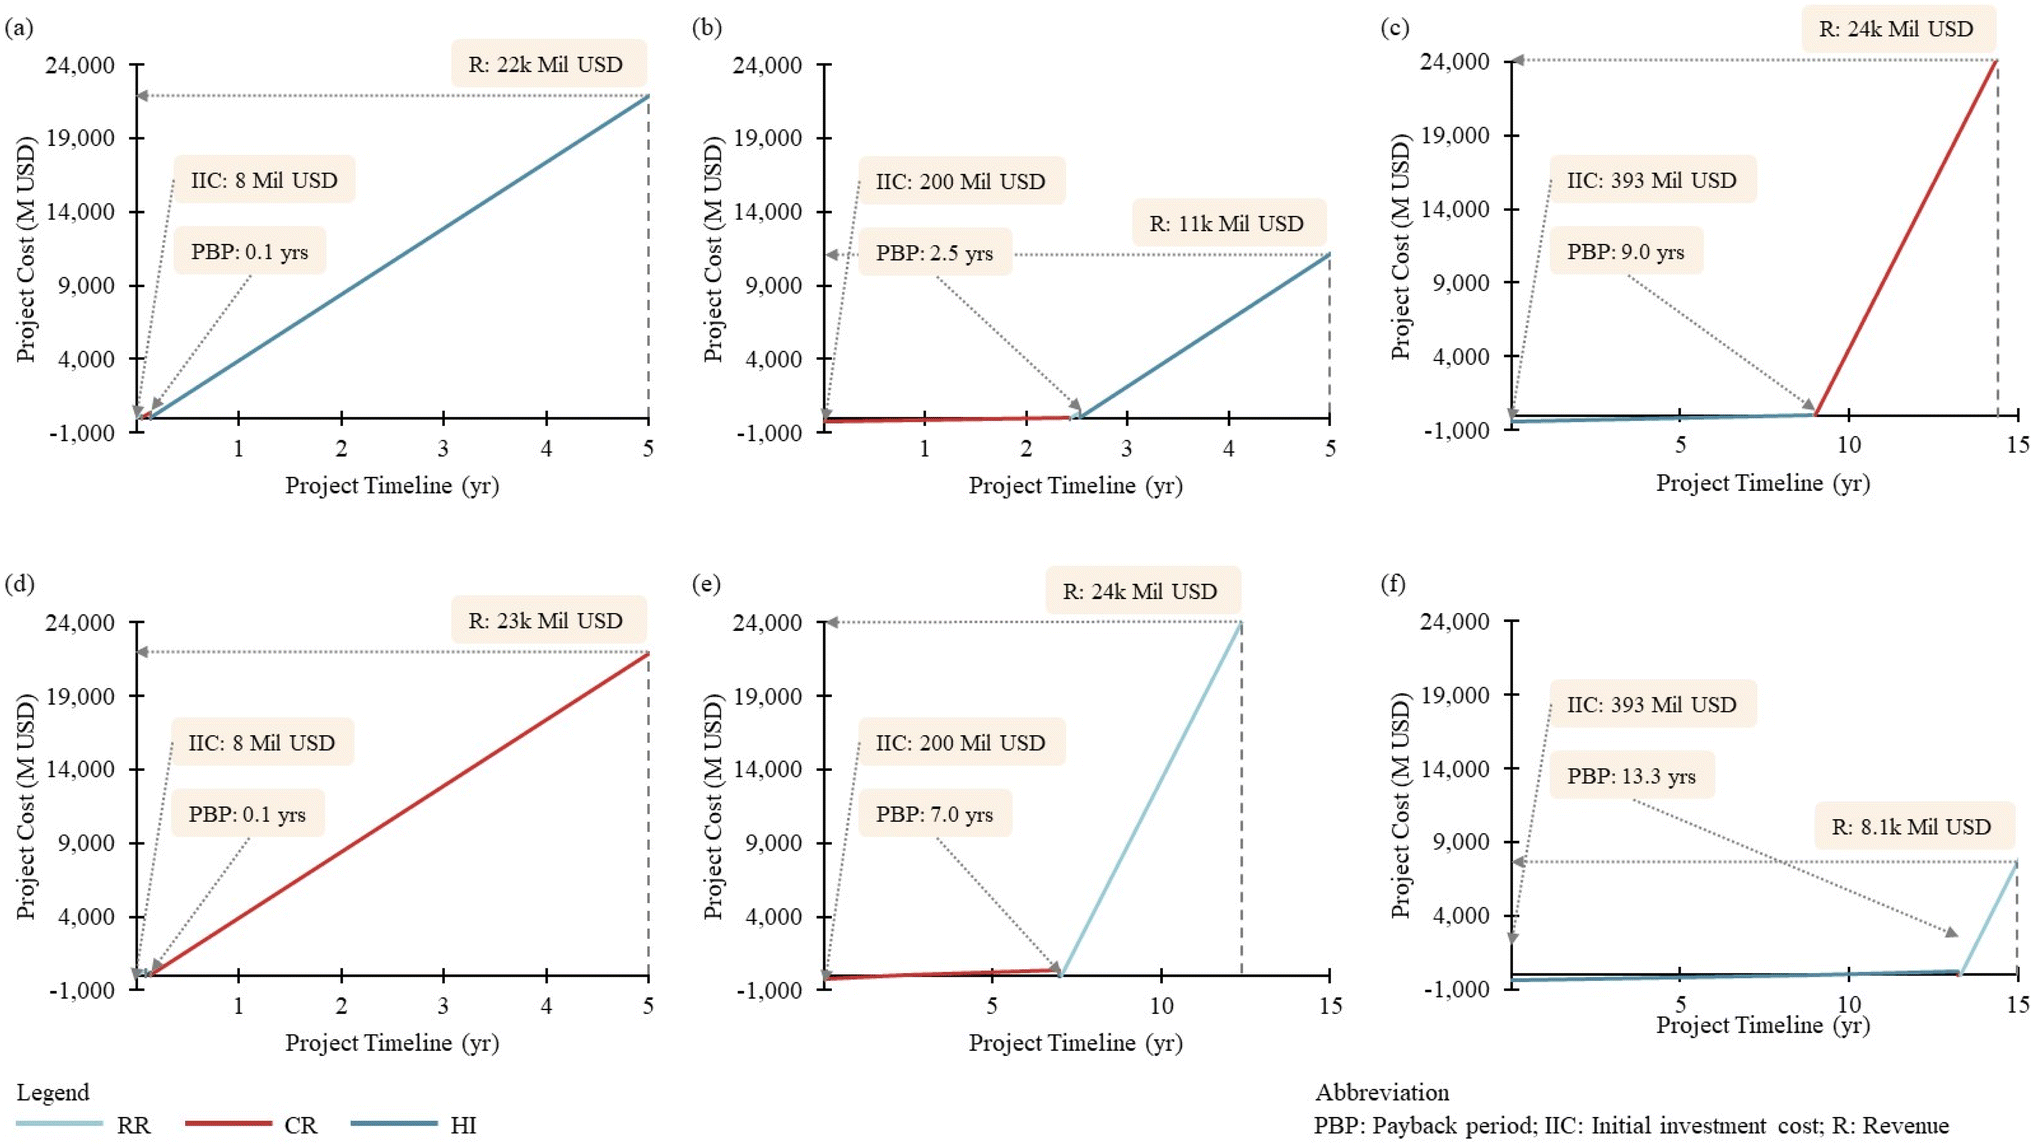
| Fig. 10 Strategy scheduling in option 3 – refinery process, with (a) and (d) S2 deployed first, (b) and (e) S3 deployed first, and (c) and (f) S4 deployed first. | ||
Fig. 10 shows another six scheduling alternatives based on option 3. Taking Fig. 10(a) as an example, S2 is introduced at the beginning. It incurs an initial investment cost of 15 Mil USD, which is the only loan required for this scheduling. It takes 5.3 years to payback the cost and start generating revenue, which is sufficient to cover the cost of the second strategy. S3 was implemented in year 5.6, with zero economic value, as all revenue was used for the S3 investment. From year 5.6 onwards, it begins generating revenue to cover the investment cost for the third strategy from saving costs achieved by the first and second strategies. The results show that sufficient revenue is generated for S4 deployment by year 16.1, which is deemed as the payback period for this scheduling. Finally, S4 is implemented, initiating profit generation for this scheduling. Among all six results, Fig. 10(c) and (f), which deploy S4, first incur the highest loan needed of 41 Mil USD but result in the shortest payback period, occurring at years 5.6 and 5.5, respectively. Apart from this, S3 does not have any significant impact on the payback period in option 2 but differs in option 3. Fig. 10(b) and (e) show that deploying S3 first results in a significantly longer payback period, spanning across 28.4 and 46.4 years. This is because S3 with a lower profit rate, requires more time to generate revenue for the second strategy, resulting in the longest payback period. Lastly, comparing options 2 and 3, option 3 generally exhibits longer payback periods, as it relies on revenue generation to cover subsequent capital costs rather than taking out loans, posing a lower financial risk than options 1 and 2.
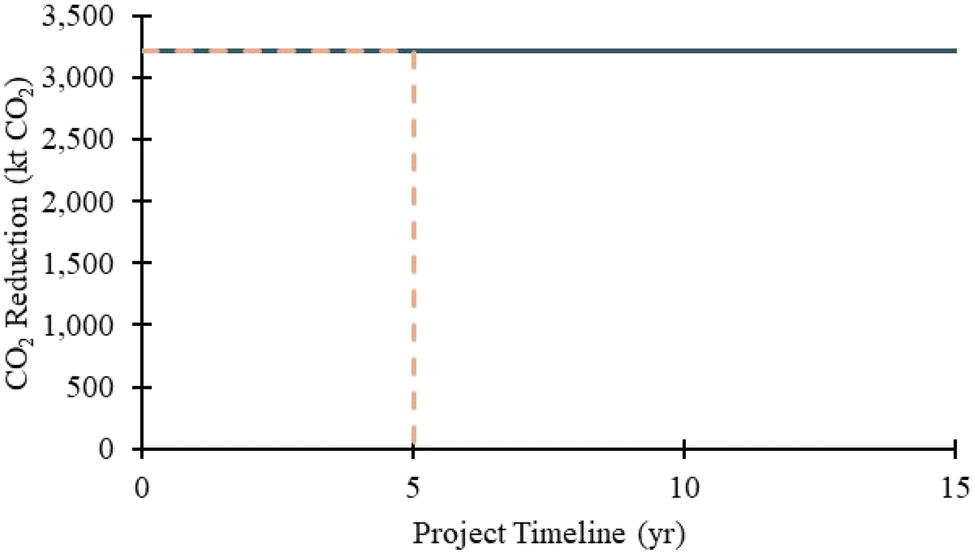
Fig. 8–10 illustrate the potential total loan required and payback period for the various strategy schedules. In order to determine the feasible strategy schedule that meets the reduction target within the desired timeframe, CO2 emissions reduction is plotted against the project timeline, assuming that the reduction target must be achieved within 5 years. Fig. 11 shows that option 1 met the 32% reduction target in the initial year as the selected reduction strategies were implemented simultaneously. The dotted line indicates the year in which the reduction target must be achieved, which is set as 5 years for this case study. However, decision-makers can adjust this timeline by shifting the dotted line to consider shorter or longer targets.
 | ||
| Fig. 11 Targeted CO2 emissions reduction and completion year for option 1 – refinery process. | ||
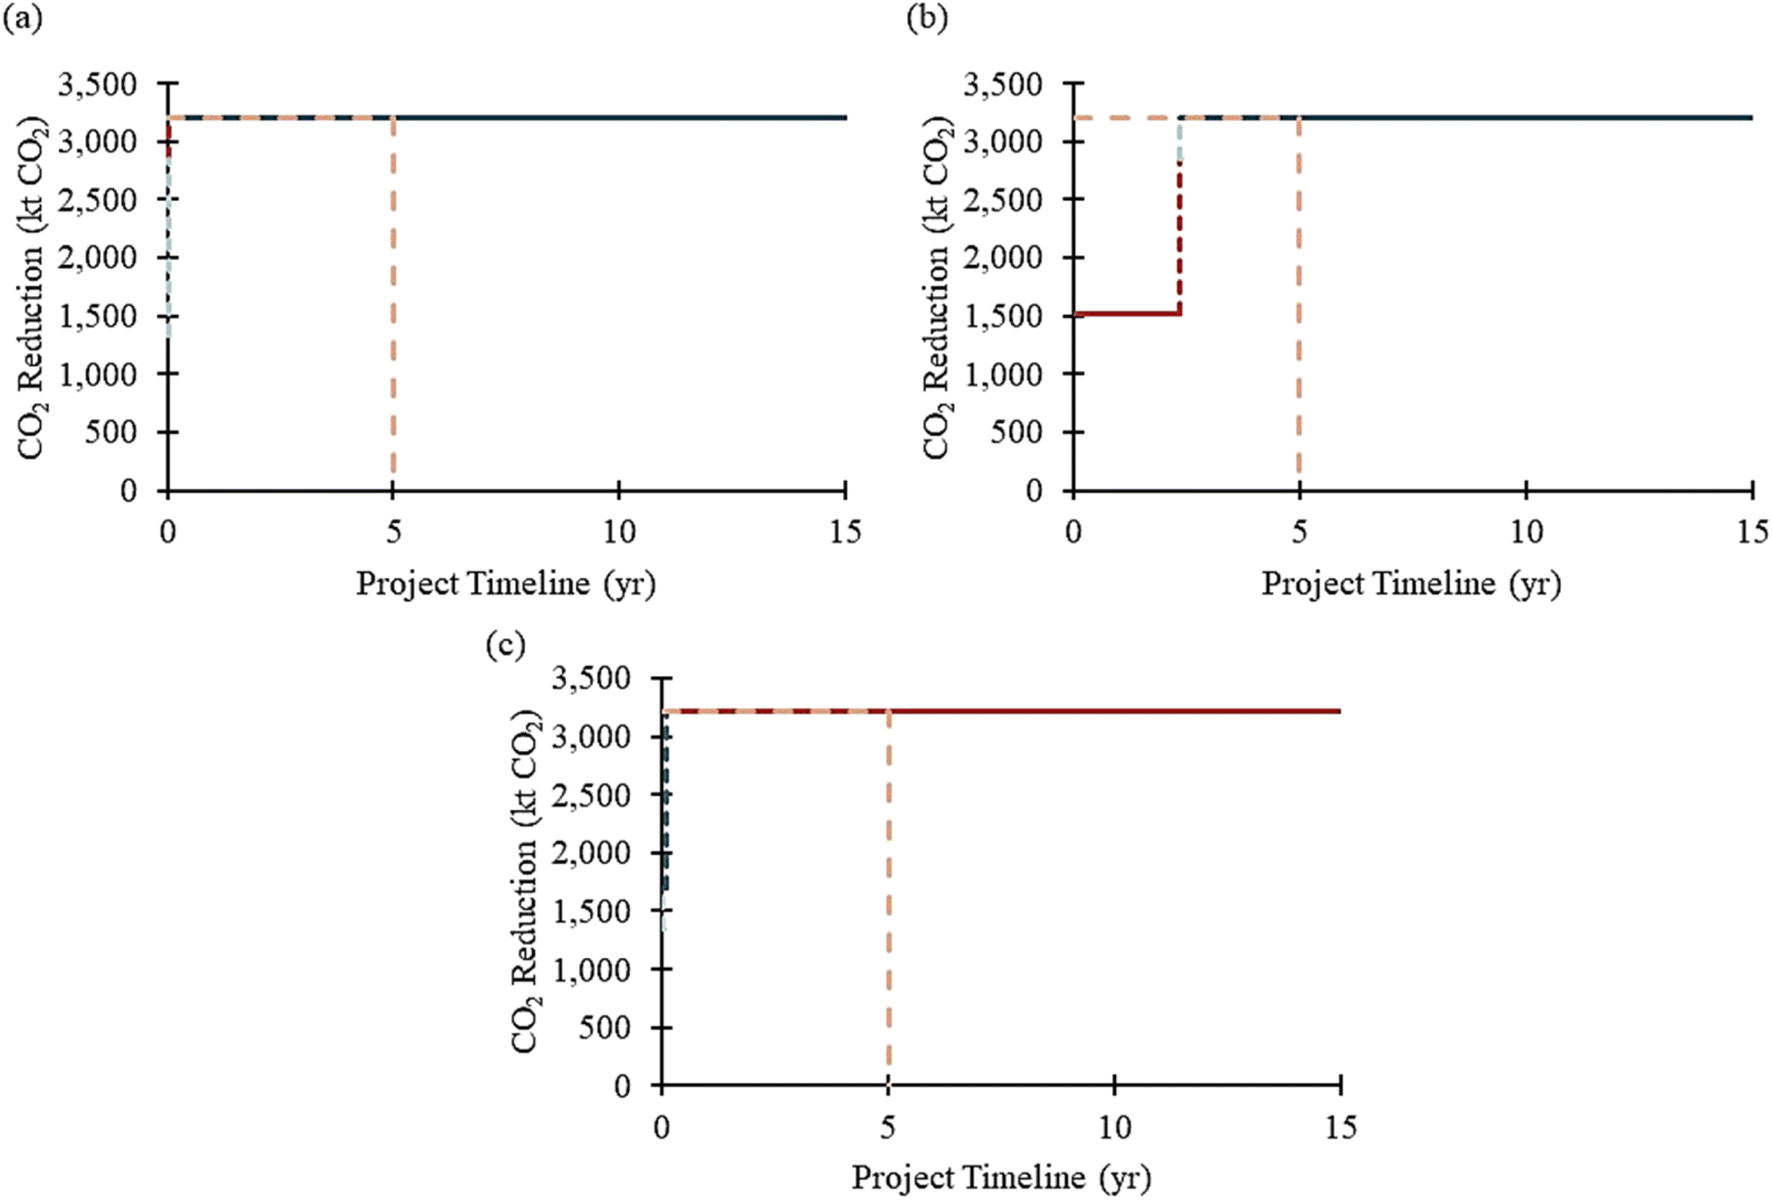
Apart from this, Fig. 12 shows the results of the option 2 strategy scheduling that achieves the 32% reduction target within 5 years. Only two schedules under option 2 have achieved this target within 5 years, as shown in Fig. 12(a) and (b). In contrast, schedules from option 3 have yet to meet the reduction target within 5 years.
 | ||
| Fig. 12 Targeted CO2 emissions reduction and completion in 5 years for option 2: (a) result from Fig. 9(e) and (b) result from Fig. 9(f). | ||
The remaining strategy schedules that cannot meet the 5 year target are checked further to evaluate their capability to meet the emissions target if it is set at a later period, e.g., 10 years. Among them, only four results from option 2 strategy scheduling (see Fig. 13) and two results from option 3 strategy scheduling (see Fig. 14) can achieve the 32% reduction target within 10 years.
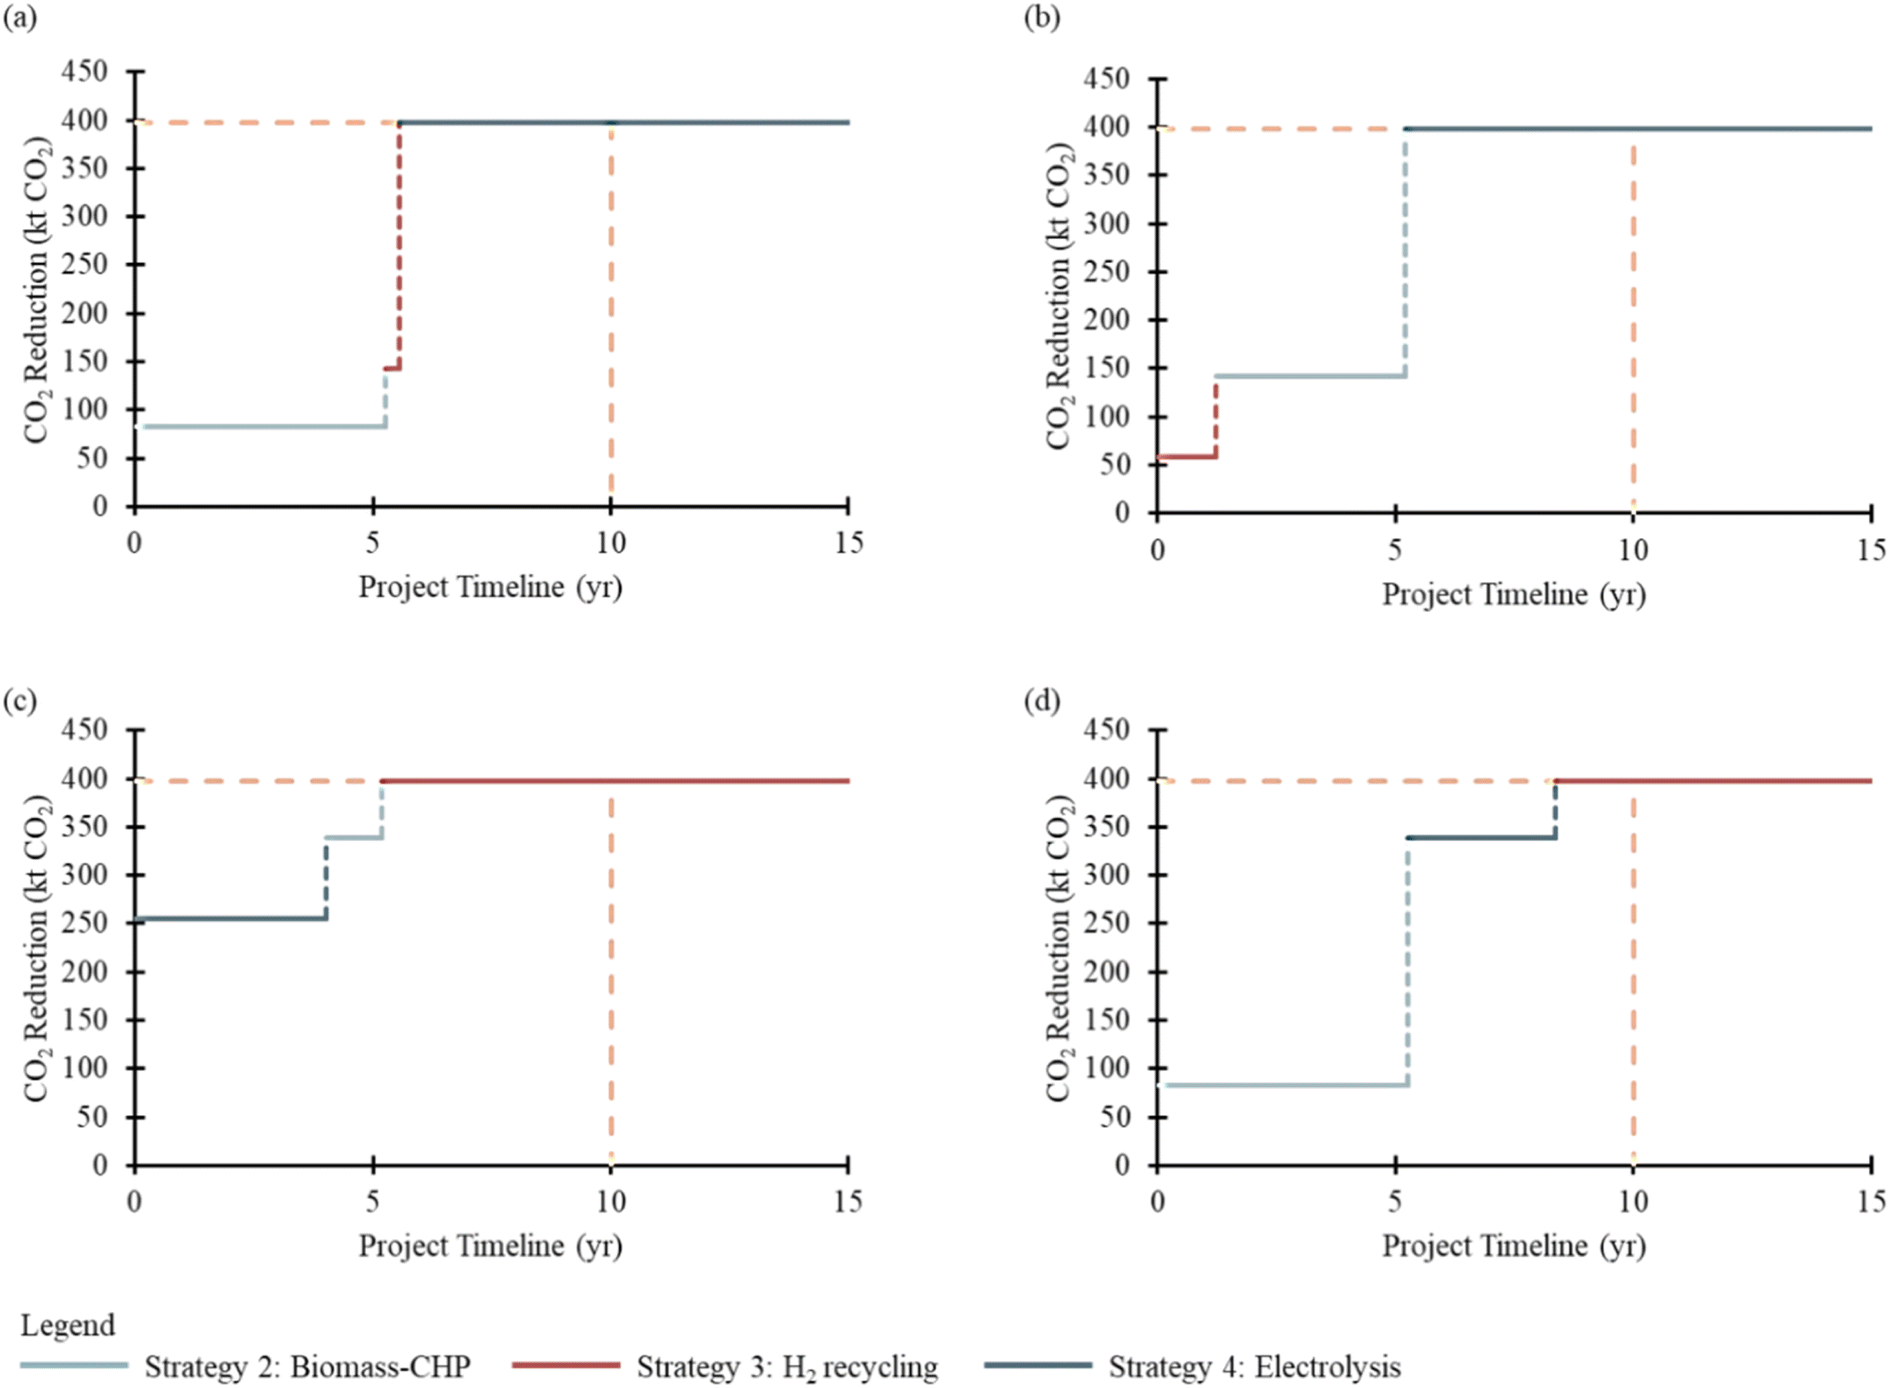 | ||
| Fig. 13 Targeted CO2 emissions reduction and completion in 10 years for option 2: (a) result from Fig. 9(a), (b) result from Fig. 9(b), (c) result from Fig. 9(c), and (d) result from Fig. 9(d). | ||
 | ||
| Fig. 14 Targeted CO2 emissions reduction and completion in 10 years for option 3: (a) result from Fig. 10(c), and (b) result from Fig. 10(f). | ||
3.4 Strategy determination
Based on the result analysis, the outcomes are categorised to help decision-makers determine the optimal strategy scheduling based on various factors. The factors that govern the decision of strategy scheduling include the shortest payback period and the lowest maximal investment at a time.To determine the most optimal strategy scheduling, the capability to meet emissions reduction goals serves as a deciding factor. If the goal is set to be met within 5 years, none of the option 3 alternatives are eligible. In this scenario, option 2, which deploys S4 first (see Fig. 12(b)), provides the most effective scheduling for achieving the reduction target within the 5 years' timeframe. Only if the CO2 emissions reduction target is relaxed to be met within 10 years two of the option 3 alternatives become eligible for consideration. In this case, option 3, which also prioritises S4 (see Fig. 14), proves to be the most optimal strategy scheduling to achieve the reduction target within the 10-year timeframe.
These categories allow decision-makers to select the optimal strategy based on the shortest payback period and the lowest maximal investment at a time considering the timeline for achieving reduction targets.
4 Case study 2: decarbonising a methanol production process
According to the International Methanol Producers and Consumers Association31 approximately 165 Mt per year, or 0.3% of global emissions, are caused by the production and consumption of methanol. With the global methanol production capacity expected to increase to 311 Mt by 2030 (from 157 Mt in 2020),32 there is a significant need to curtail CO2 emissions associated with this industry. Methanol production processes offer a unique advantage by utilising carbon emissions from industries as feedstock, presenting an opportunity to achieve significant CO2 emission reductions ranging from 65% to 95%.32 This emphasises the importance of practicing practical measures to lessen the environmental effects of methanol production and coordinate with international efforts to combat climate change. Currently, 60% of methanol is produced from syngas derived from coal and natural gas by the main processes of coal gasification and steam methane reforming.33 However, these processes result in high CO2 emissions of 2.971 and 0.7 t CO2 per t MeOH, respectively.34 Manufacturing methanol from syngas is unsustainable and environmentally harmful, without carbon capture and sequestration. Thus, a more ecologically friendly substitute is required. Low-carbon methanol can be produced from renewable sources, for instance, biogas, biomass, and captured CO2.35 To address this, this work considers CO2 emissions reduction strategies for a methanol production process, as shown in Fig. S2,† where biogas is converted into methanol and dimethyl ether (DME). The process energy flow and the corresponding CO2 emission from utility requirements are detailed in Tables S7 and S8† respectively. The utility demands for the methanol process include power, natural gas, medium-pressure steam, cooling water, and refrigerant. These utility requirements entail equivalent CO2 emissions in the process. The results of the case study are presented in the following sub-sections.4.1 Initial CECC diagram
Fig. 15(a) shows the initial CECC diagram of the methanol process, highlighting that shared facilities are the primary sources of carbon emissions. The economic value refers to the utility costs, including the power, natural gas, steam, refrigerant, and cooling water, totalling 27391k USD per day. Furthermore, the methanol process has a total emission of 19678 t CO2 per day, showing a carbon intensity of 0.72 t CO2 per k USD (=19678 t CO2 per day ÷ 27391k USD per day). In this case study, decarbonisation efforts are focused on the whole process, as the emission from dedicated facilities is not significant (571.50 t CO2 per day).
 | ||
| Fig. 15 CECC diagram for the methanol process: (a) initial CECC and (b) final CECC. | ||
4.2 Strategy selection
Three CO2 emissions reduction strategies have been proposed for consideration in the methanol process case study:• Heat integration (HI): Maximising heat recovery through heat exchange across each process stream to reduce the need for external heating and cooling utilities.
• Compressor ratio (CR): Changing the compressor ratio alters the process stream outlet temperature, which can help optimise energy usage and reduce the overall carbon footprint.
• Recycle ratio (RR): Changing the recycle ratio impacts the process components by recycling unreacted gases, thereby increasing the efficiency of the reaction and reducing waste and associated CO2 emissions.
The HI strategy is performed using P-HENS,36 a software used to perform heat integration and determine the optimal heat exchanger network design. Moreover, optimised compressor and recycle ratios are determined through case studies conducted in Aspen HYSYS (version 14).37,38 Unlike the strategies proposed in case study 1, the strategies suggested here have synergetic impacts that affect the overall performance. For example, the changes in the recycle ratio would result in changes in the stream data, which then impact the maximum achievable heat recovery through HI. With this, the additional performances of applying HI and CR on top of the RR are computed and tabulated in Table 3.
| Strategy | CO2 emissions reduction t CO2 per year | Saving cost Mil USD per year | Capital cost Mil USD |
|---|---|---|---|
| a Additional benefits or cost contributed by implementing HI in addition to the RR. b Additional benefits or cost contributed by implementing the CR in addition to the RR. | |||
| HI (C1) | 682634 |
14.58 | 234.33 |
| CR (C2) | 247720 |
30.54 | 189.76 |
| RR (C3) | 1339428 |
4371.40 | 7.99 |
| RR + HI (C4) | 1514957a |
85.08a | 393.34a |
| RR + CR (C5) | 354966b |
44.85b | 199.70b |
In this case study, only binary variables are introduced to indicate strategy selection, as the proposed reduction strategies are designed with fixed operating capacity to achieve CO2 emissions reduction. The model does not allow partial implementation of the strategy (e.g., HI is assumed to achieve maximum heat recovery). In addition, constraints are added to the model to reflect the exclusivity of these strategies. For instance, C4 and C5 can only be implemented if C3 is opted. It is worth noting that the benefit of the hybrid strategies (e.g., C4 that conduct HI and RR simultaneously) is not the same as the sum of individual strategies (C1 and C3) since the change in the recycle ratio would affect the potential savings obtained from HI.
Table 4 shows the selected results to achieve a maximum of 49% CO2 emissions reduction with a minimum TAC of −4375.11 Mil USD (=126.22 + (−4501.33) Mil USD). Additionally, it is important to note that strategy C3 has a significantly lower OPEX of −4371.40 Mil USD than other strategies. This is because C3 involves adjusting the recycle ratio to eliminate the recycling of unnecessary inert gases, thereby increasing reactor efficiency and reducing the energy required to recycle large amounts of waste.
| Strategy | b i | CAPEX Mil USD | OPEX Mil USD | CO2 emissions reduction t CO2 per year |
|---|---|---|---|---|
| a Additional benefits or cost contributed in addition to C3. b Additional benefits or cost contributed in addition to C3. | ||||
| C1 | 0 | 49.21 | −14.58 | 682634.13 |
| C2 | 0 | 39.85 | −30.54 | 247719.71 |
| C3 | 1 | 1.68 | −4371.40 | 1339428.18 |
| C4 | 1 | 82.60a | −85.08a | 1514957.32a |
| C5 | 1 | 41.94b | −44.85b | 354966.65b |
| Result | 126.22 | −4501.33 | 3209352.15 |
|
Fig. 15(b) shows that the initial length of the shared facilities have decreased, reducing CO2 emissions from 19677.96 t per day to 10069.12 t per day and decreasing the economic value from 27391.89k USD per day to 13914.86k USD per day. Shared facilities contributed 48% to the total CO2 emissions reduction, while dedicated facilities contributed 1%, achieving a total CO2 emissions reduction of 49% in the methanol process. These reductions have saved 13469.95k USD per day and 7.08k USD per day from shared and dedicated facilities. Thus, this result is feasible as the reduction target has been met and the economic cost has been decreased; however the slope of the overall process carbon intensity still remains the same.
4.3 Strategy scheduling
Fig. 16 shows the scheduling strategy for option 1 in the methanol process. This scheduling requires an IIC of 601 Mil USD, which encompasses the implementation of C3, C4, and C5 simultaneous. The payback period for this scheduling is achieved in just 0.1 years.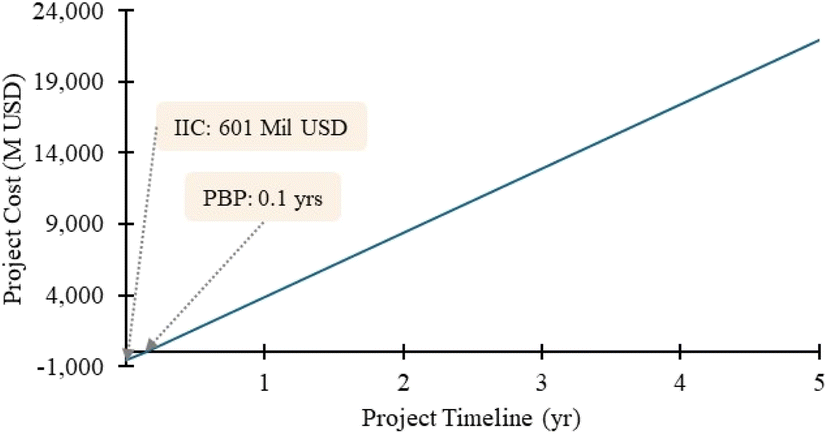 | ||
| Fig. 16 Strategy scheduling for option 1 – methanol process. | ||
In the presence of budget constraints, the strategy scheduling with a lower IIC is plotted as shown in Fig. 17. Among all six results, Fig. 17(a) and (d), which deploy the RR first, result in the shortest payback period. This is because the RR has the highest profit rate (4371.40 Mil USD) and requires the least IIC. Conversely, Fig. 17(c) and (f), which deploy HI, show the longest payback, as HI has a lower profit rate and the highest investment cost.
 | ||
| Fig. 17 Strategy scheduling for option 2 – methanol process where, (a) and (d) RR is deployed first, (b) and (e) CR is deployed first, and (c) and (f) HI is deployed first. | ||
Apart from this, Fig. 18 shows the scheduling of option 3 for the methanol process. It highlighted that deploying HI first (Fig. 18(c) and (f)) also results in the longest payback period, similar to option 2. Additionally, deploying the RR first in option 3 (Fig. 18(a) and (d)) yields the shortest payback period, similar to option 2.
 | ||
| Fig. 18 Strategy scheduling for option 3 – methanol process where, (a) and (b) RR is deployed first, (b) and (e) CR is deployed first, and (c) and (f) HI is deployed first. | ||
The strategy scheduling for the methanol process aims to determine the feasible strategy schedule that meets the reduction target within the desired timeframe. Fig. 19 shows that option 1 met the 49% reduction target in the initial year, as the selected reduction strategies were implemented simultaneously.
 | ||
| Fig. 19 Targeted CO2 emissions reduction and completion year for option 1 – methanol process. | ||
Fig. 20 and 21 show the results for determining a feasible strategy schedule to meet the 49% reduction target within 5 years. For options 2 and 3, three strategy schedules successfully achieved the 49% reduction target within this timeframe. The remaining strategy schedules are set to reach the target within 10 years. Among the remaining three strategy schedules for each of options 2 and 3, only two met the 49% reduction target within 10 years, as shown in Fig. S3 and S4.†
 | ||
| Fig. 20 Targeted CO2 emissions reduction and completion in 5 years for option 2: (a) result from Fig. 17(a), (b) result from Fig. 17(b), and (c) result from Fig. 17(d). | ||
 | ||
| Fig. 21 Targeted CO2 emissions reduction and completion in 5 years for option 3: (a) result from Fig. 18(a), (b) result from Fig. 18(b), and (c) result from Fig. 18(d). | ||
4.4 Strategy determination
Based on the analysis of the methanol process results, the outcomes are categorised to assist decision-makers in identifying the optimal strategy scheduling, focusing on the shortest payback period and the lowest maximal investment at a time.The capability to meet emissions reduction goals is critical in determining the most optimal strategy schedule. If the goal is set to be met within 5 years, both option 2 (see Fig. 20) and option 3 (see Fig. 21) are eligible. In this scenario, option 3, which deployed the RR first (see Fig. 21(a) and (c)), provides the most effective scheduling for achieving the reduction target within the 5 years' timeframe. Therefore, option 3 proves to be the most optimal strategy schedule for achieving the reduction target within 5 years while also minimising potential loans and ensuring a short payback period.
5 Implications
The methodology presented in this paper offers a significant contribution to global decarbonisation efforts by providing a systematic framework for planning and scheduling decarbonisation strategies in chemical process plants. The method allows decision-makers to thoroughly assess decarbonisation strategies by utilising CECC, taking into account CO2 emissions, capital and operating costs, and optimal implementation timing. This methodology addresses critical gaps in current tools, enables stakeholders to balance environmental and economic goals while mitigating financial risks through phased scheduling. Although the current work is tailored for chemical processes, the framework can be easily modified and adapted for other industries and case studies. Its adaptability to various industrial contexts aligns with global sustainability objectives and aids decision-makers in formulating impactful decarbonisation strategies. Ultimately, this approach advances the transition to net-zero emissions by fostering efficiency, innovation, and timely implementation of impactful solutions.6 Conclusion
Prior research has left several crucial questions unanswered, such as the associated CO2 emissions and economic value of emission reduction strategies, as well as the optimal timing to implement these strategies. This study developed a methodology that considers CO2 emissions, as well as the CAPEX and OPEX related to CO2 emissions reduction strategies and the time to implement them. This approach involves collecting emissions and economic data from chemical processes and as input in CECC to evaluate the carbon intensity of the process. Two case studies focused on the refinery and methanol process have demonstrated the methodology. The most cost-effective CO2 emissions reduction strategies, biomass-CHP, water electrolysis, and H2 recycled, are selected for achieving a 32% reduction target with a minimum TAC in the refinery case study. On the other hand, heat integration, compressor ratio adjustments, and recycle ratio adjustments were selected for the methanol case study, leading to a 49% reduction in emissions. The study also innovatively scheduled these strategies to determine the optimal payback period and initial investment cost based on the expected completion year, highlighting the novelty of this work. Through case studies on a refinery and methanol process, the methodology proves helpful in providing insights for decision-makers to determine the optimal strategy scheduling for decarbonisation towards net-zero emissions.However, this work assumes that no lapse time and no profit losses occur during the scheduling of the CO2 emissions reduction strategies, which can introduce uncertainty. Lapse time refers to the downtime during retrofitting, potentially causing profit losses. The economic evaluation focuses on capital and operating costs, without considering factors such as carbon tax, carbon credit, or loan interest rates. To address these limitations, future work can extend the framework presented in this study, by incorporating these cost indicators, including carbon tax and carbon credit mechanisms, alongside the lapse time taken between retrofitting to provide a more comprehensive economic analysis.
Data availability
The data supporting this article have been included in Sections 3.2 and 4.2 as well as the ESI.†Conflicts of interest
There are no conflicts to declare.Acknowledgements
The authors would like to acknowledge the support from the Faculty of Engineering, Computing and Science at Swinburne University of Technology Sarawak Campus.References
- Our World in Data, CO2 emissions, https://ourworldindata.org/co2-emissions, accessed September 2023 Search PubMed.
- American Progress, The pathway to industrial decarbonisation, https://www.americanprogress.org/article/the-pathway-to-industrial-decarbonization, accessed September 2023 Search PubMed.
- IEA, Industry, https://www.iea.org/energy-system/industry, accessed September 2023 Search PubMed.
- EPA, Biomass combined heat and power catalog of technologies, National Service Center for Environmental Publications (NSCEP), https://www.epa.gov, accessed September 2023 Search PubMed.
- UNFCCC, Outcomes of the Dubai Climate Change Conference - Advance Unedited Versions (AUVs) and list of submissions from the sessions in Dubai, https://unfccc.int/cop28/outcomes, accessed June 2023 Search PubMed.
- UN Climate Change, UN climate change conferences – United Arab Emirates, https://unfccc.int/cop28, accessed July 2023 Search PubMed.
- Environmental Protection Agency, Sources of greenhouse gas emissions, https://www.epa.gov, accessed October 2024 Search PubMed.
- R. R. Tan and D. C. Y. Foo, Energy, 2007, 32(8), 1422–1429 CrossRef.
- B. Linnhoff and E. Hindmarsh, Chem. Eng. Sci., 1983, 38(5), 745–763 CrossRef CAS.
- Y. Zhang, H. Wang, T. Zhou, Z. Li and X. Jia, Energies, 2022, 15(13), 4611 CrossRef CAS.
- D. Crilly and T. Zhelev, Clean Technol. Environ. Policy, 2010, 12, 177–189 CrossRef CAS.
- G. S. Krishna Priya and S. Bandyopadhyay, Clean Technol. Environ. Policy, 2013, 771–782 CrossRef.
- M. R. Walmsley, T. G. Walmsley, M. J. Atkins, P. J. Kamp and J. R. Neale, Appl. Energy, 2014, 135, 656–665 CrossRef.
- N. S. M. Yahya, L. Y. Ng and V. Andiappan, Energy, 2021, 237, 121488 CrossRef.
- D. Ramsook, D. Boodlal and R. Maharaj, Carbon Manage., 2022, 13(1), 164–177 CrossRef CAS.
- Y. E. Chew, Z. W. Gan, H. Heng, P. N. S. B. Nair, R. R. Tan and D. C. Foo, Clean Technol. Environ. Policy, 2023, 25(7), 2413–2431 CrossRef.
- M. Tarequzzaman, I. Khan, M. Sahabuddin and M. Al-Amin, J. Renewable Sustainable Energy, 2024, 16, 2 Search PubMed.
- W. Tjan, R. R. Tan and D. C. Y. Foo, J. Cleaner Prod., 2010, 18(9), 848–856 CrossRef CAS.
- Z. Qin, K. Tang, Y. Yu and Z. Zhang, J. Cleaner Prod., 2018, 186, 978–987 CrossRef CAS.
- J. Y. Yap, J. Tan, D. C. Y. Foo, R. R. Tan, S. Papadokonstantakis and S. Badr, Process Saf. Environ. Prot., 2020, 133, 51–63 CrossRef CAS.
- T. Ramanath, D. C. Y. Foo, R. R. Tan and J. Tan, Chem. Eng. Res. Des., 2023, 193, 826–842 CrossRef CAS.
- D. R. Kiran, Principles of Economics and Management for Manufacturing Engineering, Elsevier, 2022, pp. 259–267 Search PubMed.
- Statista, Global GHG emissions from oil and gas refining 2015-2022, https://www.statista.com/statistics/1383704/global-oil-and-gas-refining-emissions/#:%7E:text=Globaloilandgasrefining,yearincreaseof2.1percent, accessed July 2023 Search PubMed.
- N. Sunny, A. Bernardi, D. Danaci, M. Bui, A. Gonzalez-Garay and B. Chachuat, Front. Chem. Eng., 2022, 4, 804163 CrossRef.
- US EPA, 2020 Greenhouse Gas Reporting Program Sector Profile: Petroleum Refineries Sector, Greenhouse Gas Reporting Program (GHGRP), https://www.epa.gov, accessed October 2023 Search PubMed.
- S. I. Bhuiyan, J. Kraus, M. A. H. Baky, R. Stanich, K. Wang, H. Jemison and D. Staack, Sustainable Energy Fuels, 2023, 7(9), 2178–2199 RSC.
- J. P. Abella, K. Motazedi, J. Guo and J.A. Bergerson, Petroleum refinery life cycle inventory model (PRELIM) PRELIM v1.4., https://www.ucalgary.ca/energy-technology-assessment/open-source-models/prelim, accessed August 2023 Search PubMed.
- Daikin, The facts about R-32 and R-454B, https://www.r32reasons.com/docs/default-source/default-document-library/the-facts-about-r-32-and-r-454b.pdf?sfvrsn=f711fd62_0/, accessed November 2023 Search PubMed.
- EPA, Combined Heat and Power Partnership, https://www.epa.gov/chp/catalog-chp-technologies, accessed November 2023 Search PubMed.
- Energy, Hydrogen production: electrolysis, https://www.energy.gov, accessed November 2023 Search PubMed.
- H. Jouhara, N. Khordehgah, S. Almahmoud, B. Delpech, A. Chauhan and S. A. Tassou, Therm. Sci. Eng. Prog., 2018, 6, 268–289 CrossRef.
- studio Gear Up, Methanol carbon footprint tool and guidance, https://www.studiogearup.com/methanol-carbon-footprint-tool-and-guidance/, accessed November 2023 Search PubMed.
- M. Alvarado, 35th World Methanol Conference, Berlin, Germany, 2017 Search PubMed.
- K. Sankaran, ACS Omega, 2023, 8(32), 29189–29201 CrossRef CAS.
- A. Sheppard, V. Del Angel Hernandez, C. F. Faul and D. J. Fermin, ChemElectroChem, 2023, 10(16), 202300068 CrossRef.
- Methanex, How Methanol is Produced, https://www.methanex.com/about-methanol/how-methanol-is-produced/, October 2023 Search PubMed.
- O. Naud, J. Taylor, L. Colizzi, R. Giroudeau, S. Guillaume, E. Bourreau, T. Crestey and B. Tisseyre, Chapter 4 - Support to decision-making, Academic Press, 2020, pp. 183–224 Search PubMed.
- Aspen Technology, Inc., Aspen HYSYS, Version 14, Aspen Technology, Inc., Bedford (MA), 2024 Search PubMed.
Footnote |
| † Electronic supplementary information (ESI) available. See DOI: https://doi.org/10.1039/d4su00636d |
| This journal is © The Royal Society of Chemistry 2025 |