
 Open Access Article
 This Open Access Article is licensed under a Creative Commons Attribution-Non Commercial 3.0 Unported Licence
Nonthermal plasma assisted desorption and conversion of captured CO2 from atmospheric air†
Chinwendu
Umeojiakor
a,
Loukia-Pantzechroula
Merkouri
b,
Anthony
Griffin
 c,
Melis S.
Duyar
b,
Zhe
Qiang
c and
Yizhi
Xiang
*ad
c,
Melis S.
Duyar
b,
Zhe
Qiang
c and
Yizhi
Xiang
*ad
aDave C. Swalm School of Chemical Engineering, Mississippi State University, Mississippi State, MS 39762, USA. E-mail: yxpxb@missouri.edu
bSchool of Chemistry and Chemical Engineering, University of Surrey, Guildford, GU2 7XH, UK
cSchool of Polymer Science and Engineering, University of Southern Mississippi, Hattiesburg, MS 39406, USA
dDepartment of Chemical and Biomedical Engineering, University of Missouri, Columbia, MO 65211, USA
First published on 25th April 2025
Abstract
CO2 capture and conversion are essential to mitigate the global climate crisis. However, sorbent regeneration frequently relies on the high-temperature thermal-driven process, making the integration of intermittent renewable energy into the process an inherent challenge. Herein, with a lime-based sorbent model system, we show that an electrified process for the desorption and conversion of captured CO2 (to CO or CH4) can be achieved through a non-thermal dielectric-barrier discharge plasma reactor. Specifically, up to 87.7% of captured CO2 (by CaO from the air) can be converted into CO under the discharge of 10% H2/Ar at a power of 24.7 W. The reaction can also be tuned for CH4 production when a dual function material, Ni–Ru CaO/CeO2–Al2O3, or a physical mixture of CaO and a Ru/Al2O3 methanation catalyst is employed. The kinetics of such a process are evaluated based on the nonsteady-state semi-batch reactor model. The reactions are identified to be first order for both CO2 desorption and hydrogenation processes.
Sustainability spotlightTo deal with the climate crisis that originated from the greenhouse effect due to the extensive usage of fossil fuels, CO2 must be captured by a sorbent material both at point of large-scale emission sources and directly from the atmospheric air. The captured CO2 within sorbent materials needs to be desorption and/or conversion through the high-temperature thermal-driven process, making the integration of intermittent renewable energy into the process an inherent challenge. The current research show that an electrified process, namely, non-thermal dielectric-barrier discharge plasma assisted desorption and conversion of captured CO2 (to CO or CH4) by CaO based sorbent from atmospheric air. This work aligns with the UN SDGs 9 (industry, innovation, and infrastructure) and 13 (climate action). |
1. Introduction
To meet the energy and chemical demands of modern society, fossil fuels such as coal, petroleum, and natural gas have been used on an unprecedented scale. This extensive usage has resulted in the annual release of more than 37 billion tons of CO2 into the environment.1 The increase of CO2 concentration in the atmosphere has led to a significant climate crisis due to the greenhouse effect, which requires nations to reduce net greenhouse gas emissions by 50–52% in 2030 and reach net-zero emissions no later than 2050.2 In order to achieve these targets, applying carbon negative technologies, such as carbon capture and storage/utilization, is of particular importance. Consequently, CO2 must be captured by a sorbent material both at the point of large-scale emission sources (such as fossil fuels fired power plants and the iron and steel sectors) and directly from the atmospheric air. The captured CO2 within sorbent materials must be regenerated through thermal-driven desorption and/or conversion via various reactions such as methanation, reverse water–gas-shift, and dry reforming. Sorbent regeneration is the most energy-intensive step during the process, and therefore there is an urgent need to develop alternative regeneration routes with reduced energy use and environmental footprint.3–7Among various solid sorbent materials, calcium oxide (CaO) has a high CO2 capture capacity (∼0.78 gCO2/gCaO) and is cost-efficient, with estimated capture costs of 26 USD per ton CO2 according to techno-economic analyses.8,9 Additionally, CaO precursors (e.g., natural limestone) are abundant and nontoxic,10 and as a result, the “calcium looping” (CaL) technology has been identified as a promising alternative to the current amine scrubbing technique for CO2 (and also SO2) capture at points of large-scale emission sources.10–13 Consequently, CaO as a sorbent has been extensively studied either in an attempt to increase the cyclic CO2 uptake stability,14–18 or in conjunction with a transition metal catalyst, forming dual function materials (DFMs), for CO2 conversion.19–25 Besides CO2 capture at the point of large-scale emission source, the CaL-related process can also be employed to remove CO2 from the atmosphere (direct air capture, DAC) to compensate for hard-to-decarbonize sectors, such as automobile and aviation. For example, the CaL is in the center of the DAC process using hydroxide solutions, which has been explored by Carbon Engineering Ltd in Canada.26 In such a process, the produced carbonate (e.g., K2CO3) after DAC is reacted with Ca(OH)2 to form CaCO3 for hydroxide (KOH) regeneration; then CaCO3 is separated and calcined to CaO, which is finally rehydrated to Ca(OH)2. Additionally, DAC configurations that only use CaO have also been studied.6,27
During the CaL processes, a common critical step is the CaO regeneration either through calcination of CaCO3 at a high temperature of up to 950 °C (typically achieved in a gas burner furnace with liquefied petroleum gas as the fuel28) or reaction of the captured CO2 with H2 or CH4 (at relatively lower temperatures). The high temperature required for the CaO regeneration makes the CaL processes highly energy intensive. Alternative heating methods, such as concentrated solar radiation, have been employed for CaO regeneration through decomposition or CH4 reforming.29,30 However, a high reaction temperature is still required, and the deactivation of sorbent due to sintering remains significant. Unlike conventional thermal radiation, the dielectric barrier discharge (DBD) plasma offers a unique way to inject energy (ideally from renewable electricity) into a reacting system by generating activated species, such as hot electrons, electronically and vibrationally excited species, ions, and radicals. The integration of plasma with heterogeneous catalytic processes is an emerging technology for power-to-X, capable of CO2 conversion through CH4 reforming,31–39 hydrogenation,40–42 and direct decomposition.43–46 While literature precedents show promising reaction results in gas-phase CO2 conversion, the nonthermal plasma-driven conversion of captured CO2 has only been studied with hydrotalcite as the sorbent by Li et al.,47,48 a similar study with CaO as the sorbent has not been investigated, likely due to the high power requirement owing to the high thermal stability of CaCO3.
Herein, we show an electrified process using the DBD plasma to drive the conversion of CO2 captured by the CaO-based sorbent into CO or CH4. In such a process, the plasma-activated species, such as the hot electrons, ions (Ar+ and H2+), and radicals (![[H with combining macron]](https://www.rsc.org/images/entities/char_0048_0304.gif) ) from the discharge of the H2/Ar mixture, can interact with the surface of the CaCO3, converting the captured CO2 into CO at high conversion. The plasma reactor was insulated to reduce the heat loss, known as “adiabatic” plasma reactor,49 achieving efficient CO2 desorption and conversion at the power of 25–28 W. This study demonstrates non-thermal plasma-assisted desorption and conversion of CO2 captured by CaO-based sorbent at significantly lower temperatures in contrast to traditional thermal regeneration method, reducing energy costs and sorbent material sintering. CO produced from this process can be coupled with Fischer–Tropsch synthesis, leading to a representative power-to-liquid process. Additionally, the product selectivity can be tuned from CO to CH4 when a catalytic methanation active site is incorporated into the sorbent, forming a dual-function material, or when a physical mixture of a CaO sorbent and a separate methanation catalyst (Ru/Al2O3) is used, leading to a typical power-to-gas process. The plasma-assisted process can also be employed for converting captured CO2 by other sorbents and dual-function materials, providing renewable energy-driven alternative carbon capture and utilization techniques.
) from the discharge of the H2/Ar mixture, can interact with the surface of the CaCO3, converting the captured CO2 into CO at high conversion. The plasma reactor was insulated to reduce the heat loss, known as “adiabatic” plasma reactor,49 achieving efficient CO2 desorption and conversion at the power of 25–28 W. This study demonstrates non-thermal plasma-assisted desorption and conversion of CO2 captured by CaO-based sorbent at significantly lower temperatures in contrast to traditional thermal regeneration method, reducing energy costs and sorbent material sintering. CO produced from this process can be coupled with Fischer–Tropsch synthesis, leading to a representative power-to-liquid process. Additionally, the product selectivity can be tuned from CO to CH4 when a catalytic methanation active site is incorporated into the sorbent, forming a dual-function material, or when a physical mixture of a CaO sorbent and a separate methanation catalyst (Ru/Al2O3) is used, leading to a typical power-to-gas process. The plasma-assisted process can also be employed for converting captured CO2 by other sorbents and dual-function materials, providing renewable energy-driven alternative carbon capture and utilization techniques.
2. Experimental
2.1 Samples preparation
The CaO, 10 wt% MgO/CaO (Mg10CaO), 10 wt% ZrO2/CaO (Zr10CaO), 10 wt% Ni (Ni10CaO), and 5 wt% Ni + 5 wt% MgO (Ni5Mg5CaO) samples were prepared through oxalate method with H2C2O4·2H2O (≥99.5%, Chemsavers), Ca(OH)2 (≥98%, Aldrich Chemical Company, Inc), Mg(NO3)2·6H2O, Ni(NO3)2·6H2O (≥98%, Millipore Sigma), and/or ZrCl4 (≥99.5%, Strem Chemicals) as the precursors. Based on the desired weight ratio, these precursors were measured and placed in different beakers. The amount of oxalic acid was 20% excess than the stochiometric amount necessary for precipitating all metal cations in solution to ensure the metal oxalate formation is not limited by oxalate concentration. Specifically, the powder of Ca(OH)2 and a solution of magnesium nitrate, nickel nitrate, or zirconium chloride were added to the solution of oxalic acid under stirring. The slurry was stirred for 2 h at a speed of 500 rpm and room temperature and then kept in the beaker overnight. Finally, the slurry was centrifuged at 4000 rpm to separate the precipitate. The collected sample was dried in an oven overnight at 100 °C and calcined at 850 °C (ramping at 10 °C min−1) under static air for 4 h. The sample was pelletized, then crushed and sieved to obtain a size fraction between 125 and 250 μm for characterization and DAC study.The Ni–Ru CaO/CeO2–Al2O DFM was prepared by sequential impregnation.21 Firstly, Ca(NO3)2·4H2O (Sigma Aldrich) was mixed with the CeO2–Al2O3 support (SCFa-160 Ce20 Puralox, Sasol) and deionized water. The resulting suspension was mixed using a magnetic stirrer at a speed of 500 rpm and room temperature, and then, a rotary evaporator was used to remove the excess water under reduced pressure. The mixture was dried overnight at 120 °C and calcined at 400 °C (5 °C min−1 ramp and a 4 h hold). After that, the CaO/CeO2–Al2O3 was mixed with excess water, and the required amounts of Ni (NO3)2·6H2O (Acros Organics) and Ru(NO)(NO3)3 solution (1.5 w/v Ru, Alfa Aesar). After mixing all together with a magnetic stirrer a speed of 500 rpm and room temperature, the excess water was removed using a rotary evaporator, and the resulting powder was dried overnight at 120 °C and calcined at 500 °C (5 °C min−1 ramp, 3 h soak). The obtained DFM had 15 wt% Ni, 1 wt% Ru, and 10 wt% CaO on the CeO2–Al2O3 support (20–80 wt%).
The Ru/Al2O3 (5 wt% nominal loadings) was prepared by impregnation followed by wet reduction using NaHB4. Typically, 2 g of Al2O3 (Inframat Advanced Materials) was first mixed with 10 mL of RuCl3 (Sigma-Aldrich) aqueous solution (0.01 gRu mL−1). The resulting suspension was mixed with a magnetic stirrer at a speed of 500 rpm and room temperature for 3 h, then 0.373 g of NaHB4 (98%, Thermo Scientific) was dissolved in around 2 mL deionized water and added dropwise to the suspension and stirred at room temperature for 1 h. The slurry was finally centrifuged to collect the solid samples, which were dried in an oven overnight at 100 °C without calcination.
2.2 Sample characterization
X-ray powder diffraction (XRD) patterns were collected on a Rigaku Ultima III X-ray diffractometer with monochromatic Cu Kα radiation (154.06 pm, 40 kV, and 44 mA) in the range of 2θ from 10° to 60° with a scan speed of 4° min−1. Scanning Electron Microscope (SEM) of the sample was measured using a JEOL 6500F SEM and Zeiss Supra 40 SEM. Nitrogen adsorption/desorption isotherms were measured in a Micromeritics Tristar II 3020 analyzer at 77 K. The sample was degassed at 300 °C under vacuum for 16 h before N2 adsorption/desorption measurement. The surface areas were determined by Brunauer–Emmett–Teller (BET) analysis. In situ diffuse reflectance infrared Fourier transform spectroscopy (DRIFTS) spectra of the CaO under the DAC conditions were collected on a Thermo Scientific Nicolet i20 FTIR spectrometer equipped with a liquid-nitrogen-cooled mercury-cadmium-telluride detector and a Praying Mantis high-temperature operando reaction chamber (Harrick Scientific Products Inc.) with calcium fluoride windows. The spectra were recorded at a resolution of 4 cm−1 with accumulations of 32 scans per min under 30 mL min−1 of atmospheric air (introduced using an aquarium air pump, and the flow rate was controlled with a Brooks mass flow controller).2.3 DAC and plasma-driven CO2 desorption and conversion
Direct air capture (DAC) was achieved by passing atmospheric air through the sorbent under ambient conditions. The sorbent samples containing Ni and Ru were pre-reduced under 30 mL min−1 10% H2/Ar at 600 °C (ramping at 10 °C min−1) for 1 h before DAC. Specifically, 0.5 g of sorbent was first loaded into a 3/8-inch quartz tube with an inner diameter of 7 nm. Then 200 mL min−1 of atmospheric air was passed through the tube for at least 24 h to achieve a saturated CO2 capture on the sorbent. The atmospheric air was introduced using an aquarium air pump and the flow rate was controlled with a Brooks mass flow controller.The plasma-driven desorption and conversion of captured CO2 was performed in a coaxial DBD quartz reactor, which has an inner diameter of 4 mm and an outer diameter of 1/4′′.50,51 Specifically, a 6 cm long stainless steel mesh (20 mesh) was employed as the outer (ground) electrode and wrapped tight around the quartz tube. A K-type thermocouple was attached to the steel mesh electrode for external reactor temperature measurement immediately after turning off the plasma. The outer electrode and thermocouple were wrapped with a ceramic fiber with a 1 cm thickness for insulation, known as “adiabatic” plasma reactor.49 Such an insulated electrode minimizes the heat loss from the electrode, self-heating the plasma reactor up to 500 °C (dependent upon the applied power) without an external heat supply.49,52 A 1/16′′ tungsten electrode was inserted at the center of the reactor and acted as the inner high-voltage electrode. The discharge volume of the DBD reactor is 0.64 cm3 without loading the sorbent/catalyst. The DBD plasma was generated using a PMV500 high-voltage AC power source with an applied voltage of 9–15 kV and a frequency of 22 kHz. The applied voltage was measured by a Tektronix P6015A high-voltage probe connected to a Tektronix MDO32 3-BW-100 oscilloscope, and the voltage across a 10 nF capacitor (UC) was measured by the same oscilloscope with a TPP0250 voltage probe. The power input of the plasma was calculated based on the area inside the charge-voltage (Q–V) Lissajous curves,31 where the voltage V refers to the applied voltage and the charge Q can be calculated from the voltage drop across the external capacitor (capacitance 10 nF).
| Q = Ccapacitor × UC | (1) |
Typically, 0.1 g of the sample (pre-adsorbed with CO2 through DAC) was loaded into the reactor. The reactor inlet gas, either Ar (for desorption) or 10% H2/Ar (for CO2 hydrogenation), was controlled using a Brooks mass flow controller. The reactor outlet was measured by an online Agilent 5973 mass spectrometer (MS, equipped with MS Sensor 2.0 software, Diablo Analytical, Inc). Specifically, m/z = 15, m/z = 28, m/z = 44, and m/z = 40 were measured. The intensity of the m/z signal (Im/z) is then converted to the intensity of each molecule (Imolecule) based on the quantitative calibration, namely, IAr = I40, ICO2 = I44, ICH4 = I15, and ICO = I28-0.0495 × I44. The MS signal intensities of Ar, CO2, CO, and CH4 were converted to partial pressure based on external standard calibration. A more detailed method for quantitative MS analysis can be found in the ref. 53.
The partial pressure was finally calculated to each molecule's mole flow rate (mol min−1) based on the ideal gas equation (Pivtot = FiRT), where Pi is the partial pressure of selected molecules (Pa), vtot is the total volumetric flow rate (mL min−1), Fi is the mole flow rate (mol min−1), R is the ideal gas constant (J mol−1 K), and T is the temperature (K).
The desorption rates of CO2, CO, and CH4 were calculated by normalizing Fi with the weight of the sample (pre-adsorbed with CO2 through DAC).
The time-dependent desorption rates were integrated to obtain the total desorption of CO2 (nCO2), CO (nCO), and CH4 (nCH4). The composition of each species was calculated based on the normalized total desorption amounts. CO2 conversion was calculated based on eqn (2).
 | (2) |
The selectivity of CO and CH4 were then calculated based on eqn (3).
 | (3) |
3. Results and discussion
3.1. CO2 capture by CaO
The nanosized CaO model sorbent (see Fig. S1† for a typical SEM image) was prepared through the thermal decomposition of Ca oxalate. The N2 physisorption results of the Ca oxalate and the fresh CaO showed BET surface areas of 16.1 and 56.1 m2 g−1, respectively (see Fig. S2†). The XRD patterns of the fresh, i.e., as obtained, CaO and the CaO samples after DAC for 6 h and 24 h, respectively, are shown in Fig. 1. It was seen that the CaO sorbent turned into a mixture of CaCO3 and Ca(OH)2 after DAC for 6 h (see also Fig. S3†) and almost pure CaCO3 after 24 h (see also Fig. S4†). The XRD patterns shown in Fig. 1 support that CO2 capture by the CaO could be achieved by the DAC method. The BET surface area of the CaO sample decreased to 38.7 m2 g−1 (see Fig. S2†) after capturing CO2 due to the volume expansion and mass increase after converting CaO into CaCO3. Noteworthily, the BET surface area increased to 57.8 m2 g−1 (almost identical to the fresh CaO) after 1 cycle of the CO2 capture, followed by plasma-assisted hydrogenation of the captured CO2. The presence of Ca(OH)2 in the sample after DAC for 6 h suggests that moisture played a critical role in CO2 capture: CaO first reacted with moisture to form Ca(OH)2 intermediate, which then reacted with CO2 to form CaCO3. The formation of Ca(OH)2 as the intermediate was also evidenced by the in situ DRIFTS study. As shown in Fig. S5,† the immediate appearance of the OH vibrations (at wavenumbers of around 3640 cm−1) after exposure to air indicated the fast formation of Ca(OH)2 from CaO and moisture during the DAC process. Consequently, the moisture level in the air could strongly influence the rate of DAC. Because this paper focuses on the plasma-assisted desorption and conversion of captured CO2 by the CaO-based sorbent, a more detailed influence of moisture on the DAC will not be discussed. | ||
| Fig. 1 XRD patterns of the fresh CaO and the CaO subjected to DAC for 6 h and 24 h, respectively. | ||
3.2. Plasma-assisted desorption/conversion of captured CO2: proof-of-concept
The CaO model sorbent after the DAC was subjected to plasma-assisted desorption and conversion (i.e. hydrogenation) of the captured CO2 under either pure Ar or 10% H2/Ar, respectively. Fig. 2(a) and (b) show the electrical signals and Q–V Lissajous curve of the H2/Ar discharge employed for the proof-of-concept study. It can be observed from Fig. 2(a) that the applied peak-to-peak voltage was 14.8 kV at the frequency (f) of 22.3 kHz (period time t = 1/f = 45 μs), and the peak-to-peak voltage drop across the external capacitor was 35 V under the applied voltage and reaction conditions. The Q–V Lissajous curve shown in Fig. 2(b) was between a parallelogram and oval shape, which is a typical discharge behavior for a coaxial dielectric barrier discharge reactor. The discharge power was calculated to be 28.3 W based on the area of the Lissajous curves. The electrical signals and Q–V Lissajous curve of the Ar discharge were almost identical to that of 10% H2/Ar, except that the Ar discharge showed a slightly lower charge at the same applied voltage. According to the Lissajous curve, the power of Ar plasma was around 25.2 W, which was slightly lower than the plasma of 10% H2/Ar. | ||
| Fig. 2 Electric signals and reaction/desorption behaviors during plasma-assisted desorption and conversion of CO2 captured by CaO. (a) Electrical signals of the H2/Ar discharge; (b) Q–V Lissajous curve of the discharge; (c) and (d) desorption rates under H2/Ar and Ar plasma, respectively, and (e) and (f) cumulative total desorption of CO2, CO, and CH4 under H2/Ar and Ar plasma, respectively. Reaction conditions: 0.1 g of “CaCO3” (CaO after DAC for 24 h), 10% H2/Ar 30 mL min−1 and power of 28.3 W for (c) and (e), Ar 30 mL min−1 and power of 25.2 W for (d) and (f). | ||
The reaction/desorption behaviors of the captured CO2 by CaO assisted by the plasma of 10% H2/Ar are shown in Fig. 2(c) and (e). It was demonstrated that the desorption and conversion of the captured CO2 could be achieved by the DBD plasma without an external heat supply. As shown in Fig. 2(c), desorption of CO and CO2 was observed, whereas desorption of CH4 was negligible during the plasma treatment. The desorption rates of CO2, CO, and CH4 mainly showed broad peaks during the reaction/desorption process. Initially, the rates of desorption/reaction increased due to the increase in the reactor temperature. The rates then started decreasing when the temperature reached the maximum due to the decreased CaCO3 concentration. A small peak within the first 5 min after turning on the plasma can be found. These initial peaks are ascribed to the reaction/desorption of the chemisorbed CO2 rather than the decomposition of CaCO3. The main desorption peaks for CO and CO2 were broad, and the full width at half maximum (FWHM) was 15.9 and 13.2 min, respectively. The maximum rates (peak of the desorption rate curves) of CO and CO2 desorption were 353 and 180 μmol (g−1 min−1) and were achieved after 15.5 and 18 min, respectively. The total desorption of CO and CO2 took around 40 min under the applied plasma conditions (14.8 kV and 28.3 W), indicating a relatively slow decomposition process due to the high thermal stability of the CaCO3. For comparison, temperature-programmed desorption (TPD) profiles of the CaO (after DAC) are shown in Fig. S6.† It was observed that the desorption of CO and CO2 started at temperatures around 600 °C, and total desorption of CO and CO2 was achieved by 800 °C.
By integrating the desorption rates (Fig. 2(c)), the cumulative desorption of CO, CO2, and CH4 per unit mass of “CaCO3” (CaO after DAC) was obtained. As shown in Fig. 2(e), the cumulative CO and CO2 desorption were 5.9 and 2.7 mmol g−1, respectively, whereas the total CH4 desorption was only 0.28 mmol g−1. These results corresponded to a composition of 66.6% CO, 30.2% CO2, and 3.2% CH4, namely, 70% conversion of the captured CO2 and 95.5% selectivity toward CO. The sum desorption of CO, CO2, and CH4 was around 8.9 mmol g−1. Assuming CaO was fully converted into CaCO3 (based on the XRD results) after the DAC, 1 g of CaCO3 could release 10 mmol of CO2, which is slightly higher than the sum desorption of CO, CO2 and CH4, most likely due to the presence of moisture in the sample after the DAC. Noteworthily, the sum desorption of CO, CO2, and CH4 during the TPD of the CaO (after DAC) was 9.1 mmol g−1 (see Fig. S6†), almost identical to the plasma-assisted process, indicating that all captured CO2 had been desorbed/converted by the plasma. Moreover, the conversion of captured CO2 into CO during the TPD was only 51%, significantly lower than the plasma-assisted process. In turn, these results suggest the plasma-assisted process can be more efficient for converting CO2 into CO than the thermal process.
Besides the plasma of 10% H2/Ar, desorption and conversion of the captured CO2 (by CaO) could also be achieved with Ar plasma. As shown in Fig. 2(d), desorption of CO and O2 was identified in the absence of H2, indicating that the desorbed CO2 was decomposed to CO and O2 (2CO2 ↔ 2CO + O2). In contrast to the 10% H2/Ar plasma, the desorption rates for CO2 and CO decreased in the absence of H2. Specifically, the FWHM for the desorption of CO2 and CO was 33 and 26.5 min, respectively, and the maximum rates of CO2 and CO desorption were 203 and 133 μmol (g−1·min−1), which were achieved after 22.5 and 24 min, respectively. Additionally, the total desorption of CO and CO2 lasted approximately 70 min. The cumulative total desorption of CO2 and CO were 5.93 and 3.26 mmol g−1, respectively, corresponding to 35.5% conversion of the captured CO2 (see Fig. 2(f). The significantly decreased rate of desorption and CO2 conversion under the Ar plasma was due to (1) the decreased plasma (25.2 W versus 28.3 W) under the same applied voltage and (2) the absence of highly active hydrogen-related species such as. and H2+. Therefore, using an H2-containing plasma can be considered as a more effective way to regenerate CaO than Ar plasma.
3.3. Influence of second metal/metal oxide
The results discussed above demonstrated the feasibility of both 10%H2/Ar and Ar plasma-assisted processes for desorption/conversion of captured CO2 by CaO. The influence of a second metal/metal oxide doping in the CaO sorbent on the process was investigated only under the 10% H2/Ar considering the higher desorption rate and CO2 conversion. As shown in Fig. 3, the influence of doping the CaO sorbent with 10 wt% Ni (Ni10CaO), 10 wt% ZrO2 (Zr10CaO), 10 wt% MgO (Mg10CaO), and 5 wt% Ni + 5 wt% MgO (Ni5Mg5CaO) has been selected for investigations, considering the potential of enhancing the stability of the CaO and/or desorption rate by adding these species. It was found that the presence of all those metals/metal oxides decreased the rate of desorption, as indicated by reducing the maximum desorption rate shown in Fig. 3(a) and increased FWHM time shown in Fig. 3(d). Nonetheless, the total desorption of CO + CO2 + CH4 almost remained unchanged (Fig. 3(b)), indicating that the DAC capacity of the doped CaO for CO2 was not affected. Specifically, the maximum desorption rate decreased from >500 μmol (g−1·min−1) for CaO to <350 μmol (g−1·min−1) for both Mg10CaO and Zr10CaO. Additionally, the FWHM time increased from 15.5 min for CaO to > 30 min for both Mg10CaO and Zr10CaO (and completed desorption took up to 70 min). The decreased desorption rate of the Mg10CaO and Zr10CaO, however, was associated with slightly enhanced CO2 conversion as shown in Fig. 3(c). | ||
| Fig. 3 Influence of second metal/metal oxide on the reaction/desorption behaviors. (a) Desorption rates of CO + CO2 + CH4, (b) cumulative total desorption of CO + CO2 + CH4, (c) CO2 conversion, and (d) FWHM time. Reaction conditions: 0.1 g of sample (after DAC for 24 h), 10% H2/Ar 30 mL min−1, plasma power 28.3 W. More detailed results can be found in Fig. S7.† | ||
While the metal oxide doping decreased the rate of desorption, doping the CaO with metal (Ni) is found to have a negligible influence on the desorption rate. The maximum desorption rate of Ni10CaO was almost identical to that of CaO, and the FWHM time was only slightly increased. Interestingly, the presence of Ni enhanced the desorption rate when the Ni5Mg5CaO was compared with the Mg10CaO. The former showed a maximum desorption rate of 474 μmol (g−1·min−1) and an FWHM time of 19 min, whereas the maximum rate and FWHM time of the Ni5Mg5CaO were 320 μmol (g−1·min−1) and 32 min. Even though the total desorption of all the studied materials remained almost the same, the presence of Ni increased the CO2 conversion rate (into CO) compared to the pure CaO sample as shown in Fig. 3(c). Nearly 70% of CO2 was converted over the CaO (without Ni), but the conversion increased to 77% for the Ni10CaO. The conversion decreased to 73% with decreasing Ni loading to 5 wt% for Ni5Mg5CaO. Indeed, the Ni–CaO composite-based material has been widely employed as a dual-function material for CO2 capture and conversion based on conventional thermal processes.24,25,54–56 In this work, we demonstrate that the catalytic function of the Ni (and other transition metals) can also be achieved during the proposed plasma-assisted processes. Noteworthily, while Ni has been considered as a typical methanation catalyst, the formation of CH4 was negligible under the present conditions, most likely due to the different mechanisms in the plasma catalysis in contrast to conventional thermal catalysis.
3.4. Tuning the selectivity from CO to CH4
While Ni doping showed lower CH4 selectivity, we further discovered that a Ru site could favor the formation of CH4 under plasma-assisted conditions. The formation of CH4 was achieved through either physically mixing a Ru/Al2O3 methanation catalyst with the CaO-based sorbent or using directly a Ru-containing dual-function material, such as Ni–Ru CaO/CeO2–Al2O that has been previously studied by the thermal-assisted process.21 As shown in Fig. 4(a), a significant amount of CH4 was formed by mixing 0.1 g of Zr10CaO sorbent with only 0.02 g of Ru/Al2O3 (Ru loading 4 wt%). Based on the cumulative total desorption (see Fig. 4(b)), the total CH4, CO, and CO2 desorption were 2.0, 3.8, and 3.2 mmol g−1, respectively. Those corresponded to a composition of 22.2% CH4, 42.3% CO, and 35.5% CO2, namely, 64.5% conversion of the captured CO2 and 34.5% selectivity of CH4 (CH4 selectivity increased nearly 7 times in contrast to Zr10CaO only). We note that the selectivity of CH4 could have been further enhanced by increasing the loading of the Ru/Al2O3 and decreasing the sorbent loading, which, however, would have decreased the capacity of the unit volume of the plasma reactor. Additionally, the presence of Ru/Al2O3 also enhanced the rate of CO2 desorption since the maximum desorption rate increased, and both peak and FWHM times decreased (see Fig. 4(c)). | ||
| Fig. 4 Results demonstrated the formation of CH4 as the main product. (a) and (b) desorption rate and total desorption of CH4, CO, and CO2 from 0.1 g Zr10CaO when mixed with 0.02 g Ru/Al2O4 (Ru loading 4 wt%); (c) difference in total C desorption from 0.1 g Zr10CaO with and without Ru/Al2O3; (d)–(f) results related to Ni–Ru CaO/CeO2–Al2O dual-function material. Reaction conditions: 0.1 g of sample (after DAC for 24 h), 10% H2/Ar 30 mL min−1, plasma power 28.3 W for (a)–(c) and 7.7 W for (e)–(f). | ||
Gratifyingly, when a Ru-containing dual-function material, namely Ni–Ru CaO/CeO2–Al2O, was used for CO2 DAC and conversion by the plasma, the selectivity to CH4 increased and the power requirement decreased. As shown in Fig. 4(d), the power calculated from the Q–V Lissajous curve was only 7.7 W in order to desorb/convert the captured CO2 by the Ni–Ru CaO/CeO2–Al2O, signifying a ca. 72% power reduction compared with the bulk CaO sample. Moreover, the desorption was significantly faster in contrast to the pure or doped CaO. It is illustrated from Fig. 4(e) that the FWHM times for CO2 and CH4 desorption were only 1.2 and 2.85 min, respectively, and complete desorption was achieved within 10 min, which was 4 times lower than pure CaO Over the Ni–Ru CaO/CeO2–Al2O dual-function material, CO2 was captured through weak chemisorption rather than bulk chemisorption/conversion of CaO into CaCO3.21 The activation energy for the CO2 desorption/weak chemisorption is significantly lower than that for bulk CaCO3 decomposition (above 200 kJ mol−1),57 which can explain the particularly short reaction time. Moreover, it was also possible that the proximity of the adsorption and catalytic sites in the Ni–Ru CaO/CeO2–Al2O played a role in its enhanced performance since the adsorbent and catalyst were impregnated together rather than being only physically mixed. Consequently, the rate of CO2 desorption and conversion under the plasma conditions significantly increased. Based on the cumulative total desorption (see Fig. 4(f)), the total CH4, CO, and CO2 desorption were 0.31, 0.02, and 0.3 mmol g−1, respectively. The outlet stream had a composition of 49.8% CH4, 3.3% CO, and 46.9% CO2, while 53.1% conversion of the captured CO2 and 94% selectivity of CH4 were also achieved. In contrast to the results of CaO and Ni10CaO sorbents, we conclude that Ru played a significant role in CH4 formation. Similar to the conventional thermal catalytic CO2 methanation over the Ru/CeO2-based catalyst, we expect that both CO and HCOO* intermediates58 could be involved in CH4 formation under the plasma conditions. Noteworthily, the Ni–Ru CaO/CeO2–Al2O dual-function material employed in this study has been extensively characterized previously,21,59 therefore, this paper did not discuss the characterization results of the Ni–Ru CaO/CeO2–Al2O sample.
3.5. Kinetics
The above discussion about the FWHM time and the maximum peak desorption rate only provided a qualitative overview of the desorption/conversion activities. Here, an apparent kinetic model was developed based on the molar balance of the reactor and the desorption data obtained over the pure CaO model sorbent. Reactions (i)–(v) could be involved during the plasma (10% H2/Ar) assisted desorption/conversion process. Since CaO·CO2 was not under steady-state but H2 was under steady-state flow during the process, the plasma reactor was considered as a “semi-batch” reactor. | (i) |
 | (ii) |
 | (iii) |
 | (iv) |
 | (v) |
Noteworthily, the formation of CO and CH4 according to reactions (iv) and (v) were negligible in contrast to reactions (i)–(iii) because of the low CO2 partial pressure (typically <1.5 kPa) and high space velocity (18![[thin space (1/6-em)]](https://www.rsc.org/images/entities/char_2009.gif) 000 mL (g−1 h−1)) during the reaction process. Therefore, reactions (iv) and (v) were not considered during the kinetics analysis. The molar balance of the “semi-batch” reactor can be expressed as:
000 mL (g−1 h−1)) during the reaction process. Therefore, reactions (iv) and (v) were not considered during the kinetics analysis. The molar balance of the “semi-batch” reactor can be expressed as:
 | (4) |
The reaction rates in eqn (4) can be expressed by the power law model:
 | (5) |
 | (6) |
 (
( , where PH2 is the partial pressure of H2, fixed at 0.1 atm) is the apparent rate constant of reaction (ii) and (iii). CCO2 is the concentration of CO2, and α is the reaction order. Combination of molar balance (eqn (4)) with rate equations (eqn (5) and (6) yield:
 | (7) |
Assuming different reaction orders, the CCO2 can be expressed as a function of time by integrating eqn (7). For the CaO model sorbent, a first-order kinetic was identified (eqn (8)). Noteworthily, other kinetic models for solid–state reaction, such as the Prout–Tompkins model,60 geometricalcontractionmodels, and diffusionmodels,61 which have been studied for the kinetics of thermal decomposition of CaCO3,62,63 failed to fit the data obtained in this study.
 | (8) |
Combining the rate equations (eqn (5) and (6)) with the expression of CCO2 (eqn (8)), the rate (apparent) constant k for the desorption of CO2, CO, and CH4 can be calculated based on eqn (9)–(11).
 | (9) |
 | (10) |
 | (11) |
The pure CaO sorbent was evaluated at different plasma powers and the developed kinetic model was evaluated using the resulting data. Fig. 5 shows the original data obtained over the CaO at different plasma powers. According to the Q–V Lissajous curve of the discharge (see Fig. 5(a)), the applied powers were 24.7, 26.4, and 28.3 W, respectively. As shown in Fig. 5(b)–(d), a small change in plasma power significantly influenced the desorption rate. The maximum rate of CO + CO2 + CH4 decreased from 525 to 239 and 152 μmol (g−1·min−1) with decreasing plasma power from 28.3 to 26.4 and 24.7 W. Further decreasing power to below 23 W showed almost no activity, highlighting the importance of using plasma power that would allow for optimum material performance. Meanwhile, the FWHM and peak time increased with a decrease in desorption rate. As shown in Fig. 5(e), both FWHM and peak times increase almost linearly with decreasing plasma power from 28.3 to 24.7 W. Additionally, the influence of plasma power on the rates of CO and CO2 desorption was quite different (see Fig. 5(c) and (d)), corresponding to a higher CO2 conversion at lower power (see Fig. 5(f)). As the power decreased from 28.3 W to 26.4 and 24.7 W, CO2 conversion increased from 70% to 84.6% (Fig. S8†) and 87.7% (Fig. S9†).
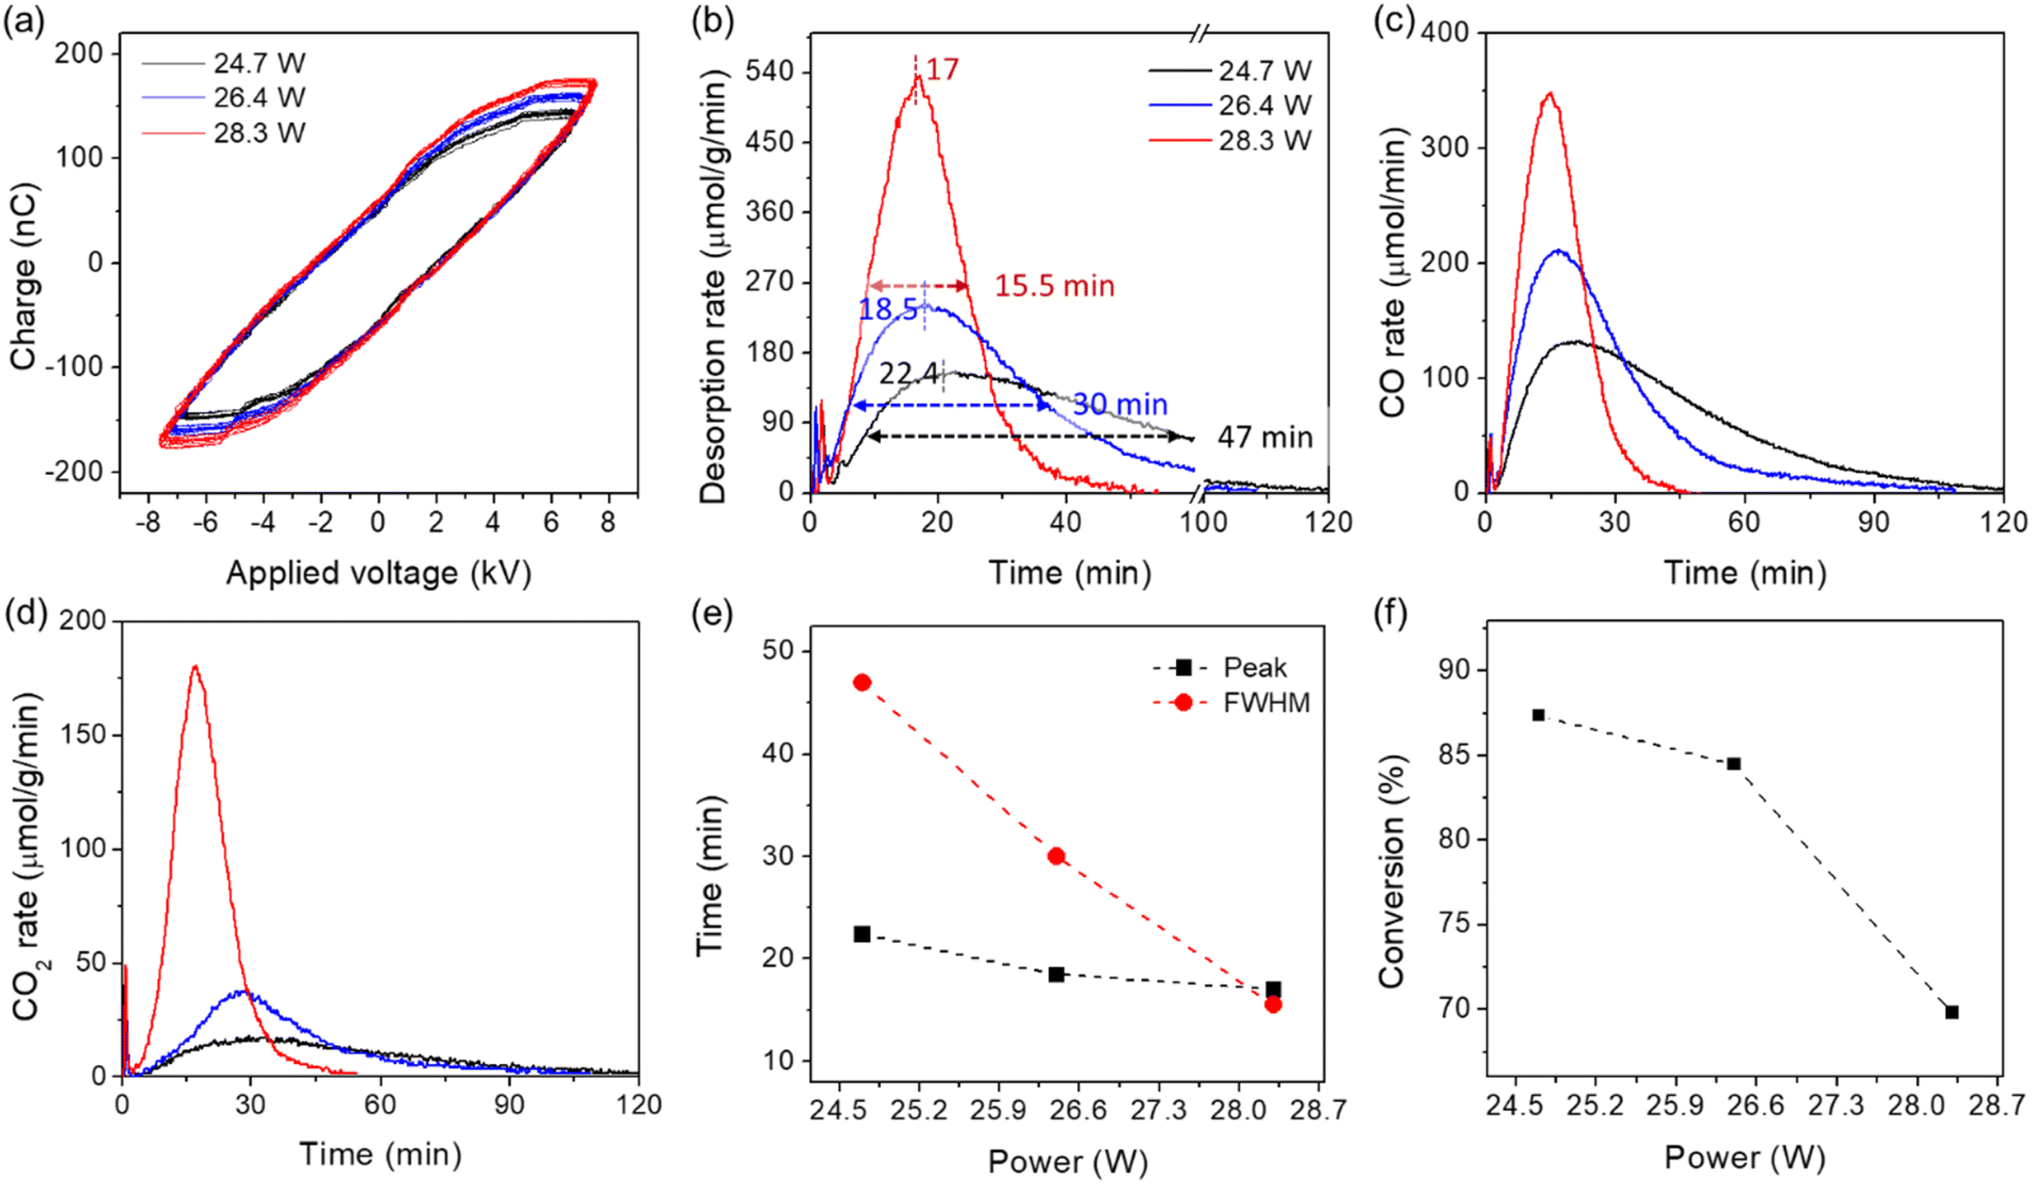 | ||
| Fig. 5 Influence of plasma power on the reaction/desorption behaviors of CO2 captured by CaO. (a) Q–V Lissajous curve of the discharge; (b)–(d) desorption rates of CO + CO2 + CH4, CO, and CO2, respectively, and (e) peak and FWHM times of the desorption rate, and (f) CO2 conversion as a function of power. Reaction conditions: 0.1 g of “CaCO3” (CaO after DAC for 24 h), 10% H2/Ar 30 mL min−1. | ||
For the kinetic analysis, the normalized concentration of CO2 remaining in the sorbent was calculated based on the amounts of CO, CO2, and CH4 desorbed (eqn (12)).
 | (12) |
The changes of CCO2 with time were calculated using eqn (12) and the data are shown in Fig. 6(a) and (b). It was noticed that the ln (CCO2) decreased linearly with time after reaching the maximum desorption rate, confirming the first-order desorption kinetics (eqn (8)). Noteworthily, before reaching the maximum desorption rate, the plasma reactor was still under a non-steady-state due to the changing of the reactor temperature; therefore, the relationship between CCO2 and time deviated from the first-order kinetic behavior. The apparent rate constant k from the slope of the linear relationship represented the sum of the rate constants of reactions (i)–(iii), namely  . The k-value could also be evaluated from the rates of CO and CO2 desorption (after reaching the maximum rate) according to eqn (9) and (10). As shown in Fig. 6(b)–(d), the k-values obtained from the CCO2 were similar to that obtained from the rate of CO desorption, consistent with the developed model. However, the k-values obtained from the rate of CO2 desorption were slightly lower than that obtained from the CCO2, which was probably due to the presence of gas phase reactions, such as CO2 hydrogenation and splitting under plasma conditions.
 | ||
| Fig. 6 Kinetic analysis of the data obtained at different plasma power. (a) Normalized CO2 concentration (remaining in the sorbent) as a function of time (calculated using eqn (12)) (b) normalized CO2 concentration modeled based on eqn (8)); (c) rate of CO desorption modeled based on eqn (10); (d) rate of CO2 desorption modeled based on eqn (9); (e) rate constant k as a function of plasma power; (f) changes in rate constant k before reaching a steady state. | ||
While the rate constants k1 and  from the eqn (9) and (10) could have been evaluated based on the intercept of the linear relationship between the rates of CO2 and CO with time, such a calculation was found to be invalid, potentially due to the magnified error of the intercept by small changes in slope. Hence, the average k-values shown in Fig. 6(b)–(d) were replotted as a function of plasma power in Fig. 6(e). As shown in Fig. 6(e), the k-value increased significantly with increasing power. Besides the steady-state (after reaching the maximum rate of desorption) kinetics, the changes in k-value during the induction period can be obtained based on the differentiation of ln (CCO2) with time (eqn (13)). As shown in Fig. 6(f), it was found that the k-value during the induction period increased, reaching a steady state after around 25–30 min, depending on the applied plasma power.
 | (13) |
4. Conclusions
We showcase an electrified process (capable of using intermittent renewable energy) for the desorption and conversion of captured CO2 from atmospheric air. Specifically, the CaO based sorbents can be employed for CO2 direct air capture, and the desorption and conversion were achieved through solely nonthermal DBD plasma without additional heat supply. The efficiency of the proposed plasma-assisted process is extensively investigated based on the desorption rates of CO2, CO, and CH4, the conversion of CO2, as well as the selectivity of CO and CH4 over the different CaO based sorbents. The desorption rates and CO2 conversion depend highly on the plasma power and the composition of the sorbents. The desorption rate increases, but CO2 conversion decreases with increasing power. CO2 conversion is up to 87.7% with pure CaO as the sorbent under the discharge of 10% H2/Ar at a power of 24.7 W. Meanwhile, introducing Ni to the CaO sorbent increased CO2 conversion from 70 to 77% at a power of 28.3 W, and the rate of desorption was almost not influenced. In contrast, the metal oxide additives, such as MgO and ZrO2, decrease the desorption rates with only slightly increased CO2 conversion. Additionally, the selectivity of CO and CH4 could be tuned. Typically, more than 95% of CO selectivity could be obtained over the investigated sorbents. The formation of CH4 can be maximized (selectivity of 94%) over the Ni–Ru CaO/CeO2–Al2O3 dual function material, which can be achieved at a significantly lower plasma power. Moreover, the kinetics of such a plasma-assisted desorption and conversion process are evaluated based on the nonsteady-state semi-batch reactor model. The reactions are identified to be first-order for both CO2 desorption and hydrogenation and the rate constant is around 0.18 min−1 at a plasma power of 28.3 W. To summarize, this research shows the feasibility of employing DBD plasma for the desorption and conversion of CO2 captured by CaO sorbent from the atmospheric air. This process can be coupled with Fischer–Tropsch synthesis, leading to a representative power-to-liquid process. With appropriate catalyst design, the process can also produce methane with high selectivity, known as the power-to-gas process. We suggest that future research should focus on the materials design to improve the desorption rate and CO2 conversion, as well as CO or CH4 selectivity optimization, and a fundamental understanding of the surface interaction mechanism between plasma-activated species and the sorbent is critical to material design.Data availability
The data that support results from our work are available from the corresponding author.Author contributions
Chinwendu Umeojiakor: investigation; data curation; writing–original draft. Loukia-Pantzechroula Merkouri: investigation; data curation; writing–original draft. Anthony Griffin: investigation; data curation; writing–original draft. Melis S. Duyar: conceptualization; supervision; writing–review and editing. Zhe Qiang: supervision; writing–review and editing. Yizhi Xiang: conceptualization; supervision; writing–review and editing.Conflicts of interest
The authors declare no conflict of interest.Acknowledgements
The DBD plasma reactor system was purchased with partial support from Ergon, Inc. Distinguished Professorship (Dr Neeraj Rai). C. U. acknowledged the financial support from Holly Construction Company for her PhD program. A. G. and Z. Q. acknowledged the partial financial support from U.S. National Science Foundation (CMMI-2239408). SASOL is kindly acknowledged for providing the CeO2–Al2O3 support. Financial support for this work was provided in part by the School of Chemistry and Chemical Engineering and the Doctoral College of the University of Surrey.References
- https://www.iea.org/reports/co2-emissions-in-2023/executive-summary .
- https://www.whitehouse.gov/wp-content/uploads/2021/10/US-Long-Term-Strategy.pdf .
- F. Sabatino, M. Mehta, A. Grimm, M. Gazzani, F. Gallucci, G. J. Kramer and M. van Sint Annaland, Ind. Eng. Chem. Res., 2020, 59, 7007–7020 CrossRef.
- Q. Shu, L. Legrand, P. Kuntke, M. Tedesco and H. V. M. Hamelers, Environ. Sci. Technol., 2020, 54, 8990–8998 CrossRef CAS PubMed.
- W. H. Lee, X. Zhang, S. Banerjee, C. W. Jones, M. J. Realff and R. P. Lively, Joule, 2023, 7, 1241–1259 CrossRef CAS.
- V. Nikulshina, C. Gebald and A. Steinfeld, Chem. Eng. J., 2009, 146, 244–248 CrossRef CAS.
- Y. Xu, S. J. Liu, J. P. Edwards, Y. C. Xiao, Y. Zhao, R. K. Miao, M. Y. Fan, Y. J. Chen, J. E. Huang, E. H. Sargent and D. Sinton, Joule, 2023, 7, 2107–2117 CrossRef CAS.
- A. MacKenzie, D. L. Granatstein, E. J. Anthony and J. C. Abanades, Energy Fuels, 2007, 21, 920–926 CrossRef CAS.
- M. T. Dunstan, F. Donat, A. H. Bork, C. P. Grey and C. R. Müller, Chem. Rev., 2021, 121, 12681–12745 CrossRef CAS PubMed.
- A. M. Kierzkowska, R. Pacciani and C. R. Müller, ChemSusChem, 2013, 6, 1130–1148 CrossRef CAS PubMed.
- G. T. Rochelle, Science, 2009, 325, 1652–1654 CrossRef CAS PubMed.
- D. P. Hanak, E. J. Anthony and V. Manovic, Energy Environ. Sci., 2015, 8, 2199–2249 RSC.
- M. E. Boot-Handford, J. C. Abanades, E. J. Anthony, M. J. Blunt, S. Brandani, N. Mac Dowell, J. R. Fernández, M.-C. Ferrari, R. Gross, J. P. Hallett, R. S. Haszeldine, P. Heptonstall, A. Lyngfelt, Z. Makuch, E. Mangano, R. T. J. Porter, M. Pourkashanian, G. T. Rochelle, N. Shah, J. G. Yao and P. S. Fennell, Energy Environ. Sci., 2014, 7, 130–189 RSC.
- M. A. Naeem, A. Armutlulu, Q. Imtiaz, F. Donat, R. Schäublin, A. Kierzkowska and C. R. Müller, Nat. Commun., 2018, 9, 2408 CrossRef PubMed.
- K. S. Sultana, D. T. Tran, J. C. Walmsley, M. Rønning and D. Chen, Ind. Eng. Chem. Res., 2015, 54, 8929–8939 CrossRef CAS.
- M. Krödel, L. Abduly, M. Nadjafi, A. Kierzkowska, A. Yakimov, A. H. Bork, F. Donat, C. Copéret, P. M. Abdala and C. R. Müller, Adv. Funct. Mater., 2023, 33, 2302916 CrossRef.
- H. Sun, J. Wang, X. Liu, B. Shen, C. M. A. Parlett, G. O. Adwek, E. John Anthony, P. T. Williams and C. Wu, J. Mater. Chem. A, 2019, 7, 9977–9987 RSC.
- H. J. Yoon and K. B. Lee, Chem. Eng. J., 2019, 355, 850–857 CrossRef CAS.
- L. P. Merkouri, J. L. Martin-Espejo, L. F. Bobadilla, J. A. Odriozola, A. Penkova, T. R. Reina and M. S. Duyar, J. Mater. Chem. A, 2023, 11, 13209–13216 RSC.
- L.-P. Merkouri, A. I. Paksoy, T. Ramirez Reina and M. S. Duyar, ACS Catal., 2023, 13, 7230–7242 CrossRef CAS PubMed.
- L.-P. Merkouri, T. Ramirez Reina and M. S. Duyar, Nanoscale, 2022, 14, 12620–12637 RSC.
- H. Sun, J. Wang, J. Zhao, B. Shen, J. Shi, J. Huang and C. Wu, Appl. Catal., B, 2019, 244, 63–75 CrossRef CAS.
- M. Abdallah, Y. Lin and R. Farrauto, Appl. Catal., B, 2023, 339, 123105 CrossRef CAS.
- S. Sun, C. Zhang, Y. Wang, X. Zhao, H. Sun and C. Wu, Chem. Eng. J., 2023, 468, 143712 CrossRef CAS.
- B. Shao, Z.-Q. Wang, X.-Q. Gong, H. Liu, F. Qian, P. Hu and J. Hu, Nat. Commun., 2023, 14, 996 CrossRef CAS PubMed.
- M. Erans, E. S. Sanz-Pérez, D. P. Hanak, Z. Clulow, D. M. Reiner and G. A. Mutch, Energy Environ. Sci., 2022, 15, 1360–1405 RSC.
- M. Samari, F. Ridha, V. Manovic, A. Macchi and E. J. Anthony, Mitig. Adapt. Strategies Glob. Change, 2020, 25, 25–41 CrossRef.
- M.-H. Chang, C.-M. Huang, W.-H. Liu, W.-C. Chen, J.-Y. Cheng, W. Chen, T.-W. Wen, S. Ouyang, C.-H. Shen and H.-W. Hsu, Chem. Eng. Technol., 2013, 36, 1525–1532 CrossRef CAS.
- V. Nikulshina, D. Hirsch, M. Mazzotti and A. Steinfeld, Energy, 2006, 31, 1715–1725 CrossRef CAS.
- V. Nikulshina, M. E. Gálvez and A. Steinfeld, Chem. Eng. J., 2007, 129, 75–83 CrossRef CAS.
- X. Tu, H. J. Gallon, M. V. Twigg, P. A. Gorry and J. C. Whitehead, J. Phys. D: Appl. Phys., 2011, 44, 274007 CrossRef.
- X. Tu and J. C. Whitehead, Appl. Catal., B, 2012, 125, 439–448 CrossRef CAS.
- X. Tu and J. C. Whitehead, Int. J. Hydrogen Energy, 2014, 39, 9658–9669 CrossRef CAS.
- L. Wang, Y. Yi, C. Wu, H. Guo and X. Tu, Angew. Chem., Int. Ed., 2017, 56, 13679–13683 CrossRef CAS PubMed.
- H. Puliyalil, D. Lašič Jurković, V. D. B. C. Dasireddy and B. Likozar, RSC Adv., 2018, 8, 27481–27508 RSC.
- J. A. Andersen, J. M. Christensen, M. Østberg, A. Bogaerts and A. D. Jensen, Chem. Eng. J., 2020, 397, 125519 CrossRef CAS.
- D. Li, V. Rohani, F. Fabry, A. Parakkulam Ramaswamy, M. Sennour and L. Fulcheri, Appl. Catal., B, 2020, 261, 118228 CrossRef CAS.
- J. Feng, X. Sun, Z. Li, X. Hao, M. Fan, P. Ning and K. Li, Adv. Sci. (Weinh.), 2022, 9, e2203221 Search PubMed.
- T. Suttikul, S. Nuchdang, D. Rattanaphra, T. Photsathain and C. Phalakornkule, Int. J. Hydrogen Energy, 2022, 47, 30830–30842 CrossRef CAS.
- M. Q. Feliz, I. Polaert, A. Ledoux, C. Fernandez and F. Azzolina-Jury, J. Phys. D: Appl. Phys., 2021, 54, 334003 CrossRef CAS.
- B. Ashford, C.-K. Poh, K. Ostrikov, L. Chen and X. Tu, J. CO2 Util., 2022, 57, 101882 CrossRef CAS.
- Y. Sun, J. Wu, Y. Wang, J. Li, N. Wang, J. Harding, S. Mo, L. Chen, P. Chen, M. Fu, D. Ye, J. Huang and X. Tu, JACS Au, 2022, 2, 1800–1810 CrossRef CAS PubMed.
- J. Li, X. Zhai, C. Ma, S. Zhu, F. Yu, B. Dai, G. Ge and D. Yang, Nanomaterials, 2019, 9, 1595 CrossRef CAS PubMed.
- V. Guerra, T. Silva, N. Pinhão, O. Guaitella, C. Guerra-Garcia, F. J. J. Peeters, M. N. Tsampas and M. C. M. van de Sanden, J. Appl. Phys., 2022, 132, 070902 CrossRef CAS.
- T. Kozák and A. Bogaerts, Plasma Sources Sci. Technol., 2014, 23, 045004 CrossRef.
- R. Aerts, T. Martens and A. Bogaerts, J. Phys. Chem. C, 2012, 116, 23257–23273 CrossRef CAS.
- S. Li, M. Ongis, G. Manzolini and F. Gallucci, Chem. Eng. J., 2021, 410, 128335 CrossRef CAS.
- S. Li, G. D. Felice, S. Eichkorn, T. Shao and F. Gallucci, Plasma Sci. Technol., 2024, 26, 094001 CrossRef CAS.
- M. R. Shawon, C. Umeojiakor, A. Griffin, J. Aguinaga, J. C. Wu, D. Patton, Z. Qiang, H. Toghiani and Y. Z. Xiang, React. Chem. Eng., 2025, 10, 320–331 RSC.
- G. Chen, J. Qu, P. Cheah, D. Cao, Y. Zhao and Y. Xiang, Ind. Eng. Chem. Res., 2022, 61, 11436–11443 CrossRef CAS.
- J. Van, G. Chen and Y. Xiang, Ind. Eng. Chem. Res., 2023, 62, 2516–2524 CrossRef CAS.
- A. Griffin, G. Chen, M. Robertson, K. Wang, Y. Xiang and Z. Qiang, ACS Omega, 2023, 8, 15781–15789 CrossRef CAS PubMed.
- T. Liang, H. Toghiani and Y. Xiang, Ind. Eng. Chem. Res., 2018, 57, 15301–15309 CAS.
- S. Sun, Y. Wang, Y. Xu, H. Sun, X. Zhao, Y. Zhang, X. Yang, X. Bie, M. Wu, C. Zhang, Y. Zhu, Y. Xu, H. Zhou and C. Wu, Appl. Catal., B, 2024, 348, 123838 CrossRef CAS.
- Z. Lv, T. Deng, C. Gao, Y. Zheng, C. Wu, J. Ran and C. Qin, Chem. Eng. J., 2024, 489, 151427 CrossRef CAS.
- L.-P. Merkouri, T. R. Reina and M. S. Duyar, Energy Fuels, 2021, 35, 19859–19880 CrossRef CAS.
- A. Scaltsoyiannes and A. Lemonidou, Chem. Eng. Sci., 2020, 8, 100071 CAS.
- C. Wang, H. Sun, X. Liu, X. Jin, Y. Feng, H. Shi, D. Wang, Y. Zhang, Y. Wang and Z. Yan, Fuel, 2023, 345, 128238 CrossRef CAS.
- L.-P. Merkouri, L. F. Bobadilla, J. L. Martín-Espejo, J. A. Odriozola, A. Penkova, G. Torres-Sempere, M. Short, T. R. Reina and M. S. Duyar, Appl. Catal., B, 2025, 361, 124610 CrossRef CAS.
- M. E. Brown, Thermochim. Acta, 1997, 300, 93–106 CrossRef CAS.
- A. Khawam and D. R. Flanagan, J. Phys. Chem. B, 2006, 110, 17315–17328 CrossRef CAS PubMed.
- I. Halikia, L. Zoumpoulakis, E. Christodoulou and D. Prattis, ejmp&ep, 2001, 1, 89–102 Search PubMed.
- E. G. Calvo, M. A. Arranz and P. Letón, Thermochim. Acta, 1990, 170, 7–11 CrossRef.
Footnote |
| † Electronic supplementary information (ESI) available. See DOI: https://doi.org/10.1039/d4su00768a |
| This journal is © The Royal Society of Chemistry 2025 |