 Open Access Article
Development and characterization of water hyacinth reinforced thermoplastic starch as sustainable biocomposites†
Diptiranjan
Behera
a,
Shruti S.
Pattnaik
a,
Shubhendu S.
Patra
a,
Aruna K.
Barick
b,
Jyotsnarani
Pradhan
c and
Ajaya K.
Behera
 *a
*a
aDepartment of Chemistry, Utkal University, Bhubaneswar 751004, Odisha, India. E-mail: ajayabehera@utkaluniversity.ac.in; Tel: +91-9938956715
bDepartment of Chemistry, VSSUT, Sambalpur, Odisha 768018, India
cDepartment of Biotechnology, Utkal University, Bhubaneswar 751004, India
First published on 19th February 2025
Abstract
This research endeavors to craft an innovative biocomposite by incorporating varying weight percentages of water hyacinth short fibers as a bio-filler within thermoplastic starch. Notably, composites with a 2 wt% loading of water hyacinth exhibited remarkable enhancements in mechanical properties, showcasing a 113% increment in tensile strength and a 98% rise in flexural strength as compared to virgin thermoplastic starch. Furthermore, this optimized composite exhibited an impact strength of 8.3 kJ m−2 and a hardness value of 9.8, underscoring its mechanical robustness. The intricate interplay between the starch matrix and the bio-filler was meticulously analyzed through FTIR spectral analysis. Moisture sorption properties of the produced composites were evaluated under two distinct ambient humidity conditions, focusing on thermoplastic starch. The thermal stability of the optimized composite was rigorously tested, revealing stability up to 320 °C. Furthermore, a soil burial degradation assessment demonstrated the biodegradable nature of these composites, with a significant 65% reduction in original mass after 60 days in compost conditions. Cytotoxicity testing of the optimized composite confirmed its safety, solidifying the potential of water hyacinth in crafting eco-friendly, biodegradable composites as a sustainable alternative to conventional thermoplastic-based materials.
Sustainability spotlightThe global shift towards sustainability calls for the creation of materials that harmoniously blend environmental responsibility with high-performance capabilities. This research responds to the pressing demand for alternatives to petroleum-based plastics by innovating water hyacinth-reinforced thermoplastic starch biocomposites. By utilizing an invasive aquatic species as a bio-filler, this study aligns with promoting responsible consumption and mitigating environmental harm. The integration of water hyacinth not only transforms a problematic aquatic weed into a valuable resource but also enhances mechanical strength and biodegradability, offering an innovative solution for sustainable production. The eco-friendly nature of this approach ensures that these biocomposites, after their lifecycle, reintegrate into the environment, safely contributing to the protection of life on land sustainably. This research exemplifies the potential for turning ecological challenges into sustainable opportunities, hence fostering a greener future. |
1. Introduction
The growing environmental crisis caused by conventional plastics, particularly their persistence in ecosystems and contribution to pollution, has emphasized the urgent need for sustainable alternatives in single-use products. Annually, over 300 million tons of plastic are produced worldwide, with a significant portion being single-use items that often end up in landfills or as marine debris, taking centuries to decompose.1,2 This has led to critical challenges such as microplastic contamination, threats to wildlife, and increasing greenhouse gas emissions associated with their production and disposal. The development of eco-friendly materials derived from renewable and biodegradable resources has emerged as a promising strategy to mitigate these issues.3,4 Such materials not only address environmental concerns but also align with global sustainability goals by reducing plastic waste and promoting resource efficiency.5,6In this symphony between innovation and nature, the water hyacinth (WH) emerges as a symbol of beauty and resilience. Introduced to India by Warren Hastings as a gift for Lady Hastings, this plant (once cherished for its ornamental allure) soon revealed its dual nature. Across continents, from the serene waters of Asia to the bustling rivers of the United States, the water hyacinth spread its tendrils, becoming an invasive force by the early 1900s.7 Yet, the plant that once threatened ecosystems now offers a new narrative of redemption and utility showcasing its untapped potential. WH contains almost 69% cellulose, 11% hemicelluloses, 7% lignin, 5% pectin, and 8% ash content.8 By harnessing the robust fibers of the WH, we transform a challenge into an opportunity, through sustainable biocomposite fabrication. Its ability to reproduce both sexually and asexually, makes it accessible in almost all kinds of water bodies, be it freshwater or stagnant polluted water, helping in environmental remediation.9 When woven into the fabric of biocomposites, the WH fibers tell a story of renewal, turning a once-feared invader into a champion of ecological balance and resource efficiency.10,11
However, despite the abundant research on water hyacinth's use as a dye/heavy metal adsorbent, there has been limited exploration of its potential as a filler in biocomposites.9,12,13 Sulardjaka et al., (2022) studied the mechanical as well as physical properties of unidirectional water hyacinth fiber (WHF) reinforced epoxy resin composites with varying fiber content (0, 15, 25, and 35 wt%). They found that porosity in the composites increased almost linearly from 0.35% to 13.82% with a 35% fiber addition. The tensile strength decreased slightly with an increase from 0 to 15% fiber content. Further, it declined by 11–13% for every additional 10% of fiber up to 35%, due to improper fiber-matrix adhesion and porosity.10 Sari et al., (2023) explored a water hyacinth/rice husk powder composite for tissue engineering. They found that adding WH powder reduced the composite's tensile strength, possibly due to poor interfacial bonding and increased voids as reported through SEM images. However, the highest tensile strength (32.72 MPa) was achieved with 5% WH powder, and the elastic modulus increased with more WH powder.11
In the ever-evolving symphony of sustainable materials, thermoplastic starch (TPS) represents a blend of tradition and innovation, aiming to replace conventional plastics with eco-friendly alternatives.14–16 Derived from natural grains, TPS exemplifies circular economy principles by transforming waste into valuable resources. This combination enhances the mechanical properties and ecological responsibility of biocomposites.14 Zhang et al., (2023) found that TPS paired with sugarcane cellulose showed superior compatibility, resulting in strong hydrogen bonds, high surface hydrophobicity (contact angle of 68.44°), and maximum tensile strength of 3.75 MPa. The TPS/cornstalk cellulose film also demonstrated the highest degradation temperature of 325 °C.15 Behera et al., (2022) prepared TPS/soy pulp composites with changing compositions, revealing optimal tensile and flexural strength with 10 wt% cellulose and soy waste. Their study showed that water absorption increased significantly from 6.2% to 42.3% with the incorporation of 0 to 25 wt% cellulose filler in the TPS resin.16
Despite TPS's potential as a biodegradable polymer, its inherent brittleness, low tensile strength, and susceptibility to moisture absorption limit its broader application in the industrial and packaging sectors. Improving these mechanical and barrier properties is essential to meet the usage requirements for demanding applications such as single-use packaging, disposable cutlery, and agricultural films. Incorporating fillers, such as natural fibers, offers a viable route to overcoming these limitations, as they can enhance TPS's tensile strength, flexural modulus, and thermal stability. However, challenges such as achieving uniform dispersion, mitigating filler agglomeration, and ensuring strong interfacial bonding between the matrix and the fillers must be addressed to realize these improvements.17,18
The inclusion of compatibilizers like glyoxal and glycerol plays a critical role in enhancing the interfacial adhesion and flexibility of TPS composites. Glyoxal, as a cross-linking agent, contributes to improved dimensional stability and reduced water absorption, while glycerol acts as a plasticizer, improving processability and reducing brittleness. This study explores the unexplored potential of WHF as a natural filler in TPS-based composites. By leveraging the mechanical strength, biodegradability, and sustainability of WHF, combined with the flexibility and eco-friendliness of TPS, this research aims to develop biocomposites capable of replacing conventional thermoplastics. The TPS/WHF composites hold significant promise for single-use packaging applications, where biodegradability is critical to addressing the global challenge of persistent plastic waste and solid waste management.
2. Experimental sections
2.1. Materials
The thermoplastic starch was supplied by Eco Chem., Technology Pvt. Ltd, India. Water hyacinth stems were obtained from water hyacinth plants present at the Utkal University campus, Bhubaneswar, India. Sodium hydroxide (NaOH), from SRL India, was used for surface treatment of WHF. To prepare the resin, glycerol (C3H6O), and glyoxal (OCHCHO), (Merck, India) were utilized as a plasticizer and crosslinking agent, respectively.2.2. Fabrication of water hyacinth reinforced thermoplastic starch composites
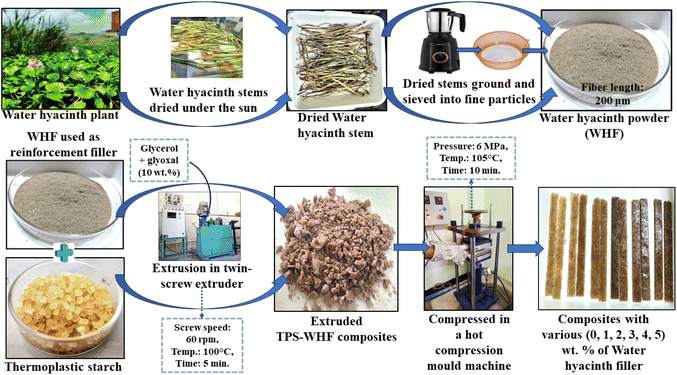
Water hyacinth plants were collected from ponds situated at the Utkal University campus, Bhubaneswar. Water hyacinth fillers were prepared from the stem of the WH plants. After collection from ponds, these stem parts were dried under sunlight for 1 week. Then, the dried stems were alkali (NaOH) treated (2 wt%) for 2 h and further dried at 50 °C for 2 h.1 Their upper layers like soluble lignin, wax, and pectins were removed. The dried water hyacinth fibers were ground using a mixer grinder and sieved through a 500-micron sieve to obtain their powdered form.11To produce thermoplastic starch (TPS), the process began by melting and mixing it at 100 °C with a speed of 60 rpm for 5 minutes using a double-screw extruder in a Brabender mixing chamber to ensure uniform mixing and consistency.19,20 The fillers (WHF), glyoxal, and glycerol were added during the compounding process in the Brabender mixer to achieve better dispersion. Specifically, WHF was added in amounts ranging from 0% to 5% of the solid weight of TPS, while glyoxal and glycerol were each added at 10% of the TPS solid weight.19 Glyoxal acts as a cross-linker, enhancing the structure of the composite, and glycerol serves as a plasticizer to improve the flexibility and processing of the TPS. These TPS blends with varying loading of WHF, were then placed into a hot press, where they were compressed at 105 °C under a pressure of 6 megapascals (MPa) for 10 min.16,19 This process formed the TPS–WHF (TW) composites. Each composite, depending on the amount of WHF used, is labeled as TW0, TW1, TW2, TW3, TW4, or TW5, corresponding to the 0% to 5% WHF content respectively. Fig. 1 shows a diagrammatic presentation of the fabrication of TW composites.
2.3. Procedures of characterizations
 | (1) |
 | (2) |
 represents the slope of the linear section of the graph relating moisture absorption to √t.
![[thin space (1/6-em)]](https://www.rsc.org/images/entities/char_2009.gif) :
:![[thin space (1/6-em)]](https://www.rsc.org/images/entities/char_2009.gif) 1
1![[thin space (1/6-em)]](https://www.rsc.org/images/entities/char_2009.gif) :
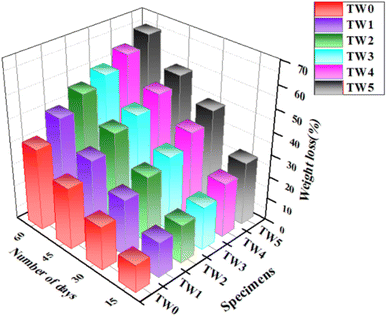
:![[thin space (1/6-em)]](https://www.rsc.org/images/entities/char_2009.gif) 1. The soil bed's moisture content was maintained at 30%. The samples, each measuring 5 × 5 cm2, were placed in a covered container and kept at 32 °C for 60 days.16 At regular intermissions (15, 30, 45, and 60 days), the samples were removed, rinsed with deionized water, and dried in an oven at 50 °C for 2 h. After drying, they were weighed, and the composites' weight loss percentage was calculated using eqn (3) as shown below.19
1. The soil bed's moisture content was maintained at 30%. The samples, each measuring 5 × 5 cm2, were placed in a covered container and kept at 32 °C for 60 days.16 At regular intermissions (15, 30, 45, and 60 days), the samples were removed, rinsed with deionized water, and dried in an oven at 50 °C for 2 h. After drying, they were weighed, and the composites' weight loss percentage was calculated using eqn (3) as shown below.19 | (3) |
| Cell viability (%) = [absorbance of sample/absorbance of control] ×100 | (4) |
3. Results and discussion
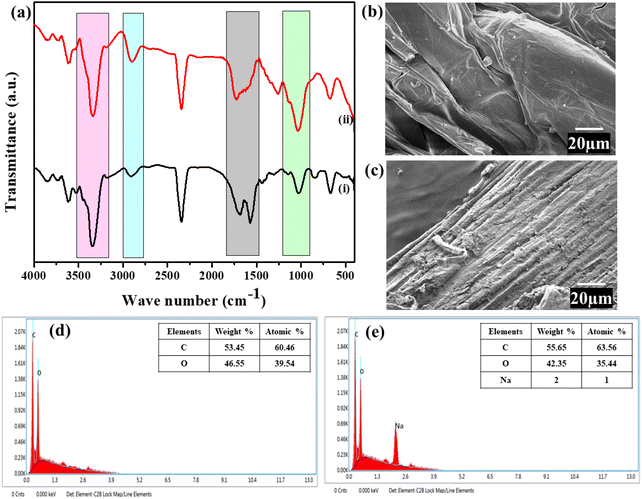
3.1. Effect of alkali treatment on WHF
3.2. Tensile and flexural analysis of TW composites
Table 1 displays the mechanical properties of the TW composites. As the filler content increased from 0 to 2 wt%, both the tensile strength and modulus of the composites improved. Notably, the composite with 2 wt% WHF showed a 113% increase in tensile strength and a 55% rise in tensile modulus. This enhancement in the tensile properties of the TW2 composite is attributed to better interfacial bonding between WHF and TPS.16,27 The improved interfacial bonding is likely due to the formation of chemical interactions between the hydroxyl groups of the filler and the matrix, and strengthened by compatibilizers.28 However, when the WHF content surpasses 2 wt%, the composites tend to become brittle. This brittleness leads to a significant drop in both the tensile strength and modulus of the TW composites.19 A similar trend was observed by Behera et al., (2022) in TPS-soy pulp composites, where the mechanical strength increased with the addition of filler up to an optimal level but decreased significantly beyond this point due to higher filler content.16 The reduction in mechanical strength at higher filler loadings was attributed to filler agglomeration, which caused stress concentration and weakened the matrix–filler interaction. This behavior mirrors the performance of TW composites, where exceeding the optimized WHF content results in diminished mechanical properties due to brittleness and structural discontinuities.| Sample | WHF (wt%) | TS ± SD (MPa) | TM ± SD (MPa) | EB ± SD (%) | FS ± SD (MPa) | FM ± SD (MPa) |
|---|---|---|---|---|---|---|
| a WHF: water hyacinth filler, TS: tensile strength, TM: tensile modulus, EB: elongation at break, FS: flexural strength, FM: flexural modulus, SD: standard deviation. | ||||||
| TW0 | 0 | 3.29 ± 0.02 | 52.3 ± 4.24 | 8.57 ± 0.15 | 3.21 ± 0.04 | 52.1 ± 4.24 |
| TW1 | 1 | 4.24 ± 0.04 | 66.7 ± 4.44 | 7.03 ± 0.21 | 4.01 ± 0.04 | 64.5 ± 4.31 |
| TW2 | 2 | 7.01 ± 0.03 | 81.5 ± 4.63 | 6.61 ± 0.23 | 6.38 ± 0.03 | 74.2 ± 4.45 |
| TW3 | 3 | 4.90 ± 0.03 | 59.0 ± 4.39 | 5.68 ± 0.26 | 3.76 ± 0.05 | 56.1 ± 4.35 |
| TW4 | 4 | 3.66 ± 0.04 | 48.5 ± 4.46 | 5.12 ± 0.23 | 2.55 ± 0.04 | 44.7 ± 4.28 |
| TW5 | 5 | 2.02 ± 0.05 | 43.6 ± 4.67 | 4.77 ± 0.14 | 1.82 ± 0.05 | 40.4 ± 4.21 |
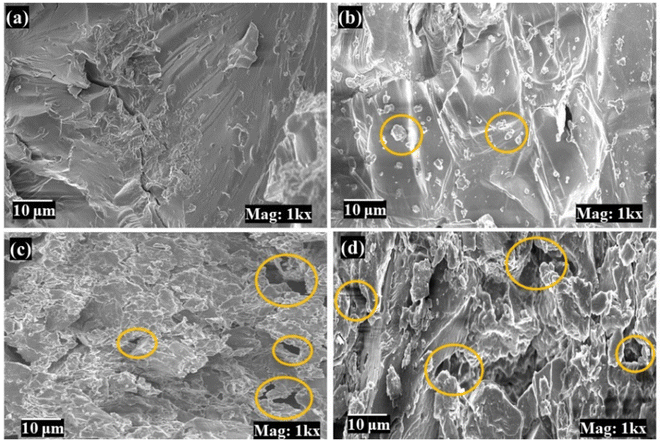
The reduction in tensile modulus with increasing WHF content (beyond 2 wt%) is attributed to the aggregation of WHF particles within the matrix and increased pore formation, as seen from SEM images (Fig. S1, ESI file†).10,11,19 The elongation at break (EB) value reflects the material's flexibility, with higher EB values indicating greater flexibility and lower EB values signifying reduced flexibility.25 For TW0, the EB value was the highest, but it decreased progressively as the filler content increased, indicating increased brittleness in the TW composites. With filler content rising from 0 to 2 wt%, the flexural strength and modulus of the TW composites improved by 98% and 42%, respectively (Table 1). However, adding a higher filler load to it, led to a sharp decline in both strength and modulus due to poor dispersion and reduced interaction of filler particles within the TPS matrix.24 Statistical analyses (p < 0.05) showed a significant varying filler loading on the mechanical properties of the composites. The Tukey HSD post hoc test revealed that the TW2 composite, with 2 wt% filler, exhibited significantly superior mechanical properties compared to the other TW composites. As a result, TW2 was identified as the most effective composite, demonstrating the highest mechanical strength. This optimized formulation highlights the critical role of fillers like WHF in overcoming the inherent limitations of TPS, such as low tensile strength and brittleness. By significantly enhancing the mechanical properties, TW2 broadens the applicability of TPS, making it a viable candidate for replacing single-use plastics in applications such as biodegradable packaging, disposable cutlery, and lightweight agricultural films, where strength and environmental sustainability are paramount.
3.3. FTIR analysis of WHF, TPS, and TW composite
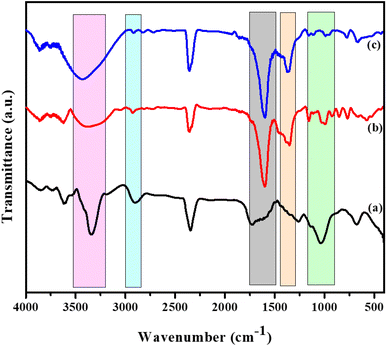
Fig. 3 displays the infrared spectra for WHF, TPS, and the optimized TW composite (TW2). Broadband around 3422 cm−1 indicates –OH stretching from free, inter-, and intra-molecular hydrogen-bonded hydroxyl groups in the TPS spectrum.29 The peaks at 2921 cm−1 and 1463 cm−1 correspond to C–H (–CH3) stretching and bending, respectively, while the band at 1625 cm−1 is attributed to –OH bending of water.30 The peak near 1724 cm−1 is associated with the >C![[double bond, length as m-dash]](https://www.rsc.org/images/entities/char_e001.gif) O bond stretching from ester groups in thermoplastic starch.16 For treated WHF, a broad peak at 3286 cm−1 is due to –OH stretching, primarily from the hydroxyl groups in cellulose and hemicellulose.11 Peaks at approximately 2925 cm−1 and 1744 cm−1 correspond to –CH stretching and –OH bending of water, respectively, characteristic of lignocellulosic components such as cellulose, hemicellulose, and lignin.16
O bond stretching from ester groups in thermoplastic starch.16 For treated WHF, a broad peak at 3286 cm−1 is due to –OH stretching, primarily from the hydroxyl groups in cellulose and hemicellulose.11 Peaks at approximately 2925 cm−1 and 1744 cm−1 correspond to –CH stretching and –OH bending of water, respectively, characteristic of lignocellulosic components such as cellulose, hemicellulose, and lignin.16
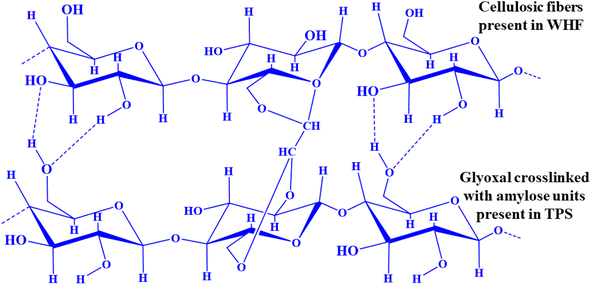
In the TW2 composite, notable shifts in peak positions were observed compared to the spectra of both TPS and WHF, indicating chemical interactions between the two components. For example, the –OH stretching peak shifted from 3422 cm−1 in TPS and 3286 cm−1 in WHF to 3418 cm−1 in the composite. This shift suggests the formation of new hydrogen bonds between the hydroxyl groups in TPS and those in WHF.19 During the extrusion process, the thermal and mechanical energy disrupted the original hydrogen bonds in TPS, enabling the reactive hydroxyl groups to interact with the hydroxyl groups present in WHF. Furthermore, the band at 1724 cm−1 in TPS, associated with –O–H bending, also exhibited a minor shift in the TW2 composite. This shift may result from dipole–dipole interactions occurring between the functional groups in TPS and WHF.5 Similarly, the –CH stretching peaks at 2921 cm−1 (TPS) and 2925 cm−1 (WHF) showed slight intensity variations and position changes in TW2, further supporting the occurrence of chemical interactions.16 These shifts and variations in peak intensities highlight the compatibility and chemical interaction between the filler (WHF) and the matrix (TPS). The strong interaction, primarily through hydrogen bonding, enhances the composite's integrity by creating a more cohesive interface between the components. This observation represents the role of FTIR in confirming the chemical interactions in the TW2 composite, demonstrating the successful blending of WHF and TPS into a single, well-bonded material.19Fig. 4 illustrates a possible chemical interaction between WHF and TPS.
3.4. Impact strength analysis
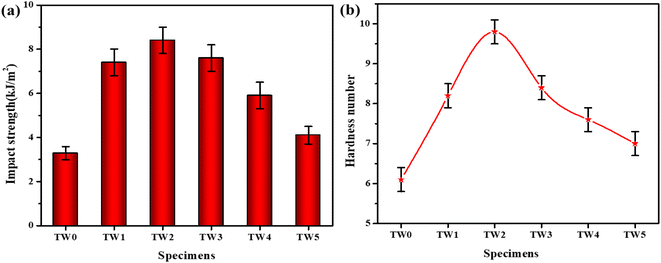
Impact strength reflects a material's capacity to resist sudden deformation and withstand rapid loads, making it vital for the practical application of composites. This property is influenced by filler type, size, matrix material, interfacial bonding, and specimen condition (notched or unnotched). As shown in Fig. 5(a), the study demonstrates varying impact strengths for TPS composites reinforced with water hyacinth fiber (WHF). Neat TPS (TW0) exhibits an impact strength of 3.28 kJ m−2, while the addition of 2 wt% WHF (TW2) significantly boosts the impact strength to 8.4 kJ m−2, attributed to strong filler-matrix bonding, confirmed by a p-value of less than 0.05 from a Tukey HSD test. However, further increases in WHF content reduce the impact strength, with the TW5 composite dropping to 4.1 kJ m−2, likely due to filler agglomeration, void formation, and increased brittleness.16 A similar trend in impact strength was reported by Cosse et al. (2023) for PLA-wood fiber composites, where excessive filler content led to reduced impact resistance. This was attributed to the aggregation of filler particles, which created stress concentration points and disrupted the matrix's ability to absorb and dissipate energy effectively. These observations align with the behavior of TW composites at higher WHF loadings.213.5. Hardness number analysis
The Vickers hardness values for TW composites are shown in Fig. 5(b), which measures a material's resistance to surface indentation, scratching, and localized plastic deformation. Hardness testing in composites helps evaluate the quality and uniformity of the matrix and is critical in determining the material's suitability for specific applications, optimizing its structural integrity. The TW2 composite recorded a hardness value of 9.8, likely due to strong crosslinking between WHF and the TPS matrix, while neat TPS (TW0) had the lowest value of 6.1. Other composites measured as follows: TW1 at 8.2, TW3 at 8.4, TW4 at 7.6, and TW5 at 7. The lower hardness value of TW0 indicates its surface is less resistant to localized deformation, which is also a feature of typical thermoplastic material. As WHF content increases beyond 2%, increased porosity reduces hardness.21 Statistical analysis (p < 0.05) confirmed a significant effect of varying filler loadings on the microhardness properties, with the Tukey HSD post-hoc test showing that TW2 had significantly better hardness compared to other TW composites.293.6. Moisture absorption experiment
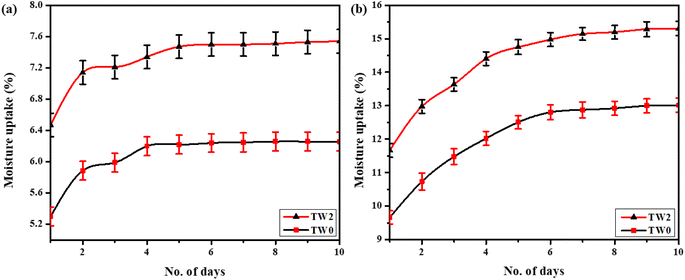
Fig. 6 shows the moisture absorption behavior of TW0 and TW2 composites over time. At 75% RH, the average maximum moisture uptake is 6.25% for TW0 and 7.54% for TW2, while at 90% RH, it increases to 13.01% and 15.30%, respectively. The hydrophilic nature of both WHF and the TPS matrix contributes to the increased moisture absorption, with TW2 exhibiting higher uptake due to the greater number of hydroxyl (–OH) groups, which enhance hydrophilicity. The increase in WHF content also leads to filler agglomeration and increased porosity, resulting in more voids within the composite.10,23 These voids, along with the composite's surface characteristics, as observed under the scanning electron microscope in Fig. S1 (ESI file),† further explain the higher moisture absorption in TW2. A similar type of hygroscopic behavior was reported by Zhang et al., (2023) for TPS composites, where the presence of voids and surface irregularities facilitated moisture uptake.15 This indicates that the structural features of the composite play a critical role in determining its moisture absorption capacity, aligning with the observed behavior in TW2. During the initial phase of absorption, moisture uptake increases proportionally with the square root of time (t1/2). Subsequently, this increase slows down and eventually stabilizes around the 4th or 5th day, indicating that the moisture uptake has reached equilibrium. The observed results consistently align with the predicted outcomes, as shown in Table 2, indicating that the materials follow Fickian diffusion behavior.24| Sample | 75% RH | 90% RH | ||
|---|---|---|---|---|
| M e (%) | D (10−6 mm2 s−1) | M e (%) | D (10−6 mm2 s−1) | |
| a M e = equilibrium moisture content, D = diffusion coefficient. | ||||
| TW0 | 7.54 | 1.16 | 15.30 | 1.55 |
| TW2 | 6.25 | 0.51 | 13.01 | 1.08 |
The TW2 composite displayed a higher diffusion coefficient under both experimental conditions, suggesting that moisture penetrated this composite more easily. This implies that TW2 absorbed moisture more significantly compared to TW0.24
3.7. Thermal analysis
In the thermal analysis (Fig. 7), TPS generally exhibited weight loss in distinct stages. The initial stage, observed at 120 °C, was attributed to moisture evaporation. The subsequent stage, beginning at 298 °C, was linked to the thermal degradation of the starch polymer, where substantial weight loss occurred due to the breakdown of the starch backbone (Fig. 7(a)). The DTG curve for pure TPS corresponded to the primary degradation temperature of starch at 298 °C (Fig. 7(d)).31 The TG and DTG curves of WHF (Fig. 7(b and e)) provided additional insight into its thermal behavior. WHF exhibited a distinct degradation stage at 248 °C, attributed to the decomposition of its primary organic components, such as hemicellulose and cellulose.5 This intermediate degradation temperature suggests that WHF partially degraded before the starch matrix. The presence of this degradation peak highlights the thermal behavior of WHF as a reinforcement material, which influences the overall thermal stability of the composite. When TPS was reinforced with 2 wt% WHF, notable shifts in the thermal decomposition temperatures were observed. The TG curve for the TW2 composite revealed enhanced thermal stability compared to pure TPS, with an increased decomposition temperature at 320 °C (Fig. 7(c)). This improvement suggests that the interaction between WHF and the starch matrix contributed to greater stability by forming a protective barrier, thereby delaying the degradation process. A similar enhancement in thermal stability was observed by Behera et al. (2022), where the addition of cellulose and soy pulp improved the thermal stability of neat TPS.16 In the case of the TW2 composite, the DTG curve further validated this by confirming the primary degradation temperature of starch at 320 °C (Fig. 7(f)).32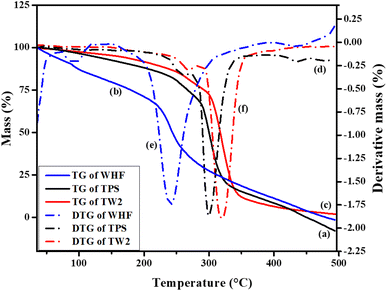 | ||
| Fig. 7 TG thermograms of (a) TPS, (b) WHF, (c) TW2, and DTG thermograms of (d) TPS, (e) WHF, (f) TW2. | ||
3.8. Biodegradation analysis of TW composites
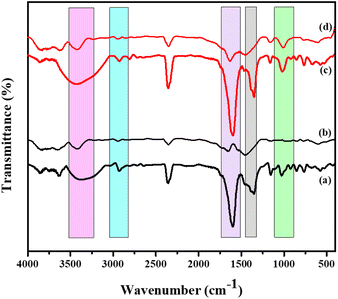
![[double bond, length as m-dash]](https://www.rsc.org/images/entities/char_e001.gif) O stretching and bending, which are related to the ester groups in the hemicellulose of WHF, disappeared after 60 days of composting, indicating that soil bacteria have degraded the hemicellulose.5
O stretching and bending, which are related to the ester groups in the hemicellulose of WHF, disappeared after 60 days of composting, indicating that soil bacteria have degraded the hemicellulose.5
3.9. Cytotoxicity analysis
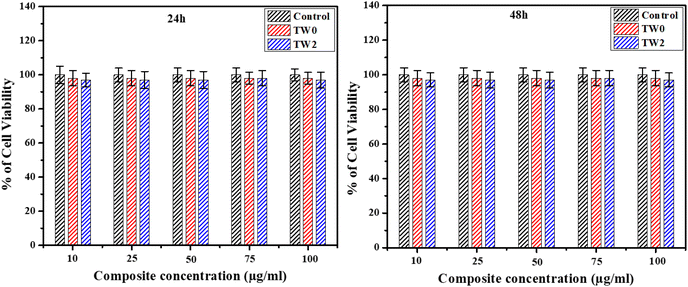
Cytotoxicity tests were performed on both neat TPS (TW0) and the 2 wt% water hyacinth fiber-reinforced composite (TW2), with the results shown in Fig. 11. Over 24 hours of cell culture, both composites exhibited nearly 100% cell viability at all tested concentrations, indicating that neither material adversely affected cell health. Even at the highest concentration of 100 μg mL−1, cell viability remained high, slightly reducing to 98% after 48 hours. This minor decrease suggests minimal cytotoxicity, likely due to the use of compatibilizers.33 In addition, cell morphology was observed to remain intact throughout the culture period, with no significant signs of morphological alterations or cytotoxic effects (Fig. S2, ESI file†). The fact that both composites maintained nearly complete cell viability after 24 hours strongly indicates that neither poses a significant toxic threat, supporting their safety for use in applications where biocompatibility is critical, such as in disposable products or food packaging materials.23,344. Conclusion
This investigation aimed to fabricate sophisticated biocomposites from thermoplastic starch, ingeniously incorporating water hyacinth short fiber as a bio-filler. The resulting composites, enhanced with a 2 wt% loading of water hyacinth fiber, demonstrated a remarkable 113% increment in tensile strength and a 98% augmentation in flexural strength. Also, the impact strength and hardness values followed the same trend. These substantial improvements are attributed to the enhanced interactions between the starch matrix and the filler, facilitated by hydrogen bonding, as verified through FTIR spectral analysis. The thermal resilience of the composites was affirmed via thermogravimetric analysis. Additionally, an escalation in WHF loading correspondingly heightened the moisture sorption capacity of the composites. Soil burial degradation studies underscored the eco-friendly nature of the developed composites. Also, cytotoxicity testing indicated that these composites are safe for use in disposable products and packaging materials, emphasizing their versatility and environmental sustainability. Despite these promising results, future research could explore the impact of higher filler loadings on mechanical and thermal performance, investigate alternative compatibilizers to further enhance matrix–filler interactions, and examine the scalability of these composites for industrial production, particularly in disposable cutlery.Data availability
The data that support that support the findings of this study are available from the corresponding author [Behera, A. K.] upon reasonable request.Author contributions
Diptiranjan Behera: investigation, writing – original draft, visualization, conceptualization. Shruti S. Pattnaik: editing – original draft, formal analysis, methodology, visualization. Shubhendu S. Patra: methodology, visualization. Aruna K. Barick: characterizations, Jyotsnarani Pradhan: formal analysis, and characterizations, Ajaya K. Behera: supervision, visualization, formal analysis, editing – original draft.Conflicts of interest
The authors declare no conflict of interest.Acknowledgements
We gratefully acknowledge CSIR-UGC, New Delhi, India under the CSIR-UGC NET JRF (ID-211610133707) fellowship scheme. We are also grateful to the Department of Chemistry, Utkal University, Odisha, for allowing the smooth conduct of experiments.References
- S. S. Pattnaik, D. Behera, N. Das, A. K. Dash and A. K. Behera, Fabrication and characterization of natural fiber reinforced cowpea resin-based green composites: an approach towards agro-waste valorization, RSC Adv., 2024, 14(35), 25728–25739, 10.1039/D4RA03546A.
- S. Dey, G. T. N. Veerendra, P. A. Babu, A. P. Manoj and K. Nagarjuna, Degradation of plastics waste and its effects on biological ecosystems: A scientific analysis and comprehensive review, Biomed. Mater. & Devices, 2024, 2(1), 70–112, DOI:10.1007/s44174-023-00085-w.
- D. Behera, S. S. Pattnaik, D. Nanda, P. P. Mishra, S. Manna and A. K. Behera, A review on bamboo fiber reinforced composites and their potential applications, Emergent Mater., 2024 DOI:10.1007/s42247-024-00832-9.
- A. Surendren, A. K. Mohanty, Q. Liu and M. Misra, A review of biodegradable thermoplastic starches, their blends and composites: Recent developments and opportunities for single-use plastic packaging alternatives, Green Chem., 2022, 24(22), 8606–8636, 10.1039/D2GC02169B.
- A. K. Behera, S. Avancha, R. Sen and B. Adhikari, Development and characterization of plasticized starch-based biocomposites with soy pulp as reinforcement filler, J. Appl. Polym. Sci., 2013, 127(6), 4681–4687, DOI:10.1002/app.38077.
- M. Y. Khalid, A. Al Rashid, Z. U. Arif, W. Ahmed, H. Arshad and A. A. Zaidi, Natural fiber reinforced composites: Sustainable materials for emerging applications, Results Eng., 2021, 11, 100263, DOI:10.1016/j.rineng.2021.100263.
- M. G. Dersseh, A. M. Melesse, S. A. Tilahun, M. Abate and D. C. Dagnew, Water hyacinth: review of its impacts on hydrology and ecosystem services—lessons for management of Lake Tana, Extreme Hydrology and Climate Variability, 2019, pp. 237–251, DOI:10.1016/B978-0-12-815998-9.00019-1.
- A. Arivendan, W. J. Jebas Thangiah, R. Das, D. Ahamad and G. K. Chithra, Effect of water hyacinth (Eichhornia crassipes) plant into water bodies and its composite materials for commercial applications, Proc. Inst. Mech. Eng., Part C, 2023, 237(22), 5381–5390, DOI:10.1177/09544062231166829.
- H. Elbasiouny, M. Darwesh, H. Elbeltagy, F. G. Abo-Alhamd, A. A. Amer, M. A. Elsegaiy, I. A. Khattab, E. A. Elsharawy, F. Ebehiry, H. El-Ramady and E. C. Brevik, Ecofriendly remediation technologies for wastewater contaminated with heavy metals with special focus on using water hyacinth and black tea wastes: a review, Environ. Monit. Assess., 2021, 193(7), 449, DOI:10.1007/s10661-021-09236-2.
- S. Sulardjaka, N. Iskandar, S. Nugroho, A. Alamsyah and M. Y. Prasetya, The characterization of unidirectional and woven water hyacinth fiber reinforced with epoxy resin composites, Heliyon, 2022, 8(9), e10484, DOI:10.1016/j.heliyon.2022.e10484.
- N. H. Sari, S. Suteja and Y. A. Sutaryono, The Mechanical Properties of a Water Hyacinth/Rice Husk Powders Composite for Tissue Engineering Applications, Fibers Polym. Compos., 2023, 2(2), 145–156 CrossRef . https://orcid.org/0000-0002-6601-8487.
- S. Parvin, A. Hossen, W. Rahman, I. Hossen, A. Halim, B. K. Biswas and A. S. Khan, Uptake hazardous dye from wastewater using water hyacinth as bio-adsorbent, Eur. J. Sustain. Dev. Res., 2019, 3(1), em0065, DOI:10.20897/ejosdr/3917.
- A. T. Huynh, Y. C. Chen and B. N. Tran, A small-scale study on removal of heavy metals from contaminated water using water hyacinth, Processes, 2021, 9(10), 1802, DOI:10.3390/pr9101802.
- A. K. Behera, Mechanical and biodegradation analysis of thermoplastic starch reinforced nano-biocomposites, IOP Conf. Ser. Mater. Sci. Eng., 2018, 410(1), 012001, DOI:10.1088/1757-899X/410/1/012001.
- J. Zhang, F. Zou, H. Tao, W. Gao, L. Guo, B. Cui, C. Yuan, P. Liu, L. Lu, Z. Wu and Y. Fang, Effects of different sources of cellulose on mechanical and barrier properties of thermoplastic sweet potato starch films, Ind. Crop. Prod., 2023, 194, 116358, DOI:10.1016/j.indcrop.2023.116358.
- A. K. Behera, S. Manna and N. Das, Effect of soy waste/cellulose on mechanical, water sorption, and biodegradation properties of thermoplastic starch composites, Starch Staerke, 2022, 74(1–2), 2100123, DOI:10.1002/star.202100123.
- B. Ayyanar, M. D. Dharshinii, K. Marimuthu, S. Akhil, T. Mugilan, C. Bharathiraj, S. Mavinkere Rangappa, A. Khan and S. Siengchin, Design, fabrication, and characterization of natural fillers loaded HDPE composites for domestic applications, Polym. Compos., 2022, 43(8), 5168–5178, DOI:10.1002/pc.26806.
- C. B. Ayyanar, K. Marimuthu, T. Mugilan, B. Gayathri, M. R. Sanjay, A. Khan and S. Siengchin, Novel Polyalthia Longifolia seed fillers loaded and E-glass fiber-reinforced sandwich epoxy composites, Proc. IME E J. Process Mech. Eng., 2024, 238(4), 1637–1646, DOI:10.1177/09544089231158453.
- A. K. Behera, R. Srivastava and A. B. Das, Mechanical and degradation properties of thermoplastic starch reinforced nanocomposites, Starch Staerke, 2022, 74(3–4), 2100270, DOI:10.1002/star.202100270.
- C. B. Ayyanar, K. Marimuthu, B. Gayathri, C. Bharathiraj, S. P. Mohan, P. Jagadeesh, S. M. Rangappa, A. Khan and S. Siengchin, Development of biocomposites from Samanea Saman Fillers reinforced with PLA, Biomass Conv. Bioref., 2024, 14(22), 28561–28570, DOI:10.1007/s13399-022-03410-3.
- R. L. Cosse, V. S. Voet, R. Folkersma and K. Loos, The effect of size and delignification on the mechanical properties of polylactic acid (PLA) biocomposites reinforced with wood fibres via extrusion, RSC Sustainability, 2023, 1(4), 876–885, 10.1039/D3SU00039G.
- M. Asrofi, H. Abral, A. Kasim, A. Pratoto, M. Mahardika and F. Hafizulhaq, Mechanical properties of a water hyacinth nanofiber cellulose reinforced thermoplastic starch bionanocomposite: Effect of ultrasonic vibration during processing, Fibers, 2018, 6(2), 40, DOI:10.3390/fib6020040.
- S. S. Pattnaik, D. Behera, P. Jali and A. K. Behera, Mechanical and biodegradation analysis under various environmental conditions of the waste vetiver root fiber reinforced soy composite, Polym. Int., 2024, 6664, DOI:10.1002/pi.6664.
- J. Rakowska, M. Węgrzyn and E. Rudnik, Impact of ionic liquids on absorption behaviour of natural fibers/biopolyethylene biocomposites, Sci. Rep., 2021, 11(1), 20483, DOI:10.1038/s41598-021-99956-9.
- A. K. Behera, S. S. Pattnaik, C. Mohanty, R. Srivastav and J. Pradhan, Mechanical and cytotoxic analysis of cutlery developed from phenol-formaldehyde modified soy-jute composite, Vietnam J. Chem., 2024, 62(2), 151–159, DOI:10.1002/vjch.202200162.
- D. Behera, S. S. Pattnaik, D. Nanda, P. Parhi and A. K. Behera, Renewable and sustainable waste coconut spathe fabric biocomposites: fabrication to characterization, Biomass Convers. Biorefin., 2024, 1–12, DOI:10.1007/s13399-024-06107-x.
- C. B. Ayyanar, K. Marimuthu, I. J. Das and C. Prakash, Investigation of coconut shell fillers loaded and pine apple fiber reinforced epoxy sandwich composites, J. Polym. Res., 2024, 31(12), 353, DOI:10.1007/s10965-024-04205-y.
- K. Olonisakin, M. Fan, Z. Xin-Xiang, L. Ran, W. Lin, W. Zhang and Y. Wenbin, Key improvements in interfacial adhesion and dispersion of fibers/fillers in polymer matrix composites; focus on pla matrix composites, Compos. Interfaces, 2022, 29(10), 1071–1120, DOI:10.1080/09276440.2021.1878441.
- K. Sun, F. Li, J. Li, J. Li, C. Zhang, M. Ji and Z. Guo, CaCO3 blowing agent mixing method for biomass composites improved buffer packaging performance, RSC Adv., 2021, 11(4), 2501–2511, 10.1039/D0RA06477G.
- M. M. Altayan, T. Al Darouich and F. Karabet, Thermoplastic starch from corn and wheat: a comparative study based on amylose content, Polym. Bull., 2021, 78, 3131–3147, DOI:10.1007/s00289-020-03262-9.
- S. X. Drakopoulos, O. Vryonis, Z. Špitalský, H. Peidayesh and L. Lendvai, Thermoplastic Starch Processed under Various Manufacturing Conditions: Thermal and Electrical Properties, Biomacromolecules, 2024, 4c00602, DOI:10.1021/acs.biomac.4c00602.
- M. P. Harikrishnan, R. Raghunathan, A. S. Warrier, M. Basil, S. K. Sahoo, R. Pandiselvam, T. Venkatesh, S. Pillai, P. Kundu and A. Kothakota, Reinforced water hyacinth based biodegradable cutlery: Green alternative to single-use plastics, Food Packag. Shelf Life, 2023, 40, 101211, DOI:10.1016/j.fpsl.2023.101211.
- S. Grabska-Zielińska, Cross-Linking Agents in Three-Component Materials Dedicated to Biomedical Applications: A Review, Polymers, 2024, 16(18), 2679, DOI:10.3390/polym16182679.
- C. B. Ayyanar and K. Marimuthu, Investigation on the morphology, thermal properties, and in vitro cytotoxicity of the fish scale particulates filled high-density polyethylene composite, Polym. Polym. Compos., 2020, 28(4), 285–296, DOI:10.1177/0967391119872877.
Footnote |
| † Electronic supplementary information (ESI) available. See DOI: https://doi.org/10.1039/d4su00803k |
| This journal is © The Royal Society of Chemistry 2025 |

