Fabrication and electrochemical evaluation of flexible spinel CdMn2O4 carbon nanofibers for advanced supercapacitor applications†
Akashkumar P.
Patel
 a,
Deep S.
Sharma
a,
Sanjay N.
Bariya
b,
Yash G.
Kapdi
a,
Deep S.
Sharma
a,
Sanjay N.
Bariya
b,
Yash G.
Kapdi
 b,
Jaydip D.
Solanki
c,
Saurabh S.
Soni
 b,
Vaibhav K.
Patel
*ad and
Sanjay H.
Panjabi
 *a
*a
aDepartment of Chemical Sciences, P D Patel Institute of Applied Sciences, Charotar University of Science and Technology, Changa-388421, Gujarat, India. E-mail: sanjaypanjabi_27@yahoo.co.in; vaibhav272@yahoo.co.in
bDepartment of Chemistry, Sardar Patel University, Vallabh Vidyanagar-388120, Gujarat, India
cDepartment of Applied and Interdisciplinary Sciences (IICISST), Sardar Patel University, Vallabh Vidyanagar 388120, Gujarat, India
dThe Charutar Vidya Mandal (CVM) University, Anand-388120, Gujarat, India
First published on 25th November 2024
Abstract
Manganese-based oxides, known for their favourable electrochemical properties, can potentially be electrode materials for energy storage applications. However, poor electrical conductivity and stability hinder their practical use. To overcome these limitations, we report the successful synthesis of one-dimensional (1D) porous CdMn2O4 carbon nanofiber composites via electrospinning and subsequent carbonization. The unique structure promotes charge transfer and protects CdMn2O4 from degradation, while the 1D porous architecture enhances ion diffusion and prevents structural collapse during charge–discharge cycles. As a result, the synthesized CdMn2O4 carbon nanofiber composites exhibit excellent capacitive performance and robust cycling stability. To evaluate their performance, electrochemical tests conducted in a three-electrode system using 1 M H2SO4 and 6 M KOH solutions revealed superior performance and stability in the acidic medium. A flexible symmetrical supercapacitor device constructed from the carbon nanofibers exhibited a specific capacitance of 570.57 F g−1 at a current density of 1 A g−1 in 1 M H2SO4 and retained 88.57% of its capacitance after 12![[thin space (1/6-em)]](https://www.rsc.org/images/entities/char_2009.gif) 000 cycles, underscoring its excellent durability. These results emphasize the effectiveness of spinel CdMn2O4 carbon nanofibers in energy storage systems, particularly in acidic environments, and pave the way for their potential use in next-generation supercapacitors.
000 cycles, underscoring its excellent durability. These results emphasize the effectiveness of spinel CdMn2O4 carbon nanofibers in energy storage systems, particularly in acidic environments, and pave the way for their potential use in next-generation supercapacitors.
Introduction
In recent years, there has been an escalating demand for wearable, flexible, and portable electronic and optoelectronic devices. These advanced technologies require materials that offer high energy density and demonstrate long-term durability. Electrochemical devices encounter numerous challenges in meeting these requirements, particularly in energy storage and electrical applications. Supercapacitors have emerged as promising candidates for energy storage due to their inherent safety, high theoretical power density, rapid charge–discharge cycles, and extended lifespan compared to conventional batteries and fuel cells.1,2 Supercapacitors find applications across a broad spectrum, including electric vehicles, power backup systems, pacemakers, defibrillators, and wind turbines.3,4 Most commercial supercapacitors utilize high surface area carbon-based electrode materials, which rely on electric double-layer capacitance (EDLC) mechanisms.3,5 While EDLCs offer excellent power density, they often fall short in energy density and exhibit decreased specific capacitance at high current densities. To overcome these limitations, pseudocapacitors have been explored for their ability to store charge through reversible and rapid surface Faraday redox reactions. The practical challenge lies in developing pseudocapacitors that can achieve high specific capacitance while maintaining stability and flexibility.5Transition metal oxides have garnered significant interest due to their diverse oxidation states, enabling reversible redox reactions.6,7 Bimetallic oxides, in particular, exhibit enhanced electrochemical performance compared to their single-metal counterparts. They are increasingly researched for their reversible redox capabilities, cost-effectiveness, low toxicity, multiple oxidation states, and improved electrical conductivity.8 Various bimetallic oxides, such as FeCo2O4, ZnCo2O4, NiMn2O4, and CuCo2O4, have been explored as promising electrode materials for supercapacitors.9–16 Manganese-based oxides have emerged as particularly attractive candidates for supercapacitor applications. Manganese-based oxides offer several advantages, including versatile oxidation states of manganese, economic viability, non-toxicity, abundant availability, and favourable environmental compatibility. Cadmium-based nanomaterials have demonstrated promising potential for energy storage devices due to their high electrical conductivity, specific capacitance, and charge storage capabilities. Cadmium-based electrodes have shown high electrochemical stability and fast charge transfer, making them well-suited for supercapacitor applications.17–19 Nanostructured metal oxide semiconductors, including CdO, have gained interest for various applications; however, CdO has received less attention due to its narrow band gap of 2.4 eV. Despite this, CdO is a common n-type transparent conducting oxide with high mobility (130 cm2 V−1 s−1) and density (8150 kg m−3), and it shows good transparency in the visible region. It has potential applications in optoelectronic devices, gas sensors, and catalysts.17–20 However, these materials typically suffer from poor electrical conductivity, leading to increased impedance in charge transfer and prolonged diffusion times. Consequently, their charge–discharge capacity and capacitance are often diminished.21,22 To mitigate these challenges, considerable attention has been directed toward integrating transition-metal oxides with nanostructured carbon materials. This approach aims to enhance electrode conductivity, thereby improving rate performance and cycling stability.
One-dimensional (1D) nanostructures, encompassing nanowires, nanorods, and nanofibers, have garnered considerable attention owing to their unique characteristics, prominently their high surface area-to-volume ratio, among other nanostructures.23–25 This attribute arises from their nanoscale dimensions, which directly influence their chemical, physical, mechanical, electrical conductivity, and optical properties. These attributes render them highly suitable for various electrochemical energy storage applications, including fuel cells, supercapacitors, and batteries. Synthetic routes for 1D nanomaterials encompass electrospinning, gas-phase, solution-phase, and template-assisted methods, offering diverse production techniques.26 Electrospinning stands out as a method for producing uniform and diverse nanofibers (NFs).25,27,28 It involves extruding a precursor solution through a spinneret, forming a Taylor cone, and stretching it to produce NFs.29–31 These NFs offer advantages such as long lengths, robust mechanical strength, and efficient electron transport.25,27,28 They are flexible and amenable to modifications with defects or active materials, suitable for both laboratory-scale and industrial-scale production as free-standing electrodes. Post-electrospinning treatments, including heat treatment, chemical modification, or surface coating, further enhance the properties of these NFs.24–27
This study focuses on the design and synthesis of flexible spinel CdMn2O4 CNFs through electrospinning followed by carbonization. These CNFs are utilized as free-standing, flexible solid-state devices. We assessed the stability and performance of these flexible spinel CdMn2O4 CNFs in both acidic and alkaline aqueous electrolytes, using 1 M H2SO4 and 6 M KOH as representative environments. The results demonstrate that the CNFs exhibit exceptional electrochemical stability and maintain high capacitance under acidic and alkaline conditions. This underscores their robustness and versatility, positioning them as promising candidates for various electrochemical applications.
Experimental
Materials
Polyacrylonitrile (Mw = 150![[thin space (1/6-em)]](https://www.rsc.org/images/entities/char_2009.gif) 000 g mol−1) and N,N-dimethylformamide (DMF) were purchased from Aldrich Chemical Private Limited. Cd(NO3)2·4H2O and Mn(NO3)2·4H2O were provided by Thermo Fisher Scientific India Pvt. Ltd. Poly(vinyl alcohol) was purchased from Sigma-Aldrich. It is 87–90% hydrolyzed and has an average molecular weight of 30
000 g mol−1) and N,N-dimethylformamide (DMF) were purchased from Aldrich Chemical Private Limited. Cd(NO3)2·4H2O and Mn(NO3)2·4H2O were provided by Thermo Fisher Scientific India Pvt. Ltd. Poly(vinyl alcohol) was purchased from Sigma-Aldrich. It is 87–90% hydrolyzed and has an average molecular weight of 30![[thin space (1/6-em)]](https://www.rsc.org/images/entities/char_2009.gif) 000–70
000–70![[thin space (1/6-em)]](https://www.rsc.org/images/entities/char_2009.gif) 000 g mol−1. A needle with a size of 19 G and a syringe were purchased from Dispovan.
000 g mol−1. A needle with a size of 19 G and a syringe were purchased from Dispovan.
Preparation of CdMn2O4 carbon nanofibers
The synthesis of flexible spinel CdMn2O4 CNFs involved several meticulous steps. Initially, a polymer solution was prepared by dissolving 0.6 g of polyacrylonitrile (PAN) in 10 mL of dimethylformamide (DMF), ensuring thorough dissolution through overnight stirring. Subsequently, cadmium(II) nitrate tetrahydrate and manganese(II) nitrate tetrahydrate precursors were added to the PAN solution in mole ratios of 1![[thin space (1/6-em)]](https://www.rsc.org/images/entities/char_2009.gif) :
:![[thin space (1/6-em)]](https://www.rsc.org/images/entities/char_2009.gif) 1 (CMO-1) and 1
1 (CMO-1) and 1![[thin space (1/6-em)]](https://www.rsc.org/images/entities/char_2009.gif) :
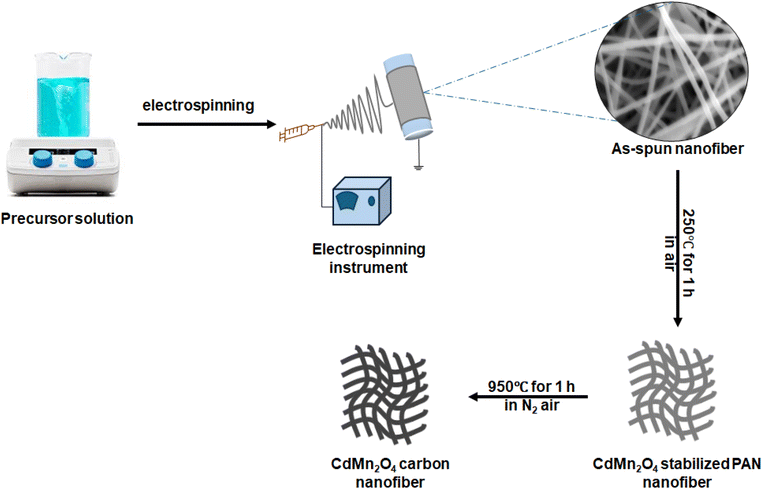
:![[thin space (1/6-em)]](https://www.rsc.org/images/entities/char_2009.gif) 2 (CMO-2), respectively. Specifically, for CMO-1, 0.308 g of cadmium(II) nitrate tetrahydrate and 0.251 g of manganese(II) nitrate tetrahydrate were used, while for CMO-2, 0.308 g of cadmium(II) nitrate tetrahydrate and 0.502 g of manganese(II) nitrate tetrahydrate were employed. The mixture was stirred until a homogeneous solution was loaded into a 6 mL syringe. The electrospinning process commenced by feeding the precursor solution through a needle at a controlled rate of 0.3 mL h−1 under an electric field of 11.3 kV. During the electrospinning process, the humidity was maintained at 32–34%, and the chamber temperature was kept at room temperature to ensure optimal fiber formation. A rotating drum, covered with aluminium foil and positioned 18 cm from the needle, facilitated the collection of NF sheets. These NF sheets were carefully peeled from the aluminium foil after collection. Following electrospinning, the NF sheets underwent thermal stabilization at 250 °C in an oven, followed by annealing in a tubular furnace at 950 °C for 2 hours under a nitrogen atmosphere, with a heating rate of 4.16 °C per minute. This controlled thermal treatment process led to the formation of CMO-1 and CMO-2 CNFs, which were directly utilized as electrodes. Scheme 1 illustrates the synthesis procedure for the flexible CdMn2O4 CNFs, demonstrating a methodical approach to achieving a nanoscale structure that is suitable for advanced electrochemical applications.
2 (CMO-2), respectively. Specifically, for CMO-1, 0.308 g of cadmium(II) nitrate tetrahydrate and 0.251 g of manganese(II) nitrate tetrahydrate were used, while for CMO-2, 0.308 g of cadmium(II) nitrate tetrahydrate and 0.502 g of manganese(II) nitrate tetrahydrate were employed. The mixture was stirred until a homogeneous solution was loaded into a 6 mL syringe. The electrospinning process commenced by feeding the precursor solution through a needle at a controlled rate of 0.3 mL h−1 under an electric field of 11.3 kV. During the electrospinning process, the humidity was maintained at 32–34%, and the chamber temperature was kept at room temperature to ensure optimal fiber formation. A rotating drum, covered with aluminium foil and positioned 18 cm from the needle, facilitated the collection of NF sheets. These NF sheets were carefully peeled from the aluminium foil after collection. Following electrospinning, the NF sheets underwent thermal stabilization at 250 °C in an oven, followed by annealing in a tubular furnace at 950 °C for 2 hours under a nitrogen atmosphere, with a heating rate of 4.16 °C per minute. This controlled thermal treatment process led to the formation of CMO-1 and CMO-2 CNFs, which were directly utilized as electrodes. Scheme 1 illustrates the synthesis procedure for the flexible CdMn2O4 CNFs, demonstrating a methodical approach to achieving a nanoscale structure that is suitable for advanced electrochemical applications.
Gel electrolyte and device preparation
For the preparation of PVA/H2SO4 gel, 1 g of polyvinyl alcohol (PVA) was dissolved in 8 mL of distilled water heated to 90 °C with continuous stirring. Subsequently, 1.2 mL of H2SO4 was added to the PVA solution, and stirring was continued until a homogeneous and transparent gel electrolyte formed.32To assemble the symmetrical solid-state supercapacitor (SSC), the synthesized NF sheet was cut into two electrodes of equal size (2 cm × 1 cm). Each electrode, with a mass of approximately 0.4 mg, was immersed in PVA gel for 5 minutes, ensuring partial exposure of the electrode surfaces. A cellulose separator, saturated with PVA gel electrolyte, was placed between the electrodes to prevent direct contact. Thin striped copper foil was used as the current collector. Copper foil with deionized water to remove any surface impurities, followed by rinsing with ethanol to ensure thorough cleaning. The foil was then dried in an oven at 60 °C for 30 minutes to remove any residual moisture before use. The electrodes and Cu foil, separated by the cellulose separator, were then pressed together and encapsulated within a laminating sheet. The active region of the device, where the electrodes overlap, measures 1 cm2. Using the same procedure, three series of SSCs were fabricated. The electrochemical characterization data of the SSCs are provided in the ESI.†
Material characterization
Scanning electron microscopy (SEM, LEO S-440i) was employed to analyze the surface morphology of the spinal CdMn2O4 CNFs. X-ray powder diffractometry (XRD, Bruker) was used to assess the formation of spinal CdMn2O4 within the CNFs. XRD spectra were recorded over a 2θ range of 10° to 70°, with a step size of 0.10 and a scan speed of 2.7 s per step. The XRD analysis was conducted with a 40 kV and 30 mA setup. The crystalline behaviour and morphology of the CdMn2O4 NPs within the CNFs were investigated using Field Emission Gun Transmission Electron Microscopy (HRTEM, Talos, F200i S). This technique generated high-resolution images that comprehensively examined the nanocrystalline structure. Furthermore, Fourier Transform Infrared Spectroscopy (FTIR, Thermo, Nicolet-6700) was employed to record the infrared spectra within the 400 to 4000 cm−1 range, which facilitated the investigation of the molecular structure and conversion of CdMn2O4 CNFs. Raman spectroscopy was performed using an HR-800 Horiba Jobin Yvon micro-Raman spectrometer to investigate the vibrational modes of the CNFs and confirm the formation of the spinel structure. The thermal stability was evaluated using a thermogravimetric analyzer (Mettler-Toledo TGA/DSC-1) in a nitrogen gas atmosphere, with a heating rate of 10 °C per minute over a temperature range of 50 °C to 1000 °C. Subsequently, the elemental composition and chemical states of the film were assessed using an X-ray photoelectron spectrometer (ESCA System, SPECS GmbH) that employed Al Kα radiation with an energy of 1486.6 eV. Energy Dispersive X-ray (EDX) mapping was performed using a JEOL model JSM7100F to examine the elemental distribution and confirm the uniformity of cadmium and manganese within the CNFs. Inductively Coupled Plasma Optical Emission Spectroscopy (ICPOES) was carried out using a Thermo Scientific iCAP7200 Radial to determine the elemental composition and verify the presence of cadmium and manganese in the CNFs. Brunauer–Emmett–Teller (BET) surface area analysis was conducted using a Micromeritics ASAP 2010 to determine the specific surface area and pore size distribution of the CdMn2O4 CNFs. Tensile strength measurements were carried out using a TINIUS OLSEN/L-Series H50KL to evaluate the mechanical properties of the CdMn2O4 CNFs. The wettability of the CdMn2O4 carbon nanofibers was analyzed using a LAB line (Ramehart) contact angle goniometer.Computational details
Molecular dynamics (MD) simulations were performed to study ion diffusion in CdMn2O4 CNFs, pure CdMn2O4, and pure MnO2 structures using the Forcite module in BIOVIA Materials Studio 2017.33 The Perdew–Burke–Ernzerhof (PBE) functional within the generalized gradient approximation (GGA) was applied to optimize the transition metal oxide structures. Geometry optimization and annealing were carried out prior to running the MD simulations. The MD simulations employed both NVT (constant volume and temperature) and NPT (constant pressure and temperature) ensembles, depending on the simulation conditions. The simulations were conducted at 300 K to approximate realistic conditions, with a time step of 1 femtosecond (fs) and a total simulation time of 50 picoseconds (ps). For the NVT ensemble, a simulation length of 5000 ps was used, and the simulations were performed with Fine precision settings. The Mean Square Displacement (MSD) was calculated using Forcite analysis, and the diffusion coefficients were obtained from the slope of the MSD plot.34Results and discussion
Morphological and structural analysis
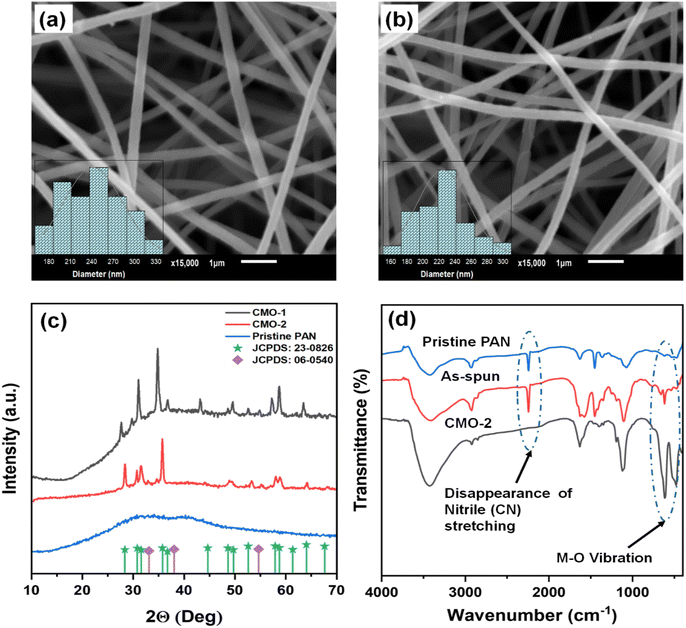
The incorporation of CdMn2O4 NPs into CNFs was successfully achieved via electrospinning, followed by annealing. Fig. S2† presents digital images of the CdMn2O4 CNFs, demonstrating their ability to bend without splitting or cracking, indicative of excellent mechanical flexibility. Scanning Electron Microscope (SEM) images in Fig. 1(a and b) reveal a uniform distribution of the CdMn2O4 CNFs (CMO-1 and CMO-2). The insets indicate that the average diameter of the CMO-1 CNFs is 252 nm, whereas for the CMO-2 CNFs, it is 224 nm. Fig. S1† presents cross-sections of CMO-1 and CMO-2. The thickness of CMO-1 is approximately 67 μm, whereas CMO-2 has a thickness of around 88 μm.XRD analysis was conducted to confirm the formation of the CdMn2O4 NPs within the CNFs. The XRD patterns are depicted in Fig. 1(c), where the broad diffraction hump observed around 25.8° corresponds to the (002) graphitic carbon plane of the CNFs.35 Distinctive diffraction peaks are evident at 28.01°, 30.50°, 31.17°, 35.34°, 48.70°, 52.74°, 57.71°, 58.26°, and 63.66°, corresponding to the (112), (200), (103), (211), (105), (312), (321), (224), and (400) facets, respectively, of tetragonal spinel CdMn2O4 CNFs (CMO-1 and 2, JCPDS: 23-0826).36 The inter-planar distances (d) derived from these XRD peaks are 0.3149, 0.2908, 0.2846, 0.2514, 0.1871, 0.17220, 0.1591, 0.1574, and 0.1453 nm. Furthermore, analysis indicates that when the metal precursors are in a 1![[thin space (1/6-em)]](https://www.rsc.org/images/entities/char_2009.gif) :
:![[thin space (1/6-em)]](https://www.rsc.org/images/entities/char_2009.gif) 1 molar ratio (CMO-1), cubic CdO is formed, as evidenced by crystalline peaks at 33.09°, 38.05°, and 55.04°, corresponding to the (111), (200), and (220) planes, respectively (JCPDS: 06-0540).37 The inter-planar distances (d) obtained from these XRD lines are 0.2711, 0.2347, and 0.1661 nm. The average crystallite size of the CdMn2O4 NPs embedded within the CNFs was determined using Scherrer's equation as follows:38
1 molar ratio (CMO-1), cubic CdO is formed, as evidenced by crystalline peaks at 33.09°, 38.05°, and 55.04°, corresponding to the (111), (200), and (220) planes, respectively (JCPDS: 06-0540).37 The inter-planar distances (d) obtained from these XRD lines are 0.2711, 0.2347, and 0.1661 nm. The average crystallite size of the CdMn2O4 NPs embedded within the CNFs was determined using Scherrer's equation as follows:38
 | (1) |
The Fourier-transform infrared (FTIR) spectrum of CdMn2O4 CNFs was analyzed over the wavenumber range of 400–4000 cm−1 to identify various functional groups present in the nanofibrous material (Fig. 1(d)). The spectrum for spinel CdMn2O4 CNFs displays prominent bands at 630 and 479 cm−1, indicative of metal–oxygen vibrations. A bending vibration at 1450 cm−1 corresponds to the C–H bending of PAN, while the stretching vibration at 1109 cm−1 is attributed to C–C stretching. The stretching and deformation vibration modes of H2O are represented by peaks at 3427 cm−1 and 1570 cm−1, respectively. Additionally, the peak at 1632 cm−1 corresponds to C![[double bond, length as m-dash]](https://www.rsc.org/images/entities/char_e001.gif) C stretching. Notably, the peak associated with the nitrile (C
C stretching. Notably, the peak associated with the nitrile (C![[triple bond, length as m-dash]](https://www.rsc.org/images/entities/char_e002.gif) N) stretching vibration, typically observed around 2248 cm−1, has disappeared, indicating the removal of the nitrile group during the conversion of PAN to CNFs.39 Furthermore, the vibration band at 2924 cm−1 is associated with the stretching frequency of the C–H vibrations in alkyl groups. This comprehensive FTIR analysis confirms the successful formation of spinel CdMn2O4 within the CNFs and the structural changes that occur during the conversion process.
N) stretching vibration, typically observed around 2248 cm−1, has disappeared, indicating the removal of the nitrile group during the conversion of PAN to CNFs.39 Furthermore, the vibration band at 2924 cm−1 is associated with the stretching frequency of the C–H vibrations in alkyl groups. This comprehensive FTIR analysis confirms the successful formation of spinel CdMn2O4 within the CNFs and the structural changes that occur during the conversion process.
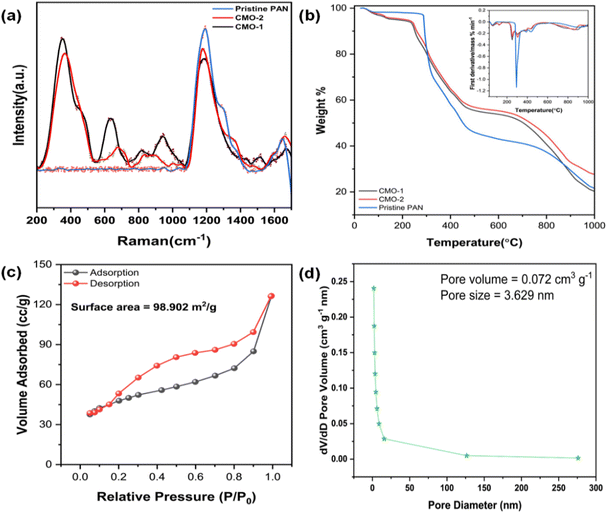
The Raman spectra of CdMn2O4 carbon nanofibers (CMO-1 and CMO-2), presented in Fig. 3(a), exhibit distinct vibrational features that correspond to both the spinel CdMn2O4 phase and the carbon nanofiber matrix. Notable peaks are observed around 365 cm−1 (Mn–O stretching in tetrahedral sites) and 460 cm−1 (Mn–O–Mn bending in octahedral sites), common to both samples.40 The prominent peak between 630 and 670 cm−1, assigned to the A1g mode of symmetric Mn–O stretching, is sharper and slightly red-shifted in CMO-1, indicating greater crystallinity and lattice expansion, likely due to higher sintering temperatures and the influence of Cd2+ ions. Peaks at 950 cm−1 and 904 cm−1 correspond to the presence of CdO and CdMn2O4, respectively.41 The formation of CdO as a secondary phase could induce slight distortions in the Mn–O bond vibrations. The carbon nanofiber matrix contributes to the observed G band (1587–1600 cm−1, representing sp2-hybridized carbon) and D band (1345–1350 cm−1, representing defects or disordered sp2 carbon).42,43 The higher intensity ratio (ID/IG) observed in CMO-1 reflects increased disorder within the carbon matrix, likely due to the interaction between the carbon nanofibers and residual CdO, as well as the higher sintering temperatures applied during synthesis. Additionally, the D′ band, located between 1503 and 1534 cm−1 in both samples, is associated with amorphous sp2-bonded carbon or interstitial defects, further highlighting structural defects in the carbon network.44 These results demonstrate the critical role of the carbon nanofiber matrix in enhancing flexibility and mechanical strength, while the interaction between the oxide phases and the carbon matrix influences the electrochemical properties of the composite material.
High-resolution transmission electron microscopy (HR-TEM) was employed to investigate the crystalline nature of CdMn2O4 NPs. Fig. 2(a and b) present low-magnification and high-magnification images of CMO-2, revealing well-dispersed CdMn2O4 NPs with minimal agglomeration within the CNFs. In Fig. 2(c), distinct lattice fringes are observed, indicating a highly ordered atomic arrangement within the CdMn2O4 NPs. These fringes correspond to specific crystallographic planes, notably the (211) plane, with an interplanar spacing of ∼0.25 nm. These findings are consistent with the values obtained from X-ray analysis, confirming the crystalline behaviour of the CdMn2O4 NPs.
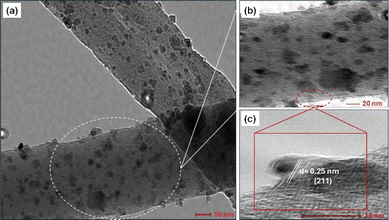 | ||
| Fig. 2 (a) TEM image (low-magnification), (b) HR-TEM image (high-magnification) and (c) fringe pattern of CdMn2O4 CNFs. | ||
Fig. 3(b) presents TGA of pristine PAN and CdMn2O4 carbon nanofibers with a 1![[thin space (1/6-em)]](https://www.rsc.org/images/entities/char_2009.gif) :
:![[thin space (1/6-em)]](https://www.rsc.org/images/entities/char_2009.gif) 1 mole ratio (CMO-1) and a 1
1 mole ratio (CMO-1) and a 1![[thin space (1/6-em)]](https://www.rsc.org/images/entities/char_2009.gif) :
:![[thin space (1/6-em)]](https://www.rsc.org/images/entities/char_2009.gif) 2 mole ratio (CMO-2), with the inset showing their respective derivative (DTG) curves. TGA was conducted to assess the thermal stability of the flexible CdMn2O4 CNFs. The TGA analysis was performed in a nitrogen atmosphere using a gradient heating mode, where the temperature range was from 25 to 150 °C at a rate of 10 °C min−1, 150 to 400 °C at 5 °C min−1, and 400 to 1000 °C at 10 °C min−1. The TGA curves reveal a multi-stage decomposition process for all samples. The TGA profile for pristine PAN shows a two-step pyrolysis process. The first stage occurs between 290 °C and 370 °C, resulting in a residual mass of approximately 66%, primarily due to the preoxidation and cyclization of nitrile groups in the PAN polymer chain.45–47 The second stage, from 400 °C to 650 °C, corresponds to the decomposition of PAN, leaving a residue of about 46%. Upon further heating to 950 °C, the material stabilizes with a residual mass of around 30%. For the CdMn2O4 CNFs, the degradation process occurs in three main stages. The first phase, between 190 °C and 275 °C, results in a residual mass of approximately 90%, attributed to the breakdown of metal precursors. The second stage, from 280 °C to 450 °C, shows consistent weight loss due to the formation of metal oxides (residual mass: approximately 70%). The third stage, occurring between 460 °C and 700 °C, involves the carbonization of PAN, characterized by dehydrogenation and denitrogenation processes that form a cyclic carbon structure (residual mass: approximately 50%). When the temperature reaches 950 °C, the material stabilizes with the formation of CdMn2O4 nanoparticles, resulting in a stable residual mass of around 34%.
2 mole ratio (CMO-2), with the inset showing their respective derivative (DTG) curves. TGA was conducted to assess the thermal stability of the flexible CdMn2O4 CNFs. The TGA analysis was performed in a nitrogen atmosphere using a gradient heating mode, where the temperature range was from 25 to 150 °C at a rate of 10 °C min−1, 150 to 400 °C at 5 °C min−1, and 400 to 1000 °C at 10 °C min−1. The TGA curves reveal a multi-stage decomposition process for all samples. The TGA profile for pristine PAN shows a two-step pyrolysis process. The first stage occurs between 290 °C and 370 °C, resulting in a residual mass of approximately 66%, primarily due to the preoxidation and cyclization of nitrile groups in the PAN polymer chain.45–47 The second stage, from 400 °C to 650 °C, corresponds to the decomposition of PAN, leaving a residue of about 46%. Upon further heating to 950 °C, the material stabilizes with a residual mass of around 30%. For the CdMn2O4 CNFs, the degradation process occurs in three main stages. The first phase, between 190 °C and 275 °C, results in a residual mass of approximately 90%, attributed to the breakdown of metal precursors. The second stage, from 280 °C to 450 °C, shows consistent weight loss due to the formation of metal oxides (residual mass: approximately 70%). The third stage, occurring between 460 °C and 700 °C, involves the carbonization of PAN, characterized by dehydrogenation and denitrogenation processes that form a cyclic carbon structure (residual mass: approximately 50%). When the temperature reaches 950 °C, the material stabilizes with the formation of CdMn2O4 nanoparticles, resulting in a stable residual mass of around 34%.
X-ray photoelectron spectroscopy (XPS) was employed to analyze the surface chemical composition and bonding states of the synthesized CdMn2O4 CNFs. The XPS survey scan, depicted in Fig. 4(a), confirms the presence of Cd, Mn, O, C, and N elements in the material. The atomic percentages obtained from XPS analysis show that the Mn content is 4.23% and the Cd content is 2.39%, while O, N, and C account for 14.56%, 9.01%, and 69.81%, respectively. These values indicate the successful formation of CdMn2O4 on the surface of the nanofibers. The C 1s spectrum reveals three distinct peaks at binding energies of 284.89 eV, 285.9 eV, and 287.33 eV, corresponding to sp2 C bonds, sp3 C bonds, and C![[double bond, length as m-dash]](https://www.rsc.org/images/entities/char_e001.gif) N/C–O bonds, respectively. Additionally, these peaks indicate the presence of C–N/C
N/C–O bonds, respectively. Additionally, these peaks indicate the presence of C–N/C![[double bond, length as m-dash]](https://www.rsc.org/images/entities/char_e001.gif) O bonds.48 The Mn 2p spectrum shows two characteristic spin–orbit peaks at binding energies of 641.2 eV and 652.8 eV, corresponding to the Mn 2p3/2 and Mn 2p1/2 orbitals, respectively. These peaks indicate the presence of Mn3+ and Mn4+ oxidation states.49 The Cd 3d spectrum of the CdMn2O4 phase displays two prominent peaks at 405.01 eV and 410.02 eV, corresponding to the Cd 3d5/2 and Cd 3d3/2 orbitals, confirming the presence of Cd2+ in a bivalent oxidation state. The O 1s spectrum reveals multiple peaks: the O1 peak at 528.63 eV is attributed to metal–oxygen bonds, the O2 peak at 530.28 eV corresponds to surface-adsorbed oxygen, and the O3 peak at 532.36 eV suggests the presence of surface-adsorbed water and low oxygen coordination at specific defect sites within the material.50 The N 1s spectrum also identifies nitrogen in three forms: pyridinic-N, pyrrolic-N, and graphitic-N, observed at binding energies of 398.2 eV, 400.4 eV, and 401.6 eV, respectively.51 The N-doping in the carbon structure is significant as it alters the electron structure and introduces more active defects, which enhance electron and ion diffusion.
O bonds.48 The Mn 2p spectrum shows two characteristic spin–orbit peaks at binding energies of 641.2 eV and 652.8 eV, corresponding to the Mn 2p3/2 and Mn 2p1/2 orbitals, respectively. These peaks indicate the presence of Mn3+ and Mn4+ oxidation states.49 The Cd 3d spectrum of the CdMn2O4 phase displays two prominent peaks at 405.01 eV and 410.02 eV, corresponding to the Cd 3d5/2 and Cd 3d3/2 orbitals, confirming the presence of Cd2+ in a bivalent oxidation state. The O 1s spectrum reveals multiple peaks: the O1 peak at 528.63 eV is attributed to metal–oxygen bonds, the O2 peak at 530.28 eV corresponds to surface-adsorbed oxygen, and the O3 peak at 532.36 eV suggests the presence of surface-adsorbed water and low oxygen coordination at specific defect sites within the material.50 The N 1s spectrum also identifies nitrogen in three forms: pyridinic-N, pyrrolic-N, and graphitic-N, observed at binding energies of 398.2 eV, 400.4 eV, and 401.6 eV, respectively.51 The N-doping in the carbon structure is significant as it alters the electron structure and introduces more active defects, which enhance electron and ion diffusion.
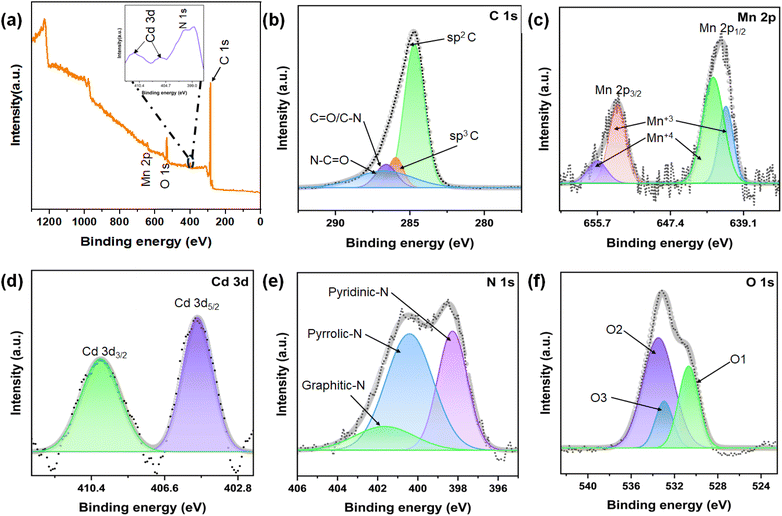 | ||
| Fig. 4 (a) XPS survey spectra and high-resolution XPS spectra of (b) C 1s, (c) Mn 2p, (d) Cd 3d, (e) N 1s and (f) O 1s of CdMn2O4 CNFs. | ||
The energy dispersive X-ray (EDX) mapping analysis of CdMn2O4 carbon nanofibers (CMO-1 and CMO-2) reveals important information regarding the elemental distribution and composition of the samples, as illustrated in Fig. S5.† In CMO-1, carbon emerges as the dominant element, constituting 59% of the composition, which underscores the significant presence of the carbon nanofiber matrix. The analysis also indicates the presence of oxygen (16%) and manganese (23%), confirming the incorporation of the CdMn2O4 spinel structure. Additionally, a minor amount of cadmium (2%) is detected, which supports its role in the composite formation. Conversely, CMO-2 displays a reduced carbon content (34%), accompanied by elevated levels of oxygen (25%) and manganese (38%). This variation suggests a greater incorporation of the oxide phase into the nanofiber matrix. Notably, the cadmium content in CMO-2 slightly increases to 3%, further substantiating the formation of the CdMn2O4 spinel. These results illustrate distinct differences in elemental distribution between the two samples, with CMO-2 exhibiting a more pronounced CdMn2O4 phase, likely due to variations in the synthesis parameters that enhance its structural integration within the carbon nanofiber framework.
Inductively coupled plasma optical emission spectrometry (ICP-OES) analysis of the bulk material supports the formation of CdMn2O4.The detailed elemental compositions are listed in Table S1.† In the CMO-2 sample, Mn and Cd concentrations are determined to be 1442.127 ppm and 712.236 ppm, respectively, while the CMO-1 sample shows Mn and Cd concentrations of 528.413 ppm and 685.233 ppm, respectively. These ICP-OES results, alongside the XPS data, strongly validate the successful incorporation of Mn and Cd into the nanofiber matrix, confirming the formation of the CdMn2O4 phase within the CNFs.
The specific surface area and pore size distribution of CdMn2O4 CNFs were evaluated using N2 adsorption–desorption isotherms and Barrett–Joyner–Halenda (BJH) pore size distribution curves. As shown in Fig. 3(c and d), the material exhibited mesoporous characteristics, indicated by the type-IV isotherms with a noticeable hysteresis loop. The specific surface area of the CdMn2O4 CNFs was measured to be 98.902 m2 g−1. The BJH pore-size distribution confirmed the mesoporous nature of the synthesized material, with a sharp distribution and an average pore size of 3.629 nm. These mesoporous structures, characterized by their high specific surface areas and optimal pore sizes, enhance electrochemical performance. The increased surface area provides more electroactive sites, while the well-defined mesopores facilitate shorter diffusion pathways for charge transport. This combination significantly improves electrochemical properties, making CdMn2O4 CNFs highly effective for various applications.
Mechanical testing was conducted to assess the flexibility of the composite materials, and the resulting stress–strain curves for pristine PAN, CMO-1, and CMO-2 are illustrated in Fig. S3.† The pure PAN fibers, devoid of composite reinforcement, exhibited a strain-at-break value of approximately 10.0%, indicating limited flexibility. In contrast, CMO-2, which incorporates CdMn2O4, demonstrated a significantly improved strain-at-break of about 13.7%, reflecting enhanced flexibility. CMO-1, featuring CdMn2O4, also showed an increased strain-at-break of approximately 11.3%, further underscoring the beneficial effects of composite inclusion. Moreover, the tensile strength and modulus of the composite materials were markedly improved compared to pure PAN. Specifically, CMO-2 exhibited a modulus of 2170 MPa, substantially higher than the 1120 MPa recorded for pristine PAN. These findings confirm that the incorporation of metal precursors into the polymer matrix significantly enhances both the flexibility and mechanical durability of the fibers. Consequently, these composite materials show considerable promise for applications requiring flexible and robust materials, such as in wearable electronics and flexible devices.
The wettability of the CdMn2O4 carbon nanofiber surface was assessed through water contact angle measurements. Fig. S4† illustrates the contact angles of water droplets on the surfaces of (a) pristine PAN carbon nanofibers and (b) CdMn2O4 carbon nanofibers. The pure PAN-based carbon nanofibers exhibited relatively poor wettability, with a contact angle of 118.68°. In contrast, the incorporation of CdMn2O4 into the carbon nanofibers resulted in a significant enhancement in hydrophilicity, as evidenced by a dramatic decrease in the water contact angle to 31.54°.52 This substantial improvement in wettability indicates enhanced interaction with water, which suggests that the presence of CdMn2O4 not only increases surface hydrophilicity but also expands the electroactive surface area, thereby facilitating faster ion transport.53 These attributes are critical for optimizing charge storage and transfer processes, which can lead to improved capacitance and energy density in supercapacitor applications. The enhanced wettability of CdMn2O4 carbon nanofibers positions them as promising candidates for advanced energy storage devices.
Computational study
Molecular dynamics (MD) simulations of diffusion processes in CdMn2O4 carbon nanofibers, pure CdMn2O4, and pure MnO2 structures were conducted using the Forcite module in BIOVIA Material Studio 2017.33 This type of transition metal oxide is ideally optimized by the Perdew–Burke–Ernzerhof (PBE) functional within the generalized gradient approximation (GGA). A geometry optimization process was performed and an annealing process was performed before starting the MD simulation of the NVT ensemble for 5000 ps. In order to approximate real-world conditions, the simulation temperature range was set to 300 K. In order to capture sufficient motion of ions, MD time steps of 1 fs and a total simulation time of 50 ps were used. NVT (constant volume and temperature) and NPT (constant pressure and temperature) ensembles were selected depending on environmental conditions. Using Forcite analysis, the Mean Square Displacement (MSD) was calculated, allowing diffusion coefficients to be determined from the relationship that this coefficient represents one-sixth of the slope of the MSD.34 The molecular simulation was run with the precision set to Fine.Enhanced ion diffusion in CdMn2O4 CNFs is attributed to its additional ion pathways created by the porous architecture, resulting in higher diffusion coefficients compared to those observed in pure CdMn2O4 and MnO2.54
Fig. 5 illustrates the optimized structures of CdMn2O4 CNFs, pure CdMn2O4, and MnO2, as well as the mean square displacement (MSD) curves for potassium ions (K+). The MSD analysis highlights the differences in ion diffusion behaviour across these structures, with CdMn2O4 CNFs showing the steepest slope, indicative of higher ion mobility.
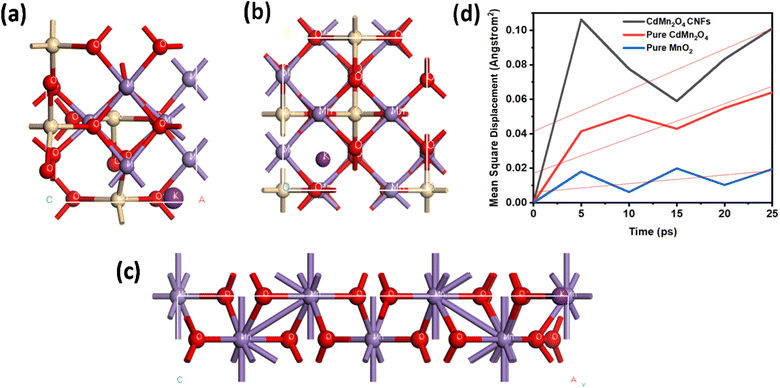 | ||
| Fig. 5 Optimized structures of (a) CdMn2O4 CNFs, (b) pure CdMn2O4, and (c) MnO2 with a potassium ion diffusion study. (d) Mean square displacement curves and diffusion coefficients of K+. | ||
The primary contributing factor of the enhanced ion diffusion in CdMn2O4 CNFs is the specific structural characteristics of its porous architecture, which offer more ion movement paths. By facilitating more effective ion transport, these additional channels increase the diffusion coefficient overall. CdMn2O4 CNFs has a diffusion coefficient of 0.003983, which is much greater than that of pure CdMn2O4 (0.003367) and MnO2 (0.000835). The increased surface area and decreased ion-pairing effects, which normally prevent diffusion in denser materials, are responsible for this increase. Better ion mobility is encouraged by the porous structure, which makes it a perfect fit for energy storage and electrochemical systems where quick ion transit is essential. According to theory, the observed diffusion coefficient values show the ionic conductivity and ion transport efficiency of the substance. Interconnected gaps in CdMn2O4 CNFs enable more efficient ion hopping, lowering the activation energy needed for diffusion. The lower diffusion coefficient of pure CdMn2O4, on the other hand, indicates that its ion routes are more limited, which restricts diffusion. Because of its tighter structure and fewer accessible channels for ion conduction, MnO2, which has the lowest value, exhibits noticeably worse ion mobility. CdMn2O4 CNFs have a greater diffusion coefficient, which implies that their ion transport properties are better suited for high-performance electrochemical applications.
Electrochemical analysis
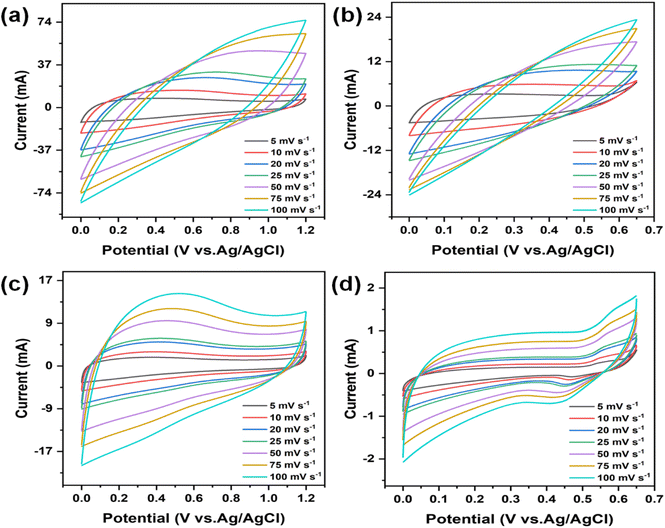
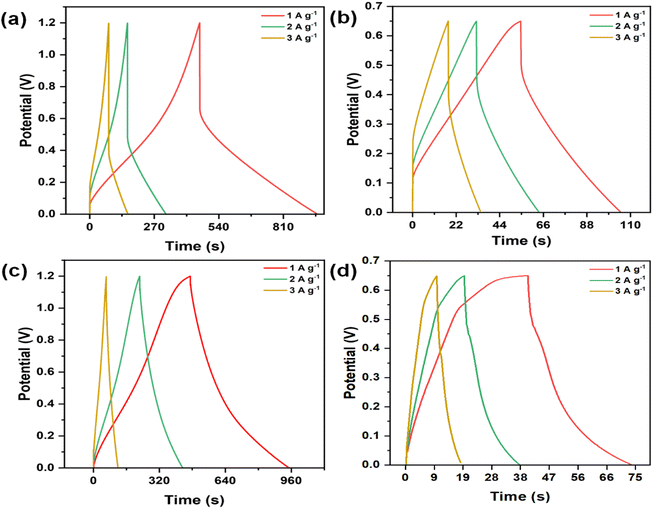
The electrochemical behaviour of the electrodes was evaluated using cyclic voltammetry (CV) and galvanostatic charge–discharge (GCD) techniques in a three-electrode setup. The analysis was driven by the exceptional surface morphology and structural characteristics of the electrodes. Furthermore, the stability and suitability of CMO-1 and CMO-2 in acidic and alkaline aqueous electrolytes were examined using 1 M H2SO4 and 6 M KOH, respectively. Fig. 6(a)–(d) show the CV curves for CMO-1 and CMO-2 at various scan rates in 1 M H2SO4 and 6 M KOH aqueous electrolytes. Fig. S6(a) and (b)† show the CV curve of pure MnO2 at various scan rates in 1 M H2SO4 and 6 M KOH aqueous electrolytes. The distorted quasi-rectangular shapes indicate faradaic behaviour, which is characteristic of pseudocapacitance in both electrolytes. The potential window for both CMO-1 and CMO-2 in 1 M H2SO4 is 0–1.2 V, while in 6 M KOH, it is 0–0.65 V. For CMO-1 in 1 M H2SO4, the specific capacitance values at scan rates ranging from 5 to 100 mV s−1 are 594.71–123.39 F g−1, respectively. In 6 M KOH, the specific capacitance values are 228.27–25.43 F g−1 at the same scan rates. For CMO-2 in 1 M H2SO4, the specific capacitance values at scan rates of 5–100 mV s−1 are 547.64–212.61 F g−1, respectively. In 6 M KOH, the specific capacitance values are 24.40–3.39 F g−1 at the same scan rates. Additionally, for pure MnO2 in 1 M H2SO4, the specific capacitance values at the same scan rates are 117.83–12.69 F g−1, while in 1 M KOH, the values are 24.12–1.93 F g−1. The observed increase in specific capacitance at lower scan rates is attributed to the expanded electroactive area available for electrochemical reactions under these slower conditions. This phenomenon underscores the notable pseudocapacitive behaviour exhibited by both CMO-1 and CMO-2 in 1 M H2SO4 and 6 M KOH electrolytes, as evidenced by their distorted quasi-rectangular CV curves. Notably, the broader potential window in 1 M H2SO4 (0–1.2 V) compared to 6 M KOH (0–0.65 V) contributes to higher specific capacitance values observed for both materials in the acidic electrolyte.Fig. 7(a)–(d) illustrates the GCD curves of the CMO-1 and CMO-2 electrodes at varying current densities in 1 M H2SO4 and 6 M KOH. Fig. S6(c) and (d)† show the CV curve of pure MnO2 at various current densities in 1 M H2SO4 and 6 M KOH aqueous electrolytes. The GCD curve shape of the CMO electrode is symmetrical as the current density increases from 1 to 3 A g−1. Although a gradual decrease in discharge time is observed, the overall shape remains unchanged, indicating that the CMO-1 and CMO-2 electrodes exhibit excellent reversibility during the charging and discharging processes. Eqn (S2)† was utilized to obtain the specific capacitance of the CMO electrode. At a current density of 1 A g−1, CMO-1 and CMO-2 in 1 M H2SO4 exhibit capacities of 411.66 and 198.86 F g−1, respectively. In contrast, when immersed in a solution of 6 M KOH, the capacities of the objects are measured to be 77.70 and 6.88 F g−1, respectively, at the same current density. Additionally, for pure MnO2 in 1 M H2SO4, the specific capacitance at the same current density is 121.72 F g−1, while in 1 M KOH, the specific capacitance is 24.04 F g−1. This value outperforms both pure MnO2 as demonstrated in ESI Table S2† and previously reported spinel CdMn2O4-related electrode materials.36,49 The observed reduction in specific capacitance values with increasing current density is attributed to restricted charging and discharging times, which influence overall capacitance due to time constraints in electrochemical processes.
The electrochemical properties of the synthesized materials were analyzed using the Trasatti method to differentiate the contributions of electric double-layer capacitance (EDLC) and pseudocapacitance (PC). This method allows the separation of surface-controlled (EDLC) and diffusion-controlled (PC) processes by plotting the reciprocal of the capacitance against the square root of the scan rate (ν1/2). The relationship is expressed by the equations:55,56
 | (2) |
 | (3) |
| CT = C0 + CPW | (4) |
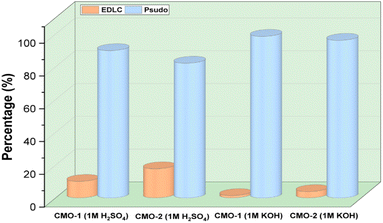 | ||
| Fig. 8 Electrochemical contributions of EDLC and pseudocapacitance for CMO-1 and CMO-2 in 1 M H2SO4 and 1 M KOH electrolytes. | ||
The electrochemical behavior of CdMn2O4 carbon nanofibers has been investigated in both 1 M KOH (alkaline medium) and 1 M H2SO4 (acidic medium), showcasing the distinct mechanisms of ion exchange and redox transformations that occur in each electrolyte. In an alkaline environment (KOH), the reactions are primarily governed by potassium ion (K+) intercalation into the CdMn2O4 structure. Initially, potassium ions are adsorbed on the surface of the material, as represented by the reaction:36
| [CdMn2O4]surface + K+ + e− ⇌ [KCdMn2O4]surface | (5) |
This is followed by bulk intercalation, where potassium ions penetrate deeper into the CdMn2O4 structure:
| CdMn2O4 + K+ + e− ⇌ [KCdMn2O4]K | (6) |
Furthermore, CdMn2O4 undergoes reduction in the presence of hydroxide ions (OH−) to form CdOOH and MnOOH, according to the reaction:
| CdMn2O4 + OH− + H2O ⇌ CdOOH + 2MnOOH + e− | (7) |
Finally, MnOOH is further oxidized to MnO2:
| MnOOH + OH− ⇌ MnO2 + H2O + e− | (8) |
In an acidic medium (1 M H2SO4), the electrochemical behavior involves proton (H+) intercalation. Initially, protons are adsorbed on the surface of CdMn2O4, forming:
| [CdMn2O4]surface + K+ + e− ⇌ [H2CdMn2O4]surface | (9) |
CdMn2O4 is further reduced to form cadmium hydroxide and manganese hydroxide:
| CdMn2O4 + 2H+ + 2e− ⇌ Cd(OH)2 + 2Mn(OH)2 | (10) |
Lastly, Mn(OH)2 is oxidized to MnO2, releasing water:
| Mn(OH)2 + 2H+ + 2e− ⇌ MnO2 + 2H2O |
In both alkaline and acidic media, the electrochemical performance of CdMn2O4 is driven by ion intercalation and redox transformations, which involve transitions between Mn3+ and Mn4+ oxidation states. In KOH, potassium ion intercalation is a key contributor to charge storage, enhancing the capacitive behavior, while in H2SO4, proton intercalation and reduction reactions significantly affect the redox activity. The distinct roles of K+ and H+ lead to different pseudocapacitive characteristics in these two environments, highlighting the versatility of CdMn2O4 for energy storage applications. The redox mechanisms and ion interactions underline the importance of the electrolyte type in tailoring the electrochemical behavior of CdMn2O4, enabling optimized performance based on specific energy storage needs.
Electrochemical impedance spectroscopy (EIS) was conducted to evaluate the electrochemical behavior of CMO-1 and CMO-2 in a 1 M H2SO4 solution using a three-electrode configuration. The Nyquist plot (Fig. S9a†) illustrates the impedance response of both CMO-1 and CMO-2. The equivalent circuit model used to fit the impedance data is depicted in Fig. S9b,† comprising solution resistance (Rs), charge transfer resistance (Rct), double-layer capacitance represented by a constant phase element (CPE), and a Warburg element (W) accounting for diffusion processes.
The impedance parameters derived from the fitting are summarized in Table S3.† The solution resistance (Rs) for CMO-1 and CMO-2 is 0.787 Ω and 0.8001 Ω, respectively, indicating similar electrolyte resistance for both materials. The charge transfer resistance (Rct) for CMO-1 is 6.13 Ω, whereas for CMO-2 it is slightly higher at 6.187 Ω, suggesting comparable electron transfer capabilities at the electrode/electrolyte interface for both materials. The capacitance (C) values for CMO-1 and CMO-2 are 2.826 μF and 2.902 μF, respectively, reflecting similar double-layer formation behavior. The Warburg element (W) values are also comparable for CMO-1 and CMO-2, indicating similar diffusion characteristics for these materials.
Overall, the EIS analysis reveals that both CMO-1 and CMO-2 exhibit analogous electrochemical properties in a 1 M H2SO4 solution under a three-electrode configuration, demonstrating effective charge transfer and diffusion behavior in the electrolyte. These findings underscore the comparable electrochemical performance of CMO-1 and CMO-2, which is advantageous for their potential applications in electrochemical devices.
The nanofibrous morphology of the CNFs is responsible for the exceptional supercapacitive performance of spinel CdMn2O4 CNFs, which is distinguished by a high Cs value and exceptional cyclability. Encapsulated CdMn2O4 NPs are connected through high aspect ratio NFs and tiny gaps or voids (tetrahedral and octahedral) in this structure. The involvement of the active material is further enhanced by the formation of easy and seamless pathways that promote the flow of electrolytes across these gaps and voids.36
Furthermore, the presence of structural voids, namely tetrahedral and octahedral voids, in spinel CdMn2O4 NPs offers extra active sites for the insertion of electrolytic ions. This leads to enhanced faradaic charge storage, also known as pseudocapacitance. Due to the presence of CNFs, this enhancement is observed alongside the electric double-layer capacitance (EDLCs).36 The impressive electrochemical behaviour exhibited by the CMO electrode can be attributed to several factors. First, CNFs are an appropriate material for EDLC electrodes because they can absorb electrons on their surface. Second, the CdMn2O4 NPs, characterized by their octahedral and tetrahedral gaps, provide supplementary electron and ion storage possibilities. Third, the electrode is built with highly conductive channels, which greatly enhance the speed of electron transport.
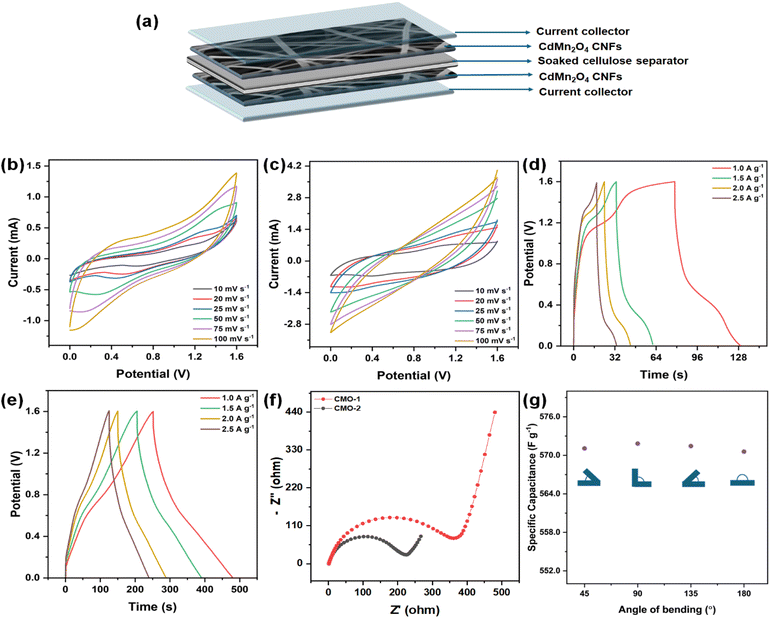
The electrochemical characteristics of these CdMn2O4 CNFs were systematically investigated in both acidic and alkaline aqueous electrolytes using a three-electrode setup. The findings reveal superior performance and robust electrode stability under acidic conditions, leading to the selection of a 1 M H2SO4 solution as the optimal electrolyte for constructing a real device using a two-electrode configuration. The practical-world viability of the flexible solid-state symmetric supercapacitor was demonstrated by assembling it with CdMn2O4 as both positive and negative electrodes. The device was constructed in a sandwich structure using an electrolyte-separator gel comprising H2SO4 and PVA, as depicted schematically in Fig. 9(a). Fig. 9(b) and (c) illustrate the CV performances at various scan rates. Upon establishing a stable operational voltage limit of 1.6 V, the performance of the solid-state capacitor (SSC) was further evaluated. The characteristics of the CV curves suggest a synergistic effect between EDLCs and faradaic capacitive materials. The CV curves remain unchanged as scan rates increase, indicating excellent rate capabilities attributable to enhanced charge transfer kinetics and minimized ion diffusion distances between electrodes and electrolytes. Fig. 9(d) and (e) depict the standard GCD curves of the device at various current densities. The CMO-2 symmetric supercapacitor shows capacitance values of 570.57, 522.07, 497.25, and 385.25 F g−1 at 1.0, 1.5, 2.0, and 2.5 A g−1, respectively. In contrast, CMO-1 demonstrates capacitance values of 221.37, 217.5, 209, and 208.5 F g−1 under similar current density conditions. EIS was conducted to examine the charge and ion transport mechanisms in CMO electrodes used in SSC devices. Fig. 9(f) presents the Nyquist plot obtained from electrochemical impedance spectroscopy (EIS), covering a frequency range of 100 kHz to 0.1 Hz at open circuit voltage with an AC amplitude of 5 mV. The equivalent circuit model used to fit the impedance data is depicted in Fig. S9b.† In the high-frequency region, the semicircle observed reflects the charge transfer process of CMO-1 and CMO-2. The impedance parameters for the symmetric cell are presented in Table S3,† where Rs values for CMO-1 and CMO-2 are 1.981 Ω and 1.486 Ω, respectively. The charge transfer resistance (Rct) is significantly higher for both materials in the symmetric configuration, with values of 224.9 Ω for CMO-1 and 360.5 Ω for CMO-2, indicating increased resistance due to the symmetric electrode setup. The capacitance values (C) for CMO-1 and CMO-2 are 12.09 μF and 12.80 μF, respectively, demonstrating effective double-layer formation even in the solid-state configuration. The Warburg element (W) values are lower compared to the three-electrode setup, which suggests improved diffusion characteristics in the solid-state supercapacitor. Energy density and power density are crucial metrics for assessing the practical viability of SSC devices. Fig. 9(g) represents the specific capacitance at a different bending angle of a single device. The results indicate that the specific capacitance remains relatively stable across all bending angles, demonstrating that the CMO-2-based device maintains its electrochemical performance even under significant mechanical deformation. This highlights the excellent flexibility and structural integrity of the CMO-2 material under various bending conditions, making it suitable for flexible energy storage applications. The electrical conductivity of the materials was also measured to further understand their electrochemical properties. The conductivity of CMO-1 was found to be 0.281 mS cm−1, while CMO-2 exhibited a significantly higher conductivity of 0.667 mS cm−1. The higher conductivity of CMO-2 can be attributed to its more porous structure, which facilitates better ion transport and contributes to improved electrochemical performance.57,58 These results indicate that CMO-2 is more suitable for applications requiring high conductivity, such as in energy storage devices. Our optimized SSC device using CMO-1 demonstrates a notable energy density of 507.17 W h kg−1 paired with a corresponding power density of 8000 W kg−1. In comparison, CMO-2 achieves an energy density of 196.93 W h kg−1 under similar power-density conditions.
Fig. 10(a) depicts Ragone plots alongside relevant references for further analysis. Based on Ragone plot comparisons, it is evident that the performance of our built device surpasses that of recently published similar materials such as LiMn2O4//AC, AC//LiMn2O4, Co-doped ZnMn2O4//AC, MnO2@CoMn2O4//rGO, NiMn-LDH/rGO//rGO, graphitic hollow carbon spheres, MWCNT/CdMn2O4//AC, and CdMn2O4/PVP NFs.36,59–64 At a current density of 1 A g−1, CMO-1 shows impressive cycling stability, retaining 84.51% of its capacitance after 12![[thin space (1/6-em)]](https://www.rsc.org/images/entities/char_2009.gif) 000 cycles, while CMO-2 retains around 88.57%. This demonstrates excellent long-term durability for both materials.
000 cycles, while CMO-2 retains around 88.57%. This demonstrates excellent long-term durability for both materials.
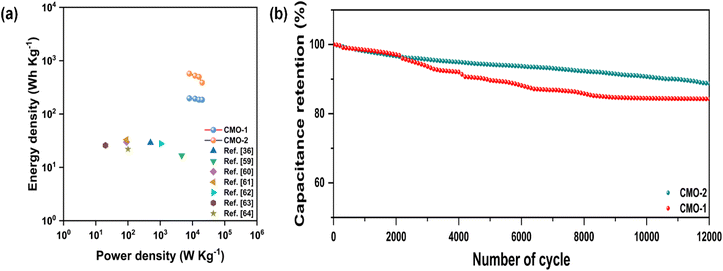 | ||
| Fig. 10 (a) Ragone plot and (b) long-term cycling stability of flexible symmetrical solid-state supercapacitors of CMO-1 and CMO-2 at 1 A g−1. | ||
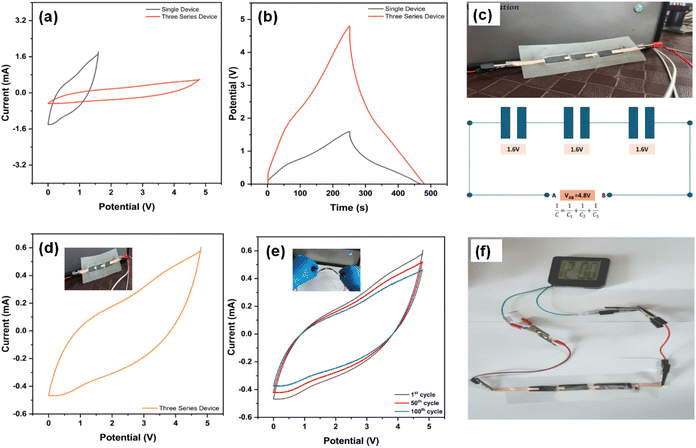
Fig. 11 demonstrates the electrochemical performance and practical applicability of the CMO-2-based flexible devices. Fig. 11(a) presents cyclic voltammetry (CV) curves for both a single device and three devices connected in series, illustrating an increase in the potential range from a single device to a series configuration. Fig. 11(b) shows the galvanostatic charge–discharge (GCD) profiles, with the series configuration exhibiting an extended discharge time compared to a single device, highlighting the enhanced energy storage capability with increased voltage. Fig. 11(c) depicts the physical configuration of three devices connected in series, along with a schematic of the equivalent circuit. Each individual device provides a potential of 1.6 V, resulting in a combined voltage of 4.8 V, demonstrating the effectiveness of the series arrangement for increasing the working voltage.
Fig. 11(d) provides a CV curve of the series-connected device, which is initially flat and subsequently bent after each cycle. Fig. 11(e) shows the CV curves of the device after multiple bending cycles (1st, 50th, and 100th cycles), indicating minimal degradation in performance, which further supports the robustness of the material. Finally, Fig. 10(f) demonstrates the practical application of the series-connected devices by powering a digital clock (1.2–1.4 V), which illuminates for more than 2 minutes; a video of the same is provided in the Video ESI.† Therefore, the CMO-2//CMO-2 SSC device, characterized by outstanding flexibility and high capacitance, exhibits promising applications in next-generation fiber-based wearable electronic devices.
Conclusion
In summary, the synthesis and characterization of spinel CdMn2O4 CNFs through electrospinning and subsequent carbonization have yielded materials with promising electrochemical properties and stability. Electrochemical evaluations in both acidic and alkaline electrolytes have highlighted the superior electrochemical performance of CdMn2O4 CNFs, particularly emphasizing their stability and efficiency in acidic environments. The specific capacitance of 570.57 F g−1 at 1 A g−1 in 1 M H2SO4, coupled with excellent cycling stability retaining 88.57% capacitance after 12![[thin space (1/6-em)]](https://www.rsc.org/images/entities/char_2009.gif) 000 cycles, underscores their potential for practical applications in high-performance energy storage devices. Furthermore, the flexible SSC device demonstrates exceptional mechanical stability under bending conditions, maintaining performance and structural integrity even after undergoing 100 cycles of bending and twisting. This resilience underscores its robust design and suitability for flexible applications in wearable electronics and other portable devices. Additionally, series-connected supercapacitors exhibit practical functionality by successfully powering a watch (1.2–1.4 V) for durations exceeding 2 minutes, highlighting their efficacy in real-world energy storage applications. These combined attributes position CdMn2O4 CNFs and their SSC configurations as promising candidates for advancing energy storage technologies in diverse applications.
000 cycles, underscores their potential for practical applications in high-performance energy storage devices. Furthermore, the flexible SSC device demonstrates exceptional mechanical stability under bending conditions, maintaining performance and structural integrity even after undergoing 100 cycles of bending and twisting. This resilience underscores its robust design and suitability for flexible applications in wearable electronics and other portable devices. Additionally, series-connected supercapacitors exhibit practical functionality by successfully powering a watch (1.2–1.4 V) for durations exceeding 2 minutes, highlighting their efficacy in real-world energy storage applications. These combined attributes position CdMn2O4 CNFs and their SSC configurations as promising candidates for advancing energy storage technologies in diverse applications.
Data availability
The data supporting this article have been included as part of the ESI.†Conflicts of interest
The authors certify that no personal relationships or known competing financial interests could have compromised the integrity of the research presented in this paper.Acknowledgements
The authors express gratitude to the Charotar University of Science and Technology (CHARUSAT) for providing research facilities. Furthermore, Akashkumar P. Patel, Deep S. Sharma, Sanjay N. Bariya, and Yash G. Kapdi express their sincere thanks to the Government of Gujarat for providing them with the “SHODH” Scholarship. The authors gratefully acknowledge the technical support for the BET measurements provided by the Sophisticated Analytical Instrumentation Facility (SAIF) Chandigarh and the XPS analysis conducted by the UGC-DAE Consortium for Scientific Research, Indore.References
- S. Riyajuddin and K. Ghosh, ACS Appl. Nano Mater., 2022, 5(10), 15328–15340 CrossRef.
- V. Kakani, S. Ramesh, H. M. Yadav, C. Bathula and P. K. Basivi, Sci. Rep., 2022, 1–10 Search PubMed.
- L.-Q. Mai, F. Yang, Y.-L. Zhao, X. Xu, L. Xu and Y.-Z. Luo, Nat. Commun., 2011, 2, 381 CrossRef PubMed.
- M. Farshadnia, A. A. Ensafi, K. Z. Mousaabadi, B. Rezaei and M. Demir, Sci. Rep., 2023, 1–8 Search PubMed.
- J. Wu, Chem. Rev., 2022, 122, 10821–10859 CrossRef CAS PubMed.
- X. Sun, T. Xu, J. Bai and C. Li, ACS Appl. Energy Mater., 2019, 2, 8675–8684 CrossRef CAS.
- W. Shi, B. Hu, H. Zhang, J. Li, J. Yang and J. Liu, ACS Appl. Energy Mater., 2020, 3, 12652–12661 CrossRef CAS.
- K. Allado, M. Liu, A. Jayapalan, D. Arvapalli, K. Nowlin and J. Wei, Energy Fuels, 2021, 35, 8396–8405 CrossRef CAS.
- Y. Gao, B. Li, Z. Zhang, X. Zhang, Z. Deng, L. Huo and S. Gao, ACS Appl. Nano Mater., 2021, 4, 6832–6843 CrossRef CAS.
- X. Chen, W. Dang and C. Feng, J. Nanosci. Nanotechnol., 2020, 20, 7665–7672 CrossRef CAS PubMed.
- S. Kang and J. Hwang, Chem. Eng. J., 2021, 406, 127158 CrossRef CAS.
- C. Cheng, Y. Cheng and G. Lai, Mater. Lett., 2022, 317, 132102 CrossRef CAS.
- S. H. Gong, B. Q. Wang, Y. Xue, Q. S. Sun, J. Wang, J. Kuai, F. Liu and J. P. Cheng, J. Colloid Interface Sci., 2022, 628, 343–355 CrossRef CAS PubMed.
- X. Tang, X. Lv, J. Lou, T. Fan, H. Chen, W. Wang, S. Zhang, H. Zhao, Q. Zhang, S. Wang and Y. Lei, ACS Appl. Energy Mater., 2023, 6, 9905–9914 CrossRef CAS.
- H. Bin Wu, G. Zhang, L. Yu and X. W. (David) Lou, Nanoscale Horiz., 2016, 1, 27–40 RSC.
- S. K. Ujjain, P. Ahuja and R. K. Sharma, J. Mater. Chem. A, 2015, 3, 9925–9931 RSC.
- A. R. Xavier, A. T. Ravichandran, S. Vijayakumar, M. D. Angelin, S. Rajkumar and J. P. Merlin, J. Mater. Sci.:Mater. Electron., 2022, 33, 8426–8434 CrossRef CAS.
- M. Khairy, H. A. Ayoub and C. E. Banks, RSC Adv., 2018, 8, 921–930 RSC.
- D. S. Patil, S. A. Pawar and J. C. Shin, Chem. Eng. J., 2018, 335, 693–702 CrossRef CAS.
- N. D, M. Humayun, D. Lu, V. B. Mohan, D. J. Fu and W. Gao, Ceram. Int., 2020, 46, 5278–5288 CrossRef CAS.
- E. Samuel, A. Aldalbahi, M. El-Newehy, H. El-Hamshary and S. S. Yoon, Ceram. Int., 2022, 48, 18374–18383 CrossRef CAS.
- A. V. Radhamani, M. Krishna Surendra and M. S. Ramachandra Rao, Mater. Des., 2018, 139, 162–171 CrossRef CAS.
- J. Li, M. Yang, Y. Zhao, W. Zhang, L. Huo, X. Zhang, J. Gao, H. Pang and H. Xue, ACS Appl. Energy Mater., 2021, 4, 5830–5839 CrossRef CAS.
- R. Barik, A. Raulo, S. Jha, B. Nandan and P. P. Ingole, ACS Appl. Energy Mater., 2020, 3, 11002–11014 CrossRef CAS.
- J. Cai, H. Niu, Z. Li, Y. Du, P. Cizek, Z. Xie, H. Xiong and T. Lin, ACS Appl. Mater. Interfaces, 2015, 7, 14946–14953 CrossRef CAS PubMed.
- A. S. Levitt, M. Alhabeb, C. B. Hatter, A. Sarycheva, G. Dion and Y. Gogotsi, J. Mater. Chem. A, 2019, 7, 269–277 RSC.
- H. Wang, W. Wang, H. Wang, X. Jin, H. Niu, H. Wang, H. Zhou and T. Lin, ACS Appl. Energy Mater., 2018, 1, 431–439 CrossRef CAS.
- C. H. Yang, Y. C. Hsiao and L. Y. Lin, ACS Appl. Mater. Interfaces, 2021, 13, 41637–41648 CrossRef CAS PubMed.
- Q. Liu, X. Hong, X. You, X. Zhang, X. Zhao, X. Chen, M. Ye and X. Liu, Energy Storage Mater., 2019, 1–9 Search PubMed.
- Y. Liu, J. Zhou, L. Chen, P. Zhang, W. Fu, H. Zhao, Y. Ma, X. Pan, Z. Zhang, W. Han and E. Xie, ACS Appl. Mater. Interfaces, 2015, 7, 23515–23520 CrossRef CAS PubMed.
- J. Bhagwan, N. Kumar and Y. Sharma, J. Energy Storage, 2022, 46, 103894 CrossRef.
- M. Singh, A. Gupta, S. Sundriyal, K. Jain and S. R. Dhakate, Mater. Chem. Phys., 2021, 264, 124454 CrossRef CAS.
- D. S. Biovia, R2 Dassault Systèmes BIOVIA, San Diego Search PubMed.
- M. Jardat, O. Bernard, P. Turq and G. R. Kneller, J. Chem. Phys., 1999, 110, 7993–7999 CrossRef CAS.
- Y. Liu, Q. Liu, L. Wang, X. Yang, W. Yang, J. Zheng and H. Hou, ACS Appl. Mater. Interfaces, 2020, 12, 4777–4786 CrossRef CAS.
- J. Bhagwan, A. Sahoo, K. L. Yadav and Y. Sharma, J. Alloys Compd., 2017, 703, 86–95 CrossRef CAS.
- J. K. Rajput, T. K. Pathak, V. Kumar and L. P. Purohit, Appl. Surf. Sci., 2017, 409, 8–16 CrossRef CAS.
- D. Sharma, N. Patel, S. Panjabi and V. Patel, Ceram. Int., 2023, 49, 8839–8846 CrossRef CAS.
- E. Stodolak-Zych, A. Benko, P. Szatkowski, E. Długoń, M. Nocuń, C. Paluszkiewicz and M. Błażewicz, J. Mol. Struct., 2016, 1126, 94–102 CrossRef CAS.
- S. Kumar, A. K. Ojha and R. K. Singh, J. Raman Spectrosc., 2014, 45, 717–722 CrossRef CAS.
- A. Abdallah, A. Aridi, R. Halabi, M. Noun and R. Awad, Chem. Afr., 2024, 7, 4657–4668 CrossRef CAS.
- C. Kim, S. H. Park, J. I. Cho, D. Y. Lee, T. J. Park, W. J. Lee and K. S. Yang, J. Raman Spectrosc., 2004, 35, 928–933 CrossRef CAS.
- V. G. Zhigalina, O. M. Zhigalina, I. I. Ponomarev, K. M. Skupov, D. Y. Razorenov, I. I. Ponomarev, N. A. Kiselev and G. Leitinger, CrystEngComm, 2017, 19, 3792–3800 RSC.
- C. Kim, K. S. Yang, M. Kojima, K. Yoshida, Y. J. Kim, Y. A. Kim and M. Endo, Adv. Funct. Mater., 2006, 16, 2393–2397 CrossRef CAS.
- R. Awad, A. Haghighat Mamaghani, Y. Boluk and Z. Hashisho, Chem. Eng. J., 2021, 410, 128412 CrossRef CAS.
- M. Yanilmaz, M. Dirican, A. M. Asiri and X. Zhang, J. Energy Storage, 2019, 24, 100766 CrossRef.
- D. Acharya, A. Muthurasu, T. H. Ko, R. M. Bhattarai, T. Kim, S. H. Chae, S. Saidin, K. Chhetri and H. Y. Kim, ACS Appl. Energy Mater., 2023, 6(18), 9196–9206 CrossRef CAS.
- L. Jin, X. Liu, Z. Wang, J. Luo, L. Zheng, M. Zhang and Y. Ao, ACS Appl. Mater. Interfaces, 2023, 15, 58517–58528 CrossRef CAS PubMed.
- H. J. Kim, C. W. Kim, S. Y. Kim, A. E. Reddy and C. V. V. M. Gopi, Mater. Lett., 2018, 210, 143–147 CrossRef CAS.
- A. M. Mohamed, D. M. Sayed and N. K. Allam, ACS Appl. Mater. Interfaces, 2023, 15, 16755–16767 CrossRef CAS PubMed.
- W. Zhao, J. Yang, B. Yang, Z. Gao, D. Han, Q. Su, B. Xu and G. Du, ACS Appl. Nano Mater., 2023, 6, 9306–9314 CrossRef CAS.
- T. Hussain, Y. Wang, Z. Xiong, J. Yang, Z. Z. Xie and J. Liu, J. Colloid Interface Sci., 2018, 532, 343–351 CrossRef CAS PubMed.
- Y. Wang, J. Xiao, T. Zhang, L. Ouyang and S. Yuan, ACS Appl. Mater. Interfaces, 2021, 13, 45670–45678 CrossRef CAS PubMed.
- Q. Wei, F. Xiong, S. Tan, L. Huang, E. H. Lan, B. Dunn and L. Mai, Adv. Mater., 2017, 29(20) DOI:10.1002/adma.201602300.
- H. S. Nishad, S. D. Tejam, S. M. Mane, S. P. Patole, A. V. Biradar, J. Lee, S. W. Gosavi and P. S. Walke, J. Energy Storage, 2024, 77, 109842 CrossRef.
- A. Kumar, H. Mittal and M. Khanuja, J. Energy Storage, 2023, 67, 107496 CrossRef.
- J. S. Im, S. J. Kim, P. H. Kang and Y. S. Lee, J. Ind. Eng. Chem., 2009, 15, 699–702 CrossRef CAS.
- A. Sutradhar, N. Tonny, C. Nafis, I. Saifur and R. Ibrahim, Carbon Fiber and Carbon Fiber Composites—Creating Defects for Superior Material Properties, Springer International Publishing, 2024 Search PubMed.
- H. Xiao, Y. Wang, K. Xie, S. Cheng and X. Cheng, J. Alloys Compd., 2018, 738, 25–31 CrossRef CAS.
- L. Huang, B. Liu, H. Hou, L. Wu, X. Zhu, J. Hu and J. Yang, Facile Preparation of Flower-like NiMn Layered Double Hydroxide/Reduced Graphene Oxide Microsphere Composite for High-Performance Asymmetric Supercapacitors, Elsevier B.V., 2018, vol. 730 Search PubMed.
- J. Bhagwan and J. I. Han, Ceram. Int., 2024, 50, 26086–26096 CrossRef CAS.
- F. X. Wang, S. Y. Xiao, Y. S. Zhu, Z. Chang, C. L. Hu, Y. P. Wu and R. Holze, J. Power Sources, 2014, 246, 19–23 CrossRef CAS.
- C. Zhang, Z. Peng, Y. Chen, H. Chen, B. Zhang, H. Cheng, J. Wang and M. Deng, Electrochim. Acta, 2020, 347, 136246 CrossRef CAS.
- S. Khaja Hussain and J. Su Yu, Chem. Eng. J., 2019, 361, 1030–1042 CrossRef CAS.
Footnote |
| † Electronic supplementary information (ESI) available: Electrochemical performance measurements, cross-sectional SEM images (S1), and photographic images of the prepared spinel CdMn2O4 CNFs (S2). Stress–strain and load-extension curves (S3), wettability test of CdMn2O4 CNFs (S4), EDX elemental mapping (S5), CV and GCD data of pure MnO2 (S6), specific capacitance vs. scan rate−1/2 (S7), specific capacitance vs. scan rate1/2 (S8), Nyquist plots of CMO-1 and CMO-2 in a three electrode system (S9), Nyquist plots of CMO-1 and CMO-2 CNFs (S10), and variation of calculated specific capacitance with the scan rate and current density (S11). Photographic images of real-time flexible devices (S12), ICP-OES elemental analysis of CMO-1 and CMO-2 (Table S1), comparison of three electrode data of the reported MnO2 material (Table S2), and impedance parameters for CMO-1 and CMO-2 derived from EIS (Table S3). See DOI: https://doi.org/10.1039/d4ta05624h |
| This journal is © The Royal Society of Chemistry 2025 |

