 Open Access Article
Enhancing the thermoelectric figure of merit of BiN via polymorphism, pressure, and nanostructuring†
Elena R.
Remesal‡
 a,
Victor
Posligua‡
 a,
Miguel
Mahillo-Paniagua
b,
Konstantin
Glazyrin
 c,
Javier Fdez.
Sanz
 a,
Antonio M.
Márquez
 a and
Jose J.
Plata
 *a
*a
aDepartamento de Química Física, Facultad de Química, Universidad de Sevilla, Seville, E-41012, Spain. E-mail: jplata@us.es
bResearch, Technological Innovation and Supercomputing Center of Extremadura (CenitS), Cáceres, Spain
cPhoton Sciences, Deutsches Elektronen-Synchrotron, Notkestr. 85, 22607 Hamburg, Germany
First published on 11th November 2024
Abstract
Materials discovery extends beyond the synthesis of new compounds. Detailed characterization is essential to understand the potential applications of novel materials. However, experimental characterization can be challenging due to the vast chemical and physical spaces, as well as the specific conditions required for certain techniques. Computational high-throughput methods can overcome these challenges. In this work, the transport and thermoelectric properties of the recently synthesized bulk BiN are explored, including the effects of temperature, pressure, carrier concentration, polymorphism and polycrystalline grain size. We find that the band structure is strongly dependent on pressure and the polymorph studied. Both polymorphs exhibit low thermal conductivity at 0 GPa, which rapidly increases when pressure is applied. Electronic transport properties can be finely tuned based on the effects of pressure and polymorph type on the band gap, carrier mobilities, and presence of secondary pockets. The thermoelectric figure of merit can reach values around 0.85 for both p- and n-type BiN if the power factor and lattice thermal conductivity are optimized at 600 K, making this material competitive with other well-known thermoelectric families, such as Bi2Te3 or PbX, in the low-to-medium temperature range.
Introduction
A significant proportion of technological breakthroughs rely on the discovery of new materials. Historically, three primary approaches have been used to develop new materials.1 Some compounds are accidentally discovered through serendipity while pursuing other objectives. Others are created using rational design principles based on previous successes, predicting desired properties using theoretical models and then synthesizing them in the laboratory. However, major advancements rarely occur this way. Incremental advances seldom lead to groundbreaking applications. Meanwhile, there are compounds that remained unused for many years until their functionality and commercial potential were eventually recognized. Polyacetylene, for example, was initially thought to be a useless black powder until its conductivity properties were discovered in the 1970s, leading to significant advancements in organic electronics.2 GaN, another example, was first synthesized in 1928 but remained relatively unknown until the 1980s when its potential for electronic and optoelectronic applications was stablished.3The emergence of high-throughput experimental methods combined with artificial intelligence has speed up the pace in which new compounds are discovered and synthesized.4 Autonomous laboratories are potentially capable of targeting new materials, designing the optimal synthetic routes, and performing their synthesis.5 However, these new methodologies have already faced significant challenges in the characterization process,6 not to mention that many sophisticated approaches, including thin film sputtering, high-pressure synthesis are still beyond the current capabilities of autonomous labs. This scenario reaffirms the importance of developing systematic, accurate, and robust experimental measurements and theoretical predictions of materials properties, in which materials are not merely approached as single compounds but more as platforms for future wide-ranging applications. The use of graphene in different applications such as water filtration, sensors, and optoelectronics or CoSb3 as thermoelectric material underscore the significance of comprehensive characterization and its crucial role optimizing emerging materials for diverse uses. This task is particularly critical in certain areas, such as thermoelectricity, where the transport properties that determine their thermoelectric performance are highly sensitive to synthetic, processing, and operando conditions. In addition to the challenge of covering a wide range of parameters, experimental characterization techniques require specific conditions that may not be compatible with the stability conditions of the materials.
The bulk structure of BiN is a good example of how exploring novel materials potentially exhibiting a wide range of phenomena, e.g. thermoelectrics, piezo and/or pyro-electrics requires the use of theoretical modeling. Here and below we focus on BiN thermoelectric performance. While 2D BiN has been attracting attention for its potential use in transistor technology,7 its bulk structure and properties have remained a mystery for a century after the first reported synthesis.8 Glazyrin et al. recently synthesized and characterized two bulk BiN polymorphs at different pressures.9Pbcn BiN represents the stable polymorph at pressures higher than 12.5 GPa, whereas Pca21 is the prevailing phase under ambient conditions. The structural characterization of these compounds has revealed various features that make them candidates for thermoelectric materials. First, Pbcn BiN shares the same structural prototype as SnSe, which is one of the most efficient reported thermoelectric materials.10 Bismuth is also a common element in thermoelectric materials due to its electron lone pair and the anharmonicity of its bonds with other elements.11 Moreover, the difference in mass between Bi and N should increase the anharmonicity of the material and reduce its thermal conductivity. It is, however, difficult to experimentally characterize the thermoelectric properties of BiN due to its reactivity in the presence of O2 or H2O. In this work, DFT calculations are combined with Machine Learning to explore the transport properties of BiN bulk materials to determine its potential application as thermoelectric material, its deficiencies and venues for improvement.
Methodology
Thermal transport properties
Electronic transport properties
Electrical conductivity, the Seebeck coefficient, and the electronic contribution to the thermal conductivity were calculated using the AMSET package.21 This code solves the Boltzmann transport equation using the Onsager coefficients to predict electronic transport properties with the wavefunction from a DFT calculation as the main input. Scattering rates for each temperature, doping concentration, band, and k-point are calculated including scattering due to deformation potentials, polar optical phonons, and ionized impurities. Wavefunction coefficients were obtained using the HSE06 functional proposed by Heyd et al.,22 using the primitive cell (32 atoms) and a dense mesh of 6 × 12 × 6 k-points. Elastic constants and deformation potential, required to compute the different scattering contributions were computed using the same setup used for the geometry optimization and force constants calculations. More details on how the thermal transport properties are incorporated into our high-throughput framework can be found in our previous studies.23,24Results and discussion
Electronic band structure
We investigated the electronic band structure of both polymorphs, Pca21 and Pbcn, under varying pressure conditions. To ensure accuracy and consistency across our calculations, we employed a uniform dense k-point mesh, which was also utilized for the geometry optimization. We observed that the band gap value (Eg) decreases in both polymorphs by approximately 0.4 eV as pressure is increased from 0 to 12.5 GPa, in good agreement with Glazyrin et al.9 Our electronic band structure provides additional details. At 0 GPa (Fig. 1a and c), both polymorphs exhibited flat valence bands (VBs), indicating low mobility and large effective masses (Table 1). However, when the pressure was increased to 12.5 GPa (Fig. 1b and d), a slight curvature in the VBs was detected, suggesting increased mobility in both Pca21 and Pbcn polymorphs. This effect is also observed in a reduction of the effective masses with increasing pressure.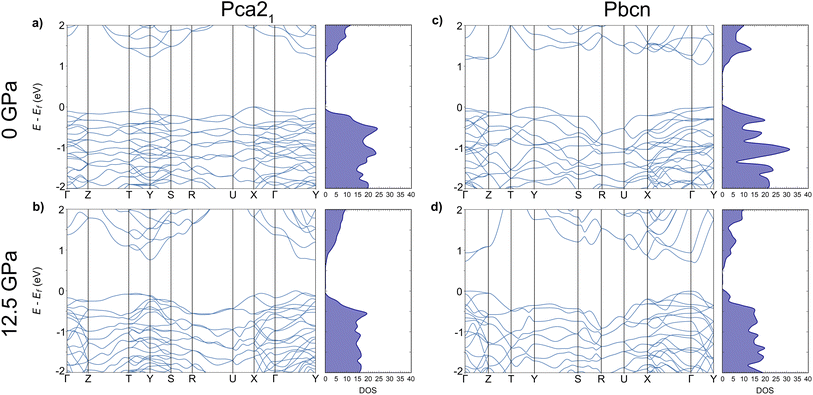 | ||
| Fig. 1 Electronic band structures and density-of-states, DOS, for Pca21 (a and b) and Pbcn (c and d) polymorphs at 0 and 12.5 GPa. | ||
| Pressure | SG | m h | m e | ||||
|---|---|---|---|---|---|---|---|
| [100] | [010] | [001] | [100] | [001] | [001] | ||
| 0 GPa | Pca21 | −1.97 | −1.03 | −0.70 | 0.36 | 0.54 | 0.49 |
| Pbcn | −3.84 | −1.45 | −2.10 | 0.01 | 0.14 | 0.90 | |
| 12.5 GPa | Pca21 | −0.473 | −0.453 | −0.32 | 0.17 | 0.93 | 0.15 |
| Pbcn | −3.57 | −1.64 | −0.89 | 1.44 | 0.11 | 0.25 | |
The decrease in Eg values with increasing pressure in our study can be explained by the general reduction in interatomic distances within the materials.25–27 This reduction typically leads to increased overlap between electronic orbitals, which in turn affects the energy levels of the VBs and conduction bands (CBs). As the atoms are pushed together, the energy separation between these bands decreases, resulting in a narrower band gap. This phenomenon is commonly observed in semiconductors and insulators under high-pressure conditions.28–30 However, it is important to note that the behavior of Eg under pressure can vary depending on the specific material system. In some other systems, Eg can increase with pressure due to different electronic structure modifications.31–33
Furthermore, the curvature observed in the CBs is higher than that in the VBs. This increased curvature in the CBs suggests lower effective masses, which may influence the electron mobility (μ) in both polymorphs. Higher curvature typically indicates higher μ, as electrons can move more freely within the CB. Consequently, this effect would also impact the electrical conductivity (σ) of the material, as μ is directly related to σ. Therefore, the increased curvature of the CBs under pressure suggests that both μ and σ would be affected proportionally in both polymorphs. These implications for σ will be discussed in the following section, where we analyse the results obtained for the electronic transport properties of these systems.
Thermal conductivity analysis
Thermal transport is explored on both polymorphs, calculating thermal conductivity (κ), a crucial property for understanding the efficiency of materials in thermoelectric applications, as it influences how well a material can conduct heat. Lattice thermal conductivity (κl) is described first because: (i) the moderate band gap of these materials makes phonon heat conduction the primary mechanism for heat transport at low and medium temperatures, and (ii) (κl) can be more easily tailored compared to the electronic contribution (κe), which is strongly coupled to electrical conductivity by the Wiedemann–Franz law.For both Pca21 and Pbcn polymorphs, we observed that κl decreases with increasing temperature (Fig. 2). This behavior is typical in semiconductors due to increased phonon–phonon scattering rates at higher temperatures. This, in turn, reduces the mean free path of phonons, decreasing κl.34–36 The lattice thermal conductivity is dominated by phonon–phonon Umklapp scattering, resulting in a T−1 dependence that reflects the increasing number of phonons available for scattering as the temperature rises.
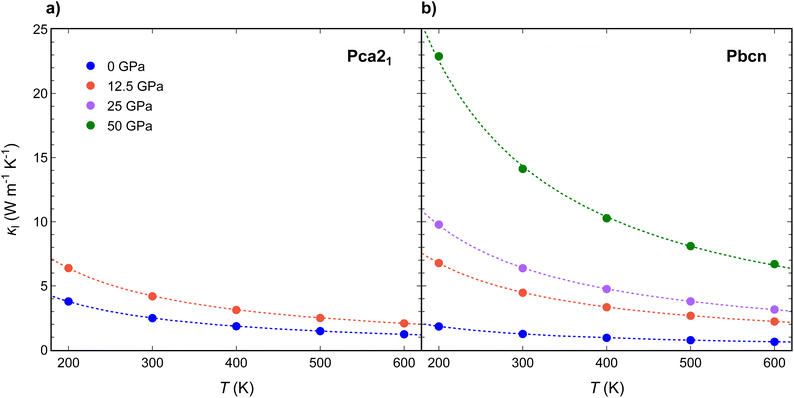 | ||
| Fig. 2 Temperature variation of lattice thermal conductivity (κl) for (a) Pca21 and (b) Pbcn polymorphs at 0 (blue), 12.5 (orange), 25 (purple) and 50 (green) GPa. | ||
Interestingly, at 0 GPa, Pbcn polymorph exhibits lower κl compared with Pca21, while at 12.5 GPa, κl values of Pbcn are higher than that of Pca21. This observation can be attributed to the differences in the group velocities between the two polymorphs (Fig. 3a and c). Our analysis revealed that the group velocities obtained for Pbcn polymorph are consistently higher than those of Pca21, with the values at 12.5 GPa being approximately three times higher at the 4–8 THz frequency range. This suggests that phonons in Pbcn polymorph exhibit faster propagation speeds, leading to enhanced thermal transport and higher κl compared to Pca21, particularly at higher pressures.
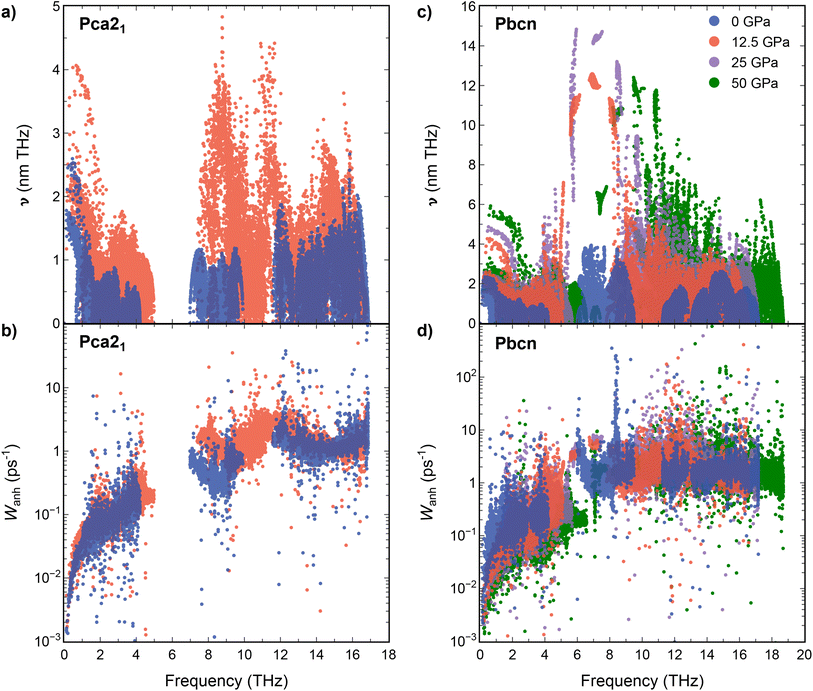 | ||
| Fig. 3 Group velocities (a and c) and scattering rates (b and d) vs. frequency for Pca21 and Pbcn polymorphs at 0 (blue), 12.5 (orange), 25 (purple) and 50 (green) GPa. | ||
The scattering rates (W) are illustrated in Fig. 3b and d for Pca21 and Pbcn polymorphs, respectively. Both polymorphs display low scattering rates at low frequencies, where acoustic modes are predominant and serve as the primary contributors to the thermal conductivity of these materials. However, at 0 GPa, Pbcn polymorph presents higher values of W at these modes compared to the Pca21 polymorph. This explains the lower κl values for Pbcn polymorph at 0 GPa since higher scattering rates correspond to shorter phonon lifetimes and increased resistance to thermal transport. For Pca21 polymorph at 0 GPa, lower scattering rates allow for more efficient phonon transport, resulting in higher κl values compared to Pbcn. At 12.5 GPa, the situation is different: Pca21 polymorph exhibits similar values of W at low-frequency modes, however, κl is lower compared to Pbcn.
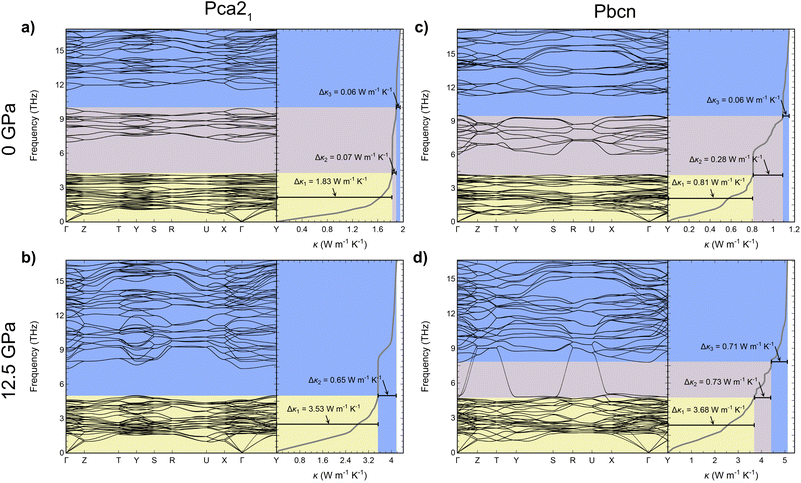
Further insight into the thermal conductivity behavior can be gained from examining the phonon dispersion curves for the Pca21 and Pbcn polymorphs at 0 and 12.5 GPa (Fig. 4). Additionally, the cumulative κl has been computed to understand the contribution of each vibrational mode to κl. The dispersion curves provide useful information to understand the group velocities and scattering rates discussed previously. At 0 GPa, both polymorphs present similar dispersion curves, with a first band containing acoustic and low-frequency optic modes in the 0–4.5 THz range, a second optical band around 6–9 THz, and a third optical band above 11 THz. Despite this similarity, their contribution to κl differs as can be deduced examining the cumulative contributions of each vibrational mode to κl. The main difference stems from the larger contribution of the first band to κl in the case of the Pca21 polymorph (around 1.83 W m−1 K−1) compared to the Pbcn polymorph (0.81 W m−1 K−1). As mentioned earlier, this difference is due to the Pbcn polymorph presenting higher values of W in this range of frequencies. The differences in κl between the two polymorphs are slightly diminished by the larger contribution to κl from the second optical band in the case of the Pbcn polymorph, primarily owing to its higher group velocities. This scenario completely changes at 12.5 GPa. Both polymorphs exhibit similar contributions to κl from the acoustic and low-frequency optical modes (3.53 W m−1 K−1 and 3.68 W m−1 K−1). There is a significant shift of the second optical band in both polymorphs to higher frequencies, producing an overlap with the higher energy band. This shift is also connected to a strong increase in the group velocities, which significantly enhances their contribution to κl. For instance, for the Pca21 polymorph, the contribution of the second and third bands increases from 0.15 W m−1 K−1 to 0.65 W m−1 K−1 when pressure is changed from 0 GPa to 12.5 GPa. However, the main feature that changes the trend and makes the Pbcn polymorph present a higher κl than Pca21 at 12.5 GPa is the presence of two modes with exceptionally large group velocities in the region between 4.5–7.5 THz. Due to these large group velocities, these two modes contribute 0.73 W m−1 K−1 to κl, whereas this feature is not found in the Pca21 polymorph. The Pbcn polymorph also exhibits these high-velocity modes at higher pressures.
Electronic transport properties
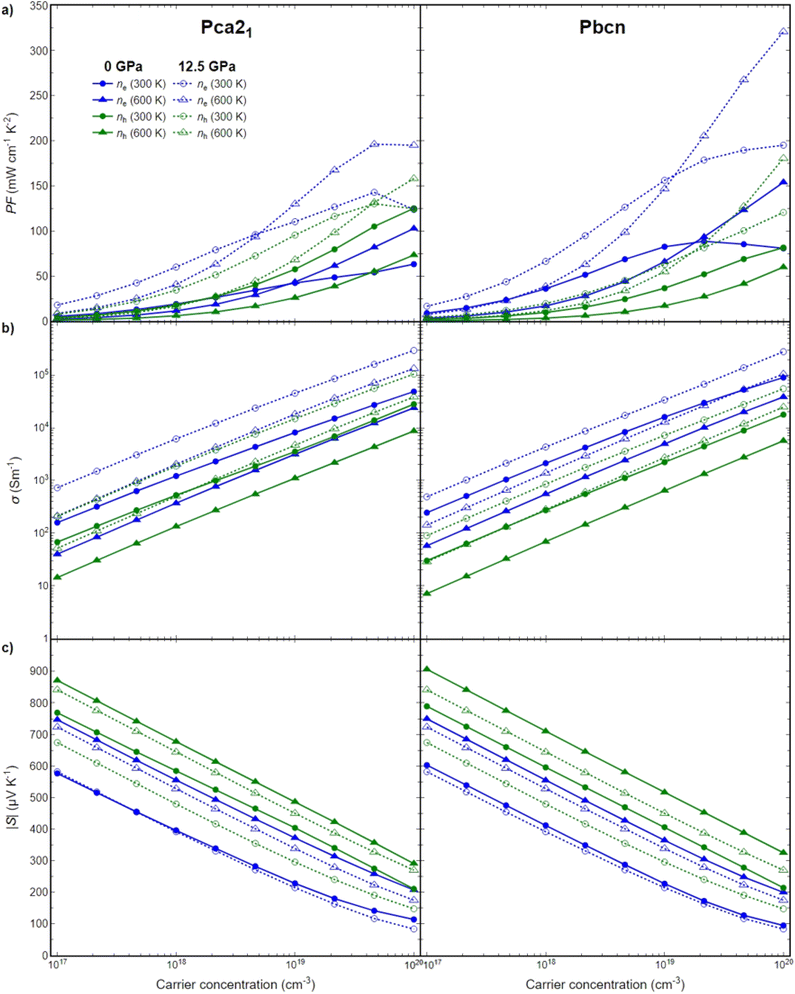
To further elucidate the relationship between the structural, electronic, and transport properties of BiN, we investigated the electronic transport properties: power factor (PF), Seebeck coefficient (S) and electrical conductivity (σ) for both Pca21 and Pbcn polymorphs. Both p- and n-type BiN polymorphs have been explored in a large range of carrier concentrations (1017–1020 cm−3), at different temperatures (300–600 K) and pressures (0–12.5 GPa). This study did not investigate bipolar effects. To the best of our knowledge, AMSET is unable to simultaneously explore both electron and hole transport. However, bipolar effects are typically significant for materials with very narrow band gaps at high temperatures. In the present work, the lowest band gap obtained was around 0.4 eV, and the temperatures explored did not exceed 600 K, so bipolar effects are not expected to be dominant under the conditions investigated. As the thermoelectric figure of merit (zT) depends directly on the PF, first this magnitude will be explored then, its behavior will be analyzed as function of S and σ (Fig. 5).Pressure appears to play a significant role in the transport properties of this material. The power factor is drastically increased when pressure is changed from 0 to 12.5 GPa, for both n-type and p-type as well as both polymorphs (Fig. 5a). This is primarily due to a large increase in σ, in some cases around one order of magnitude, while the S is barely reduced (Fig. 5b). The large increase in σ can be analyzed based on the band structures discussed earlier. Pressure produces two main effects: it reduces the band gap of both polymorphs, and in some cases, it changes the curvature of the bands, thereby increasing the mobility of the charge carriers. Both of these phenomena contribute to the enhancement of σ.
Overall, n-type BiN exhibits a higher PF compared to its p-type counterpart. The larger electrical conductivity of n-type BiN, which is primarily responsible for its higher power factor compared to p-type, is strongly linked to its higher carrier mobility as indicated by the curvature of the conduction band edge. Furthermore, the enhancement of this trend with increased pressure can be attributed to not only the mobility increase, but also the creation of secondary carrier pockets with similar energy levels, particularly in the Pbcn polymorph. The presence of these secondary pockets is the reason why n-type BiN demonstrates exceptionally large PF values at higher temperatures (and specially at high carrier concentration).
The Pca21 polymorph exhibits slightly lower power factor values compared to the Pbcn polymorph for n-type behavior, but larger PF values for p-type behavior. Analyzing the band structure cannot explain this trend based solely on the band gap values. At 0 GPa, the Pbcn polymorph presents a lower band gap (1.03 eV) compared to Pca21 (1.22 eV). This trend is even more attenuated at 12.5 GPa, where the band gaps are reduced to 0.69 eV for Pbcn and 0.75 eV for Pca21. However, the presence of 2–3 different carrier pockets at the edge of the valence band of the Pca21 polymorph, which are very close in energy, explains the larger PF for the p-type Pca21 polymorph compared to Pbcn.
In summary, the electronic transport properties analysis reveals a complex behavior for BiN, which is influenced by temperature, carrier concentration, pressure, and polymorphism. There is a delicate balance between band gap, electron mobility, and secondary carrier pockets, and these factors can be tuned by the aforementioned variables to optimize the power factor of the material.
Figure of merit
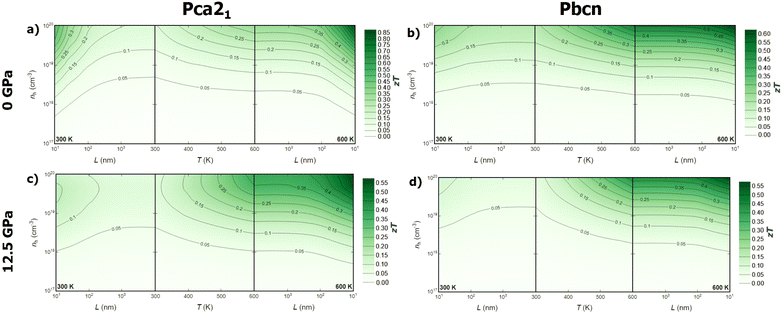
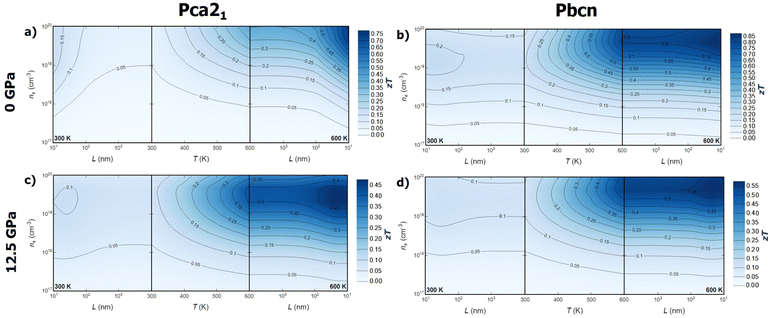
Combining the analysis of thermal and electronic transport properties allows us to chart the thermoelectric figure of merit, zT, using variables such as temperature, pressure, carrier concentration, carrier type, and polymorph (Fig. 6 and 7). Due to the large band gap of this material, the electronic contribution to thermal conductivity, κe, is small enough at low and medium temperatures, so the lattice thermal conductivity κl is the main contributor to the total thermal conductivity κ. This is why some of the trends observed in the power factor PF analysis can be extrapolated to zT. For instance, n-type BiN exhibits higher zT than its p-type counterpart, and the Pbcn polymorph generally presents higher zT than the Pca21 polymorph. For single crystal BiN, n-type Pbcn shows a zT of approximately 0.8 at 600 K and a carrier concentration around 1020 cm−3, while p-type Pbcn exhibits a zT of approximately 0.45 under the same conditions. These values are slightly lower for the Pca21 polymorph, with values of 0.45 and 0.30 for n- and p-type, respectively, at 600 K.Pressure is an interesting variable to consider. PF increases with pressure (Fig. 5a), but the lattice thermal conductivity κl also increases (Fig. 2). These trends balance each other, so zT values do not change drastically with increased pressure. Although the maximum zT values do not change significantly, there are important qualitative changes in the way zT is optimized. For single crystal p-type BiN at 0 GPa, the alignment of the contour lines parallel to the x-axis suggests that increasing the carrier concentration is the most effective route to enhance zT. At 0 GPa, both polymorphs exhibit low thermal conductivities, so the limiting factor is the carrier concentration in order to improve PF and, consequently, zT. When pressure is increased, κl increases substantially, so increasing the temperature to reduce this parameter also plays an important role. This fact drastically changes the shape of the contour lines and the approach to optimize zT. At high temperatures, maximizing zT requires not only increasing the carrier concentrations but also the temperature. A similar trend is observed for n-type BiN. As discussed earlier, n-type exhibits larger PF even at low carrier concentrations, which is why κl plays an important role at 0 GPa as well. When pressure is increased to 12.5 GPa, the main variable becomes temperature and zTmax can be obtained at moderate carrier concentration (5 × 1020 cm−3) by increasing the temperature.
Optimizing the thermoelectric figure of merit, zT, of BiN requires considering additional variables beyond those discussed earlier. Until now, the predicted transport properties were considered for defect-free single crystals. However, most thermoelectric materials are synthesized and measured in polycrystalline form. Indeed, the microstructure plays a crucial role in determining the thermal and electronic transport properties of solids. Nanostructuring is a powerful strategy to optimize the thermoelectric efficiency of materials.37 The ideal scenario is finding a size range where thermal conductivity is reduced while the power factor, PF, is maintained. The effect of grain size on thermal conductivity is discussed based on a decomposition of the contributions to κl by the phonon mean free path.38 This approach has been widely used to theoretically investigate the nanostructuring effects on thermal transport in thermoelectric materials.39–41 The value of κl for a particular particle size, L, is approximated as the cumulative contributions for all mean free paths up to L, effectively subtracting the contributions from mean free paths longer than the particle size. On the other hand, for the electronic transport properties, an extra term is included in the calculation of the electron/hole scattering rate, which is proportional to v/L, where v is the group velocity of the electron/hole. When average grain size is considered as a variable, a new trend emerges. While grain size does not appear to significantly affect the zT values for the Pbcn polymorph, zT is substantially increased for the Pca21 polymorph at grain sizes below 100 nm for both p- and n-type samples. For the p-type Pca21 polymorph of BiN, zT can more than double at 600 K when the grain size is around 50–60 nm. This suggests that the electron and phonon mean free paths are quite similar for the Pbcn polymorph, whereas the phonon mean free paths for the Pca21 polymorph are large enough to reduce the lattice thermal conductivity without significantly modifying the power factor, PF.
Conclusions
This work presents a comprehensive exploration of the thermoelectric properties of BiN. A high-throughput framework has been applied to efficiently explore the transport properties of BiN as a function of temperature, pressure, grain size, carrier concentration, type of conduction, and polymorph. The electronic transport properties of these systems are influenced by important changes in the band gap, electron/hole mobility, and presence of secondary carrier pockets. Overall, BiN exhibits higher power factor values for high-pressure and p-type samples. Additionally, the thermal transport properties appear to be very sensitive to the applied pressure. Lattice thermal conductivity increases with pressure but in different ways for both polymorphs. The presence of optical modes with large group velocities causes the Pbcn polymorph to increase its κl at a faster pace with pressure. When both electronic and thermal transport properties are combined, zT of this material can be explored. Different strategies to optimize zT can be extracted for the two polymorphs. zT values around 0.85 can be obtained for n-type Pbcn BiN at 600 K and 0 GPa, which suggests the need to find strategies to stabilize the high-pressure phase at 0 GPa/low pressures. On the other hand, both p- and n-type Pca21 polymorph can exhibit zT values around 0.6–0.7 for polycrystalline samples with an average grain size around 50–60 nm at 600 K and 0 GPa. These zT values are similar to those of other well-known thermoelectric families of materials in the low-to-medium temperature range, such as oxychalcogenides,42 Bi2Te3,43 or lead chalcogenides,44 without toxic elements such Sb or Te, demonstrating the potential of undoped BiN for thermoelectric applications. Finally, but not the least, we note that chemical doping could further enhance thermoelectric performance, suggesting promising avenues for future research that will require a close collaboration between theory and experiment.Data availability
Data sets are available at the ZENODO repository (https://doi.org/10.5281/zenodo.14055923).Author contributions
J. J. P. and A. M. M. conceived and initiated the research project. E. R. R., M. M.-P. and V. P. performed all calculations. E. R. R., V. P. and J. J. P. performed all analysis presented in the main text, and wrote the first draft. K. G., A. M. M. and J. F. S. contributed to the data analysis and interpretation. A. M. M. and J. J. P. supervised the project. All authors discussed the results and contributed to the final paper.Conflicts of interest
There are no conflicts to declare.Acknowledgements
This work was funded by Spanish MICIN/AEI/10.13039/501100011033 and by European Union Next Generation EU/PRTR (grants TED2021-130874B-I00, PID2022-138063OB-I00). We thankfully acknowledge the computer resources at Lusitania and the technical support provided by Cénits-COMPUTAEX and Red Española de Supercomputación, RES (QHS-2023-1-0028).Notes and references
- A. K. Cheetham, R. Seshadri and F. Wudl, Nature Synth., 2022, 1, 514–520 CrossRef.
- H. Shirakawa, E. J. Louis, A. G. MacDiarmid, C. K. Chiang and A. J. Heeger, J. Chem. Soc. Chem. Commun., 1977, 578–580 RSC.
- H. Amano, M. Kito, K. Hiramatsu and I. Akasaki, Jpn. J. Appl. Phys., 1989, 28, L2112 CrossRef CAS.
- D. P. Tabor, L. M. Roch, S. K. Saikin, C. Kreisbeck, D. Sheberla, J. H. Montoya, S. Dwaraknath, M. Aykol, C. Ortiz, H. Tribukait, C. Amador-Bedolla, C. J. Brabec, B. Maruyama, K. A. Persson and A. Aspuru-Guzik, Nat. Rev. Mater., 2018, 3, 5–20 CrossRef CAS.
- N. J. Szymanski, B. Rendy, Y. Fei, R. E. Kumar, T. He, D. Milsted, M. J. McDermott, M. Gallant, E. D. Cubuk and A. Merchant, et al. , Nature, 2023, 1–6 CAS.
- J. Leeman, Y. Liu, J. Stiles, S. Lee, P. Bhatt, L. Schoop and R. Palgrave, ChemRxiv, 2024, preprint, DOI:10.26434/chemrxiv-2024-5p9j4.
- W. Zhou, S. Zhang, S. Guo, Y. Wang, J. Lu, X. Ming, Z. Li, H. Qu and H. Zeng, Phys. Rev. Appl., 2020, 13, 044066 CrossRef CAS.
- E. C. Franklin, J. Am. Chem. Soc., 1905, 27, 820–851 CrossRef CAS.
- K. Glazyrin, A. Aslandukov, A. Aslandukova, T. Fedotenko, S. Khandarkhaeva, D. Laniel, M. Bykov and L. Dubrovinsky, Front. Chem., 2023, 11, 1257942 CrossRef CAS PubMed.
- L.-D. Zhao, S.-H. Lo, Y. Zhang, H. Sun, G. Tan, C. Uher, C. Wolverton, V. P. Dravid and M. G. Kanatzidis, Nature, 2014, 508, 373–377 CrossRef CAS PubMed.
- E. J. Blancas, J. J. Plata, J. Santana, F. Lemus-Prieto, A. M. Márquez and J. F. Sanz, J. Mater. Chem. A, 2022, 10, 19941–19952 RSC.
- G. Kresse and J. Hafner, Phys. Rev. B: Condens. Matter Mater. Phys., 1993, 47, 558–561 CrossRef CAS.
- G. Kresse and J. Furthmüller, Phys. Rev. B: Condens. Matter Mater. Phys., 1996, 54, 11169–11186 CrossRef CAS PubMed.
- P. E. Blöchl, Phys. Rev. B: Condens. Matter Mater. Phys., 1994, 50, 17953–17979 CrossRef.
- J. P. Perdew, K. Burke and M. Ernzerhof, Phys. Rev. Lett., 1996, 77, 3865–3868 CrossRef CAS.
- C. E. Calderon, J. J. Plata, C. Toher, C. Oses, O. Levy, M. Fornari, A. Natan, M. J. Mehl, G. L. W. Hart, M. Buongiorno Nardelli and S. Curtarolo, Comput. Mater. Sci., 2015, 108 Part A, 233–238 CrossRef.
- F. Eriksson, E. Fransson and P. Erhart, Adv. Theory Simul., 2019, 2, 1800184 CrossRef.
- J. J. Plata, V. Posligua, A. M. Márquez, J. F. Sanz and R. Grau-Crespo, Chem. Mater., 2022, 34, 2833–2841 CrossRef CAS.
- E. Fransson, F. Eriksson and P. Erhart, npj Comput. Mater., 2020, 6, 135 CrossRef.
- W. Li, J. Carrete, N. A. Katcho and N. Mingo, Comput. Phys. Commun., 2014, 185, 1747–1758 CrossRef CAS.
- A. Ganose, J. Park, A. Faghaninia, R. Woods-Robinson, K. Persson and A. Jain, Nat. Commun., 2021, 12, 2222 CrossRef CAS PubMed.
- J. Heyd, G. E. Scuseria and M. Ernzerhof, J. Chem. Phys., 2006, 124, 219906 CrossRef.
- J. Santana-Andreo, A. M. Márquez, J. J. Plata, E. Blancas, J.-L. González-Sánchez, J. F. Sanz and N. Nath, ACS Appl. Mater. Interfaces, 2024, 16, 4606–4617 CrossRef CAS PubMed.
- A. E. Rosado-Miranda, V. Posligua, J. F. Sanz, A. M. Márquez, P. Nath and J. J. Plata, ACS Appl. Mater. Interfaces, 2024, 16, 28590–28598 CrossRef CAS.
- Y. Zhang, X. Jia, H. Sun, B. Sun, B. Liu, H. Lui, L. Kong and H. Ma, J. Alloys Compd., 2016, 667, 123–129 CrossRef CAS.
- N. V. Morozova, I. V. Korobeinikov and S. V. Ovsyannikov, J. Appl. Phys., 2019, 125, 220901 CrossRef.
- Z. Jellil and H. Ez-Zahraouy, Comput. Condens. Matter, 2024, 38, e00879 CrossRef.
- K. Kaur and R. Kumar, Chin. Phys. B, 2016, 25, 056401 CrossRef.
- H. Aliabad and B. Yalcin, J. Mater. Sci., 2017, 28, 14954–14964 Search PubMed.
- H. Aliabad, S. Rabbanifar and M. Khalid, Phys. B, 2019, 570, 100–109 CrossRef CAS.
- S. S. Essaoud, A. Bouhemadou, S. Maabed, S. Bin-Omran and R. Khenata, Philos. Mag., 2022, 102, 1522–1546 CrossRef.
- D. Zou, Y. Liu, S. Xie, J. Lin, H. Zheng and J. Li, RSC Adv., 2014, 4, 54819 RSC.
- J. Yue, S. Guo, J. Li, J. Zhao, C. Shen, H. Zhang, Y. Liu and T. Cui, Mater. Today Phys., 2023, 39, 101283 CrossRef CAS.
- M. G. Holland, Phys. Rev., 1964, 134, A471–A480 CrossRef.
- T. Feng, L. Lindsay and X. Ruan, Phys. Rev. B, 2017, 96, 161201 CrossRef.
- J. Paterson, S. Mitra, Y. Liu, M. Boukhari, D. Singhal, D. Lacroix, E. Hadji, A. Barski, D. Tainoff and O. Bourgeois, App. Phys. Lett., 2024, 124, 181902 CrossRef CAS.
- M. G. Kanatzidis, Chem. Mater., 2010, 22, 648–659 CrossRef CAS.
- Z. Wang, J. E. Alaniz, W. Jang, J. E. Garay and C. Dames, Nano Lett., 2011, 11, 2206–2213 CrossRef CAS.
- A. Aziz, P. Mangelis, P. Vaqueiro, A. V. Powell and R. Grau-Crespo, Phys. Rev. B, 2016, 94, 165131 CrossRef.
- G. Romano, K. Esfarjani, D. A. Strubbe, D. Broido and A. M. Kolpak, Phys. Rev. B, 2016, 93, 035408 CrossRef.
- J. Plata, E. Blancas, A. Márquez, V. Posligua, J. Fdez Sanz and R. Grau-Crespo, J. Mater. Chem. A, 2023, 11, 16734–16742 RSC.
- S. D. Luu and P. Vaqueiro, J. Materiomics, 2016, 2, 131–140 CrossRef.
- I. T. Witting, T. C. Chasapis, F. Ricci, M. Peters, N. A. Heinz, G. Hautier and G. J. Snyder, Adv. Electron. Mater., 2019, 5, 1800904 CrossRef.
- A. D. LaLonde, Y. Pei, H. Wang and G. J. Snyder, Mater. Today, 2011, 14, 526–532 CrossRef CAS.
Footnotes |
| † Electronic supplementary information (ESI) available. See DOI: https://doi.org/10.1039/d4ta05891g |
| ‡ These authors contributed equally to this work. |
| This journal is © The Royal Society of Chemistry 2025 |

