Illuminating cisplatin-induced ferroptosis in non-small-cell lung cancer with biothiol-activatable fluorescent/photoacoustic bimodal probes†
Li
Xu
a,
Hongwen
Liu
 b,
Yi
Kong
a,
Lingyun
Li
b,
Jia
Li
b,
Kang
Li
a,
Shuzhi
Liang
a and
Bolin
Chen
*a
b,
Yi
Kong
a,
Lingyun
Li
b,
Jia
Li
b,
Kang
Li
a,
Shuzhi
Liang
a and
Bolin
Chen
*a
aThe Second Department of Thoracic Oncology, Hunan Cancer Hospital/the Affiliated Cancer Hospital of Xiangya School of Medicine, Central South University, Changsha 410013, Hunan Province, P. R. China. E-mail: chenbolin@hnca.org.cn
bKey Laboratory of Light Energy Conversion Materials of Hunan Province College, College of Chemistry and Chemical Engineering, Hunan Normal University, Changsha 410081, P. R. China
First published on 5th November 2024
Abstract
Ferroptosis modulation represents a pioneering therapeutic approach for non-small-cell lung cancer (NSCLC), where precise monitoring and regulation of ferroptosis levels are pivotal for achieving optimal therapeutic outcomes. Cisplatin (Cis), a widely used chemotherapy drug for NSCLC, demonstrates remarkable therapeutic efficacy, potentially through its ability to induce ferroptosis and synergize with other treatments. However, in vivo studies of ferroptosis face challenges due to the scarcity of validated biomarkers and the absence of reliable tools for real-time visualization. Biothiols emerge as suitable biomarkers for ferroptosis, as their concentrations decrease significantly during this process. To address these challenges, fluorescence/photoacoustic (PA) bimodal imaging offers a promising solution by providing more accurate in vivo information on ferroptosis. Therefore, the development of methods to detect biothiols using fluorescence/PA bimodal imaging is highly desirable for visualizing ferroptosis in NSCLC. In this study, we designed and constructed two activatable near-infrared (NIR) fluorescent/PA bimodal imaging probes specifically for visualizing ferroptosis by monitoring the fluctuations in biothiol levels. These probes exhibited excellent bimodal response performance in solution, cells, and tumors. Furthermore, they were successfully applied for real-time monitoring of biothiol changes during the ferroptosis process in NSCLC cells and tumors. Importantly, our findings revealed that the combined use of erastin and cisplatin exacerbates the consumption of biothiols, suggesting an enhancement of ferroptosis in NSCLC. This work not only provides powerful tools for monitoring in vivo ferroptosis but also facilitates the study of ferroptosis mechanisms and holds the potential to further advance the treatment of NSCLC.
Introduction
Lung cancer stands as one of the most rapidly growing and impactful malignant tumors affecting human health, accounting for approximately 11.4% of all cancer cases and 18% of cancer-related deaths globally.1 Despite advancements in new lung cancer treatments, the situation remains dire, with a high one-year mortality rate and an overall five-year survival rate of only about 16%.1 Consequently, there is an urgent need for innovative therapeutic strategies for lung cancer. Recently, studies have shown promising results in utilizing ferroptosis modulation as a powerful therapeutic option for lung cancer.2–4 Ferroptosis is a unique form of programmed cell death, distinct from apoptosis and necrosis, and characterized by its dependence on iron.5 Several drugs have been proven effective in inducing ferroptosis to suppress lung cancer cell growth by depleting cysteine (Cys) or inactivating glutathione peroxidases (GPXs).6 The potential of manipulating ferroptosis for lung cancer therapy has garnered increasing attention.However, reliable research has also indicated that ferroptosis plays a dual role in both inhibiting and promoting pulmonary tumor growth.7–10 Particularly, ferroptosis can activate immunosuppression, facilitating the growth of non-small-cell lung cancer (NSCLC) A549 cells by mediating inflammatory responses.9 Lung tissue, exposed to higher oxygen concentrations compared to other tissues, subjects lung tumors to significant oxidative stress. To avoid facilitated ferroptosis during this oxidative stress, NSCLC cells adopt various pathways to increase the activation threshold of ferroptosis, thereby inhibiting ferroptosis and promoting the occurrence and development of NSCLC. Recent studies have confirmed that ferroptosis tends to be inhibited in NSCLC.2 Given this promising yet complex treatment strategy, and considering the dual role of ferroptosis in both promoting and inhibiting lung cancer, it is essential to investigate the molecular mechanism of ferroptosis and manipulate it effectively for the treatment of NSCLC. This holds significant potential for advancing lung cancer therapy.
Revealing the molecular events of ferroptosis in NSCLC, as well as its regulatory mechanism and signaling pathway, may provide more comprehensive theoretical guidance for the clinical administration of NSCLC. Based on extensive prior research studies, the intricate biochemical mechanisms underlying ferroptosis unfold through a meticulously orchestrated sequence of four pivotal steps: (i) suppression of system Xc− (cysteine/glutathione antiporter, xCT), (ii) severe depletion of glutathione (GSH) and glutathione peroxidase 4 (GPX4), (iii) lipid peroxidation and (iv) precipitous amassing of iron and reactive oxygen species (ROS) in cells. The synthesis pathway of GSH (the main biothiol in cancer cells) is inhibited and the depletion of GSH and other biothiols by ROS together leads to a dramatic decrease of GSH and total biothiol levels in cancer cells. Thus, it is well-accepted that GSH and total biothiol levels in NSCLC during ferroptosis will dramatically decrease. A very recent study reported in Science indicated that Cys depletion led to ferroptosis in pancreatic tumors in mice and rapidly reduced GSH levels in pancreatic ductal adenocarcinoma cells.11 The concentration dynamics of cysteine (Cys) within NSCLC cells during the enigmatic process of ferroptosis remain an uncharted territory, shrouded in mystery. In addition, real-time visual tracking of the ebb and flow of Cys and total biothiol levels, respectively, within NSCLC cells undergoing ferroptosis, is vital for regulating the degree of ferroptosis to obtain the best therapeutic effect of NSCLC. Therefore, by unlocking the secrets of Cys and total biothiol dynamics during ferroptosis, we stand at the cusp of a revolution in NSCLC treatment. This profound understanding will not only propel us forward in our quest to conquer this devastating disease but also pave the way for the development of novel, targeted therapies that harness the power of ferroptosis to bring hope and healing to countless patients.
Currently, the study of in vivo ferroptosis faces significant hurdles, primarily due to the absence of a validated, selective biomarker and the lack of sensitive tools for real-time monitoring in tumors. Given the advantages of fluorescent imaging technology, including high sensitivity, real-time capabilities, and nondestructive imaging,12–17 several fluorescent probes have been developed for studying ferroptosis in living cells.18–20 However, despite their good performance in living systems, the imaging penetration depth of these probes is limited by in vivo light scattering, leading to a significant decrease in spatial resolution as tissue depth increases.21 Photoacoustic (PA) imaging emerges as a promising imaging modality, offering high-resolution and high-contrast imaging in deep tissues through the combination of optical and ultrasound imaging.22–25 Consequently, the integration of fluorescence and PA imaging is particularly suited for studying in vivo ferroptosis. Despite advancements in developing probes for fluorescence/PA bimodal imaging of Cys or biothiols,26–32 the changes in Cys and total biothiols during ferroptosis in pulmonary tumors remain unknown. Therefore, there is an urgent need to develop novel fluorescent/PA bimodal probes for monitoring total biothiol and Cys levels during ferroptosis. This is crucial for unveiling the mechanism of ferroptosis and advancing the treatment of NSCLC.
In this work, accordingly, we have developed two biothiol-activatable near-infrared (NIR) fluorescent/PA bimodal imaging probes, named HR-DX and HR-BX, specifically tailored for imaging ferroptosis in NSCLC cells and tumors (Scheme 1). Both probes exhibited remarkable dual-modal response performance in detecting biothiols in solutions, cells, and tumors. They have been subsequently utilized successfully for real-time monitoring of total biothiol and Cys levels during the ferroptosis process in A549 cells. Furthermore, these probes have been applied with satisfactory results in bimodal imaging of ferroptosis in NSCLC tumors in mice. Importantly, our comprehensive results revealed an intriguing experimental finding: the combined use of erastin and cisplatin exacerbated the consumption of biothiols, potentially indicating an enhancement of ferroptosis in A549 cells and tumors. The development of these probes offers novel tools for monitoring biothiol level changes during ferroptosis, facilitating the investigation of in vivo ferroptosis mechanisms and further advancing the research and treatment of NSCLC.
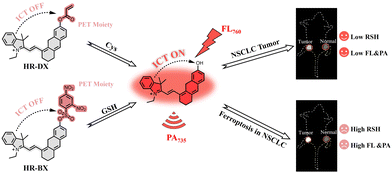 | ||
| Scheme 1 Design of the probes, their response mechanism with GSH or Cys, and their application in fluorescence/PA bimodal imaging for in vivo ferroptosis. | ||
Experimental section
The details of materials and measurements, spectroscopic measurements, cytotoxicity assay, cell culture and fluorescence imaging are presented in the ESI.†Synthesis
The brief synthesis procedure for the probes (HR-DX and HR-BX) is shown in Scheme S1 (ESI†), with the detailed synthesis processes provided below and characterization of compounds included in the ESI.†![[thin space (1/6-em)]](https://www.rsc.org/images/entities/char_2009.gif) :
:![[thin space (1/6-em)]](https://www.rsc.org/images/entities/char_2009.gif) EtOH (100
EtOH (100![[thin space (1/6-em)]](https://www.rsc.org/images/entities/char_2009.gif) :
:![[thin space (1/6-em)]](https://www.rsc.org/images/entities/char_2009.gif) 1 to 20
1 to 20![[thin space (1/6-em)]](https://www.rsc.org/images/entities/char_2009.gif) :
:![[thin space (1/6-em)]](https://www.rsc.org/images/entities/char_2009.gif) 1) as an eluent to afford NIR dye HR as a black solid (0.658 g, yield 53%). 1H NMR (500 MHz, CDCl3) δ 7.80 (d, J = 12.8 Hz, 1H), 7.43 (d, J = 9.2 Hz, 1H), 7.35 (t, J = 7.1, 5.9 Hz, 2H), 7.32 (s, 1H), 7.12 (t, J = 7.4 Hz, 1H), 7.03 (d, J = 2.1 Hz, 1H), 6.93–6.88 (m, 2H), 5.75 (d, J = 12.8 Hz, 1H), 3.93 (q, J = 7.2 Hz, 2H), 2.75 (t, J = 6.0 Hz, 2H), 2.66 (t, J = 5.9 Hz, 2H), 1.95 (p, J = 6.3 Hz, 2H), 1.75 (s, 6H), 1.40 (t, J = 7.2 Hz, 3H). ESI-HRMS calcd for C27H28NOS+ [M − I−]+ 414.1887, found 414. 1882.
1) as an eluent to afford NIR dye HR as a black solid (0.658 g, yield 53%). 1H NMR (500 MHz, CDCl3) δ 7.80 (d, J = 12.8 Hz, 1H), 7.43 (d, J = 9.2 Hz, 1H), 7.35 (t, J = 7.1, 5.9 Hz, 2H), 7.32 (s, 1H), 7.12 (t, J = 7.4 Hz, 1H), 7.03 (d, J = 2.1 Hz, 1H), 6.93–6.88 (m, 2H), 5.75 (d, J = 12.8 Hz, 1H), 3.93 (q, J = 7.2 Hz, 2H), 2.75 (t, J = 6.0 Hz, 2H), 2.66 (t, J = 5.9 Hz, 2H), 1.95 (p, J = 6.3 Hz, 2H), 1.75 (s, 6H), 1.40 (t, J = 7.2 Hz, 3H). ESI-HRMS calcd for C27H28NOS+ [M − I−]+ 414.1887, found 414. 1882.
![[thin space (1/6-em)]](https://www.rsc.org/images/entities/char_2009.gif) :
:![[thin space (1/6-em)]](https://www.rsc.org/images/entities/char_2009.gif) EtOH (100
EtOH (100![[thin space (1/6-em)]](https://www.rsc.org/images/entities/char_2009.gif) :
:![[thin space (1/6-em)]](https://www.rsc.org/images/entities/char_2009.gif) 1 to 40
1 to 40![[thin space (1/6-em)]](https://www.rsc.org/images/entities/char_2009.gif) :
:![[thin space (1/6-em)]](https://www.rsc.org/images/entities/char_2009.gif) 1) as an eluent to afford probe HR-DX as a dark purple solid (235 mg, yield 73%). 1H NMR (500 MHz, DMSO-d6): 8.89 (d, J = 2.7 Hz, 1H), 8.84–8.78 (m, 1H), 8.44 (dd, J = 9.3, 2.7 Hz, 1H), 8.32–8.26 (m, 2H), 7.55 (s, 1H), 7.53–7.49 (m, 2H), 7.28 (s, 2H), 7.10 (d, J = 8.7 Hz, 2H), 7.01 (m, 2H), 6.94 (m, 1H), 3.05 (q, J = 3.07 Hz, 2H), 2.83 (t, J = 2.81 Hz, 2H), 2.77 (t, J = 2.76 Hz, 2H), 1.97 (m, 2H), 1.77 (s, 6H), 1.54 (t, J = 1.52 Hz, 3H). 13C NMR (101 MHz, DMSO-d6) δ 178.76, 155.20, 154.11, 149.02, 145.55, 143.36, 142.89, 141.27, 140.58, 134.64, 134.53, 132.98, 130.31, 130.19, 129.61, 128.68, 128.12, 128.06, 127.88, 127.21, 125.43, 123.51, 123.01, 122.47, 122.36, 121.73, 119.93, 116.21, 114.53, 109.11, 108.90, 51.53, 46.16, 41.58, 34.33, 32.23, 27.59, 27.49, 26.85, 24.53, 20.35, 13.56, 13.02, 9.06. ESI-HRMS calcd for C30H30NO2S+ [M − I−]+ 644.1520, found 644.1495.
1) as an eluent to afford probe HR-DX as a dark purple solid (235 mg, yield 73%). 1H NMR (500 MHz, DMSO-d6): 8.89 (d, J = 2.7 Hz, 1H), 8.84–8.78 (m, 1H), 8.44 (dd, J = 9.3, 2.7 Hz, 1H), 8.32–8.26 (m, 2H), 7.55 (s, 1H), 7.53–7.49 (m, 2H), 7.28 (s, 2H), 7.10 (d, J = 8.7 Hz, 2H), 7.01 (m, 2H), 6.94 (m, 1H), 3.05 (q, J = 3.07 Hz, 2H), 2.83 (t, J = 2.81 Hz, 2H), 2.77 (t, J = 2.76 Hz, 2H), 1.97 (m, 2H), 1.77 (s, 6H), 1.54 (t, J = 1.52 Hz, 3H). 13C NMR (101 MHz, DMSO-d6) δ 178.76, 155.20, 154.11, 149.02, 145.55, 143.36, 142.89, 141.27, 140.58, 134.64, 134.53, 132.98, 130.31, 130.19, 129.61, 128.68, 128.12, 128.06, 127.88, 127.21, 125.43, 123.51, 123.01, 122.47, 122.36, 121.73, 119.93, 116.21, 114.53, 109.11, 108.90, 51.53, 46.16, 41.58, 34.33, 32.23, 27.59, 27.49, 26.85, 24.53, 20.35, 13.56, 13.02, 9.06. ESI-HRMS calcd for C30H30NO2S+ [M − I−]+ 644.1520, found 644.1495.
![[thin space (1/6-em)]](https://www.rsc.org/images/entities/char_2009.gif) :
:![[thin space (1/6-em)]](https://www.rsc.org/images/entities/char_2009.gif) EtOH (100
EtOH (100![[thin space (1/6-em)]](https://www.rsc.org/images/entities/char_2009.gif) :
:![[thin space (1/6-em)]](https://www.rsc.org/images/entities/char_2009.gif) 1 to 40
1 to 40![[thin space (1/6-em)]](https://www.rsc.org/images/entities/char_2009.gif) :
:![[thin space (1/6-em)]](https://www.rsc.org/images/entities/char_2009.gif) 1) as an eluent to afford probe HR-BX as a dark purple solid (135 mg, yield 58%). 1H NMR (500 MHz, DMSO-d6) δ 8.28 (d, J = 14.8 Hz, 1H), 8.09 (d, J = 13.9 Hz, 1H), 7.87 (d, J = 7.3 Hz, 1H), 7.83 (d, J = 7.9 Hz, 1H), 7.61 (t, J = 7.6 Hz, 1H), 7.49 (t, J = 7.6 Hz, 1H), 7.42 (s, 1H), 7.37 (t, J = 7.1 Hz, 1H), 7.32 (s, 1H), 6.91 (d, J = 4.2 Hz, 1H), 6.84 (d, J = 7.9 Hz, 1H), 6.47 (d, J = 10.5 Hz, 1H), 6.23 (d, J = 10.4 Hz, 1H), 4.55 (q, J = 6.8 Hz, 2H), 2.67 (t, 4H), 1.89–1.81 (m, 2H), 1.77 (s, 6H), 1.41 (t, J = 7.1 Hz, 3H). 13C NMR (101 MHz, CDCl3) 8.35, 8.31, 7.57, 7.55, 7.53, 7.50, 7.48, 7.46, 7.44, 7.40, 7.39, 7.22, 7.18, 7.15, 7.14, 7.13, 7.12, 7.00, 6.69, 6.65, 6.13, 6.10, 4.91, 2.95, 2.79, 2.77, 2.76, 1.99, 1.80, 1.30, 1.27. 13C NMR (101 MHz, CDCl3) δ 165.25, 160.04, 154.64, 152.83, 136.94, 133.09, 131.68, 129.30, 121.37, 118.57, 117.22, 115.03, 107.97, 71.96, 70.89, 70.65, 70.63, 70.54, 69.67, 67.57, 59.05, 29.68, 13.00. ESI-HRMS calcd for C30H30NO2S+ [M − I−]+ 468.1992, found 468.1992.
1) as an eluent to afford probe HR-BX as a dark purple solid (135 mg, yield 58%). 1H NMR (500 MHz, DMSO-d6) δ 8.28 (d, J = 14.8 Hz, 1H), 8.09 (d, J = 13.9 Hz, 1H), 7.87 (d, J = 7.3 Hz, 1H), 7.83 (d, J = 7.9 Hz, 1H), 7.61 (t, J = 7.6 Hz, 1H), 7.49 (t, J = 7.6 Hz, 1H), 7.42 (s, 1H), 7.37 (t, J = 7.1 Hz, 1H), 7.32 (s, 1H), 6.91 (d, J = 4.2 Hz, 1H), 6.84 (d, J = 7.9 Hz, 1H), 6.47 (d, J = 10.5 Hz, 1H), 6.23 (d, J = 10.4 Hz, 1H), 4.55 (q, J = 6.8 Hz, 2H), 2.67 (t, 4H), 1.89–1.81 (m, 2H), 1.77 (s, 6H), 1.41 (t, J = 7.1 Hz, 3H). 13C NMR (101 MHz, CDCl3) 8.35, 8.31, 7.57, 7.55, 7.53, 7.50, 7.48, 7.46, 7.44, 7.40, 7.39, 7.22, 7.18, 7.15, 7.14, 7.13, 7.12, 7.00, 6.69, 6.65, 6.13, 6.10, 4.91, 2.95, 2.79, 2.77, 2.76, 1.99, 1.80, 1.30, 1.27. 13C NMR (101 MHz, CDCl3) δ 165.25, 160.04, 154.64, 152.83, 136.94, 133.09, 131.68, 129.30, 121.37, 118.57, 117.22, 115.03, 107.97, 71.96, 70.89, 70.65, 70.63, 70.54, 69.67, 67.57, 59.05, 29.68, 13.00. ESI-HRMS calcd for C30H30NO2S+ [M − I−]+ 468.1992, found 468.1992.
In vivo imaging
Experimental details of in vivo imaging are listed in the ESI,† Live cells and live mouse experiments were in agreement with institutional animal care and use regulations, according to protocol No. SYXK (Xiang) 2020-0012, approved by the Laboratory Animal Center of Hunan.Results and discussion
Rational design and synthesis
As previously mentioned, GSH and Cys exhibit direct associations with ferroptosis in NSCLC. In this study, biothiols, including GSH and Cys, were utilized as biomarkers to facilitate NIR fluorescence/PA bimodal imaging for ferroptosis in NSCLC. To achieve biothiol-activatable bimodal imaging, two probes, HR-DX and HR-BX, were developed. These probes (depicted in Scheme 1 and Scheme S1, ESI†) consist of a dye (SHD) that exhibits NIR fluorescence and enhanced PA signals, serving as the chromophore. Additionally, the probes feature the 2,4-dinitrobenzenesulfonyl group and acrylate functional group, which serve as recognition sites for total biothiols and Cys, respectively. In the case of probe HR-DX, the NIR fluorescent signal of the chromophore is quenched due to the combination of intramolecular charge transfer (ICT) and photo-induced electron transfer (PET) mechanisms. This quenching is facilitated by the protection of the phenolic hydroxyl group by the 2,4-dinitrobenzenesulfonyl group, accompanied by short wavelength maximum absorption. Conversely, in probe HR-BX, the NIR fluorescent signals of the chromophore are suppressed primarily by ICT, resulting in slight inherent fluorescence due to a moderate decrease in the electron-donating ability of the electron-donating group. Upon activation by biothiols, the NIR fluorophore (SHD) with NIR fluorescent/PA bimodal signals is released from both probes, enabling a dual modal response to biothiols. These probes were initially applied for fluorescence/PA bimodal imaging of total biothiols during ferroptosis in NSCLC, surpassing previously reported biothiol probes listed in Table S1 (ESI†). The detailed reaction methods are provided in the ESI.† All new compounds were confirmed through 1H/13C NMR and HRMS, with characterization diagrams presented. Briefly, the hemicyanine dyes S-HDs were synthesized following previously reported methods.34–36 Commercial 2,4-dinitrobenzenesulfonyl chloride or acryloyl chloride was attached to hydroxyl hemicyanine via a nucleophilic reaction to yield the probe HR-DX or HR-BX, respectively.Spectral studies of probes
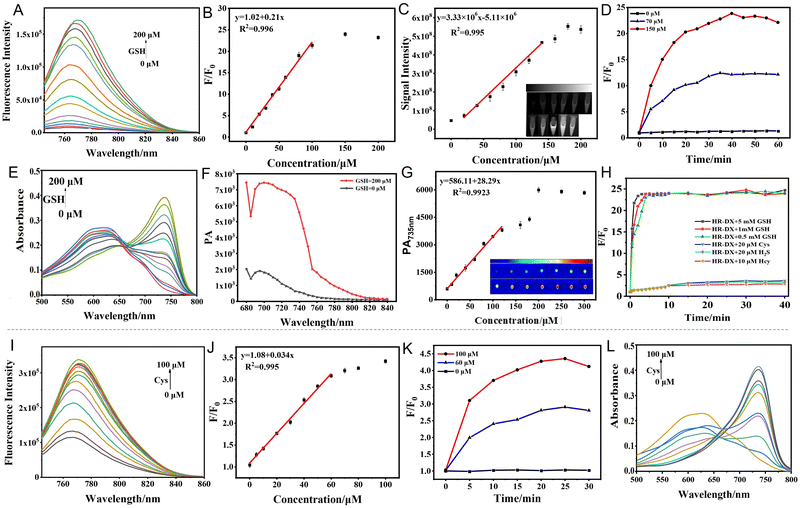
The response performance of HR-DX toward biothiols was investigated and evaluated by UV-vis absorption, fluorescence spectroscopy, and fluorescence and PA imaging, and the response mechanism is displayed in Scheme S2 (ESI†). First, the NIR fluorescence/PA bimodal responses of HR-DX to GSH were investigated (Fig. 1). As the concentration of GSH increased gradually (0–200 µM), the fluorescence of test samples was discovered with a maximum 25-fold fluorescence enhancement at 765 nm (Fig. 1A), which illustrated that HR-DX possesses a good response to GSH. The parallel working curve is shown in Fig. 1B, with the limit of detection (LOD) being 6.1 µM. The linear relationship was also measured using an in vivo imaging system so as to estimate whether HR-DX is suitable for in vivo semiquantitative analysis. In the GSH concentration range of 20–140 µM, there was a good linear relationship (R2 = 0.995) between the signal intensity and GSH concentration (Fig. 1C) with the limit of detection (LOD) calculated to be 11.7 µM, which is sensitive enough for monitoring the concentration change of GSH within NSCLC cells. Then, the reaction kinetics was studied (Fig. 1D), and the results showed that HR-DX exhibited strong fluorescence within 30 min, indicating that it is capable of detecting GSH rapidly.The 5 µM probe alone showed a maximum absorption peak at 620 nm (Fig. 1E), while in the presence of GSH, similar changes in the absorption profile could be observed, exhibiting gradually increased absorbance at 735 nm with the enhancement of the ICT effect. Meanwhile, the PA behavior of HR-DX in response to GSH was examined, which was similar to the absorption spectrum that the PA signal of the test solution at 735 nm displayed the obvious enhancement after adding GSH (Fig. 1F). Meanwhile, the PA titration experiment was performed (Fig. 1G), with the results indicating that PA intensity at 735 nm increased gradually along with raising the amount of GSH and presented a good linear relationship in the concentration range of 0–140 µM. The calculated PA LOD of 14.3 µM is higher than the fluorescence detection results due to the low sensitivity of PA imaging but is still sensitive enough for imaging GSH in NSCLC.23 It was worth pointing out that at physiological concentrations, due to the highest concentration of GSH (∼10 mM), the response rate and fluorescence enhancement of HR-DX to GSH were significantly faster than the other three biothiols (Cys, Hcy and H2S) (Fig. 1H). Therefore, we could basically affirm that the signal enhancement of cellular and tumor imaging using HR-DX will be substantially caused by GSH, and the extent of signal enhancement will be mainly decided by the level of GSH in cells and in vivo. Also, the effect of pH (4.0–8.0) on the reaction of HR-DX with GSH was also inspected (Fig. S1A, ESI†). Following a similar procedure, the responses of HR-DX to the other biothiols (Cys, Hcy and H2S) were also tested with the results shown in Fig. S2–S5 (ESI†). The results demonstrated that HR-DX showed similar response performance to Hcy and Cys compared to GSH, but H2S at high content (>150 µM) may induce the destruction of the probe via a nucleophilic addition reaction. For the other three biothiols (Cys, Hcy and H2S), the linear ranges of detection by HR-DX for fluorescence imaging were respectively located in 20–180 µM, 20–200 µM, and 50–180 µM, and the three LODs were 7.3 µM, 10.5 µM, and 11.2 µM, respectively; the calculated PA LODs of HR-DX toward Cys, Hcy and H2S were 8.4 µM, 10.7 µM, and 12.3 µM, respectively. These results further indicated that HR-DX is not sensitive enough for the imaging of Cys, Hcy and H2S in living cells and tumors as their physiological concentrations are in the ∼20 µM range.36,37 The selectivity test is shown in Fig. S1B and C (ESI†), and the results indicated that HR-DX has excellent selectivity towards biothiols. All the in vitro results demonstrated that HR-DX is highly desired for the detection and imaging of GSH in NSCLC during ferroptosis.
After conducting a thorough investigation, we examined the responses of HR-BX to Cys, adhering to a procedure akin to the one previously described (Fig. 1I–L, and Fig. S6 and S7, ESI†). Compared to the previously documented probes utilizing acrylate groups as recognition sites for Cys, HR-BX exhibited acceptable NIR fluorescence responses toward Cys, albeit with limited sensitivity (with a limit of detection, LOD, calculated to be 2.4 µM; Fig. 1I and J). Notably, the response time amounted to approximately 15 minutes (Fig. 1K). In the presence of Cys, a gradual increase in absorption at 735 nm in the absorption spectra was evident, attributed to the enhancement of the ICT effect (Fig. 1L). Subsequently, we assessed the PA performance of HR-BX towards Cys (Fig. S6A, ESI†). Consistent with the absorption spectrum, the PA signal at 735 nm in the test sample demonstrated the most significant increase upon the addition of Cys. Furthermore, a PA titration experiment was conducted (Fig. S6B, ESI†), revealing a gradual enhancement of PA intensity at 735 nm as the Cys concentration increased. This enhancement exhibited a good linear relationship within the Cys concentration range of 0–100 µM, with a calculated PA LOD of 3.6 µM. The results of the pH effect test confirmed that HR-BX is suitable for Cys detection within the physiological pH range (Fig. S6C, ESI†). Additionally, the selectivity test demonstrated that HR-BX possesses good selectivity for Cys (Fig. S6D and S7, ESI†). Despite the probe's slight background fluorescence, which contributes to its relatively lower sensitivity, HR-BX remains capable of monitoring concentration changes of endogenous Cys in tumor cells, given that the Cys level in tumor cells is approximately 20 µM.37–39 Consequently, HR-BX is well-suited for the fluorescence/PA dual-modal imaging of Cys in NSCLC during ferroptosis.
Imaging of endogenous biothiols in NSCLC
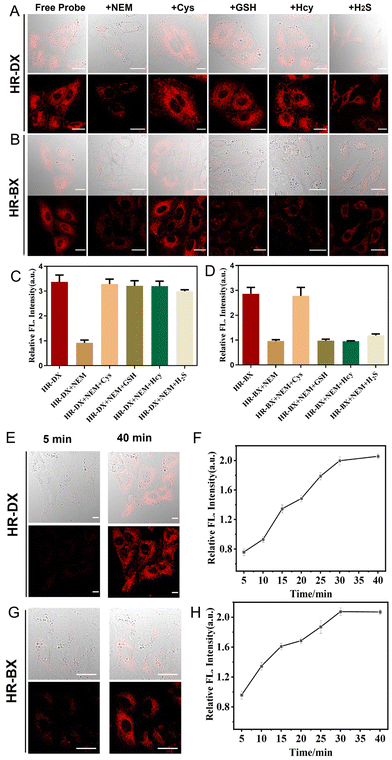
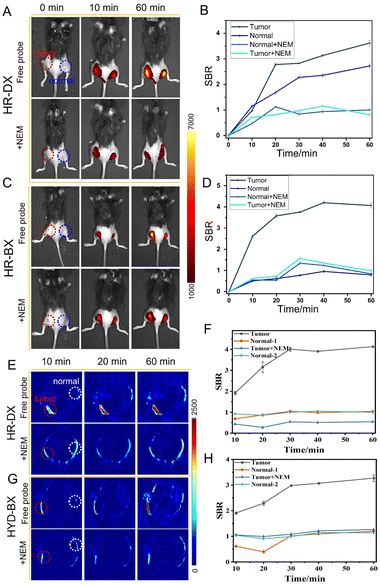
Based on the exceptional performance of the probes in vitro for sensing GSH and Cys, in vivo imaging experiments were conducted to verify their capacity to visualize biothiol levels in NSCLC, specifically A549 cells and A549-subcutaneous tumors. Initially, the cytotoxicity of the probes was assessed. Fig. S8 (ESI†) demonstrates that the probes exhibited low cytotoxicity to live cancer cells, including A549 and HepG2 cells, as evidenced by their good cell viability. As illustrated in Fig. 2A–D, the groups treated solely with HR-DX or HR-BX, respectively, displayed robust fluorescence. However, when the cells were pretreated with N-ethylmaleimide (NEM), a biothiol-depleting agent, followed by incubation with HR-DX or HR-BX, a significant decrease in fluorescence signal was observed. This reduction was attributed to the removal of endogenous biothiols by NEM. For cells incubated with HR-DX, subsequent addition of the four biothiol species (Cys, GSH, Hcy, and H2S) after NEM treatment resulted in intense fluorescence. In contrast, for HR-BX, only the addition of Cys following NEM treatment led to an enhancement in fluorescence. These findings indicated that HR-DX and HR-BX can selectively image intracellular total biothiols and Cys, respectively. To further confirm the practicality of the imaging capabilities of HR-DX and HR-BX, these probes were also applied to HepG2 cells, yielding similar results as observed in Fig. S9 (ESI†). Additionally, real-time imaging of endogenous GSH with HR-DX and Cys with HR-BX in cancer cells (A549 and HepG2) was under investigation, as shown in Fig. 2E, 2F, and Fig. S10–S12 (ESI†). The figures indicated that the fluorescence intensities of the cancer cells treated with HR-DX or HR-BX gradually increased over time and reached saturation within approximately 30 minutes.Having verified the splendid imaging capability of the probes in A549 cells, further experiments were conducted on the fluorescence/PA integrated imaging performance in the A549-tumor. Monitoring of endogenous GSH or Cys in the A549-tumor-bearing mice with HR-DX or HR-BX was first explored via NIR fluorescence imaging (Fig. 3 and Fig. S13, ESI†). As shown in the first row of Fig. 3A and B, after intra-tumoral injection of HR-DX or HR-BX, respectively, into both the tumour and normal tissue simultaneously, the fluorescence intensity in the tumour remarkably increased as time went on, and the SBR (normal or tumour/blank) was about 3.5 and 4.1 after 60 min for HR-DX and HR-BX, respectively, while the fluorescence intensity in the normal tissue enhanced mildly (SBR is approximately 2.3) due to the high concentration of GSH in the normal cells. When the tumor and the normal tissue were pretreated with 5 mM NEM for 30 min and then injected with HR-DX, the fluorescence intensity in the tumor was obviously suppressed and kept at a comparatively low level. For tumor imaging with HR-BX, comparable trends in fluorescence intensity have been monitored (Fig. 3C and D). The normal tissue displayed a limited signal increase due to the low concentration of Cys in the normal cells. The above results indicated that HR-DX and HR-BX possess the instinct of visualizing changes in the level of GSH or Cys in tumors through NIR fluorescence imaging. Then, PA imaging of endogenous GSH and Cys in the tumor-bearing mice with the probes was also carried out. Due to the complexity of PA imaging operations, it is very difficult to obtain the signal intensity at 0 min point of injection of the probes. Thus, for PA imaging, we started collecting images at 10 minutes. As displayed in Fig. 3E, 3G and Fig. S14 (ESI†), after intra-tumoral injection of HR-DX into both the tumor and normal tissue simultaneously, the PA intensity in the tumor significantly increased over time, while the PA intensity in the normal tissue remained at a relatively low level. When the tumor or normal tissues were pretreated with 5 mM NEM for 30 min and then injected with HR-DX, the PA intensity in the tumor was sharply reduced and kept at a quite low level, which was similar to that of normal tissue. For tumor imaging with HR-BX, comparable trends in PA intensity have been observed (Fig. 3F and H). These results demonstrated that the probes were able to monitor changes in the concentration of GSH and Cys in the A549-tumor via PA imaging.
Ferroptosis induced negative biothiol fluctuations in NSCLC
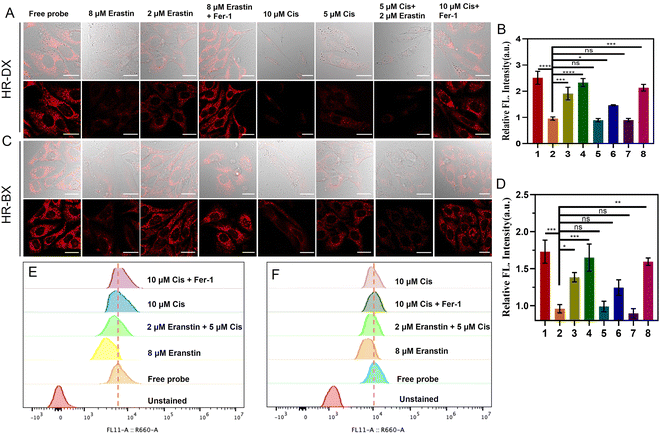
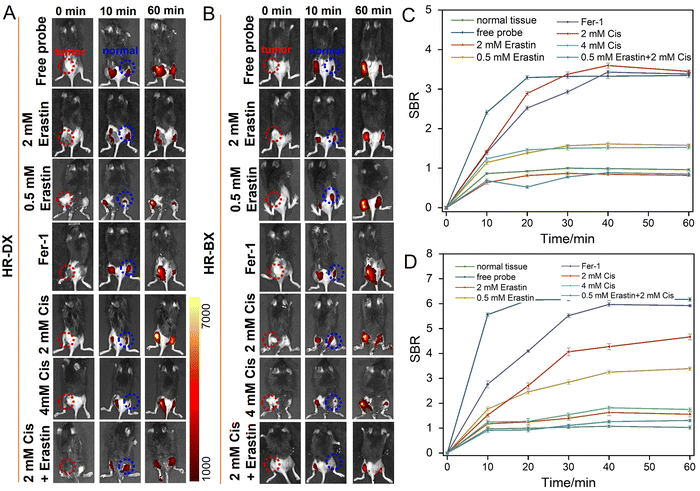
Biothiols are closely related to many physiological and pathological processes. Recent works demonstrated that ferroptosis in NSCLC is usually accompanied by abnormal content and metabolism disturbance of biothiols. Erastin, a ferroptosis inducer, was used for arousing ferroptosis in NSCLC, and further depressing GSH production and consuming the biothiols by accumulated ROS. Besides, the antitumor drug, cisplatin was proved to induce ferroptosis in NSCLC.10 Hence, erastin and cisplatin were used to induce negative biothiol fluctuations in NSCLC cells, and the probes were used to evaluate the degree of ferroptosis. First, we investigated the association between the amount of erastin and the extent of ferroptosis using HR-DX. As shown in Fig. S14 (ESI†), the fluorescence intensity in A549 cells decreased with the enhancement of the content of erastin added, and indicated that 8 µM erastin induced a dramatic signal decrease compared to the cells pretreated with 2 µM erastin, which verified that HR-DX can be employed to visualize the degree of ferroptosis in NSCLC. Then we use the optimized conditions for later experiments. As shown in Fig. 4A–D, the A549 cells treated with only HR-DX or HR-BX exhibited strong fluorescence. When the cells were treated with 8 µM erastin and then incubated with HR-DX or HR-BX, comparably weak fluorescence was observed, which is mainly because of the suppression of GSH production and the depletion of biothiols by catastrophic accumulation of ROS during ferroptosis. Meanwhile, when the A549 cells were pre-treated with erastin and Fer-1 (ferroptosis inhibitor) together for 4 h, followed by treatment with the probes for another 30 min before imaging proceeded, compared to the group treated only with erastin, the cells showed significant fluorescence, which was because that ferroptosis was inhibited and the production of ROS was suppressed. Mover, recent reports indicated that cisplatin (Cis) is an inducer of ferroptosis and apoptosis in A549 cells. The depletion of GSH and inactivation of GPX4 caused by cisplatin play an important role in its mechanism. As displayed in Fig. 4, the A549 cells were treated with 10 µM cisplatin for 12 h followed by treatment with the probe for another 30 min before cell imaging and flow cytometry experiment. The signal intensity of A549 cells incubated with HR-BX or HD-DX, respectively, showed an obvious decrease with significant differences from those of the free probes. For the A549 cells treated with 5 µM cisplatin for 12 h followed by treatment with the probe for another 30 min, the signal intensity of A549 cells incubated with HD-DX showed a slight decrease. This is mainly due to the high level of GSH in A549 cells, which helps the cells resist oxidative stress. We further investigated the association between the combined ferroptosis inducer (cisplatin) and the degree of ferroptosis using these two probes (fifth to eighth rows of Fig. 4A and C). Surprisingly, when the A549 cells were pre-treated with combination of 5 µM cisplatin and 2 µM erastin, compared to those groups with only 2 µM erastin or 5 µM cisplatin treated, the cells showed observable decreased fluorescence signal, which reflected that ferroptosis was magnified by the combined use of erastin and cisplatin compared to the two used alone. These results were further confirmed by flow cytometry (Fig. 4E and F). It should be pointed out that HR-BX showed moderate performance in monitoring ferroptosis probably due to its low signal-to-background ratio.Finally, we conducted in vivo imaging of ferroptosis in tumor-bearing mice. As depicted in Fig. 5, these mice were categorized into seven distinct groups based on their administration protocols. The first row of Fig. 5A, B and Fig. S15 (ESI†) illustrated that upon intra-tumoral injection of the probes, the fluorescence intensity within the tumors increased progressively over time. Notably, the significant enhancement in signal within normal tissues is primarily attributed to the high glutathione (GSH) levels in normal cells, which hindered the distinction between tumors and normal tissues when using HR-DX. Intriguingly, when the tumors were pretreated with 2 mM erastin for 4 hours prior to probe injection, the fluorescence intensity in the tumors decreased markedly and remained at a relatively low level. In contrast, pretreatment with 0.5 mM erastin led to a slight decrease in the fluorescence signal. When the tumors were pretreated with both 2 mM erastin for 4 hours and Fer-1 for an additional 4 hours (fourth row), followed by probe injection, the fluorescence intensity in the tumors was significantly elevated compared to those in the group pretreated solely with 2 mM erastin. To further emphasize the cisplatin-induced ferroptosis in vivo, we explored the relationship between the combined use of cisplatin and a ferroptosis inducer and the degree of ferroptosis using our probes (fifth to seventh rows). When tumors were treated with 2 mM or 4 mM cisplatin for 24 hours before probe administration, only the latter exhibited a moderate decrease in signal. This phenomenon was intensified when the tumors were pretreated with 0.5 mM erastin, suggesting that the combined use of erastin and cisplatin exacerbates the depletion of biothiols in tumors.
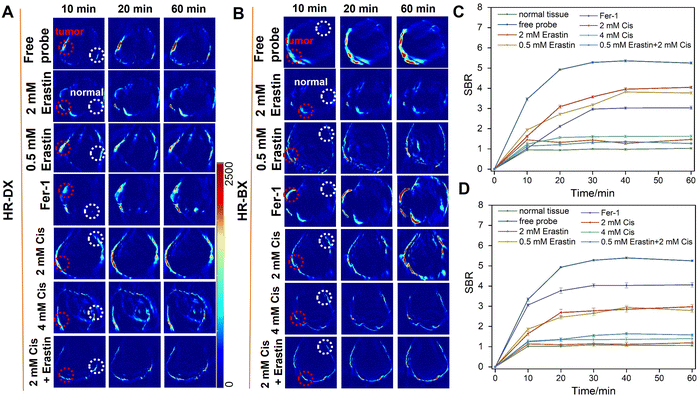
The PA imaging technique offers superior penetration depth and spatial resolution compared to NIR fluorescence imaging. By integrating the strengths of fluorescence and PA bimodal imaging and cross-verifying their results, we can obtain more comprehensive information about in vivo ferroptosis. Consequently, PA imaging was also employed to visualize in vivo ferroptosis using a similar approach. As illustrated in Fig. 6 and Fig. S16 (ESI†), the PA imaging experiments with HR-DX and HR-BX exhibited trends that were consistent with those observed in the fluorescence imaging experiments. A comparative analysis of signal-to-background ratios (SBRs) among the various groups revealed that the probes were effective in monitoring ferroptosis in tumors. These findings demonstrated that HR-DX and HR-BX are capable of performing NIR fluorescence/PA bimodal imaging of ferroptosis in NSCLC. Notably, an interesting experimental observation was that the combined use of erastin and cisplatin exacerbated the consumption of biothiols, potentially indicating an enhancement of ferroptosis in A549 tumors.
Conclusions
In summary, this work introduces a novel molecular tool designed to visualize in vivo ferroptosis in NSCLC, a cutting-edge therapeutic approach. We developed two activatable NIR fluorescent/PA bimodal imaging probes capable of monitoring ferroptosis by detecting fluctuations in biothiol levels. These probes demonstrated exceptional bimodal response performance in solutions, cells, and tumors. Furthermore, they have been utilized for real-time monitoring of biothiol level changes during the ferroptosis process in NSCLC cells and tumors. The imaging results unequivocally demonstrated the probes’ ability to visualize in vivo ferroptosis in NSCLC cells. Notably, our comprehensive findings revealed an intriguing observation: the combined use of erastin and cisplatin exacerbated the depletion of biothiols, suggesting an enhancement of ferroptosis in A549 cells and tumors. Consequently, this work not only contributes to the mechanistic understanding of biothiol roles in ferroptosis but also holds potential to advance NSCLC treatment through ferroptosis modulation.Author contributions
Li Xu: investigation, methodology, data curation, revised the manuscript. Hongwen Liu: investigation, writing – review & editing. Yi Kong: investigation, formal analysis. Lingyun Li: data curation, formal analysis. Jia Li: investigation. Kang Li: data curation. Shuzhi Liang: data curation. Bolin Chen: funding acquisition, conceptualization, supervision, review & editing.Data availability
The synthesis details of all compounds, NMR and MS spectra for all compounds, additional experimental details/materials/methods/data, and imaging methods and data are available.Conflicts of interest
There are no conflicts to declare.Acknowledgements
This work was supported by the Hunan Provincial Natural Science Foundation of China (2023JJ30369) and the Hunan Cancer Hospital Climb Plan (IIT2021001).References
- H. Sung, J. Ferlay, R. L. Siegel, M. Laversanne, I. Soerjomataram, A. Jemal and F. Bray, Ca-Cancer J. Clin., 2021, 71, 209–249 CrossRef PubMed.
- S. W. Alvarez, V. O. Sviderskiy, E. M. Terzi, T. Papagiannakopoulos, A. L. Moreira, S. Adams, D. M. Sabatini, K. Birsoy and R. Possemato, Nature, 2017, 551, 639–643 CrossRef CAS.
- Q. Zhang, H. Yi, H. Yao, L. Lu, G. He, M. Wu, C. Zheng, Y. Li, S. Chen, L. Li, H. Yu, G. Li, X. Tao, S. Fu and X. Deng, J. Cancer, 2021, 12, 4075–4085 CrossRef CAS PubMed.
- H. Wang, D. Lin, Q. Yu, Z. Li, C. Lenahan, Y. Dong, Q. Wei and A. Shao, Front. Cell Dev. Bio., 2021, 9, 629150 CrossRef.
- F. Zeng, S. Nijiati, L. Tang, J. Ye, Z. Zhou and X. Chen, Angew. Chem., Int. Ed., 2023, 62, e202300379 CrossRef CAS PubMed.
- N. Xing, Q. Du, S. Guo, G. Xiang, Y. Zhang, X. Meng, L. Xiang and S. Wang, Cell Death Discovery, 2023, 9, 110 CrossRef CAS.
- P. Chen, Q. Wu, J. Feng, L. Yan, Y. Sun, S. Liu, Y. Xiang, M. Zhang, T. Pan, X. Chen, T. Duan, L. Zhai, B. Zhai, W. Wang, R. Zhang, B. Chen, X. Han, Y. Li, L. Chen, Y. Liu, X. Huang, T. Jin, W. Zhang, H. Luo, X. Chen, Y. Li, Q. Li, G. Li, Q. Zhang, L. Zhuo, Z. Yang, H. Tang, T. Xie, X. Ouyang and X. Sui, Signal Transduction Targeted Ther., 2020, 5, 51 CrossRef CAS.
- L. Jiang, N. Kon, T. Li, S.-J. Wang, T. Su, H. Hibshoosh, R. Baer and W. Gu, Nature, 2015, 520, 57–62 CrossRef CAS PubMed.
- R. Kim, A. Hashimoto, N. Markosyan, V. A. Tyurin, Y. Y. Tyurina, G. Kar, S. Fu, M. Sehgal, L. Garcia-Gerique, A. Kossenkov, B. A. Gebregziabher, J. W. Tobias, K. Hicks, R. A. Halpin, N. Cvetesic, H. Deng, L. Donthireddy, A. Greenberg, B. Nam, R. H. Vonderheide, Y. Nefedova, V. E. Kagan and D. I. Gabrilovich, Nature, 2022, 612, 338–346 CrossRef CAS PubMed.
- J. Guo, B. Xu, Q. Han, H. Zhou, Y. Xia, C. Gong, X. Dai, Z. Li and G. Wu, Cancer Res. Treat., 2018, 50, 445–460 CrossRef CAS PubMed.
- M. A. Badgley, D. M. Kremer, H. C. Maurer, K. E. DelGiorno, H. J. Lee, V. Purohit, I. R. Sagalovskiy, A. Ma, J. Kapilian, C. E. M. Firl, A. R. Decker, S. A. Sastra, C. F. Palermo, L. R. Andrade, P. Sajjakulnukit, L. Zhang, Z. P. Tolstyka, T. Hirschhorn, C. Lamb, T. Liu, W. Gu, E. S. Seeley, E. Stone, G. Georgiou, U. Manor, A. Iuga, G. M. Wahl, B. R. Stockwell, C. A. Lyssiotis and K. P. Olive, Science, 2020, 368, 85–89 CrossRef CAS PubMed.
- H.-W. Liu, L. Chen, C. Xu, Z. Li, H. Zhang, X.-B. Zhang and W. Tan, Chem. Soc. Rev., 2018, 47, 7140–7180 RSC.
- S. Zeng, X. Liu, Y. S. Kafuti, H. Kim, J. Wang, X. Peng, H. Li and J. Yoon, Chem. Soc. Rev., 2023, 52, 5607–5651 RSC.
- H. Li, H. Kim, F. Xu, J. Han, Q. Yao, J. Wang, K. Pu, X. Peng and J. Yoon, Chem. Soc. Rev., 2022, 51, 1795–1835 RSC.
- X. Zhang, F. Yu, Z. Wang, T. Jiang, X. Song and F. Yu, Sens. Diagn., 2023, 2, 1077–1096 RSC.
- Y. Yue, T. Zhao, Z. Xu, W. Chi, X. Chai, J. Ai, J. Zhang, F. Huo, R. M. Strongin and C. Yin, Adv. Sci., 2023, 10, 2205080 CrossRef CAS.
- Y. Wen, N. Jing, M. Zhang, F. Huo, Z. Li and C. Yin, Adv. Sci., 2023, 10, 2206681 CrossRef CAS.
- J. Yin, J. Zhan, Q. Hu, S. Huang and W. Lin, Chem. Soc. Rev., 2023, 52, 2011–2030 RSC.
- Y.-L. Qi, H.-R. Wang, L.-L. Chen, Y.-T. Duan, S.-Y. Yang and H.-L. Zhu, Chem. Soc. Rev., 2022, 51, 7752–7778 RSC.
- G.-l Wu, F. Liu, N. Li, Q. Fu, C.-k Wang, S. Yang, H. Xiao, L. Tang, F. Wang, W. Zhou, W. Wang, Q. Kang, Z. Li, N. Lin, Y. Wu, G. Chen, X. Tan and Q. Yang, Adv. Sci., 2023, 10, 2304104 CrossRef CAS.
- Z. Mao, H. Rha, J. Kim, X. You, F. Zhang, W. Tao and J. S. Kim, Adv. Sci., 2023, 10, 2301177 CrossRef CAS.
- Y. Liu, L. Teng, B. Yin, H. Meng, X. Yin, S. Huan, G. Song and X.-B. Zhang, Chem. Rev., 2022, 122, 6850–6918 CrossRef CAS.
- Y. Zhao, L. Li, Q. Ye, Y. Gong, R. Yang and H. Liu, Anal. Chem., 2023, 95, 14043–14051 CrossRef CAS PubMed.
- M. Omar, J. Aguirre and V. Ntziachristos, Nat. Biomed. Eng., 2019, 3, 354–370 CrossRef CAS.
- H. Gao, L. Sun, J. Li, Q. Zhou, H. Xu, X.-N. Ma, R. Li, B.-Y. Yu and J. Tian, Adv. Sci., 2023, 10, 2303926 CrossRef CAS.
- H. Zhao, Y. Xiong, L. Zang and J. Lu, Talanta, 2023, 253, 123917 CrossRef CAS.
- K. Li, S. Xu, B. Wang, S. Huan, X. Song, L. Yuan and X.-B. Zhang, Sci. China: Chem., 2023, 66, 2425–2434 CrossRef CAS.
- Y. Ye, M. He, L. Wang, X.-C. Shen and H. Chen, Sens. Actuators, B, 2023, 396, 134600 CrossRef CAS.
- Y. Chen, Z. Hu, M. Yang, J. Gao, J. Luo, H. Li and Z. Yuan, Sens. Actuators, B, 2022, 362, 131742 CrossRef CAS.
- X. Qin, S. Zhang, X. Guo, X. Liu and X.-C. Shen, Front. Bioeng. Biotech., 2022, 10, 1062781 CrossRef PubMed.
- R. He, D. Tang, N. Xu, H. Liu, K. Dou, X. Zhou and F. Yu, Chinese Chem. Lett., 2024, 35, 108658 CrossRef CAS.
- J. Zeng, M. Liu, T. Yang, S. Li, D. Cheng and L. He, Talanta, 2024, 270, 125610 CrossRef CAS PubMed.
- L. Yuan, W. Lin, S. Zhao, W. Gao, B. Chen, L. He and S. Zhu, J. Am. Chem. Soc., 2012, 134, 13510–13523 CrossRef CAS.
- S. H. Gardner, C. J. Brady, C. Keeton, A. K. Yadav, S. C. Mallojjala, M. Y. Lucero, S. Su, Z. Yu, J. S. Hirschi, L. M. Mirica and J. Chan, Angew. Chem., Int. Ed., 2021, 60, 18860–18866 CrossRef CAS.
- S. Zhang, H. Chen, L. Wang, X. Qin, B. P. Jiang, S. C. Ji, X. C. Shen and H. Liang, Angew. Chem., Int. Ed., 2022, 61, e202107076 CrossRef CAS PubMed.
- L. Li, Z. Zhang, L. Zhou, H. Ge, Y. Zhao, Y. Gong, G.-J. Mao and H. Liu, Anal. Chem., 2024, 96, 7248–7256 CrossRef CAS.
- Y. Yue, F. Huo and C. Yin, Chem. Sci., 2021, 12, 1220–1226 RSC.
- Q. Zeng, Z. Yuwen, L. Zhang, Y. Li, H. Liu and K. Zhang, Anal. Chem., 2024, 96, 13260–13269 CrossRef CAS.
- Y. Gong, P. Wang, H. Zhai, Y. Xiao, Q. Wang, N. Ma, G. Zhang and H. Zhang, Anal. Chem., 2024, 96, 1009–1018 CrossRef CAS PubMed.
Footnote |
| † Electronic supplementary information (ESI) available. See DOI: https://doi.org/10.1039/d4tb01656d |
| This journal is © The Royal Society of Chemistry 2025 |

