MnO2-mineralized milk exosomes as a novel nanoplatform for glutathione detection†
Xudong
Wang
,
Xue
Wu
,
Jiuheng
Shen
,
Xian
Zhao
,
Peifen
Gao
,
Wantong
Zhou
and
Wenlin
An
 *
*
National Vaccine & Serum Institute (NVSI), China National Biotech Group (CNBG), Sinopharm Group, No. 38 Jing Hai Second Road, Beijing 101111, China. E-mail: anwenlin@sinopharm.com
First published on 1st November 2024
Abstract
Exosomes have garnered significant attention in the realms of disease diagnosis and therapeutics, owing to their remarkable biocompatibility. While engineered exosomes have the potential to augment delivery efficiency, targeting specificity, and circulation longevity, the intricacies of sample preparation have often hindered their broader application. In this pioneering study, we introduce a novel nanoplatform by leveraging surface manganese dioxide (MnO2) mineralization of milk exosomes. This innovative technique not only amplifies the inherent properties of exosomes but also endows them with additional functionalities, transforming them into a multifaceted tool for disease detection and therapeutic intervention. To expand the application of MnO2@milk exosomes, milk exosomes were stained with lipophilic molecules (curcumin) to prepare MnO2@mEVs-curcumin (MEC). The prepared nanocomposite was employed to detect GSH in cancer cells. By integrating exosome engineering with surface mineralization, we have paved the way for the creation of advanced biomaterials.
1. Introduction
Exosomes, being nanoscale membrane vesicles secreted by cells, are pivotal in intercellular communication due to their inherent biological activities.1,2 Exosomes have been used in disease diagnosis and theranostics due to their biocompatiblity.3,4 The strategic engineering of exosomes is poised to elevate their delivery efficacy, bolstering their targeted delivery and extending their half-life in circulation, thereby optimizing their therapeutic and diagnostic potential.5,6 However, these engineered strategies often required a complicated sample preparation step. To date, mineralization emerged as a compelling strategy for crafting high-performance mineral-based biomaterials, heralding a new era in materials science.7,8 Extracellular vesicles such as bacteria-derived extracellular vesicles were mineralized to reduce adverse effects as well as to enhance therapeutic effects.9–11 To date, there were no reported methods to prepare mineralized exosomes.Manganese dioxide nanomaterials represent an innovative class of inorganic nanomaterials, distinguished by their uncomplicated preparation process, affordability, and commitment to environmental sustainability.12–14 Due to its remarkable biocompatibility and unique optical and physical characteristics, manganese dioxide (MnO2) has emerged as a favored material in the biomedical field, holding substantial promise for disease detection,15 treatment,16,17 and prevention.18–20 The nanoparticles possess the capability to catalyze the oxidation of glutathione (GSH) to its oxidized form (GSSG), thereby disrupting the delicate balance of intracellular redox reactions. Furthermore, the resultant manganese ions (Mn2+) can be repurposed as a contrast agent for both T1 and T2-weighted magnetic resonance imaging (MRI), enhancing diagnostic capabilities.21,22 A variety of analytical methods based on MnO2 have been ingeniously devised for the precise determination of GSH including colorimetric,23,24 fluorescence25 and surface-enhanced Raman spectroscopy (SERS) assays.26 Generally, MnO2 is meticulously crafted to exert dual roles such as a signal quencher and recognition in a constructing probe. Then, a signal output unit was loaded onto the MnO2 platform through the strategic use of electrostatic interactions and π–π stacking.27 To translate these composites into clinical practice, ongoing refinements are essential to bolster their biodistribution, stability, and dispersibility. Moreover, the current loading mechanisms for proteins and peptides onto MnO2 are not without their challenges, particularly in terms of efficiency. This inefficiency highlights an imperative for the development of a robust and universal loading strategy that can effectively incorporate therapeutic agents into the MnO2 framework, thereby expanding their reach and impact within the realm of biomedical applications.
Bovine serum albumin (BSA) has been adeptly used as a template for the synthesis of MnO2.28–30 Recognizing the abundance of proteins on the surface of exosomes, which are susceptible to oxidation, we hypothesized that exosomes could similarly serve as a template for the synthesis of MnO2 using KMnO4 as the manganese precursor. To test this hypothesis, we employed an in situ mineralization process to coat milk exosomes (mEVs) with MnO2, creating a novel composite. Expanding the potential applications of this composite, we functionalized mEVs with lipophilic molecules, specifically curcumin, to fabricate MnO2@mEVs-curcumin (MEC). This MEC was then developed as a fluorescent probe for the detection of glutathione (GSH), capitalizing on the intrinsic properties of MnO2. It acts as a fluorescence quencher through a Förster resonance energy transfer (FRET) inner-filter effect and as a specific recognition unit for GSH. In addition, this study presents an innovative strategy for the fabrication of MnO2 functionalized exosomes, capable of encapsulating a wide array of therapeutic agents, including small molecules, peptides, RNA, DNA, proteins, and nanoparticles. The generated MEC has proven to possess remarkable stability and retains its properties under stress of elevated temperatures underscoring the MEC's potential for practical applications, particularly in scenarios requiring thermal stability and long-term storage without the loss of efficacy. More importantly, the fluorescence MEC could be used for imaging GSH in cancer cells. This technique holds substantial promise for its application in the clinical domain, paving the way for advanced therapeutic interventions.
2. Experimental
2.1. Preparation of milk exosomes
mEVs were prepared according to a previously reported method.31 In brief, 10 mL of acetic acid was added into 10 L of nonfat fresh milk, and the mixture was incubated at room temperature for 10 min. The supernatant was then collected by centrifugation at 5000 rpm for 10 min. To refine the sample, tangential flow filtration (TFF) with a 0.22-μm pore size was utilized to filter out larger vesicles and debris. Further purification was achieved by passing the supernatant through 500 kDa TFF filters, effectively removing particles smaller than exosomes. The filtered exosome solution was passed through a 0.22 μm filter membrane to ensure the removal of any residual bacterial cells and other contaminants.2.2. Preparation of EC and MEC
12.5 μL of 1 mg mL−1 curcumin was added into 200 μL of 3.0 × 10¹¹ particles per mL milk exosomes. After this, the mixture was sonicated for 10 min and was allowed to incubate for 30 min at 37 °C. Then, the unincorporated curcumin was removed through a 100-kDa ultrafiltration tube. The product (EC) was redispersed in 200 μL of PBS.10 μL of different concentrations of KMnO4 was added into exosomes–curcumin, and the mixture was shaken in a vortex for 1![[thin space (1/6-em)]](https://www.rsc.org/images/entities/char_2009.gif) min. Thereafter, the excess potassium and free manganese ions were removed using a 100-kDa ultrafiltration tube. The product (MEC) was redispersed in 200 μL of PBS.
min. Thereafter, the excess potassium and free manganese ions were removed using a 100-kDa ultrafiltration tube. The product (MEC) was redispersed in 200 μL of PBS.
2.3. Transmission electron microscopy (TEM)
The exosomes were rehydrated by resuspending them in water, ensuring a thorough and even distribution. The resuspended solution was then deposited onto a carbon-coated copper grid, where it was allowed to rest for a period of 10 minutes. Uranyl acetate was applied for staining on the grid, followed by careful examination of the samples using a Thermo Talos 120C microscope in Waltham, USA.2.4. Nanoflow analysis
mEVs in concentration and size distribution profiles were obtained using a nanoflow system (NanoFCM Inc., Xiamen, China). The exosomes, at a concentration of 2 × 10⁸ particles per mL, were resuspended in 100 μL of water and then 1 μL of SYTO 9, a fluorescent dye, was added to the exosome suspension. The mixture was incubated at 37 °C for 10 min, then was centrifuged to remove the unincorporated dye, and then was determined using a nanoflow system.2.5. UV-Vis absorption of MEC
UV-Vis absorption spectra were recorded using a Varian UVCary100 spectrophotometer.2.6. Thermal stability assay
9 μL of the sample with 3.0 × 10¹¹ particles per mL was loaded into an UNCLE instrument, ensuring that it was evenly distributed and free of bubbles. DLS was detected at different temperatures ranging from 20 to 60 °C. The data were analyzed using UNcle Analysis software (Unchained Labs, USA).2.7. Fluorescence sensing of GSH
200 μL of MEC was mixed with 10 μL of GSH at varying concentrations in 1.5 mL centrifuge tubes, all at ambient temperature. Once the mixtures were incubated for 10 min, the fluorescence spectra were recorded under excitation at 440 nm.2.8. Cytotoxicity assay
NIH3T3 and HeLa cells were cultured in an enriched environment of Dulbecco's modified Eagle's medium (DMEM), complemented with 10% fetal bovine serum (FBS) and 1% penicillin and streptomycin, under the steady conditions of 37 °C and 5% CO2. The cytotoxic potential of milk exosomes was evaluated through the CCK-8 assay, beginning with the strategic seeding of 8000 cells per well in a 96-well plate for an initial 24 h growth. The cells were then treated with varying concentrations of mEVs over 48 h, followed by addition of the CCK-8 reagent to generate a colorimetric response. The resulting absorbance readings at 450 nm were obtained through a microplate reader.2.9. Incubation of living cells with probes
HeLa and NIH3T3 cells were cultured on a 35 mm confocal dish at an initial density of 3 × 10⁴ cells per dish and incubated for 24 h. The experiment commenced with the addition of 50 μL (1.0 × 10¹¹ particles per mL) was added in the dishes, followed by 6 h incubation at 37 °C. The cells were then gently washed with a buffer solution to remove unbound particles, fixed with 4% formaldehyde for 10 min, and washed again to prepare for nuclear staining. Nuclei were stained with a 2.5 μg mL−1 DAPI solution for 5 min at room temperature, followed by a final series of washes. Before imaging, dishes were filled with 1 mL of PBS to maintain cell integrity. The fluorescence imaging was performed using a Zeiss LSM980 confocal laser scanning microscope.3. Results and discussion
3.1. Preparation and characteristics of milk exosomes and MEC
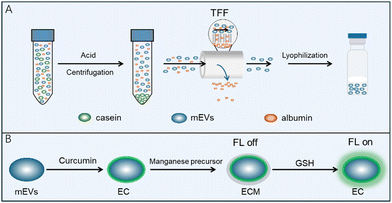
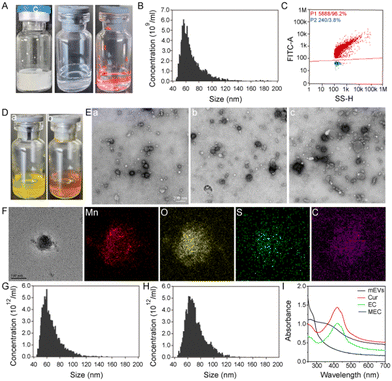
Bovine milk is a complex matrix that encompasses a multitude of extracellular vesicles and proteins, with caseins being particularly prevalent. Their abundance and similar size to milk exosomes pose a significant challenge in achieving high-purity exosome isolation. The phosphorylation of caseins is a common phenomenon, which endows these proteins with a negative charge on their surface. As outlined in Scheme 1A, we have meticulously prepared milk exosomes of exceptional purity, employing an isoelectric precipitation method previously detailed in our research.31 The lyophilized milk exosomes, as depicted in Fig. 1A, present as a white, cake-like substance with an expansive specific surface area that enhances solubility. Upon reconstitution in an aqueous medium, they yield a transparent liquid. The classic Tyndall effect observed in the images of mEVs is indicative of their high dispersity, which is a testament to their superior hydrophilicity and solubility.The size and purity of mEVs were meticulously evaluated using nanoflow cytometry. Fig. 1B illustrates that the milk exosomes exhibit an average size of approximately 69.0 ± 17.7 nm. The purity assessment, facilitated by the fluorescent dye, SYTO9, which selectively binds to DNA and exhibits amplified fluorescence upon binding, revealed that the milk exosomes isolated in aqueous media have a remarkable purity of 96.2% (Fig. 1C). The exceptional purity of the milk exosomes is a testament to the efficiency and scalability of our method, ensuring the production of high-quality exosomal preparations. The concentration of exosome particles is determined to be 2.33 × 10¹¹ particles per mL and the ratio of the particle number to the protein concentration is 6.54 × 10¹¹ particles per mg, underscoring the high purity of the milk exosomes achieved through our refined isolation process, including acid pretreatment and tangential flow filtration (TFF). mEVs show an average negative charge and a zeta potential of mEVs is about −8.50 mV (Fig. S1, ESI†). The morphology of mEVs was examined using transmission electron microscopy (TEM). The TEM images, as shown in Fig. 1E(a), reveal a high degree of dispersion among typical vesicles, aligning with previous findings. In summary, these comprehensive results substantiate the successful isolation of milk exosomes with high purity, a critical step forward in the field of extracellular vesicle research and potential clinical applications.
Exosomes have phospholipid bilayer membranes, facilitating the efficient encapsulation of lipophilic substances. Based on the unique features of exosomes, mEVs are used to load a natural lipophilic compound, curcumin, onto the membrane of mEVs. As illustrated in Scheme 1B, the encapsulation of curcumin within milk exosomes (mEVs) was facilitated by the method of sonication. A spectrum of curcumin concentrations were tested, spanning from 5 to 500 μg mL−1, with specific increments of 25, 62.5, and 125 μg mL−1. The visual clarity of the mixture was maintained at concentrations up to 125 μg mL−1, beyond which, at 250 μg mL−1, the solution exhibited a cloudy appearance. As shown in Fig. 1D(a), a clear yellow fluid was observed after loading curcumin into exosomes. Table S1 (ESI†) shows that the encapsulation efficiency of curcumin in the mEVs reached about 82.2%. Each exosome can be loaded with up to 1.68 × 10⁶ molecules. Therefore, the 62.5 μg mL−1 curcumin was chosen for subsequent experiments. Compared with mEVs, curcumin-encapsulated mEVs (EC) revealed no change in the morphology (Fig. 1E(b)). Fig. 1F shows that the average particle size of EC is 68.3 ± 16.8 nm, which is similar to that of mEVs. These studies indicate that EC maintains their characteristic features. These findings indicate that mEVs could efficiently carry lipophilic substances. Due to good solubility and high stability of mEVs in water, EC has the similar characteristics to mEVs. As shown in Fig. S2 (ESI†), the curcumin showed green fluorescence at around 498 nm under excitation 440 nm. Thus, EC with green fluorescence could be employed as signal unit to construct the fluorescent probe.
Exosomes with a variety of proteins on their surface serve as the versatile template for in situ MnO2 mineralization. KMnO4 was used as the manganese precursor to react with mEVs, achieving in situ MnO2 mineralization, and the color changed from yellow to brown (Fig. 1D(b)). The prepared MnO2@milk exosomes-curcumin (MEC) was characterized by TEM, nanoflow, zeta potential, energy dispersive X-ray spectroscopy (EDS) and UV-vis spectroscopy. The EDS analysis has yielded affirmative results, confirming the presence of manganese (Mn) and oxygen (O) elements within the MnO2 layer (Fig. 1F). Furthermore, the detection of carbon (C) and sulfur (S) elements, attributed to the protein content, corroborates the presence of exosomes within our composite structure. It is a strong indication of the successful synthesis of the MnO2 layer integrated with the mEVs–curcumin structure. Similar to mEVs, MEC had spherical-like morphology with a membrane structure (Fig. 1E(c)), the zeta potential was around −8.79 mV (Fig. S1, ESI†), and the average diameter was around 74.4 ± 15.3 nm (Fig. 1H). As depicted in Fig. S3 (ESI†), EC (curve c) exhibits similar spectral bands to mEVs (curve b), indicative of the prominent role that mEVs play within the complex. In the EC spectrum, a distinct band at 802 cm−1 is observed, which is attributed to the characteristic absorption of curcumin (curve a), thereby confirming the successful fabrication of EC. MEC also presents bands akin to EC, but with a notable reduction in the intensity of bands at 2915 and 2858 cm−1. This attenuation is attributed to the presence of MnO2 on the exosomal surface, which diminishes the relative abundance of mEVs and curcumin, thereby signifying the successful preparation of MEC. As shown in Fig. 1I, the absorption spectra of mEVs and curcumin exhibit bands at around 283 and 424 nm, respectively. After loading curcumin, EC exhibits similar bands to curcumin. Due to the broad absorption spectrum of MnO2 spanning from 250 to 700 nm, the MEC composite also displays a similar absorption profile within this range. The overlap of this absorption band with the fluorescence emission peak of curcumin at 498 nm (Fig. S3, ESI†) facilitates the process of Förster resonance energy transfer (FRET). Consequently, the energy transfer from curcumin (EC) to MnO2 results in significant quenching of the 498 nm emission band, demonstrating the efficient interaction between the components of the MEC system. Thus, these results verified that MnO2-mineralized milk exosomes were successfully synthesized.
3.3. Optimization of the synthesis of MEC
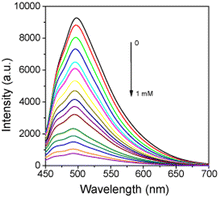
The fluorescence spectra of EC were used to investigate the formation. In the presence of the manganese precursor, a large decrease of the fluorescence intensity was observed (Fig. 2). When the concentration of the manganese precursor was higher than 1 mM, the maximum fluorescence quenching degree of MEC is up to 91.4% (Fig. S4A, ESI†). As shown in Fig. S4B (ESI†), the fluorescence intensity decreased almost linearly with the increasing manganese precursor ranging from 0 to 1.6 nM (R2 = 0.99). When the KMnO4 concentration reached 200 μM, the fluorescence quenching degree of MEC is up to 83.8%, while the quenching degree decreases by about 7.6%. To increase the sensitivity of MEC, 200 μM KMnO4 was selected for subsequent experiments.3.4. Stability test of MEC
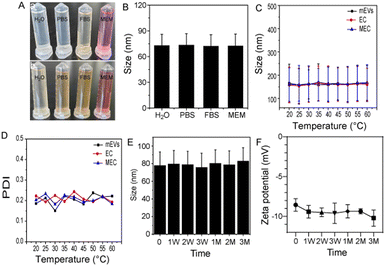
For biomedical and clinical applications, it is critical to study the stability of MEC under physiological conditions. As shown in Fig. 3A, MEC was clear in different solutions including H2O, PBS, FBS, and DMEM. The particle was about 73 nm in the above-mentioned solutions, demonstrating excellent dispersity and stability (Fig. 3B). In contrast, MnO2 solution, which was prepared according to previous literature, turned turbid, demonstrating poor stability under physiological conditions.32 To improve the dispersity and stability of MnO2, it often needs further modification prior to the biomedical application. Due to abundant proteins on the surface of exosomes, they endowed MnO2-mineralized exosomes with high dispersity and stability. It has been demonstrated that the integrity of mEVs can be remarkably preserved in vitro over extended periods, demonstrating resilience even against the harsh acidic conditions of the stomach and enzymatic degradation in the intestinal tract. Therefore, the stability of MEC was further evaluated under different temperatures ranging from 20 to 60 °C. Due to the limitations of temperature control in the nanoflow cytometer, we adopted UNCLE technology, which is a measurement method based on dynamic light scattering (DLS), to determine the size of nanoparticles. DLS technology measures the size of particles in water by analyzing the fluctuations in scattered light, thereby capturing the hydrodynamic diameter of the particles. Although this method can provide more comprehensive size information, it also leads to measurement results that are larger than those obtained using the nanoflow cytometer. This discrepancy is mainly attributed to the inclusion of the water molecule layer surrounding the particles in the DLS measurement, while the nanoflow cytometer primarily measures the size of the particles themselves. As shown in Fig. 3C, there are no significant differences in sizes among mEVs, EC and MEC. The sizes of mEVs, EC, and MEC remain largely unaffected by temperature variations between 20 and 60 °C. As can be seen in Fig. 3D, the PDI is less than 0.25 and it demonstrates that these nanoparticles are homogenous and possess high stability. To further evaluate the stability of MEC, MEC was stored at 4 °C for different time periods to measure the size as well as the zeta potential. The particle size (Fig. 3E) and zeta potential (Fig. 3F) of MEC show no obvious change in the 2 months. These results showed that MEC with great stability would be beneficial to practical applications.3.5. In vitro response of MnO2@mEVs-curcumin
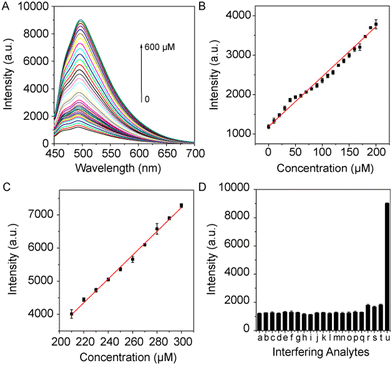
Given the positive outcomes from preliminary studies, we have decided to further explore the application of manganese dioxide in the field of biomedicine. In particular, the effective degradation of manganese dioxide by glutathione (GSH) offers us a novel method for detecting glutathione. As a key cellular antioxidant, changes in glutathione levels have significant clinical implications in various pathological states. Therefore, leveraging the degradation reaction of manganese dioxide to detect glutathione not only provides a sensitive and specific detection method but may also offer new perspectives for the diagnosis and treatment of related diseases. In the absence of GSH target, MEC exhibited a slight fluorescence emission due to fluorescence quenching of MnO2. A gradual and significant increase in the fluorescence signal at 498 nm was observed directly proportional to the GSH concentration across the range of 0 to 600 μM. Notably, at the highest concentration of 600 μM GSH, the fluorescence intensity was enhanced by up to 7.2 times the initial value. This enhancement revealed a linear trend within two distinct concentration ranges, 0 to 200 μM and 200 to 300 μM, as detailed in Fig. 4B and C, respectively. The detection limit was calculated to be 37.9 nM within the range of 0–200 μM (R2 = 0.997). Further establishing the reliability of this detection approach, the specificity of the MEC system was thoroughly tested by exposing it to a variety of biological ions and amino acids. This evaluation confirmed the system's ability to selectively detect GSH, even in complex biological matrices, by minimizing interference from other common biomolecules. Notably, the introduction of biological ions and amino acids failed to induce a marked increase in the fluorescence intensity. While MEC exhibited a fluorescence response to certain compounds such as cysteine (Cys), homocysteine (Hcy), fructose, and ascorbic acid (Fig. 4D), their presence in biological systems is significantly less than that of GSH. This distinction endows MEC with the selectivity necessary to serve as a specific fluorescent probe for the detection of GSH, effectively minimizing interference from other small molecular thiols in a “light-on” detection mode.3.6. Living imaging of GSH using MnO2@mEVs-curcumin
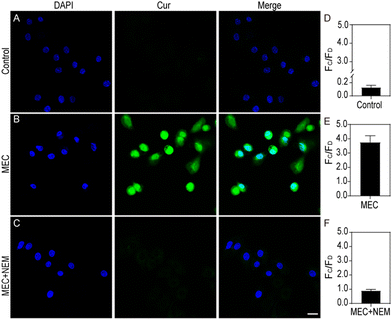
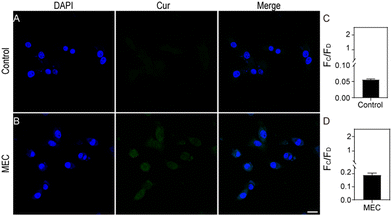
Leveraging its high sensitivity and selectivity for in vitro target systems, the MEC's proficiency in visualizing intracellular glutathione (GSH) was assessed through the application of confocal laser scanning fluorescence microscopy, providing a superior approach for detecting and analysing GSH levels within cells. Initially, the cytotoxicity of MEC was evaluated on HeLa and NIH3T3 cells using the CCK-8 assay. No significant cytotoxic effects were noted; the cells remained viable even at MEC concentrations up to 5.0 × 10¹⁰ particles per mL. To ascertain the optimal duration for cellular imaging, we cultured HeLa cells with MEC for various intervals (0, 0.5, 1, 2, 3, 4, 6, and 8 hours). A gradual increase in cellular fluorescence over time was observed, with minimal further enhancement after reaching the 6-h mark (Fig. S7A and B, ESI†). Consequently, for all subsequent experiments, we have elected to treat the cells with MEC for 6 h to ensure optimal imaging conditions. Compared without treatment (Fig. 5A), Fig. 5B shows a clear fluorescence signal was observed in HeLa cells following a 6 h incubation with MEC. It is recognized that N-ethylmaleimide (NEM) can lead to a reduction in GSH levels. Thus, NEM was employed to perturb GSH levels in the cells. A reduction in the fluorescence signal was also discernible (Fig. 5C). Compared to cancerous cells, normal cells exhibited lower GSH concentrations. To confirm MEC applicability, it was incubated with NIH3T3 cells. Cancer cells typically exhibit higher GSH levels, which can contribute to their increased resistance to various treatments. HeLa cells, as a cancer cell line, initially have a higher GSH level compared to the normal fibroblast cell line, NIH3T3, which is known for its lower GSH content. As illustrated in Fig. 6B, MEC induced a faint green fluorescence signal within the cells, indicating a lower GSH content in NIH3T3 cells. These findings indicate that the intracellular fluorescence signal is indeed triggered by GSH and that MEC is capable of reliably tracking intracellular GSH levels.Conclusions
This study presents a pioneering approach to the synthesis of nanomaterials using exosomes as mineralization templates. By employing exosomes as vectors, MnO2-mineralized exosomes could encapsulate and deliver a wide array of molecules. MnO2 can rapidly respond to GSH and can be decomposed to Mn2+ and then release cargo such as EC. MnO2-mineralized exosomes developed here demonstrate significant potential for advancing the field of biomedicine, offering a versatile and sensitive platform for disease detection. The innovative strategy of combining exosome biology with minerarlization technology opens new avenues for the creation of advanced biomaterials with tailored properties for medical applications. In addition, Mn2+ shows multiple functions for enhancing the cGAS-sting pathway, and MnO2-mineralized exosomes would serve as carriers and adjuvants in vaccine development, enhancing immune responses and offering a promising approach for the next generation of immunotherapies.Author contributions
Experiments are conceived by X. W. (Xudong Wang). The experiments are performed by X. W. (Xudong Wang). Xudong Wang and X. W. (Xue Wu) developed the draft, wrote the manuscript and developed the figures. X. Z. and W. Z. revised the manuscript. W. A. conceived the idea and supervised the content and writing. J. S. and P. G. critically contributed to the content and reviewed the manuscript to ensure accuracy and completeness. All authors contributed to the article and approved the submitted version. All authors have read and agreed to the published version of the manuscript.Data availability
The data supporting this article have been included as part of the ESI.†Conflicts of interest
There are no conflicts to declare.Acknowledgements
This research is completed with the financial support of NVSI (National Vaccine and Serum Institute).Notes and references
- B. Adem, N. Bastos, C. F. Ruivo, S. Sousa-Alves, C. Dias, P. F. Vieira, I. A. Batista, B. Cavadas, D. Saur, J. C. Machado, D. W. Cai and S. A. Melo, Nat. Commun., 2024, 15, 1496 CrossRef CAS
.
- K. Baumann and Nat Rev, Mol. Cell. Biol., 2021, 22, 242 CAS
.
- H. B. Wang, Z. M. Lu and X. X. Zhao, J. Hematol. Oncol., 2019, 12, 133 CrossRef PubMed
.
- Y. Tian, T. Zhang, J. Li and Y. Tao, Adv. Drug Delivery Rev., 2023, 199, 114899 CrossRef CAS PubMed
.
- M. R. Liu, S. Q. Hu, N. Yan, K. D. Popowski and K. Cheng, Nat. Nanotechnol., 2024, 19, 565–575 CrossRef CAS PubMed
.
- Y. H. Tian, S. P. Li, J. Song, T. J. Ji, M. T. Zhu, G. J. Anderson, J. Y. Wei and G. J. Nie, Biomaterials, 2014, 35, 2383–2390 CrossRef CAS PubMed
.
- K. H. Min, H. J. Lee, K. Kim, I. C. Kwon, S. Y. Jeong and S. C. Lee, Biomaterials, 2012, 33, 5788–5797 CrossRef CAS PubMed
.
- W. T. Yang, W. S. Guo, W. J. Le, G. X. Lv, F. H. Zhang, L. Shi, X. L. Wang, J. Wang, S. Wang, J. Chang and B. B. Zhang, ACS Nano, 2016, 10, 10245–10257 CrossRef CAS PubMed
.
- J. Zhang, S. Wan, H. Zhou, J. Du, Y. Li, H. Zhu, L. Weng, X. Ding and L. Wang, ACS Nano, 2024, 18, 9613–9626 CrossRef CAS PubMed
.
- S. Qing, C. Lyu, L. Zhu, C. Pan, S. Wang, F. Li, J. Wang, H. Yue, X. Gao, R. Jia, W. Wei and G. Ma, Adv. Mater., 2020, 32, e2002085 CrossRef PubMed
.
- X. Chen, P. Li, B. Luo, C. Song, M. Wu, Y. Yao, D. Wang, X. Li, B. Hu, S. He, Y. Zhao, C. Wang, X. Yang and J. Hu, ACS Nano, 2024, 18, 1357–1370 CrossRef CAS PubMed
.
- J. T. Xu, W. Han, P. P. Yang, T. Jia, S. M. Dong, H. T. Bi, A. Gulzar, D. Yang, S. L. Gai, F. He, J. Lin and C. X. Li, Adv. Funct. Mater., 2018, 28, 1803804 CrossRef
.
- G. B. Yang, L. G. Xu, Y. Chao, J. Xu, X. Q. Sun, Y. F. Wu, R. Peng and Z. Liu, Nat. Commun., 2017, 8, 902 CrossRef PubMed
.
- Y. M. Jia, X. Q. Yi, Z. G. Li, L. L. Zhang, B. Yu, J. Zhang, X. D. Wang and X. Jia, Talanta, 2020, 219, 121308 CrossRef CAS PubMed
.
- C. Y. Wang, Y. Gao, S. Hu, A. N. Zhu, Y. Ying, X. Y. Guo, Y. P. Wu, Y. Wen and H. F. Yang, Biosens. Bioelectron., 2022, 215, 114388 CrossRef CAS PubMed
.
- T. Chen, W. W. Zeng, C. J. Tie, M. Yu, H. S. Hao, Y. Deng, Q. Q. Li, H. R. Zheng, M. Y. Wu and L. Mei, Bioact. Mater., 2022, 10, 515–525 CAS
.
- C. Huang, B. Q. Lin, C. Y. Chen, H. M. Wang, X. S. Lin, J. M. Liu, Q. F. Ren, J. Tao, P. Zhao and Y. K. Xu, Adv. Mater., 2022, 34, e2207593 CrossRef PubMed
.
- S. Q. Wang, H. Zheng, L. Zhou, F. Cheng, Z. Liu, H. P. Zhang and Q. Y. Zhang, Biomaterials, 2020, 260, 120314 CrossRef CAS PubMed
.
- M. Fan, L. Jia, M. H. Pang, X. L. Yang, Y. J. Yang, S. K. Elyzayati, Y. G. Liao, H. Wang, Y. H. Zhu and Q. Wang, Adv. Funct. Mater., 2021, 31, 2010587 CrossRef CAS
.
- X. Yang, Y. Yang, J. Y. Bian, J. J. Wei, Z. Wang, Z. W. Zhou, Z. T. Li and M. J. Sun, Nano Today, 2021, 38, 101109 CrossRef CAS
.
- L. S. Lin, J. B. Song, L. Song, K. M. Ke, Y. J. Liu, Z. J. Zhou, Z. Y. Shen, J. Li, Z. Yang, W. Tang, G. Niu, H. H. Yang and X. Y. Chen, Angew. Chem., Int. Ed., 2018, 57, 4902–4906 CrossRef CAS PubMed
.
- K. M. L. Taylor, W. J. Rieter and W. B. Lin, J. Am. Chem. Soc., 2008, 130, 14358–14359 CrossRef CAS PubMed
.
- J. Ge, R. Cai, X. G. Chen, Q. Wu, L. L. Zhang, Y. Jiang, C. Cui, S. Wan and W. H. Tan, Talanta, 2019, 195, 40–45 CrossRef CAS
.
- J. Liu, L. J. Meng, Z. F. Fei, P. J. Dyson, X. N. Jing and X. Liu, Biosens. Bioelectron., 2017, 90, 69–74 CrossRef CAS PubMed
.
- H. Ma, X. R. Li, X. Y. Liu, M. Deng, X. D. Wang, A. Iqbal, W. S. Liu and W. W. Qin, Sens. Actuators, B, 2018, 255, 1687–1693 CrossRef CAS
.
- X. X. Hu, C. L. Quan, T. T. Ren, L. A. Zhao, Y. T. Shen, Y. Y. Zhu and J. Wang, Microchim. Acta, 2023, 190, 341 CrossRef CAS PubMed
.
- X. D. Wang, J. Dai, X. Y. Wang, Q. Y. Hu, K. X. Huang, Z. J. Zhao, X. D. Lou and F. Xia, Talanta, 2019, 202, 591–599 CrossRef CAS
.
- L. Han, H. J. Zhang, D. Y. Chen and F. Li, Adv. Funct. Mater., 2018, 28, 1800018 CrossRef
.
- Y. X. Lin, Q. Zhou, D. P. Tang, R. Niessner and D. Knopp, Anal. Chem., 2017, 89, 5637–5645 CrossRef CAS PubMed
.
- X. Liu, Q. Wang, H. H. Zhao, L. C. Zhang, Y. Y. Su and Y. Lv, Analyst, 2012, 137, 4552–4558 RSC
.
- X. Wu, J. Shen, Y. Zhong, X. Zhao, W. Zhou, P. Gao, X. Wang and W. An, Pharmaceutics, 2024, 16, 930 CrossRef
.
- X. D. Wang, D. Wang, Y. L. Guo, C. D. Yang, X. Y. Liu, A. Iqbal, W. S. Liu, W. W. Qin, D. Yan and H. C. Guo, Biosens. Bioelectron., 2016, 77, 299–305 CrossRef CAS PubMed
.
Footnote |
| † Electronic supplementary information (ESI) available. See DOI: https://doi.org/10.1039/d4tb01662a |
| This journal is © The Royal Society of Chemistry 2025 |

