Enzyme-free and highly sensitive detection of human epidermal growth factor receptor-2 based on MNAzyme signal amplification in breast cancer†
Feifan
Yin‡
a,
Zhiqiang
Hou‡
a,
Yanheng
Yao
a,
Miao
He
a,
Yang
Xiang
 *ab and
Zhongyun
Wang
*c
aState Key Laboratory of Pharmaceutical Biotechnology, School of Life Sciences, Nanjing University, Nanjing 210023, P. R. China. E-mail: xiangy@nju.edu.cn
bState Key Laboratory of Natural and Biomimetic Drugs, Peking University, Beijing 100191, P. R. China
cDepartment of Anesthesiology, The First Affiliated Hospital of Nanjing Medical University, Nanjing 210029, P. R. China. E-mail: zywang1970@126.com
First published on 14th November 2024
Abstract
As a common cancer biomarker, human epidermal growth factor receptor-2 (HER2) is highly expressed in breast cancer. Consequently, developing a simple and accurate HER2 sensing platform is of great significance for early diagnosis and treatment of breast cancer. Herein, we developed a rapid enzyme-free fluorescent assay biosensor based on MNAzyme signal amplification for breast cancer biomarker, HER2. The MNAzyme consists of multiple parts, including complementary DNA (cDNA) and two parts of DNAzyme (partzyme A/B). Initially, cDNA is blocked by combining with the HER2 aptamer to form a double-stranded DNA. When HER2 is present, cDNA is released as a result of the binding between HER2 and its aptamer. Due to the complementary sequences among cDNA and partzyme A/B, the MNAzyme is successfully assembled to cleave the substrate, recovering the fluorescence output. The MNAzyme biosensor exhibited a low detection limit of 0.02 ng mL−1 and excellent selectivity. Furthermore, the proposed biosensor can also change the recognition element by changing the aptamer sequence to detect various biomarkers, holding great potential for cancer diagnosis and other related biomedical applications.
1. Introduction
Breast cancer is the most common malignancy in women, and it causes one of the highest female mortality rate in the world. By 2022, about 4.1 million women in the United States have suffered from breast cancer. It is estimated that 12.9% of women fall ill with breast cancer in their lifetime. Notably, more than half of them are early stage breast cancer, which means a higher five-year survival rate for women diagnosed with breast cancer. Nevertheless, once they enter the advanced stage of breast cancer, the five-year survival rate of patients drops to 29%.1 Therefore, early diagnosis and treatment of breast cancer is of great significance.Biomarkers are biochemical indicators that can show structural or functional changes of the body and change with the development of diseases, which are widely used in non-invasive detection of diseases. Human epidermal growth factor receptor-2 (HER2, also known as ErbB2), a kind of transmembrane protein that promotes the growth of breast cancer cells, is highly expressed in about 25% to 30% of breast cancer patients, and has been shown to be an important predictor of breast cancer treatment.2 As a result, detecting the level of HER2 in the human body will help evaluate the progression of breast cancer and judge the survival of patients. Histological methods include immunohistochemistry (IHC), fluorescence in situ hybridization (FISH),3 chromogenic in situ hybridization test (CISH),4etc. However, they all have some limitations, such as the complexity of the procedure, the need for specialized instruments, the need for invasive biopsy samples, and long time consumption.5 At present, serological detection methods include enzyme linked immunosorbent assay (ELISA),6 and chemiluminescence immunoassay.7–11 Compared with histological methods, serological methods are more convenient and can be quantitatively detected. However, the methods used are all based on antibodies, so they are more expensive and have non-specific binding.12 Consequently, the rapid and sensitive detection of HER2 is still an enormous challenge. Considering these circumstances, it is imperative to develop a rapid, simple and low-cost sensing platform for the detection of HER2 in human serum samples.
Functional nucleic acids (FNAs) are a class of DNA or RNA that can be synthesized artificially and display enzymatic or target affinity, which goes beyond the traditional concept of genetic materials of nucleic acids. FNAs are divided into aptamers, DNAzymes, etc.13 Aptamers are single strand DNA or RNA screened by Systematic Evolution of Ligands by Exponential Enrichment (SELEX),14,15 which have the advantages of high specific binding force, strong affinity, easy synthesis and storage, and low cost.16 Based on the above characteristics, aptamers are widely applied in drug development and therapy,17 biosensing,18–20 bioimaging,21 and other fields. Many aptamer sensors have been developed to detect various biomarkers, such as proteins,22 small molecules,23 and whole cells.24 DNAzyme is a class of single-stranded DNA that can cleave DNA or RNA molecules. It can bind to the substrate DNA or RNA through base complementary pairing, and cleave the substrate with the action of metal ions. After cleavage, the substrate is separated from DNAzyme, and then DNAzyme binds to the next substrate to repeat the above process. Thus, signal amplification is realized.25 DNAzyme is highly modifiable, low cost and easy to synthesize, making it widely used in the field of biosensing. Many new technologies for nucleic acid detection,26 protein detection27 and intracellular imaging28 have been developed accordingly. Multicomponent nucleic acid enzyme (MNAzyme) is a branch of DNAzyme which was developed in 2009 by Elisa Mokany et al.29 It is derived by splitting the catalytic core of DNAzyme into two partzymes. Assembly facilitators such as specific target nucleic acids can bind to two partzymes through base complementary pairing, which can activate the cleaving function of the catalytic core to switch into an active MNAzyme. Then, the substrates will be cleaved. Except for the catalytic core, the bases of the assembly facilitators, partzymes and substrates can be changed according to the target to be detected, so MNAzyme has better modifiable ability than DNAzyme.30 Streptavidin magnetic beads are a class of magnetic beads that can be efficiently coupled with biotinated polypeptides, oligonucleotides, antibodies, etc., through the high affinity between streptavidin and biotin. They have high magnetic stability and load capacity, and can realize magnetic separation quickly and efficiently. Fluorescence sensors often transform a target signal input into fluorescent signal output by generating light-up aptamers or cleaving molecular beacons, which are fluorophore–quencher pairs linked by short ssDNA.31,32 The integration between fluorescence sensors and functional nucleic acids has the advantage of easy operation and enhanced sensitivity.
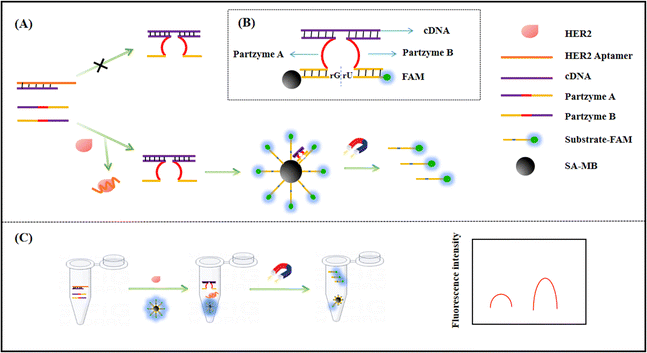
In this work, we developed a simple, low-cost and enzyme-free sensing platform for HER2 detection, and designed a special MNAzyme that can be divided into three parts, namely cDNA and partzyme A/B. We also designed functionalized streptavidin magnetic beads with substrate modification. When the HER2 protein is absent, cDNA is blocked by the HER2 aptamer. Accordingly, the MNAzyme fails to form. After magnetic separation, the fluorescence signal measured is significantly weak. When the HER2 protein is present, the HER2 aptamer will bind to the HER2 protein. The sequences of three parts can be successfully assembled into the MNAzyme, cleaving the substrates on the functionalized magnetic beads. An intense fluorescence signal will be measured after magnetic separation. This biosensor selects the MNAzyme as the tool enzyme for signal amplification, which has the advantages of low cost, mild reaction conditions, strong stability and simple operation compared with biological enzymes. The high affinity of the aptamer to the target makes the detection display high specificity. At the same time, the magnetic separation effect of magnetic beads can effectively reduce the influence of background signals, and efficiently improve the sensitivity of detection. In conclusion, the biosensor can achieve low concentration detection of HER2. In addition, by changing the aptamer sequence, different protein markers can be detected, and a general protein POC detection platform can be established.
2. Experimental
2.1. Materials and reagents
All oligonucleotides were purchased from Sangon Biotechnology Co., Ltd (Shanghai, China) and purified by HPLC. All the sequences of the used oligonucleotides in this work were respectively listed in Table S1 (ESI†). Streptavidin-modified magnetic beads (SA-MBs; 2.8 μm, 10 mg mL−1) were obtained from Suzhou Beaver Biomedical Engineering Co., Ltd (Suzhou, China). HER2 protein was purchased from Absin (Shanghai, China). HSA protein was purchased from Wuhan Huamei Biotech Co., Ltd (Wuhan, China). Insulin was purchased from Meryer (Shanghai, China). The buffers used in this work are as follows: DNA storage buffer was composed of 10 mM Tris–HCl 1 mM EDTA (pH 8.0); washing buffer was composed of 10 mM Tris–HCl (pH 7.5), 1 mM EDTA, 1 M NaCl, and 0.01–0.1% Tween-2; working buffer was composed of 20 mM Tris–HCl (pH 7.5), 100 mM NaCl, 10 mM MgCl2 and 10 mM KCl. The human serum was obtained from the First Affiliated Hospital of Nanjing Medical University. Ultrapure water used in all experiments was obtained from a Milli-Q ultra-high purity water system.2.2. Instrumentation
A FE20 pH meter (Mettler-Toledo Instruments Shanghai Co., Ltd, Shanghai, China) was utilized for PH adjustment. An HC-100 constant temperature mixer (Thermo, Shanghai, China) was employed for the reaction. Fluorescence characterization of this work was performed on an Infinite 200 Pro multifunctional microplate reader (TECAN,Switzerland) at an excitation wavelength of 485 nm and an emission wavelength of 525 nm, with a black 96-well microplate (Beyotime, shanghai, China) used as a container.2.3. Native polyacrylamide gel electrophoresis
To verify whether the MNAzyme could cleave the substrates, 8% native polyacrylamide gel electrophoresis (PAGE) was performed to validate the reaction. The gel used in the experiment was prepared by adding 2.6 mL of bisacrylamide, 2 mL of 5× TBE, 100 μL of 10% APS, and 10 μL of TEMED to 5.3 mL of distilled water. Specifically, we mixed 100 nM partzyme A, 100 nM partzyme B, 100 nM HER2 aptamer, and 100 nM substrates, which reacted at 45 °C for 3 hours. Next, 10 μL of the reaction solution was incubated with 2 μL 6× loading buffer and left at room temperature for 1 minute. Subsequently, the reaction solution was injected into 8% PAGE. After running at 100 V for 45 minutes in a 1× TBE buffer, the gel was finally scanned with a gel imaging system.2.4. Preparation of DNA functionalized streptavidin magnetic beads
The substrates were immobilized on the surface of SA-MBs through the specific binding between biotin and streptavidin. First, 100 μL of 10 mg mL−1 SA-MBs were washed twice with 1 mL of washing buffer and then resuspended in 498 μL of washing buffer. Subsequently, 2 μL of 100 μM biotinylated substrates were added to the resuspend SA-MB solution, and then the mixture was incubated at 37 °C for 30 min on the thermomixer. At last, the SA-MBs were washed three times with washing buffer to remove the excess substrates. The MBs modified with substrates were resuspended in 200 μL of working buffer and stored at 4 °C for further experiments.2.5. HER2 detection
5 μL partzyme A (600 nM), 5 μL partzyme B (600 nM), 5 μL HER2 aptamer (600 nM), 1.5 μL functional magnetic bead solution, and 2.5 μL HER2 solution with different concentrations were added to the 31 μL working buffer to reach a total volume of 50 μL. Then the mixture was placed in a constant temperature mixer at 45 °C for 3 hours. After the reaction, the solution was magnetically separated three times on a magnetic separator, transferred to a 96-well plate, and its fluorescence value was measured using an infinite 200 pro (excited 485 nm, emitted 525 nm). In order to investigate the application of the fluorescence biosensor in real biological samples, we performed HER2 detection in human serum. Serum samples from breast cancer patients and healthy people were provided by the First Affiliated Hospital of Nanjing Medical University and diluted with ultrapure water. Then the samples were analyzed using an ELISA kit and this method, respectively.3. Results and discussion
3.1. Working principle of the MNAzyme biosensor
The principle of the MNAzyme sensing platform is shown in Fig. 1. To achieve signal conversion, this assay includes consecutive steps: (1) HER2 releases single-stranded cDNA from the HER2 aptamer by competitively combining with its aptamer. (2) Single-stranded cDNA assembles the MNAzyme with partzyme A and partzyme B. (3) The generated MNAzyme cleaves the substrates on the streptavidin-modified magnetic beads, producing a strong fluorescence signal. We select HER2 as a target protein, and design the MNAzyme biosensor. The special biosensor based on the MNAzyme is composed of four major sections: the HER2 aptamer, cDNA, partzymes A and B, and substrates. The HER2 aptamer, which initially blocks cDNA, can specifically recognize and combines with the HER2 protein through high affinity. The sequences of partzyme A and partzyme B can be divided into three regions including the first sequence complementary to cDNA (Fig. 1, purple fragment), which can be combined with cDNA to assemble MNAzyme; the second sequence assembles the catalytic core (Fig. 1, red fragment). Only when the catalytic core sequences of the two partzymes are close to each other will they generate catalytic activity in the presence of Mg2+. The last section of partzymes plays an important role as the binding arm (Fig. 1, yellow segment), complementary to the specific substrate sequence. When the HER2 protein is not present, the HER2 aptamer is blocked by its cDNA, maintaining the stable double-stranded structure. As a consequence, the MNAzyme fails to form in the absence of a single-stranded cDNA. The fluorescence signal measured is significantly weak after magnetic separation. When the HER2 protein is present, the HER2 aptamer will bind to the HER2 protein. Consequently, the sequences of cDNA and partzymes A and B will be successfully assembled into MNAzyme, cleaving the substrates on the functionalized magnetic beads. After magnetic separation, an intense fluorescence signal will be measured.3.2. Feasibility of the sensing strategy
First, we performed 8% native polyacrylamide gel electrophoresis (PAGE) to validate the formation and function of the MNAzyme. As shown in Fig. 2A, lanes 1–4 show the bands of 400 nM partzyme A, 400 nM partzyme B, 400 nM HER aptamer, and 400 nM substrates. When partzyme A, partzyme B, and cDNA were all present, as shown in lane 5, it was evident that there was a band of higher molecular mass with a lower migration rate than the previous lanes, indicating the successful assembly of the MNAzyme. In lane 6, the MNAzyme combined with the substrates to form bands of larger molecular weight. After the addition of Mg2+, it was observed that the band of substrates in lane 7 disappeared compared with lane 4 and the band compared with lane 6 migrated faster, which proved that the MNAzyme showed cleavage activity in the presence of Mg2+. To further investigate the feasibility of the sensing platform, we carried out the fluorescence feasibility experiment. The fluorescence spectra are shown in Fig. 2B. When partzyme A and partzyme B are absent, the fluorescence signal is extremely weak. It indicates that if the two sequences are absent, the MNAzyme does not assemble, and the substrate fails to be cleaved, resulting in a low fluorescence signal after magnetic separation. Similarly, when magnesium ions are absent, the MNAzyme lacks cleavage activity, leading to a low fluorescence signal. When all the sequences are present and the concentration of magnesium ions is 10 mM, the MNAzyme exhibits powerful cleavage activity and the background signal drops relatively low after magnetic separation. In the presence of HER2, an intense fluorescence emission is obviously visible, which proves the feasibility of this experiment. These results show that the principle of the fluorescence assay for HER2 detection based on the MNAzyme sensing platform is feasible.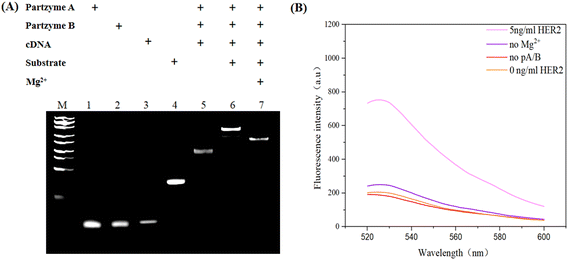 | ||
| Fig. 2 (A) Analysis of the MNAzyme sensing platform by 8% PAGE. (B) Fluorescence analysis of the MNAzyme sensing platform. | ||
3.3. Optimization of the experimental conditions
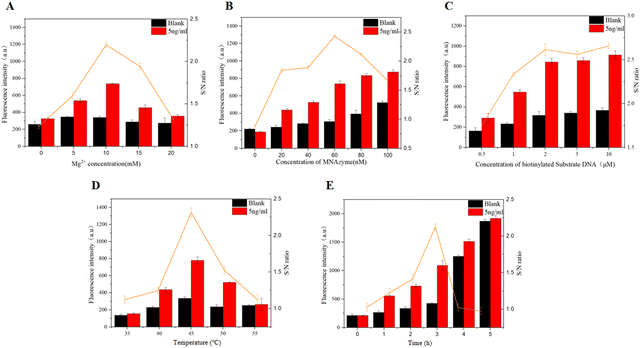
In order to obtain the optimal analytical performance, we optimized some important experimental conditions, including the optimization of Mg2+ concentration, the concentration of the MNAzyme and biotinylated substrate DNA, reaction temperature and reaction time. Mg2+ is an essential cofactor of the MNAzyme. Therefore, we originally investigate the effect of Mg2+ concentration on the cleavage activity of the MNAzyme. Five groups of different concentrations of Mg2+, ranging from 0 to 20 mM, are added to the reaction system. As shown in Fig. 3A, with the increase of Mg2+ concentration, the cleavage efficiency of the MNAzyme reaches the highest at 10 mM, and then gradually decreases. Moreover, the signal-to-noise ratio reaches the maximum at 10 mM. Thus, 10 mM is selected as the optimal reaction concentration.The cleavage activity of the MNAzyme is directly related to its own concentration. In other words, it is essential to ensure that the components of the MNAzyme are sufficient for the reaction. As illustrated in Fig. 3B, it is obvious that with the increase of concentrations from 0 nM to 100 nM, the collected signal gradually enhances. The signal-to-noise ratio achieves the maximum at 60 nM, which represents better detection effects. Consequently, 60 nM is chosen as the reaction concentration. The number of substrates loaded on magnetic beads is limited, and its concentration also has a great influence on the results. Thus, the concentration of the biotinylated substrate DNA is further investigated. As shown in Fig. 3C, with the increase of biotinylated substrate DNA concentration, both the background signal and the experimental signal increase. When the concentration is 2 μM, the signal reaches a plateau with the maximum signal-to-noise ratio. 2 μM of concentration is chosen for subsequent experiments. Finally, the temperature and time of the reaction are optimized. According to the experimental results, when the temperature is fixed at 45 °C and the reaction time arrives at 3 h, the MNAzyme biosensor shows best detection performance (Fig. 3D and E).
3.4. Detection sensitivity of the MNAzyme biosensor
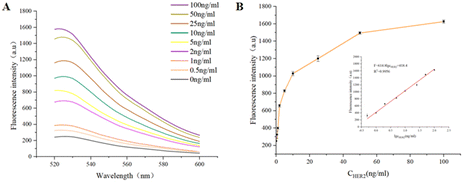
Under the optimal conditions, the analytical performance of the proposed biosensor was quantitatively detected by adding different concentrations of HER2 protein to the reaction solution, and the fluorescence spectra were recorded. As shown in Fig. 4A, the fluorescence intensity gradually increased with the increasing concentrations of HER2 from 0 ng mL−1 to 100 ng mL−1. The fluorescence intensity and the logarithmic of HER2 concentrations exhibited a linear relationship. The linear equation was F = 614.8![[thin space (1/6-em)]](https://www.rsc.org/images/entities/char_2009.gif) lg
lg![[thin space (1/6-em)]](https://www.rsc.org/images/entities/char_2009.gif) CHER2 + 418.4 (R2 = 0.9956) within the concentration range of 0.5–100 ng mL−1 (Fig. 4B), where F is the fluorescence intensity at 525 nm. The detection limit (LOD) was calculated to be 0.02 ng mL−1 in terms of the rule of 3 times standard deviation over the blank response.33 Compared with other previous studies which were relevant to HER2 detection, this method showed a wider linear range and a lower detection limit for HER2 detection.
CHER2 + 418.4 (R2 = 0.9956) within the concentration range of 0.5–100 ng mL−1 (Fig. 4B), where F is the fluorescence intensity at 525 nm. The detection limit (LOD) was calculated to be 0.02 ng mL−1 in terms of the rule of 3 times standard deviation over the blank response.33 Compared with other previous studies which were relevant to HER2 detection, this method showed a wider linear range and a lower detection limit for HER2 detection.
3.5. Detection selectivity
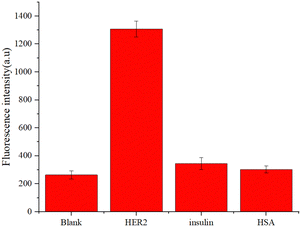
In order to evaluate the selectivity of the detection method to HER2 protein, the effect of other different proteins on this method was investigated. Insulin and human serum albumin (HSA) were prepared and subjected to the proposed procedure. As shown in Fig. 5, 20 ng mL−1 of HER2 protein could generate an enhanced fluorescence signal, while insulin and human serum albumin with the same concentration only led to a low fluorescence signal which was almost negligible. These results suggested that the MNAzyme biosensor possessed high specificity for HER2.3.6. Biological sample detection of HER2 and recovery assay
To confirm the application of this method in real samples, the MNAzyme biosensor was further applied to the detection of HER2 in six human serum samples: three collected from healthy people and three collected from breast cancer patients. As shown in Table 1, the results obtained with the biosensor were compared with those obtained with commercial ELISA kits. The calibration curve obtained by using the ELISA kit for the detection of HER2 is shown in Fig. S1 (ESI†). The result of the biosensor was consistent with that of the ELISA kit, showing its reliability in detecting HER2. In addition, to further evaluate the feasibility and accuracy of the method, the human serum samples were spiked with certain amounts of HER2. As shown in Table S3 (ESI†), the recoveries for 0.5, 1, 5, and 10 ng mL−1 HER2 added in serum samples were 112.0%, 108.0%, 98.4% and 104.4%, respectively, indicating the excellent practical application of this method.| Sample | ELISA kit (ng mL−1) | Sensor results (ng mL−1) | Relative error (%) |
|---|---|---|---|
| Healthy people | 15.64 ± 1.06 | 14.82 ± 0.87 | −5.24 |
| 8.38 ± 0.46 | 9.13 ± 0.59 | 8.95 | |
| 12.76 ± 1.34 | 14.67 ± 1.14 | 14.97 | |
| Breast cancers | 53.25 ± 3.23 | 48.34 ± 2.85 | −9.22 |
| 37.28 ± 2.24 | 41.43 ± 1.48 | 11.13 | |
| 43.89 ± 4.14 | 46.79 ± 3.15 | 6.61 |
4. Conclusions
In summary, a novel enzyme-free, low-cost and easy-to-operate biosensor based on MNAzyme signal amplification was developed for the detection of HER2 protein. In the design of the biosensor, the identification, conversion and amplification of the signal are elaborately integrated into the assembly and function of the MNAzyme. The introduced strategy provides the following advantages. First, this biosensor uses MNAzyme as the tool enzyme for signal amplification, which is cost-effective as it is mainly composed of synthetic DNA strands, removing the need for expensive protein-based enzymes. Compared with biological enzymes, it has the advantages of low cost, mild reaction conditions, strong stability and simple operation. Second, the high affinity of the aptamer to the target enables the detection with high specificity. At the same time, compared with free fluorescence substrates dissolved in solution, the utilization of magnetic separation of magnetic beads can effectively reduce the influence of background signals and efficiently improve the sensitivity of detection. Moreover, by changing the aptamer sequence, different protein markers can be detected and a general protein POC detection platform can be established. It is clear that the biosensor holds promising potential for distinguishing the samples of breast cancer patients from those of healthy people. To conclude, this biosensor may provide a good alternative for the sensitive detection of HER2 and contribute to early diagnosis and treatment of breast cancer.Data availability
All relevant data are within the manuscript and its ESI.†Conflicts of interest
The authors declare that they have no known competing financial interests or personal relationships that could have appeared to influence the work reported in this paper.Acknowledgements
This work is supported by the National Natural Science Foundation of China (Grant No. 82371283 and 81672570), and the State Key Laboratory of Natural and Biomimetic Drugs (Grant No. K202009).References
- R. L. Siegel, K. D. Miller, H. E. Fuchs and A. Jemal, Ca-Cancer J. Clin., 2022, 72(1), 7–33 CrossRef.
- L. Jing, C. Xie, Q. Li, M. Yang, S. Li, H. Li and F. Xia, Anal. Chem., 2022, 94(1), 269–296 CrossRef CAS PubMed.
- T. W. Jacobs, A. M. Gown, H. Yaziji, M. J. Barnes and S. J. Schnitt, J. Clin. Oncol., 1999, 17(7), 1974–1982 CrossRef CAS.
- S. Kiyose, H. Igarashi, K. Nagura, T. Kamo, K. Kawane, H. Mori, T. Ozawa, M. Maeda, K. Konno, H. Hoshino, H. Konno, H. Ogura, K. Shinmura, N. Hattori and H. Sugimura, Pathol. Int., 2012, 62(11), 728–734 CrossRef CAS PubMed.
- A. Qureshi, Y. Gurbuz and H. J. Niazi, Sens. Actuators, B, 2015, 220, 1145–1151 CrossRef CAS.
- G. Konecny, G. Pauletti, M. Pegram, M. Untch, S. Dandekar, Z. Aguilar, C. Wilson, H. M. Rong, I. Bauerfeind, M. Felber, H. J. Wang, M. Beryt, R. Seshadri, H. Hepp and D. J. Slamon, J. Natl. Cancer Inst., 2003, 95(2), 142–153 CrossRef CAS.
- X. Guo, S. Liu, M. Yang, H. Du and F. Qu, Biosens. Bioelectron., 2019, 139, 111312 CrossRef CAS.
- Y. Zhang, N. Li, Y. Xu, N. Qi, L. Peng, M. Yang, C. Hou and D. Huo, Anal. Chem., 2023, 95(16), 6586–6594 CrossRef CAS PubMed.
- L. Hu, S. Hu, L. Guo, C. Shen, M. Yang and A. Rasooly, Anal. Chem., 2017, 89(4), 2547–2552 CrossRef CAS PubMed.
- M. Shamsipur, M. Emami, L. Farzin and R. Saber, Biosens. Bioelectron., 2018, 103, 54–61 CrossRef CAS.
- W. Wang, R. Han, M. Chen and X. Luo, Anal. Chem., 2021, 93(19), 7355–7361 CrossRef CAS PubMed.
- G. Taylor and D. L. Freed, Nature, 1976, 259(5540), 237–239 CrossRef CAS PubMed.
- W. Xu, W. He, Z. Du, L. Zhu, K. Huang, Y. Lu and Y. Luo, Angew. Chem., Int. Ed., 2021, 60(13), 6890–6918 CrossRef CAS.
- A. D. Ellington and J. W. Szostak, Nature, 1990, 346(6287), 818–822 CrossRef CAS PubMed.
- C. Tuerk and L. Gold, Science, 1990, 249(4968), 505–510 CrossRef CAS PubMed.
- H. Sun and Y. Zu, Small, 2015, 11(20), 2352–2364 CrossRef CAS PubMed.
- W. Li, Z. Wang, T. Gao, S. Sun, M. Xu and R. Pei, J. Mater. Chem. B, 2022, 10(12), 2057–2066 RSC.
- X. Zhang and V. K. Yadavalli, Biosens. Bioelectron., 2011, 26(7), 3142–3147 CrossRef CAS PubMed.
- N. Nakatsuka, J. M. Abendroth, K. A. Yang and A. M. Andrews, ACS Appl. Mater. Interfaces, 2021, 13(8), 9425–9435 CrossRef CAS.
- G. Bozokalfa, H. Akbulut, B. Demir, E. Guler, Z. P. Gumus, D. D. Odaci, E. Aldemir, S. Yamada, T. Endo, H. Coskunol, S. Timur and Y. Yagci, Anal. Chem., 2016, 88(7), 4161–4167 CrossRef CAS.
- Q. Yuan, Y. Wu, J. Wang, D. Lu, Z. Zhao, T. Liu, X. Zhang and W. Tan, Angew. Chem., Int. Ed., 2013, 52(52), 13965–13969 CrossRef CAS.
- J. Shi, J. Lyu, F. Tian and M. Yang, Biosens. Bioelectron., 2017, 93, 182–188 CrossRef CAS.
- X. Li, X. Chen, M. Mao, C. Peng and Z. Wang, Biosens. Bioelectron., 2022, 217, 114725 CrossRef CAS.
- W. Qian, Z. Miao, X. J. Zhang, X. T. Yang, Y. Y. Tang, Y. Y. Tang, L. Y. Hu, S. Li, D. Zhu and H. Cheng, Mikrochim. Acta, 2020, 187(7), 407 CrossRef CAS PubMed.
- S. K. Silverman, Trends Biochem. Sci., 2016, 41(7), 595–609 CrossRef CAS PubMed.
- S. Zhand, Y. Zhu, H. Nazari, M. Sadraeian, M. E. Warkiani and D. Jin, Anal. Chem., 2023, 95(6), 3228–3237 CrossRef CAS.
- J. Chen, A. Zuehlke, B. Deng, H. Peng, X. Hou and H. Zhang, Anal. Chem., 2017, 89(23), 12888–12895 CrossRef CAS PubMed.
- L. Yang, Q. Wu, Y. Chen, X. Liu, F. Wang and X. Zhou, ACS Sens., 2019, 4(1), 110–117 CrossRef CAS PubMed.
- E. Mokany, S. M. Bone, P. E. Young, T. B. Doan and A. V. Todd, J. Am. Chem. Soc., 2010, 132(3), 1051–1059 CrossRef CAS PubMed.
- Y. Cao, H. Zhang and X. C. Le, Anal. Chem., 2021, 93(47), 15712–15719 CrossRef CAS PubMed.
- S. D. Neubacher and S. D. Hennig, Angew. Chem., Int. Ed., 2019, 131, 1278–1291 CrossRef.
- C. Yang, C. Du, F. Yuan, P. Yu, B. Wang, C. Su, R. Zou, J. Wang, X. Yan, C. Sun and H. Li, Biosens. Bioelectron., 2024, 51, 116089 CrossRef.
- P. Chen, L. Wang, P. Qin, B. C. Yin and B. C. Ye, Biosens. Bioelectron., 2022, 207, 114152 CrossRef CAS PubMed.
Footnotes |
| † Electronic supplementary information (ESI) available. See DOI: https://doi.org/10.1039/d4tb01813c |
| ‡ These authors contributed equally to this work. |
| This journal is © The Royal Society of Chemistry 2025 |

