
Emissive triphenylamine functionalised 1,8-naphthalimide and naphthalene diimide fluorophores: aggregation, computation and biological studies†
Laura
Ramírez Lázaro‡
 ab,
L. Constance
Sigurvinsson‡
ac,
Niamh
Curtin
d,
Joanna
Ho
a,
Ena T.
Luis
a,
Deirdre A.
McAdams
a,
Tómas A.
Gudmundsson
ac,
Chris S.
Hawes
e,
Denis
Jacquemin
fg,
Donal F.
O’Shea
cd,
Eoin M.
Scanlan
ab,
Thorfinnur
Gunnlaugsson
*abc and
Adam F.
Henwood
*ab
ab,
L. Constance
Sigurvinsson‡
ac,
Niamh
Curtin
d,
Joanna
Ho
a,
Ena T.
Luis
a,
Deirdre A.
McAdams
a,
Tómas A.
Gudmundsson
ac,
Chris S.
Hawes
e,
Denis
Jacquemin
fg,
Donal F.
O’Shea
cd,
Eoin M.
Scanlan
ab,
Thorfinnur
Gunnlaugsson
*abc and
Adam F.
Henwood
*ab
aSchool of Chemistry and Trinity Biomedical Sciences Institute (TBSI), Trinity College Dublin, The University of Dublin, Dublin 2, Ireland. E-mail: gunnlaut@tcd.ie; henwooda@tcd.ie
bSynthesis and Solid-State Pharmaceutical Centre (SSPC), School of Chemistry, Trinity College Dublin, Ireland
cAMBER (Advanced Materials and Bioengineering Research) Centre, Trinity College Dublin, The University of Dublin, Dublin 2, Dublin, Ireland
dDepartment of Chemistry, Royal College of Surgeons in Ireland (RCSI), 123 St. Stephen's Green, Dublin, Dublin 2, Ireland
eSchool of Chemical and Physical Sciences, Keele University, Keele ST5 5BG, UK
fNantes Université, CNRS, CEISAM – UMR 6230, 44000 Nantes, France
gInstitut Universitaire de France (IUF), 75005 Paris, France
First published on 26th November 2024
Abstract
Four new aromatic imides bearing triphenylamino (TPA) moieties are reported each of which differ by the number and/or positional arrangements of the TPA units. Compounds 1–3 are 1,8-naphthalimides (naps) that contain N,N′-diphenyl-[1,1′-biphenyl]-4-amino (TPA-Ph) groups appended to the N-termini of the respective imides. Each differs by their functionalisation of the 4-position of the nap: nitro (1), amino (2), or an additional TPA group (3). By contrast, compound 4 is a naphthalene diimide (NDI) functionalised with TPA-Ph moieties on each N-terminus. These simple modifications produce molecules with vastly different optoelectronic and aggregation properties. This article studies these characteristics with particular focus directed toward the contrast in aggregation-caused quenching (ACQ) properties of 2 compared with the aggregation-induced emission (AIE) properties of 3. The distinct aggregation and photophysical properties of 2 and 3 are delicately exploited using self-assembly with an amphiphilic poloxamer to generate nanoparticles capable of delivering 2 and 3 into cells for biological imaging.
Introduction
Fluorescence bioimaging is a vitally important technique that has revolutionised our understanding of biochemistry and chemical biology.1 As a non-invasive, benign, high-resolution imaging technique, bioimaging allows scientists to analyse the biological structure and function of cells with exceptional sensitivity and specificity.2 By incubating biological samples with appropriately designed, luminescent dyes, and irradiating them with a light source, the dyes produce light that can be used to build detailed three-dimensional images of their surrounding environments. Accordingly, many publications have been reported over the years detailing selective imaging of specific biomolecules,3 organelles,4 or cell lines.5In vivo imaging of whole organs and tumours is also getting better and better.6Typical luminescent organic dyes are comprised of planar, polycyclic aromatic, π-conjugated systems and emit from local excited (LE) states, charge transfer (CT) excited states, or mixed states comprising combinations of both. These molecules are inherently hydrophobic in nature and, accordingly, readily aggregate into particles when dispersed in aqueous media. This brings the π-clouds of neighbouring molecules into close proximity with each other which quenches their emission by excitonic coupling in a process termed ‘aggregation-caused quenching’ (ACQ).7 These dramatic changes in emission intensities of ACQ dyes can give exceptional contrasts in the resultant images and so this feature has been leveraged to image live animals7b and the delivery of luminescent nanoemulsions through the nose-to-brain pathway.7c These dyes have also been used in so-called “disaggregation-induced emission” (DIE) systems, showing selective recognition of oxoanions,7d G-quadruplex DNA,7e and the cell plasma membrane.7f That said, although ACQ molecules have their clear uses, the popularity of aggregation-induced emission (AIE) luminophores grows every year, predominantly due to their intrinsically high emissivity in aqueous media and in the solid state.7a,8 AIE dyes are typically comprised of multiple aromatic rings singly bonded to each other in a manner that allows for free intramolecular rotation in solution, ensuring facile population of non-emissive rotational states. However, aggregation in unfavourable solvent media induces “restricted intramolecular rotation” (RIR) which prohibits population of these non-emissive states, encouraging population of emissive states instead.8 This heightened luminescence in aqueous environments makes AIE dyes ideal candidates for both bioimaging and theranostic applications.8b
1,8-Naphthalimides (naps which are also referred to by some researchers as NIs) – particularly those functionalised with electron donating groups on the 3- or 4-positions – are a commonly studied class of fluorophore with excellent photophysical properties.9 The charge transfer (CT) excited states exhibited by donor–acceptor nap variants give rise to high quantum yields and large Stokes shifts and, accordingly, there have been considerable research efforts expended in studying how varying the donor functionalities can modulate their photophysical properties in recent times. Changing the donor strength modulates the electronics of these systems, and thus their emission colour. Hence, examples have been reported of naps bearing different electron donors including nitrogen,9b–d oxygen,9e or sulfur,9fetc. Complementarily, incorporating AIE motifs into the nap structures confers them with AIE properties10 and so examples of tetraphenylethylenyl (TPE)10b,c and triphenylamino (TPA) compounds9b,c have been reported (e.g. compounds R1 and R2 in Chart 1). TPAs are particularly attractive for conferring AIE because they combine the electron donating properties of amines with the AIE properties arising from three freely rotating aryl rings singly bonded to an atom of nitrogen. It is thus of no surprise that TPAs have become ubiquitous motifs of consideration in the design of new AIEgens,11 with countless examples reported in recent years detailing their uses as photocatalysts,11a photothermal agents,11b bioimaging agents,11c and solar cells.11d
 | ||
| Chart 1 Representative examples of previously reported nap-TPA conjugates (R1 and R2)9b,c and compounds synthesised and characterised for this current study (1–4). | ||
Given the important role played by both naps and TPAs in bioimaging, we undertook to further develop our understanding of the relationship between these two motifs, with the view to optimising future chromophore design and their applications. We previously observed that the TPA-functionalised compound R1, comprised of four aromatic units connected through single bonds, exhibited a stronger AIE response than a carbazolyl analogue comprised of only three aromatic units. We ascribed this AIE observation to cooperative electronic and RIR effects.9b Building on this observation, we sought to investigate two different aspects in the current study: (1) does adding even more aromatic units induce an even stronger AIE response? and; (2) is the regiochemical relationship of the TPA with respect to the nap an important consideration when designing AIE TPA-naps? Four compounds are the subject of this investigation: namely compounds 1–4 in Chart 1. Each of which contain N,N′-diphenyl-[1,1′-biphenyl]-4-amino (TPA-Ph) groups attached to the imide N-termini. Moreover, 1–3 also display different functionalities at the respective 4-positions of the nap ring; these being: nitro (1), amino (2), and triphenylamino (3). By contrast, 4 is a symmetric NDI analogue bearing a TPA-Ph moiety on each N-terminus. Herein, we give a full account of our investigation, which includes detailed characterisation of their structural, photophysical, and aggregation properties, through spectroscopic, computational, and biochemical analysis.
Results and discussion
Synthesis and structural characterisation
The synthesis of compounds 1–4 is shown in Scheme 1, while detailed experimental protocols are outlined in the ESI.† Compounds 1, 2 and 4 proceeded via synthesis of a common intermediate which began by coupling 1-bromo-4-nitrobenzene with 4-(diphenylamino)phenylboronic acid under previously reported Suzuki–Miyaura cross-coupling conditions to give the nitro precursor 5 in 80% yield after workup.12 Hydrogenation of this compound in the presence of Pd/C in methanol gave the corresponding amine 6 in near quantitative yields. | ||
Scheme 1 Synthesis of compounds 1–4. aNa2CO3 (2.0 eq.), toluene/water (5![[thin space (1/6-em)]](https://www.rsc.org/images/entities/char_2009.gif) :1 v/v), Pd(PPh3)4 (0.02 eq.), 78 °C, 18 h. bPd/C (10 wt%), MeOH, H2 (3 atm), RT, 3 h. cEtOH, 110 °C (microwave irradiation), 3 h. dPd/C (10 wt%), EtOH/MeOH (1:1 v/v), H2 (3 atm), RT, 9 h. eDMF, 153 °C, 96 h. fEtOH, 78 °C, 24 h. gSPhos (20 mol%), Pd(OAc)2 (10 mol%), K3PO4 (3.0 eq.), THF/water (5:1 v/v), 66 °C, 72 h. :1 v/v), Pd(PPh3)4 (0.02 eq.), 78 °C, 18 h. bPd/C (10 wt%), MeOH, H2 (3 atm), RT, 3 h. cEtOH, 110 °C (microwave irradiation), 3 h. dPd/C (10 wt%), EtOH/MeOH (1:1 v/v), H2 (3 atm), RT, 9 h. eDMF, 153 °C, 96 h. fEtOH, 78 °C, 24 h. gSPhos (20 mol%), Pd(OAc)2 (10 mol%), K3PO4 (3.0 eq.), THF/water (5:1 v/v), 66 °C, 72 h. | ||
Reaction of 6 with 4-nitro-1,8-naphthalic anhydride in ethanol, using microwave assisted synthesis, gave compound 1 in good yield (74%) and 1 could subsequently be reduced to give compound 2 under similar conditions to those used for 6 (H2, Pd/C, ethanol/methanol solvent mixture) with similarly high yields (92%). Compound 4 was synthesized directly by reacting naphthalene tetracarboxylic dianhydride with compound 6 in more forcing condensation conditions than those used for the synthesis of 1 (DMF, reflux, 96 h). Despite these conditions, 4 could still only be obtained in a moderate 47% yield after workup.
The synthetic route to access 3 was achieved through the amination of 4-bromo-1,8-naphthalic anhydride with 4-bromoaniline in ethanol, giving the dibrominated precursor compound 7 in close to quantitate yield (98%). Suzuki–Miyaura conditions were again employed to generate 3, but under more forcing conditions: both a more active precatalyst [20 mol% of SPhos and 10 mol% of Pd(OAc)2] and longer reaction times (72 h) were required to couple 7 with two equivalents of 4-(diphenylamino)phenylboronic acid. Even under these harsher experimental conditions, 3 was only generated in yields of 52%.
Compounds 1–4 were all characterised by 1H and 13C NMR spectroscopy, high-resolution mass spectrometry (HRMS), infrared spectroscopy and melting point analysis (see ESI†). Moreover, extensive X-ray crystallographic studies were also undertaken, the results of which will be discussed in the following section.
X-Ray crystallography
Single crystals of suitable quality for X-ray crystal structure analysis were grown of compounds 1–6 (see ESI† for their full crystallographic details). Discussion of the relevant crystallographic features of compounds 1–4 is given here, with their solid-state structures shown in Fig. 1, and images of their packing arrangements given in Fig. 2. Of note to the photophysical studies is that none of the molecules adopt planar structures in the solid state, instead all exhibiting the expected non-planar conformations driven by sterically induced twisting of the individual aromatic rings about their respective C–C and C–N single bonds, which is critical to their AIE function. This is a typically desirable observation for AIE molecules. The dihedral angles observed between the imides and the aryl rings appended to the N-termini are particularly large and, in some cases, are close to orthogonal [64.9(4)–93.6(4)°]. This mirrors the solution state photophysical and computational studies (vide infra), which suggest that as these dihedral angles become larger, the charge transfer (CT) transitions between these N-termini functionalised TPA units and their corresponding imides become ‘darker’, i.e. the probability of populating these states decreases. By contrast, a smaller dihedral angle is observed for the aryl ring of the TPA appended to the 4-position of the nap in compound 3 [49.3(7)°]. In compound 2 the amine substituent is almost coplanar with the naphthalimide; the mean plane, defined by the carbon atom at the naphthalimide 4-position and the two hydrogen bond acceptor oxygen atoms (ESI†), is twisted by 10.85(11)° relative to the naphthalimide mean plane. Both compounds exhibit significant CT character between their respective 4-functionalised amine donors and imide acceptors. The differences in the Stokes shifts observed between compounds 2 and 3 can be explained in part by these dihedral angles, as well as the larger D–A CT distance associated with 3 compared to 2 (vide infra). | ||
| Fig. 1 The X-ray crystal structures of compounds 1–4, with dihedral angles between the imides and the appended aryl rings labelled. Thermal ellipsoids are shown at 50% probability. C–H hydrogen atoms, solvent molecules, and disorder omitted for clarity. | ||
 | ||
| Fig. 2 Extended packing arrangements of compounds 1, 2, and 4. Thermal ellipsoids are shown at 50% probability and disorder is omitted for clarity. 1: View down the crystallographic a axis in the crystal structure of compound 1 showing the stacking of nap pairs and the position of co-crystallised toluene solvent. 2: Crystal packing of compound 2 showing extended amine–carbonyl hydrogen bonding, the lattice diethyl ether hydroperoxide molecule is omitted for clarity (ESI†). 4: Representation of the stacking in the crystal structure of compound 4, showing the close TPA-NDI contact. | ||
Variations in the solid-state packing arrangements of compounds 1–4 are significant (Fig. 2). Single crystals of compound 1 were grown by vapour diffusion of hexane into a solution of 1 in toluene, and the structure was refined in the space group P![[1 with combining macron]](https://www.rsc.org/images/entities/char_0031_0304.gif) . The compound co-crystallised with toluene, while crystals grown from other solvent mixtures, such as CHCl3/hexane, diffracted poorly, possibly indicating that the solvent plays a role in facilitating packing in the solid state. The toluene molecules are situated near the TPA moieties, while the nap units stack in offset head-to-tail pairs with a distance of 3.433(3) Å between the two planes.
. The compound co-crystallised with toluene, while crystals grown from other solvent mixtures, such as CHCl3/hexane, diffracted poorly, possibly indicating that the solvent plays a role in facilitating packing in the solid state. The toluene molecules are situated near the TPA moieties, while the nap units stack in offset head-to-tail pairs with a distance of 3.433(3) Å between the two planes.
The crystal structure of compound 2 was refined in the space group P. There is π–π stacking between nap units, with a distance of 3.451(3) Å between planes, while the stacking is in an offset, head-to-tail fashion. Additionally, hydrogen bonding interactions between the amines and neighbouring imide carbonyl groups [N1⋯O16 2.879(5) Å] are present, driving the formation of a continuous chain of molecules connected by hydrogen bonding along one plane. The combination of short intermolecular stacking distances and extended hydrogen bonded arrays are likely to be implicated in the dramatic ACQ behaviour exhibited by 2 (see discussion below). Interestingly, a well localised lattice solvent molecule was detected in the structure of 2 which did not correspond to the crystallisation solvent. This species was identified as diethyl ether hydroperoxide, a common oxidation product of unstabilised diethyl ether (ESI†). This species is present in only small quantities in the mother liquor, and it is even plausible that 2 photocatalysed its formation. Nevertheless, the hydrogen bond donor/acceptor tendencies of this species likely favoured inclusion; the guest molecule both donates a hydrogen bond to a naphthalimide carbonyl group [O42⋯O15 2.698(5) Å] and accepts a hydrogen bond from the amine group [N1⋯O43 3.213(5) Å].
The crystals of compound 3 were obtained by vapour diffusion of hexane into a DCM solution of 3 and the structure was refined in the P space group. No significant intermolecular interactions could be observed from the extended packing in the crystal, in large part because of the steric bulk from the TPA groups on both sides of the nap moiety. Interestingly, the molecule appears to have an overall bend in the solid state; the nitrogen atoms of both TPA groups do not lie on the plane formed by the nap moiety, which is different to that observed for the other imide-containing structures.
Crystals of compound 4 were grown by slow evaporation of a solution of 4 in CHCl3. The structure was refined in the space group P and the asymmetric unit contains half a molecule of compound 4 as well as CHCl3 at half occupancy. Like compound 1, crystals grown from other solvent mixtures diffracted poorly, demonstrating the role of solvent in the solid-state structure. The bulky TPA groups prevent close packing between NDI units. Instead, there is stacking between each NDI unit and an adjacent TPA phenyl group (3.537(2) Å). No other significant interactions were present in the extended packing of this structure.
UV-Visible absorption and emission spectroscopy
Having successfully synthesised compounds 1–4, solution state photophysical studies were undertaken next. THF was initially chosen as the solvent for these studies due to its good miscibility with both apolar and polar solvents. In particular, its miscibility with water has made it a common solvent of choice for conducting AIE studies. Although compounds 1–3 showed good solubility in THF, the poor solubility of 4, however, in virtually all solvents necessitated measuring its spectral properties in CHCl3. The molar absorptivity and emission spectra for these compounds are shown in Fig. 3, while the relevant absorption and emission data are summarised in Table 1, and additional relevant spectroscopic data can be found in the ESI.† In particular, Fig. S50–S55 (ESI†) show UV-visible absorption, excitation, and emission spectra recorded for 2 and 3 in toluene, 1,4-dioxane, ethyl acetate, THF, chloroform and dichloromethane, as part of Lippert–Mataga analysis to characterise the nature of their respective CT states (vide infra). As shown in Fig. 3, all four compounds exhibit two high energy absorption bands corresponding to π–π* transitions (ca. 310 and 350 nm).13 Two additional sharp, strongly absorbing and well-defined vibronic bands at 362 and 381 nm were observed only for compound 4. These are distinct transitions that are commonly observed for many core-unsubstituted NDI molecules.14 | ||
| Fig. 3 Absorption (solid lines) and normalised emission (dashed lines) spectra of compounds 1 (red), 2, (orange), 3 (pink) and 4 (blue). Emission spectra for 2 and 3 were recorded at excitation wavelengths of 360 and 420 nm, respectively. 1 and 4 are not emissive so no emission spectra are shown. Measurements were carried out in THF for compounds 1–3 and in CHCl3 for 4. Inset: Zoomed absorption spectrum of compound 4 in CHCl3. | ||
| Compound | λ abs (nm) [ε (× 105 M−1 cm−1) ± 10%] | λ PL (nm) | λ PL (nm) | λ PL (nm) | Φ PL ([%] ± [10%]) | Φ PL ([%] ± [10%]) | τ PL ([ns] ± [10%]) | k r (× 107 s−1) | k nr (× 108 s−1) |
|---|---|---|---|---|---|---|---|---|---|
| a Measurements were carried out in triolein with λexc = 420 nm. b Measurement carried out on P188 assemblies in water with λexc = 340 nm. c Quinine sulfate used as the reference (ΦPL = 54.6% in 0.5 M H2SO4 at 298 K).16 d λ exc = 340 nm. e λ exc = 360 nm. f λ exc = 420 nm. g Measurements were carried out in CHCl3. | |||||||||
| 1 | 309(sh) [3.89], 341 [5.39] | — | — | — | — | — | — | — | — |
| 2 | 291(sh) [1.94], 313(sh) [2.13], 329 [2.25], 421 [1.06] | 500e | 496 | 534 | 25 | <1 | 6.56 | 3.81 | 1.14 |
| 3 | 309 [6.46], 332 [6.06], 418 [2.01] | 601f | 546 | 590 | 14 | 4 | 4.51 | 3.10 | 1.91 |
| 4 | 314(sh) [5.30], 347 [7.38], 362 [7.87], 382 [5.81], 501 [0.01] | — | — | — | — | — | — | — | — |
In the lower energy regions of the spectrum, only compounds 2 and 3 exhibit any notable absorption, with broad and unstructured bands (λmax = 421 and 418 nm, respectively) characteristic of CT transitions.15 Specifically, these CT bands arise due to photoinduced electron transfer (PET) from the electron donating amine (2) or TPA (3) units on the 4-positions of the naphthalimide rings to the imide electron acceptors, as confirmed by theory (vide infra). The higher molar absorptivity of the CT band of 3 (∼20000 M−1 cm−1) compared to 2 (∼10000 M−1 cm−1) is a result of the additional aromatic contributions by the phenyl rings of the TPA unit compared to the structurally simpler primary amine. Notably, there is very little difference (3 nm, 170 cm−1) in the energies of these two bands, which is in contrast to the differences seen in their emission properties (vide infra). We also measured the photophysical properties of both compounds in triolein (see the ESI†), to simulate the environment inside lipid droplets inside cells, although no significant changes were observed for 2 (λabs = 414 nm) or 3 (λabs = 423 nm) to that seen in solution.
Assigning these CT bands to a “4-substituted-electron-donor-to-imide” transition is further supported by the lack of corresponding bands observed for compounds 1 and 4, despite the presence of the distinctly electron-donating TPA units on the N-termini of these two compounds. Therefore, it is plausible that the large dihedral angles observed in the solid state between the imides and the N-termini appended phenyl rings, across the series, is likely to be operative in solution as well. Both the presence and molar absorptivity of CT transitions in the absorption spectra is a function of the degree of orbital overlap between the electron donor and the acceptor. Donors and acceptors which are situated close to mutual orthogonality necessarily exhibit very low absorptivity values, or no absorption at all. Thus, compound 1 does not exhibit any allowed absorption beyond ca. 400 nm since the large imide-phenyl-TPA dihedral angle makes the overlap vanishingly small. Concomitantly, the electron withdrawing properties of the nitro group makes it a rather passive moiety in the lowest transition (vide infra). Interestingly, while 4 exhibits no significant absorption past 400 nm either, upon closer analysis at high enough concentrations (ca. 10−4 M), a very weak, poorly resolved band centred at 501 nm (∼100 M−1 cm−1) can be detected. Although the high concentrations necessary to observe this band mean that this transition may be excimeric in its nature, based on the very low absorptivity and large donor–acceptor dihedral angles, we tentatively ascribe this transition to a TPA-to-imide CT band instead. This assignment is confirmed by theory (vide infra). Reducing the dihedral angle does induce orbital overlap that enables electron transfer to occur; however, adopting such a confirmation is energetically unfavourable, as it necessarily exerts considerable steric strain on 4. Thus, 4 exhibits planar conformations only transiently making electron transfer much less probable and, as such, greatly reducing the molar absorptivity of the corresponding absorption band.
The trends observed in the emission properties of compounds 1–4 mirror those observed in their low energy absorption spectra, wherein the presence of an electron donating functionality on the 4-position of the nap ring system dictates whether any emission is observed. Accordingly, of the four compounds studied herein, only 2 and 3 are emissive. Their corresponding normalised emission spectra are shown as dashed lines in Fig. 3. The same dihedral angle arguments made for the trends in absorption spectra are applicable here too: a suitably large dihedral angle between donor and acceptor necessarily disrupts electronic conjugation, prohibiting population of an emissive CT state via PET. While no emission would be expected to be observed from compound 1, since the nitro substituent is a known quenching moiety, the lack of any detectable emission from 4 either conclusively demonstrates that introducing electron donating groups directly onto the amide N-terminus does not result in any CT-type emissive excited state. Even when the photophysical properties of 4 were probed at high concentrations no excimer-based emission could be detected. Thus, symmetry prohibits electron transfer from TPA units directly appended to the amides on the same molecule, rendering these dark states. Furthermore, the steric bulk of the non-planar TPA units is likely to prohibit neighbouring molecules of 4 from experiencing any significant intermolecular interactions that might induce excimer-based emission. This will be a significant contrast with the behaviour of 2 during aggregation studies (vide infra).
The emission spectra of both 2 and 3 are broad, symmetric, and unstructured which is indicative of classical CT-type excited states. Interestingly, while there is virtually no difference in the wavelengths of the CT-based absorption bands of compounds 2 and 3 (421 and 418 nm, respectively) their emission bands differ significantly (500 and 601 nm, respectively), with compound 2 exhibiting significantly smaller Stokes shifts than compound 3 (80 nm, 3810 cm−1 for 2 and 182 nm, 7227 cm−1 for 3). This is predominantly a result of the presence of an aryl spacer between the nap and nitrogen donor atom in 3, which leads to greater separation of charge and thus a larger dipole moment in the excited state.
To corroborate our observations in the chemical biology (vide infra), we measured the photophysical data of 2 and 3 in triolein. For 2, the emission spectrum is only very modestly blueshifted compared to its emission in THF, while 3 undergoes a drastically large (55 nm, 1677 cm−1) blueshift in its emission profile (λPL = 496 and 546 nm for compounds 2 and 3, respectively, in triolein). These differences in spectral shifts prompted us to undertake Lippert–Mataga analysis to quantify the nature of the CT states exhibited by 2 and 3. The spectra underpinning this analysis are shown in Fig. S50–S55 (ESI†) and the data is summarised in Table S2 (ESI†). In all cases, the Stokes shift values recorded for 2 were much lower than for 3 (e.g. toluene: 1842 cm−1 for 2 and 4573 cm−1 for 3; THF: 3015 cm−1 for 2 and 7171 cm−1 for 3). Plotting this data (Fig. 4) allows for estimations of the difference in dipole moments (Δμ, Table S3, ESI†) between the ground and excited states for compounds 2 and 3, which could be compared to the theoretically determined values. The experimentally determined values (Δμ = 13.7 and 20.7 D for 2 and 3, respectively) support the assertion that the CT state is more pronounced in 3 than 2 due to the larger charge separation necessitated by 3. The same trend is observed theoretically (Δμ = 3.5 and 20.4 D for 2 and 3, respectively) albeit with a much smaller predicted Δμ value for 2. This discrepancy is likely a function of compound 2 engaging in different degrees of hydrogen bonding with the surrounding solvents, which probably accounts for the poorer data fit observed for 2 than for 3 in the Lippert–Mataga plots. This is corroborated by the very closely aligned experimentally and theoretically determined Δμ values observed for 3. Thus, the larger difference in dipole moment between ground and excited states renders 3 more solvatochromic than 2 and prone to larger spectral shifts in different solvent environments. Lastly, an additional rotational effect may be operative as well, where the small primary amine in 2 does not require any significant structural distortions in the excited state to alleviate steric strain, while for compound 3 the size of the TPA moiety exerts large steric demands which are alleviated by free rotation about the nap-TPA bonds. This would also act to reduce the emission energy.
 | ||
| Fig. 4 Lippert–Mataga plot of Stokes shift (Δν) versus the solvent orientation polarizability (Δf) for compounds 2 (orange) and 3 (pink). Data was acquired upon recording UV-visible absorption and emission spectra for both compounds in toluene (1), 1,4-dioxane (2), chloroform (3), ethyl acetate (4), THF (5), and dichloromethane (6). The data has been fit to a linear plot and the corresponding linear functions and R2 values are given. | ||
These rotational effects may also explain the differences in the measured quantum yields (ΦPL = 25% and 14% for compounds 2 and 3, respectively) and in the excited state lifetimes (τPL = 6.5 and 4.5 ns for compounds 2 and 3, respectively) observed for both compounds. Here, the free rotation of aryl units in solution is the primary quenching mechanism of many AIE molecules. However, the energy gap law, which states that the rate of non-radiative decay (knr) from an electronic excited increases with decreasing emission energy, is also a plausible explanation. We do observe larger knr values for 3 than for 2 (knr = 1.14 × 10⁸ and 1.91 × 10⁸ s−1 for compounds 2 and 3, respectively).
Turning to the literature helps us further contextualise the data presented here, and we will first discuss substitution at the 4-position of the nap moiety. In one report, an extensive photophysical study into a family of 4-aminonaphthalimides bearing butyl chains on the imide N-termini was undertaken (Fig. 5).17 It was consistently shown, in a number of solvents of varying polarities, that substituting the primary –NH2 (λPL = 500 nm in THF, compound R3) donor group with aliphatic linear (e.g. –NBu2, λPL = 522 nm in THF, compound R4) or cyclic (e.g. N-azepanyl, λPL = 528 nm in THF, compound R5) units induced small redshifts in the emission profiles (up to 28 nm, 1071 cm−1, in THF). This is in line with our own observations, although the redshifts in the fluorescence emission we observe going from 2 to 3 are much greater. However, even with the authors observing only small redshifts in emission across their systems (implying negligible energy gap law effects) they nevertheless also observed drastic quenching effects with ΦPL = 86%, 32%, and 13% in THF for R3, R4, and R5, respectively, and reductions in the respective lifetimes; τPL = 10.8, 5.7, and 2.5 ns in THF for R3, R4, and R5, respectively, with increased steric bulk at the nap 4-position. This is very much in line with the higher quantum yield and longer lifetime values we determined for 2 compared to that of 3, which corroborates our assertion that the sterically induced rotational processes introduced by the TPA in the 4-position of 3 play a major role in lowering the quantum yield efficiency.
 | ||
| Fig. 5 Examples of 4-aminonaphthalimides bearing various amines of increasing steric bulk and their relevant photophysical parameters, measured in THF. | ||
Next, we will discuss the effect of the substitution on the imide N-terminus. As observed throughout this study, the aryl-TPA group exerts no measurable electronic influence, with the large dihedral angles between donor and acceptor rendering any possible CT states ‘dark’ in nature. That is borne out here too: the emission of 2 coincides with R3 (λPL = 500 nm for both 2 and R3 in THF) and the emission of 3 coincides with R1 (λPL = 601 and 603 nm for 3 and R1, respectively). By contrast, the effects on the quantum yields are much more significant: R3 is an extremely efficient emitter compared to 2 (ΦPL = 86%, and 25% in THF for R3, and 2, respectively) while R1 is also more emissive than 3 (ΦPL = 22%, and 10% in THF, respectively). Thus, while the aryl-TPA units on the N-termini of 2 and 3 are incapable of modulating the electronics of these systems, it is clear that the kinetic effects of aryl ring rotation can introduce additional quenching effects that reduce the quantum yields of these compounds. To validate this, we next carried out computational investigation into these possible effects.
Theoretical calculations
To obtain insights into the nature of the excited states, we have used time-dependent density functional theory (TD-DFT, see details in the ESI†) calculations. Briefly, we used a range-separated functional17 and a solvent model including both linear-response and state-specific effects,18 as we deal with both bright and CT states. We also recall that we report below vertical TD-DFT values, which are expected to differ from the measured λmax values, due to the lack of vibronic corrections. Consequently, we are looking at qualitative correlations only.The electron density difference (EDD) plots for the lowest relevant transitions in 1–4 are displayed in Fig. 6. For 1, the lowest excited state corresponds to a TPA-to-nap CT transition, with a very large computed value of 8.4 Å, using Le Bahers’ model.19 This transition is located at 497 nm, but is perfectly dark (f = 0.000), which is consistent with the perpendicular arrangement discussed above, and thus this transition is too weak to be experimentally detectable. The experimentally observed transition at 341 nm, which was ascribed to a nap-based π–π* transition, is in close agreement with the computed value of 345 nm, which attributes this transition to a largely localised state spanning the nap core and the nitro group, with very little CT character (CT distance of 0.5 Å).
 | ||
| Fig. 6 EDD plots for selected states of compounds 1–4. The blue and red lobes represent regions of decrease (donor) and increase (acceptor) of electron density upon photoexcitation. Contour threshold: 1 × 10⁻³. We also provide the vertical transition energies and oscillator strength. Note that for 4, the two lowest states are both degenerate, dark states, so only one state is shown here. | ||
Things become radically different for compound 2, where the lowest energy transition involves a bright NH2-to-nap CT (distance of 1.7 Å) that we compute at 363 nm, which is significantly blueshifted compared to the experimental values (421 nm). By contrast, the second state (S0–S2, not shown in Fig. 6) is a TPA-to-nap CT transition, analogous to the lowest energy transition observed for 1. Thus, moving from an electron withdrawing nitro group to an electron donating amino group inverts the character of the two lowest electronic transitions, which is the logical consequence of the accepting nature of the naphthalimide core. In going from 2 to 3, the lowest energy transition constitutes a similarly bright CT between the 4-functionalised TPA unit and the nap; but with a greater charge separation (CT distance of 4.7 Å), which is a logical consequence of the stronger separation between the electron donor and nap in 3 than in 2. The theory predicts a significant hyperchromic shift in this band, which is observed experimentally, but also a moderate redshift of 29 nm, which is not experimentally observed. Lastly, the two lowest energy transitions in 4 (S0–S1 and S0–S2) are essentially degenerate, which is a function of the highly symmetric structure of the NDI.
As with the S0–S1 transition of 1, which was a low energy, TPA-to-nap, dark CT state, the two degenerate transitions in 4 are low energy (predicted to occur at 507 nm), TPA-to-NDI dark CT states. Experimentally, no CT-type absorption band was observed for 1, while a poorly absorbing band (501 nm) was observed for 4. This is almost certainly because the absorption band in 4 is comprised of two nearly degenerate transitions, compared to just one in 1. The third excited state in 4 (S0–S3) corresponds to a locally excited, bright transition involving reorganization on the NDI core. This is the strong, vibrationally-resolved band observed experimentally in the 360–380 nm domain.
For emission, we optimized the lowest energy excited states. In both 2 and 3, this leads to bright transitions (f = 0.42 and 1.21 for 2 and 3, respectively) with computed vertical emissions at 433 and 512 nm, respectively, which is compatible with the observed fluorescence. While these values are blueshifted with respect to the experimental measurements, theory nevertheless reproduces the significantly smaller relaxation energy of 2 than 3, with respective theoretical Stokes shifts of 4469 and 5976 cm−1. This effect is principally due to the stronger CT character in 3. Given the large dihedral angles in 3, we searched for evidence of a twisted intramolecular charge transfer (TICT) state, but no such state could be observed. For 1 (4), it is of no surprise that the geometric relaxation of the lowest excited state yields to a very low-lying still nearly dark transition at 2127 nm with f = 0.021 (1167 nm, f = 0.002). Obviously, such very long wavelengths correspond to extremely effective non-radiative deactivation pathways (energy gap law), whereas the tiny f indicates very low radiative rates, explaining the absence of fluorescence experimentally through so-called dark state quenching.
Aggregate studies
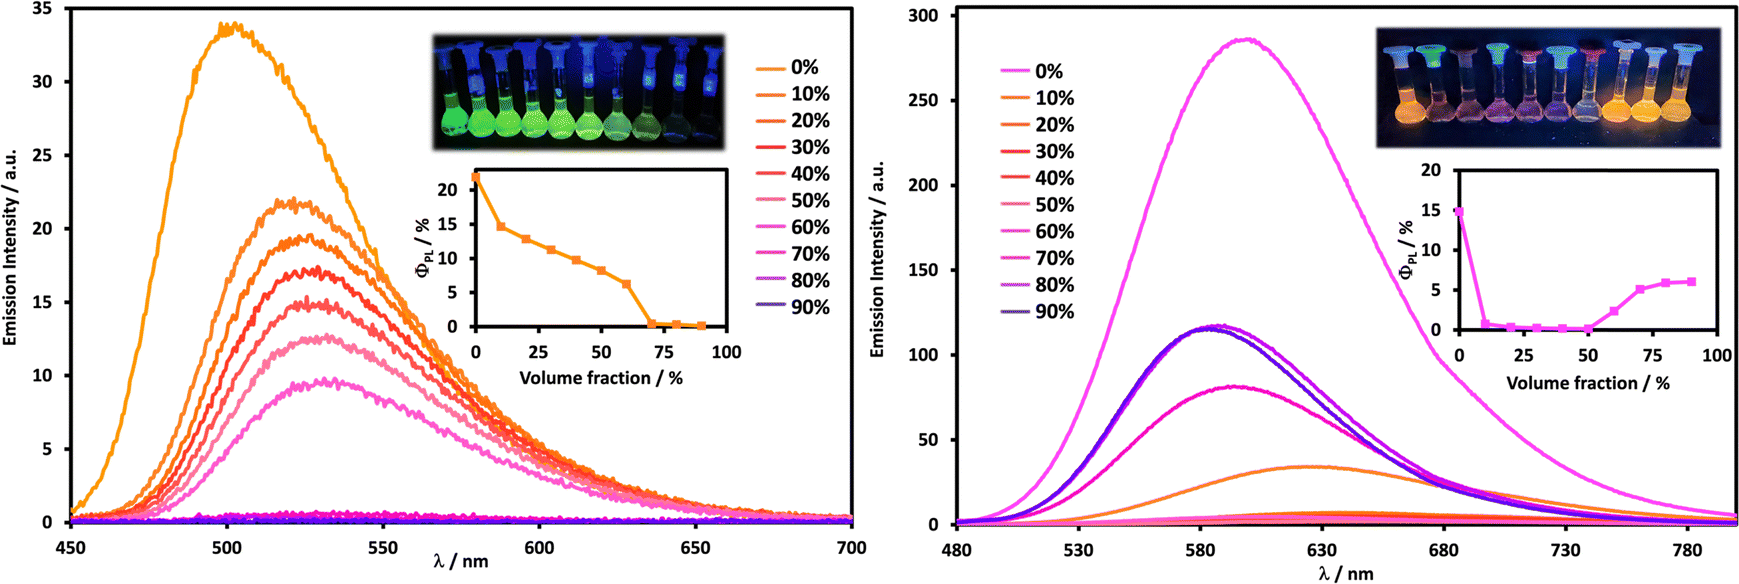 | ||
| Fig. 7 THF/H2O emission titrations for compounds 2 and 3. Solutions were maintained at optical densities of 0.1 through the titrations (c = 10.8 μM, λex = 326 nm for 2, left; c = 6.58 μM, λex = 420 nm for 3, right). Spectra show the emission of these compounds recorded in varying solvent ratios of THF and water, from 0% (yellow for 2 and pink for 3) up to 90% water (purple for both 2 and 3). Inset images: Photographs of solutions in a dark room upon irradiation with UV light (365 nm) and graphs showing the changes in photoluminescence quantum yields of 2 and 3 with increasing volume fractions of water. | ||
These titration experiments were performed at 10.8 μM for compound 2 and in triplicate. Upon addition of H2O, the emission redshifts and the photoluminescence quantum yields decline. There is an initial, abrupt change going from 100% to 90% THF, where the emission redshifts from 500 to 522 nm, and the quantum yield is reduced from 22% to 15%. While this is a distinctly solvatochromic phenomenon, driven by stabilisation of the CT state by the larger dipole moment of water compared to THF, the initially large redshifting and quenching effects are likely attributable to additional, supplemental hydrogen bonding effects between the water molecules and the amines and/or carbonyl units of compound 2.20 Moving forward, further additions of water further redshift and quench the emission, but this now occurs in a more gradual manner, and approximately in a linear fashion up to the example consisting of 40% THF in water (λPL = 533 nm; ΦPL = 6%), underpinned by solvatochromic effects inducing redshifts in the emission and energy gap law effects reducing the quantum yields.
Upon moving below 40% THF volume fractions in water, a new trend in the photophysics is observed. At this point, the emission becomes almost totally quenched and does not recover for the rest of the titration (ΦPL < 1% in <40% v/v THF in water). Only very weak, steadily blueshifting, residual emission bands can be detected at 30% THF in water (λPL = 536 nm) and 20% THF in water (λPL = 513 nm), with no emission observed at 10% THF in water. A few different processes underpin the different observations described here, and we will explain the emission energy phenomenon first. While the hydrogen bonding properties of the –NH2 groups confer a degree of amphiphilicity to 2, it is nevertheless a broadly hydrophobic compound, and hydrophobicity mainly drives its aggregation in high water content environments. Thus, the modest blueshift observed in the residual emission reflects the more apolar, hydrophobic local environment experienced by the dye within the aggregate, compared to the significantly more polar bulk solvent environment.
The emission quenching trend occurs in three distinct stages: 0 → 10% water, 10 → 60% water, and in greater than 60% water. Going from 0 to 10% water drastically reduces the quantum yield, which, as discussed above, arises from both the solvatochromic effects as well as hydrogen bonding interactions introduced between 2 and water. In the 10–60% water range the gradual, linear decrease in the emission does reflect an increase in hydrogen bonding interactions. However, the retention of emission in this volume fraction regime also points to the kinetic, dynamic nature of these hydrogen bonding interactions, which means that at any given time, there are molecules of 2 in solution not hydrogen bonding with water such that they can dissipate their energy in a radiative fashion. This is distinct from the aggregation phase that occurs above 60% water. In this regime, the naps now ‘see’ or experience interactions with fewer water molecules within the aggregated particles but, at the same time, they experience a much higher effective concentration of hydrogen bonding functional groups, as many nap molecules begin to aggregate and are more tightly packed. This causes them to engage in extensive amine–carbonyl hydrogen bonding networks within the aggregates, analogous to those observed in the solid state, and it is this effect that quenches the emission with overwhelming efficiency. Thus, 2 clearly exhibits ACQ behaviour driven by hydrogen bonding effects.21 Any suppression of TPA-based rotational quenching upon aggregation of 2 does not counteract this ACQ behaviour.
Comparable investigations were conducted for compound 3 at a concentration of 6.58 μM. It is immediately apparent that distinct trends are observed to those seen for 2. In the first instance, the initially bright emission observed in 100% THF for 3 undergoes drastic quenching upon the addition of even smallest quantities of water. Within the 10 → 50% water volume fraction ranges, this is clearly observed, with the quantum yields being less than 1%, while the polarity of the solvent stabilises the dipole moment of 3, decreasing the energy gap, and inducing a redshift in emission up to 644 nm at 50% water. This also causes energy gap law effects to become increasingly dominant, resulting in the quenching of the emission.22 However, at a water volume fraction of 60% or above, compound 3 aggregates, reversing this trend! The emission is restored (λPL = 606 nm and ΦPL = 2% at 60% water), concomitantly enhancing in intensity, becoming blueshifted in wavelength with each increasing water volume fractions, up to 90% water (λPL = 583 nm and ΦPL = 6% at 90% water). As described for 2, upon aggregation 3 experiences a locally less polar environment than that of the bulk solvent. Since solvatochromic effects are still operative, this blueshifts the emission and mitigates the energy gap law quenching processes.
This distinctive “on–off–on” AIE behaviour observed for compound 3 is reminiscent of the AIE we reported for R1, except R1 is a bluer emitting, more emissive compound in the aggregated state (λPL = 566 nm, ΦPL = 33% at 90% water). As previously discussed with R1, the AIE of these compounds is driven by: (1) solvatochromic blueshifts in emission that counteract the energy gap law; and (2) suppressing rotational quenching effects within a rigidified aggregate environment. While these are two synergistic effects, working in concert to enhance the emission of these dyes, it is difficult to excise out which of these effects contributed more to the emission enhancement in R1. Given the brighter, bluer emission of R1 than 3, we can infer that it is the anti-solvatochromic features of these aggregated dyes that are likely to play a more significant role. Suppressing the additional rotational quenching contributions introduced by the N-terminus appended aryl-TPA does not appear to lead to a better AIE response.
 | ||
| Fig. 8 SEM images of compounds 2 (left box) deposited onto a silica substrate from solutions of: 100% THF (top left), 90% THF/water (top right), 50% THF/water (bottom left) and 10% THF/90% water (bottom right) (c = 1.57 × 10⁻⁵ M). SEM images of compound 3 (right box) deposited onto a silica substrate from solutions of: 100% THF (top left), 90% THF/water (top right), 20% THF/water (bottom left) and 10% THF/water (bottom right) (c = 6.58 × 10⁻⁶ M). | ||
Imaging the sample of 2 deposited from a 100% THF solution revealed the formation of flaky, semi-crystalline particles, exhibiting diameters ranging from 330 to 1400 nm, a notable variance in size. Upon the addition of small quantities of water (90% THF/water) compound 2 exhibits largely homogeneous, spherical particles with diameters ranging from 170 to 340 nm. This morphology remained broadly consistent across solutions of volume fractions up to 50% THF in water, although the particles steadily decreased in size to 110–200 nm. Above these volume fractions (e.g. 10% THF in water) we observe large, non-uniform, flaked, clusters.
The trends here mirror the photophysical aggregate studies, albeit with some variability due to the faster evaporation rates of THF than water. For example, the sample from the 100% THF solution reflects the compound slowly precipitating from solution as the THF evaporates. By contrast, in volume fraction ranges of 10 → 50% water, enough THF remains to keep the dye in solution. However, as the THF evaporates the effective increase in water percentage coerces the dye into forming nanoparticles, in the same way we observe aggregation in the analogous photophysical titrations. The smaller nanoparticles observed with higher initial water percentages reflects the kinetic features of this process. Lastly, the disordered structures observed at high water fractions points to rapid aggregation and subsequent precipitation of 2.
The deposition of compound 3 from a 100% THF solution resulted in the formation of relatively uniform spherical particles with diameters in the range of 40–120 nm. Transitioning to a 90% THF solution in water resulted in the formation of clustered particles, displaying diameters ranging from 50–400 nm. At much higher water content (20% THF in water and 10% THF in water), the particles exhibited a deviation from their spherical shape, manifesting edged surfaces with diameters spanning from 150 to 220 nm for 20% THF in water and 200 to 500 nm for 10% THF in water.
 | ||
| Scheme 2 Synthesis of co-assembled particles in aqueous P188. Reagents and conditions: THF, sonication (1 min), solvent evaporation, addition of H2O, sonication (1 min), RT 16 h. | ||
Briefly, each compound and P188 were dissolved in THF and sonicated for one minute. Following sonication, the THF was evaporated, water was added to each sample, and the mixtures were sonicated for an additional minute before being allowed to equilibrate at room temperature for 16 hours. Dynamic light scattering (DLS) experiments on both the 2-P188 and 3-P188 co-assemblies showed the formation of self-assembled polymer nanoparticles with an approximate size of 150 nm for both 2 and 3 (see ESI†) which is in line with the values observed for previous P188 particles.9b,23 Crucially, photophysical studies on these assemblies showed that the 2-P188 particles are essentially non-emissive (ΦPL < 1%), and only weak emission could be observed (λPL = 534 nm), with this value mirroring that observed at high water content regimes in the water–THF titrations carried out on 2 (e.g. λPL = 536 nm for 2 in 30% THF in water). This indicates that 2 adopts an aggregated state within the P188 core.
By contrast, for the 3-P188 particles some emission was detectable (λPL = 590 nm) but, again, it was very weak (ΦPL = 4%). As with 2, these numbers are also comparable to the photophysical values measured in the high-water content regimes (λPL = 583 nm and ΦPL = 6% for 3 in 90:10 water/THF) which also suggests it is emitting from an aggregated “on” state, rather than the disaggregated “on” state. Both compounds adopting aggregated states is in line with our previous work on P188 co-assemblies, where we surmised that water hydration of PPO and PEO polymer groups within the assemblies can induce aggregation of dyes,9b although it is possible that the confined environment generated by the P188 is sufficient to force them into an aggregated state.
Studies in MDA-MB 231 cells
Given their interesting photophysical properties, we sought to investigate the molecular and supramolecular interactions of 2-P188 and 3-P188 in cells. Relevant experimental protocols, as well as the co-localisation dye (Fig. S82, ESI†), additional fluorescence images (Fi. S83, ESI†), and UV-visible absorption and emission spectra (Fig. S84, ESI†) can be found in the ESI.† For 2, MDA-MB 231 human breast cancer cells were incubated with a 5 μM solution of particles for 2 h and fixed prior to imaging with confocal fluorescence microscopy. Gratifyingly, it was observed that the compound was successfully taken up by the cells (Fig. 9, left box, panels A and B), with nap emission originating throughout the cytosol.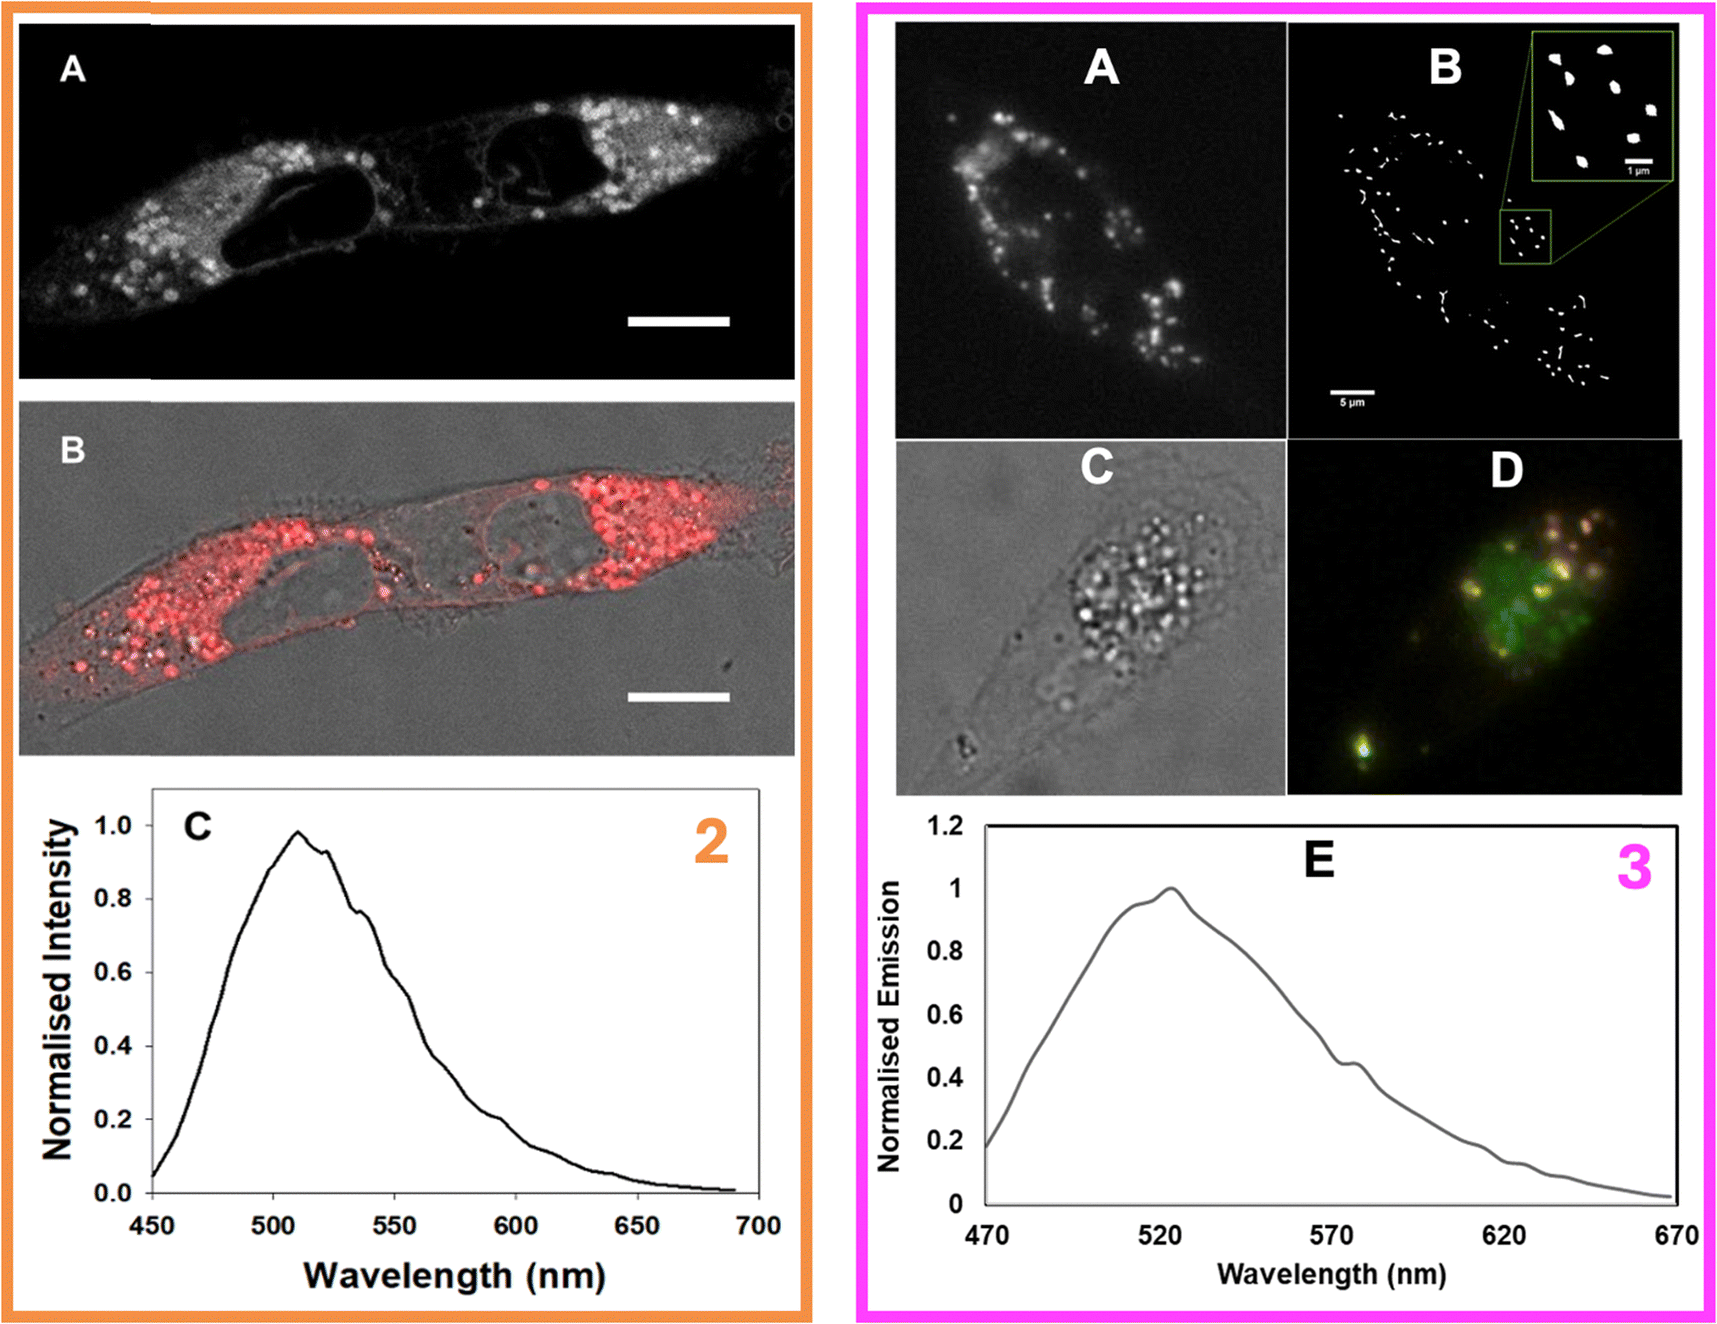 | ||
| Fig. 9 Left box: CLSM fixed cell imaging of MDA-MB 231 cells following incubation with 2-P188 for 2 h (5.0 μM) (A) Intracellular emission of 2 (B) overlap of emission on DIC cell image (C) CLSM acquired emission spectra of 2 inside cytosol, scale bar 10 μm. Right box: Fluorescence imaging of 3 in MDA-MB 231 cells. (A) Widefield image and (B) corresponding SRFF image following 2 h incubation, scale bar 5 μm and expansion scale bar μmm (green box). (C) Brightfield image and (D) overlay fluorescence image of 3 and 5 following a 2 h incubation. (E) Intracellular emission spectrum of 3. | ||
Z-Stack imaging (see Movie 1 ESI†) showed that this intracellular emission originated primarily from defined vesicles distributed throughout the cytosol which had close resemblance to lipid droplets (LDs). The intracellular emission spectrum was measured (Fig. 9, left box, panel C) showing a λmax at 510 nm which was modestly redshifted compared to the values measured for compound 2 dissolved in THF (501 nm) and triolein (495 nm, Fig. S84, ESI†), but is significantly blue-shifted compared to the residual emission observed for the 2-P188 particles (534 nm). Since 2 is an ACQ molecule emitting from a CT state, emission can only be observed from a disaggregated configuration. Thus, upon delivery to cells, the non-emissive particles are disassembled which releases 2 and results in so-called “disaggregation-induced emission”. Since the intensity of emission is enhanced by subversion of energy gap law quenching effects in apolar environments, the brightest emission will be observed from the most hydrophobic regions in which 2 can be found, such as LDs.
Next, the molecular and supramolecular interactions of 3 with live MDA-MB 231 cancer cells were investigated by employing widefield and super-resolution radial fluctuations (SRRF) microscopies. SRRF was selected for this study as a purely analytical super-resolution imaging approach since it is compatible with any fluorophore and can be used to retrieve super-resolution information from widefield fluorescence microscopes.24 Although the 3-P188 solutions were more emissive than their 2-P188 analogues, their weak emission nevertheless allowed for a continuous live cell uptake study to be first carried out to identify the optimal incubation time point. Following treatment of cells with a 5.10 μM solution of 3-P188, brightfield and fluorescence images were acquired every 10 min using a constant set of imaging parameters. The steady increase in intracellular fluorescence over time showed that by 2 h an efficient delivery of 3 into the cells had been achieved (see Movies 2–4, ESI†). At this time point the cells were sufficiently emissive to discern a strong punctate staining pattern indicative of accumulation in vesicles within the cytoplasm (Movie 4, ESI†). This is in contrast to our previous work on compound R1, which required fluorescence lifetime imaging to distinguish between the extracellular, aggregated “on” state and the intracellular, disaggregated “on” state.9b
Next, cells were incubated with 3 for 2 h and images were acquired from the same fields of view (FOV) as widefield and SRRF images (Fig. 9, right box, panels A, B and ESI,† Fig. S83 for repeat experiment). A stream of 100 cell images (frame rate of 20 images per second) were taken using a widefield microscope from which the Image J plugin Nano-J-SRRF was used to generate the SRRF image. The dramatic improvement in image quality allowed a clear view of the vesicles in which 3 had accumulated which were suspected to be LDs (panel B). LDs are intracellular organelles that act as storage sites for triacylglycerols and cholesterols with their importance beyond this role being increasingly recognised for both normal and abnormal cellular functions. For example, emerging cancer therapeutic strategies target LDs as a means to inhibit cell proliferation and LDs are associated with neurodegenerative disorders such as Parkinson's and Alzheimer's disease.25
Confirmation of LD localisation was obtained through dual staining of cells with 3 and a longer emitting BF2-azadipyrromethene fluorophore 8 (ESI,† Fig. S84), which is known to effectively stain LDs.23b Following a simultaneous co-treatment of cells with both fluorophores for 2 h, cell images were acquired using excitations at 435 nm and 630 nm for 3 and 8, respectively (Fig. 9, right box, panels C and D). Overlaying of the lower wavelength emission of 3 with that of 5 showed the fluorescence from both was confined to the same subcellular regions. Using data from a triplicate of experiments, a Pearson correlation coefficient of 0.94(0.03), and Manders’ coefficients values of 0.74(0.06) and 0.90(0.04), were determined, confirming a high level of co-localisation of both fluorophores. The intracellular λmax value obtained for 3 was 520 nm, which is significantly blueshifted from the values measured for the disaggregated emission in THF (λPL = 601 nm) or the aggregated emission in 90:10 water/THF (λPL = 583 nm). Instead, it is much closer to the value measured in triolein (λPL = 546 nm) which is indicative of the disaggregated state this compound adopts within the highly lipophilic microenvironment found within LDs.
Conclusions
In conclusion, four novel aromatic imides bearing triphenylamino (TPA) moieties have been synthesized, differing in the number and positional arrangements of the TPA units around the imides. Functionalisation of the N-termini of these compounds with TPA moieties had very little effect on the electronics of these systems, as symmetry restrictions render the CT states to be completely dark in nature. However, the photophysical properties are highly sensitive to substitution at the 4-position of the nap groups, with the –NH2 functionalised compound 2 displaying green emission in THF (λPL = 500 nm) that undergoes aggregation-caused quenching (ACQ) effects with increasing volume fractions of water, driven by hydrogen bonding effects. This is in direct contrast with compound 3 which, bearing a TPA group on the 4-position of the nap, exhibits orange (λPL = 583–601 nm), highly solvatochromic, “on–off–on” aggregation-induced emission (AIE) behaviour, due to the large excited state dipole moment and hydrophobicity introduced by the TPA at the 4-position. Both compounds underwent co-assembly with the amphiphilic poloxamer P188 to generate non-/poorly emissive nanoparticles that readily delivered both 2 and 3 into the lipid droplets of MDA-MB 231 human breast cancer cells. The poor emissivity of the nanoparticles, compared to the bright, disaggregated emission of both 2 and 3 in these hydrophobic LD environments, gave images of high contrast which should inform the design of new bioimaging dyes of potential theranostic and clinical use in the future.Author contributions
L. R. L. carried out: synthesis, characterisation, and relevant absorption and emission spectroscopic studies of compounds 1, 2, and 4, as well as related intermediates; co-assembly studies with P188; performed the major role in writing these compounds and combining acquired data. L. C. S. carried out: synthesis and characterisation of compound 3, and related intermediates; performed relevant absorption and emission spectroscopic studies of this compound; co-assembly studies with P188; SEM studies on compounds 2 and 3; major writing relating to 3. N. C. performed biological studies on the 2-P188 and 3-P188 co-assemblies. J. H. performed initial synthetic studies toward compounds 1. E.T.L. and D. A. M. collected the crystallographic data and solved the crystal structures; E. T. L. wrote the primary text relating to the crystallographic analysis. T. A. G. performed SEM studies on compound 3. C. S. H. performed the Hirshfeld analysis on compound 3. D. J. performed the computational studies and wrote the primary text relating to the computational analysis. D. O. S. provided supervision, expertise, and feedback, particularly in relation to the biological studies, and provided funding for N.C. to perform the biological studies. E. M. S. provided supervision, expertise, and feedback, and partly funded L. R. L. to carry out this work. T. G. provided expertise and feedback and provided funding for the project, including for L. R. L. and L. C. S. A. F. H.: conceived the idea and design of the project; supervision of L. R. L. and L. C. S.; managed the project from each stage, from inception to publication; performed the main role in the designed and guidance of the manuscript writing.Data availability
CCDC 2365261–2365266 contain the supplementary crystallographic data for this paper.Conflicts of interest
There are no conflicts to declare.Acknowledgements
D. J. This research used resources of the GLiCID Computing Facility (Ligerien Group for Intensive Distributed Computing, https://doi.org/10.60487/glicid, Pays de la Loire, France). T. G. and D. O. S., thank Science Foundation and the SFI Amber Centre (SFI 12/RC/2278_P2), and the Advanced Microscopy Laboratory (AML), TCD for access to SEM (to LCS and TG via the SFI/EPSRC Doctoral Training Centre). T. G., A. F. H., D. O. S. and E. M. S. thank Science Foundation Ireland and the SSPC (SFI 12/RC/2275/P2) for financial support. E. T. L. and D. A. thank IRC for financial support. E. T. L.: the research conducted in this publication was jointly funded by the Irish Research Council under grant number GOIPD/2020/585. The authors thank Dr Brendan Twamley (TCD) for useful discussions.Notes and references
- (a) N. C. Shaner, M. Z. Lin, M. R. McKeown, P. A. Steinbach, K. L. Hazelwood, M. W. Davidson and R. Y. Tsien, Nat. Methods, 2008, 5, 545 CrossRef CAS PubMed; (b) O. Shimomura, Angew. Chem., Int. Ed., 2009, 48, 5590 CrossRef CAS PubMed; (c) G. Lukinavičius, L. Reymond, E. D’Este, A. Masharina, F. Göttfert, H. Ta, A. Güther, M. Fournier, S. Rizzo, H. Waldmann, C. Blaukopf, C. Sommer, D. W. Gerlich, H.-D. Arndt, S. W. Hell and K. Johnson, Nat. Methods, 2014, 11, 731 CrossRef PubMed; (d) X. Wang, Q. Ding, R. R. Groleau, L. Wu, Y. Mao, F. Che, O. Kotova, E. M. Scanlan, S. E. Lewis, P. Li, B. Tang, T. D. James and T. Gunnlaugsson, Chem. Rev., 2024, 124, 7106 CrossRef CAS PubMed; (e) H. Niu, J. Liu, H. M. O’Connor, T. Gunnlaugsson, T. D. James and H. Zhang, Chem. Soc. Rev., 2023, 52, 2322–2357 RSC.
- (a) Z. Guo, S. Park, J. Yoon and I. Shin, Chem. Soc. Rev., 2014, 43, 16 RSC; (b) Y. Yang, Q. Zhao, W. Feng and F. Li, Chem. Rev., 2013, 113, 192 CrossRef CAS PubMed; (c) H. M. Kim and B. R. Cao, Chem. Rev., 2015, 115, 5014 CrossRef CAS PubMed; (d) K. Y. Zhang, Q. Yu, H. Wei, S. Liu, Q. Zhao and W. Huang, Chem. Rev., 2018, 118, 1770 CrossRef CAS PubMed.
- T. Kowada, H. Maeda and K. Kikuchi, Chem. Soc. Rev., 2015, 44, 4953 RSC.
- (a) H. Zhu, J. Fan, J. Du and X. Peng, Acc. Chem. Res., 2016, 49, 2115 CrossRef CAS; (b) S. K. Pramanik and A. Das, Chem. Commun., 2021, 57, 12058 RSC; (c) S. J. Butler, L. Lamarque, R. Pal and D. Parker, Chem. Sci., 2014, 5, 1750 RSC; (d) T. C. Pham, T. T. H. Hoang, D. N. Tran, G. Kim, T. V. Nguyen, T. V. Pham, S. Nandanwar, D. L. Tram, M. Park and S. Lee, ACS Appl. Mater. Interfaces, 2023, 15, 47969 CrossRef CAS PubMed.
- (a) C. Anorma, J. Hedhli, T. E. Bearrood, N. W. Pino, S. H. Gardner, H. Inaba, P. Zhang, Y. Li, D. Feng, S. E. Dibrell, K. A. Kilian, L. W. Dobrucki, T. M. Fan and J. Chan, ACS Cent. Sci., 2018, 4, 1045 CrossRef CAS PubMed; (b) J. Chen, R. Chen, C. V. Chau, A. C. Sedgewick, Q. Xue, T. Chen, S. Zeng, N. Chen, K. K. Y. Wong, L. Song, Y. Ren, J. Yang, J. L. Sessler and C. Liu, J. Am. Chem. Soc., 2024, 146, 4620 CrossRef CAS PubMed; (c) M. H. Lee, A. Sharma, M. J. Chang, J. Lee, S. Son, J. L. Sessler, C. Kang and J. S. Kim, Chem. Soc. Rev., 2018, 47, 28 RSC; (d) K. Fujita and Y. Urano, Chem. Rev., 2024, 124, 4021 CrossRef CAS PubMed.
- (a) S. Liu, R. Chen, J. Zhang, Y. Li, M. He, X. Fan, H. Zhang, X. Lu, R. T. K. Kwok, H. Lin, J. W. Y. Lam, J. Qian and B. Z. Tang, ACS Nano, 2020, 14, 14228 CrossRef CAS PubMed; (b) J. Li, Y. Dong, R. Wei, G. Jiang, C. Yao, M. Lv, Y. Wu, S. H. Gardner, F. Zhang, M. Y. Lucero, J. Huang, H. Chen, G. Ge, J. Chan, J. Chen, H. Sun, X. Luo, X. Qian and Y. Yang, J. Am. Chem. Soc., 2022, 144, 14351 CrossRef CAS; (c) G. Hong, A. L. Antaris and H. Dai, Nat. Biomed. Eng., 2017, 1, 0010 CrossRef CAS.
- (a) Y. Hong, J. W. Y. Lam and B. Z. Tang, Chem. Soc. Rev., 2011, 40, 5361 RSC; (b) Y. Cai, X. Ji, Y. Zhang, C. Liu, Z. Zhang, Y. Lv, X. Dong, H. He, J. Qi, Y. Lu, D. Ouyang, W. Zhao and W. Wu, Aggregate, 2023, 4, e277 CrossRef CAS; (c) E. Ahmad, Y. Feng, J. Qi, W. Fan, Y. Ma, H. He, F. Xia, X. Dong, W. Zhao, Y. Lu and W. Wu, Nanoscale, 2017, 9, 1174 RSC; (d) J. Yang, C.-C. Dong, X.-L. Chen, X. Sun, J.-Y. Wei, J.-F. Xiang, J. L. Sessler and H.-Y. Gong, J. Am. Chem. Soc., 2019, 141, 4597 CrossRef CAS PubMed; (e) M. Deiana, K. Chand, J. Jamroskovic, I. Obi, E. Chorell and N. Sabouri, Angew. Chem., Int. Ed., 2020, 59, 896 CrossRef CAS PubMed; (f) D. Wu, S. Cheung, G. Sampedro, Z.-L. Chen, R. A. Cahill and D. F. O’Shea, Biochim. Biophys. Acta, Biomembr., 2018, 1860, 2272 CrossRef CAS PubMed.
- (a) H. Wang, E. Zhao, J. W. Y. Lam and B. Z. Tang, Mater. Today, 2015, 18, 365 CrossRef CAS; (b) J. Qian and B. Z. Tang, Chem, 2017, 3, 56 CrossRef CAS.
- (a) S. Banarjee, E. B. Veale, C. M. Phelan, S. A. Murphy, G. M. Tocci, L. J. Gillespie, D. O. Frimannsson, J. M. Kelly and T. Gunnlaugsson, Chem. Soc. Rev., 2013, 42, 1601 RSC; (b) A. F. Henwood, N. Curtin, S. Estalayo-Adrián, A. J. Savyasachi, J. I. Lovitt, L. Constance Sigurvinsson, H. L. Dalton, C. S. Hawes, D. Jacquemin, D. F. O’Shea and T. Gunnlaugsson, Chem, 2024, 10, 578 CrossRef CAS; (c) X. Zheng, W. Zhu, F. Ni, H. Ai, S. Gong, X. Zhou, J. L. Sessler and C. Yang, Chem. Sci., 2019, 10, 2342 RSC; (d) M. Martínez-Calvo, S. A. Bright, E. B. Veale, A. F. Henwood, D. C. Williams and T. Gunnlaugsson, Front. Chem. Sci. Eng., 2020, 14, 61 CrossRef; (e) E. E. Rudebeck, T. D. Ashton, A. F. Henwood, T. Gunnlaugsson and F. M. Pfeffer, Org. Biomol. Chem., 2023, 21, 5970 RSC; (f) F. Zhang, F. Chen, R. Shen, Y. Chen, Z. Zhao, B. Zhang and J. Fang, Anal. Chem., 2023, 95, 4301 CrossRef CAS PubMed.
- (a) P. Gopikrishna, N. Meher and P. K. Iyer, ACS Appl. Mater. Interfaces, 2018, 10, 12081 CrossRef CAS PubMed; (b) Y. Yin, Z. Chen, C. Fan, G. Liu and S. Pu, ACS Omega, 2019, 4, 14324 CrossRef CAS PubMed; (c) S. M. Sayed, H.-R. Jia, Y.-W. Jian, Y.-X. Zhu, L. Ma, F. Yin, I. Hussain, A. Khan, Q. Ma, F.-G. Wu and X. Lu, J. Mater. Chem. B, 2021, 9, 4303 RSC; (d) J. M. Delente, D. Umadevi, S. Shanmugaraju, O. Kotova, G. W. Watson and T. Gunnlaugsson, Chem. Commun., 2020, 56, 2562 RSC; (e) E. Calatrava-Pérez, J. M. Delente, S. Shanmugaraju, C. S. Hawes, C. D. Williams, T. Gunnlaugsson and E. M. Scanlan, Org. Biomol. Chem., 2019, 17, 2116 RSC; (f) S. Shanmugaraju, D. Umadevi, L. M. G. Barcia, J. M. Delente, K. Byrne, W. Schmitt, G. W. Watson and T. Gunnlaugsson, Chem. Commun., 2019, 55, 12140–12143 RSC.
- (a) X.-L. Li, D.-L. Cheng, K.-K. Niu, H. Liu, S.-S. Yu, Y.-B. Wang and L.-B. Xing, J. Mater. Chem. A, 2023, 11, 24911 RSC; (b) P. Liang, Y. Wang, P. Wang, J. Zou, H. Xu, Y. Zhang, W. Si and X. Dong, Nanoscale, 2017, 9, 18890 RSC; (c) Y. Li, L. Chen, L. Si, Y. Yang, C. Zhou, F. Yu, G. Xia and H. Wang, J. Mater. Chem. B, 2023, 11, 2431 RSC; (d) P. Agarwala and D. Kabra, J. Mater. Chem. A, 2017, 5, 1348 RSC.
- A. Ionescu, R. Lento, T. F. Mastropietro, I. Aiello, R. Termine, A. Golemme, M. Ghedini, N. Bellec, E. Pini, I. Rimoldi and N. Godbert, ACS Appl. Mater. Interfaces, 2015, 7, 4019 CrossRef CAS PubMed.
- A. Saini and K. R. J. Thomas, RSC Adv., 2016, 6, 71638 RSC.
- (a) C. Röger and F. Würthner, J. Org. Chem., 2007, 72, 8070 CrossRef PubMed; (b) S. V. K. Isukapalli, P. Pushparajan and S. R. Vennapusa, J. Phys. Chem. A, 2022, 126, 1114 CrossRef CAS PubMed.
- S. Roquet, A. Crovino, P. Leriche, O. Alévêque, P. Frère and J. Roncali, J. Am. Chem. Soc., 2006, 128, 3459 CrossRef CAS PubMed.
- W. H. Melhuish, J. Phys. Chem., 1961, 65, 229 CrossRef CAS.
- S. Saha and A. Samanta, J. Phys. Chem. A, 2002, 106, 4763 CrossRef CAS.
- C. A. Guido, A. Chrayteh, G. Scalmani, B. Menucci and D. Jacquemin, J. Chem. Theory Comput., 2021, 17, 5155 CrossRef CAS PubMed.
- T. Le Bahers, C. Adamo and I. Ciofini, J. Chem. Theory Comput., 2011, 7, 2498 CrossRef CAS PubMed.
- K. Zhang, J. Shu, W. Chu, X. Liu, B. Xu and W. Jiang, Dyes Pigm., 2021, 185, 108898 CrossRef CAS.
- P. Li, D. Zhang, Y. Zhang, W. Lu, J. Zhang, W. Wang, Q. He, P. Théato and T. Chen, ACS Macro Lett., 2019, 8, 937 CrossRef CAS PubMed.
- J. Maillard, K. Klehs, C. Rumble, E. Vauthey, M. Heilemann and A. Fürstenberg, Chem. Sci., 2021, 12, 1352 RSC.
- (a) S. Cheung and D. F. O’Shea, Nat. Commun., 2017, 8, 1885 CrossRef PubMed; (b) N. Curtin, M. Garre, J.-B. Bodin, N. Solem, R. Méallet-Renault and D. F. O’Shea, RSC Adv., 2022, 12, 35655 RSC.
- S. Culley, K. L. Tosheva, P. M. Pereira and R. Henriques, Int. J. Biochem. Cell Biol., 2018, 101, 74 CrossRef CAS PubMed.
- (a) Q. Liu, Q. Luo, A. Halim and G. Song, Cancer Lett., 2017, 401, 39 CrossRef CAS PubMed; (b) B. C. Farmer, A. E. Walsh, J. C. Kluemper and L. A. Johnson, Front. Neurosci., 2020, 14, 742 CrossRef PubMed.
Footnotes |
| † Electronic supplementary information (ESI) available. CCDC 2365261–2365266. For ESI and crystallographic data in CIF or other electronic format see DOI: https://doi.org/10.1039/d4tb01905a |
| ‡ L. R. L. and L. C. S. contributed equally to this work. |
| This journal is © The Royal Society of Chemistry 2025 |