DOI:
10.1039/D4YA00548A
(Paper)
Energy Adv., 2025,
4, 162-175
Synergetic effect towards high electrochemical performance in LaMnO3–Co3O4 composites
Received
26th September 2024
, Accepted 10th November 2024
First published on 11th November 2024
Abstract
Electrochemical energy storage devices, especially supercapacitors, require electrode materials with high specific capacitance, excellent stability, and efficient charge transfer kinetics. This study presents LaMnO3(LMO)–Co3O4 composites as advanced electrode materials designed to enhance specific capacitance for electrochemical applications. The xLMO–(100% − x) Co3O4 composites (with wt% x values of 100%, 90%, 70%, 50%, and 0%) were synthesized using an auto-combustion method followed by calcination at 900 °C. X-ray diffraction analysis confirmed the presence of the individual compounds in the intended ratios. N2 adsorption/desorption measurements revealed that the LMO–Co3O4 composites have a mesoporous structure with a high surface area, with the LMO–Co3O4 (70%:30%) composites achieving the highest specific surface area of 6.78 m2 g−1. The electrochemical performance of these composites was evaluated using cyclic voltammetry, charge–discharge, and electrochemical impedance spectroscopy in a three-electrode system with a 1 M KOH electrolyte. The battery-type LMO–Co3O4 (70%:30%) composites exhibited outstanding electrochemical performance, showing a specific capacitance of 1614 F g−1 at a scan rate of 1 mV s−1 and 660 F g−1 at a current density of 0.5 A g−1, along with energy and power densities of 33 W h kg−1 and 203 W kg−1, respectively. This hybridization approach leverages the strengths of each material to enhance overall electrochemical performance.
1. Introduction
The rapid development of renewable energy sources and the increasing demand for portable electronics and electric vehicles have intensified the need for efficient and high-capacity energy storage solutions.1–3 Among the diverse range of energy storage technologies, electrochemical capacitors, also known as supercapacitors, stand out as promising options due to their high power density, fast charge and discharge rates, and extended cycle life. Supercapacitors store energy via the electrostatic adsorption of ions at the interface between the electrode and electrolyte, making them an ideal complement to batteries for applications that demand quick energy release and rapid recharging.4,5 Supercapacitors are classified into three types based on their charge storage mechanisms: electric double-layer capacitors (EDLCs), pseudocapacitors (PCs), and hybrid capacitors, which integrate both EDLC and PC technologies. This classification reflects their methods of energy storage, which involve electrostatic interactions and redox reactions.6,7 EDLCs based on carbonaceous electrode materials show high specific capacitance and long cycle life, facilitating efficient charge storage.1,8–10 However, their relatively low energy density limits the widespread adoption of supercapacitors in commercial applications. To address this challenge, a promising approach is integrating pseudocapacitors (PCs), which utilize redox reactions during charging and discharging cycles to enhance energy density. This approach includes materials such as metal-based oxides, polymers, and perovskites.11 Some metal oxide RuO2 has high specific capacitance but is expensive to commercialize.
Perovskite oxide materials have recieved more attention in various fields, including solar cells, gas sensing, fuel cells, magnetic data storage devices, metal–air batteries, and PCs due to their physical and structural stability as well as catalytic properties.12–17 Among them, LaMnO3, a perovskite oxide, has attracted significant attention as an energy storage material due to its inherent properties, particularly oxygen vacancy, which significantly enhance the specific capacitance of the material.18 Further, LMO offers good specific capacitance, primarily through the Mn3+/Mn4+ redox couple, typically exhibits faster ionic diffusion and better electronic conductivity, leading to a higher power density, making LMO more suitable for applications requiring rapid energy delivery, and generally offers better stability, especially in alkaline electrolytes, and can maintain performance over more extended cycling periods, making it more durable in long-term applications.
Recently, composite electrode materials have garnered significant attention to achieve synergistic enhancements in electrochemical performance. By combining multiple materials with complementary properties, such as high conductivity, large surface area, and electrochemical stability, composite electrodes offer the potential to overcome the limitations of individual components and optimize overall energy storage performance. V. V. Deshmukh et al. synthesized the Co3+ doped LaMnO3 by following the sol–gel method and got a specific capacitance of 651.54 F g−1 in 5 mV s−1 scan rate for La0.8Co0.2MnO3 compound.19,20 Na Zhang et al. synthesized LaCoO3/Co3O4 perovskites composites via the hydrothermal method. They found 1055.0 mA h g−1 in 100 mA g−1 current density.20 A. Dhakal et al. synthesized LaMnO3–Mn3O4 (70%:30%) composites through the auto-combustion method with a specific capacitance of 584 F g−1 at a scan rate of 1 mV s−1.21 Hongwei Tian et al. synthesized LaMnO3@NiCo2O4 composites by a facile hydrothermal method and reported a specific capacitance of 811 C g−1 at a current density of 0.5 A g−1 in 6 M KOH electrolyte.22 By using the electrodeposition process, Pianpian Ma et al. synthesized LaMnO3/MnO nano-arrays and exhibited a specific capacitance of 260 F g−1 at a current density of 0.5 A g−1 in 0.5 M Na2SO4.23 Zhiyi Lu et al. synthesized Co3O4@Ni–Co–O via a hydrothermal process and found 1525 F g−1 at a current density of 30 mA cm−2 in 1 M KOH electrolyte.24 Graham W. Piburn et al. synthesized LaMnO3–SiO2 by direct overgrowth around the short channel version of SBA-15 silica and obtained a specific capacitance of 200 F g−1 at a current density of 1 A g−1 in 1 M KOH electrolyte.25
The rationale behind integrating LMO and Co3O4 lies in their complementary characteristics. LMO and Co3O4 have different redox potentials and mechanisms. Combining them can enhance capacitance due to the broader range of redox reactions available. This synergy can increase the overall specific capacitance of the hybrid material. Further, LMO and Co3O4 operate through different redox couples (Mn3+/Mn4+ and Co2+/Co3+/Co4+), which can result in a more balanced electrochemical profile. This balance can lead to consistent performance across a range of operating conditions. LMO contributes to high power density due to its good ionic and electronic conductivity. When combined with Co3O4, which may have slower kinetics but higher energy density, the hybrid can achieve a balance between high energy and high-power densities. By adjusting the ratio of LMO to Co3O4, the electrochemical properties of the hybrid material can be fine-tuned to meet specific application requirements, such as prioritizing energy or power density.
2. Experimental methods
2.1. Materials and reagents
La(NO3)3·6H2O (lanthanum(III) nitrate hexahydrate), Co(NO3)2·6H2O (cobalt(II) nitrate hexahydrate), Mn(NO3)2·4H2O (manganese(II) nitrate tetrahydrate), C6H8O7·H2O (citric acid monohydrate), polyvinylidene fluoride (PVDF), and N-methylpyrrolidone (NMP) were purchased from Sigma Aldrich with 99% purity. These chemicals were directly used in the synthesis of LMO–Co3O4 composites without purification.
2.2. Synthesis of LaMnO3–Co3O4 composites
The synthesis of composites (LMO, Co3O4, LMO–Co3O4 (90%:10%), LMO–Co3O4 (70%:30%), LMO–Co3O4 (50%:50%)) with different wt% was carried out by one-pot auto-combustion process.26 The stoichiometric ratio of La(NO3)3·6H2O, Mn(NO3)2·4H2O, and C6H8O7·H2O dissolved in the 20 mL of DI water and placed on the magnetic stirring. Simultaneously, the Co(NO3)2·6H2O, and C6H8O7·H2O dissolved in another 20 mL of DI water and subjected to magnetic stirring for 15 minutes. The solution of Co(NO3)2·6H2O, and C6H8O7·H2O was added to the La(NO3)3·6H2O, Mn(NO3)2·4H2O, and C6H8O7·H2O mixture and placed on a hot plate at 120 °C with continuous magnetic stirring. The sample was allowed to undergo auto-ignition, after which the sample was kept in a hot furnace and maintained at 900 °C overnight. The resulting product was the composite of LMO–Co3O4. The chemical reaction for the formation of LMO–Co3O4 composites can be expressed as eqn (1), and a schematic diagram for the composite synthesis is presented in Fig. 1.| | | La(NO3)3·6H2O + Mn(NO3)2·4H2O + 3Co(NO3)2·6H2O + C6H8O7·H2O → LaMnO3 + Co3O4 + 11N2 + 6CO2 + 33H2O + 17/2O2 | (1) |
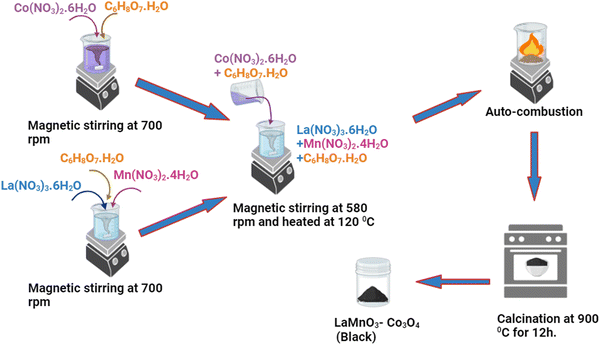 |
| | Fig. 1 Schematic diagram for synthesizing LMO–Co3O4 composites via an autocombustion method. | |
2.3. Preparation of electrode
As a working electrode, the nickel foam (thickness 1.67 mm), measuring 1 cm × 1 cm, was thoroughly cleaned via ultrasonication in a 37 wt% HCl solution (25 mL) for 10 minutes, followed by rinsing several times with deionized (DI) water and additional ultrasonication in DI water for 10 minutes. Subsequently, it was ultrasonicated in ethanol for 10 minutes and dried in a furnace for 2 hours at 100 °C. For electrode preparation, a solution containing 6 mg of sample composites and 1 mg of PVDF in 1 mL of NMP was stirred for 6 hours to ensure uniform distribution. Then, 0.6 mL of this solution was applied to the nickel foam surface. The sample-loaded Ni foam was heated at 100 °C in a furnace for 20 hours for drying and adhesion. The weight of the sample was determined by subtracting the initial weight of the nickel foam from the weight of the sample-coated nickel foam after drying.
2.4. Characterization
The crystalline structure of the LMO–Co3O4 composites was analyzed using a Bruker D8 Advance X-ray diffraction (XRD) equipped with a CuKα radiation source (λ = 0.15406 Å), operating at 40 kV and 40 A, with a step size of 0.02 and a scan rate of 0.2 min per step within the 2θ range of 20° ≤ 2θ ≤ 70°. The morphology of the prepared composites was investigated using a Hitachi S-4700 field emission scanning electron microscope (FE-SEM) operated at 20 kV and 10 mA, while energy dispersive X-ray spectroscopy (EDX) analysis utilized the Bruker Esprit 2.3 system. X-ray photoelectron spectroscopy (XPS) of samples was performed using a Thermo Scientific K-Alpha XPS system with a step size of 0.1 eV. The surface area and pore size distribution were analyzed using a Quantachrome Nova Touch NT2LX-2 surface area analyzer, with nitrogen (N2) as the adsorbate gas at a temperature of 77 K. Electrochemical analysis was carried out using a Gamry IFC 1000-07045 system. The electrochemical properties of samples were investigated in a three-electrode configuration, with a voltage range of 0 to +0.6 V in 1 M KOH electrolyte solutions. The counter electrode was a platinum plate, the reference electrode was Ag/AgCl (Basi), and the working electrode was sample-loaded nickel foam.
3. Result and discussion
3.1. Structure and morphology
3.1.1. X-ray diffraction study.
Fig. 2(a) shows the XRD patterns of the LMO–Co3O4 composites. The XRD sharp peaks show the presence of orthorhombic LMO (PDF 075-7697) and cubic Co3O4 (PDF 076-7802). The diffraction peaks at 22.93, 32.50, 32.81, 40.15, 46.85, 52.57, 57.98, and 68.07 can be indexed to (012), (110), (104), (202), (024), (122), (300), and (220) plane of the LMO crystalline, respectively. Additionally, 31.32, 36.90, 38.60, 44.88, 55.74, 59.45, and 65.344 can be indexed to (220), (311), (222), (400), (422), (511), (400) plane of the Co3O4 crystalline, respectively. No extra peaks were observed in all the composites, confirming the presence of a pure phase of LMO and Co3O4 in the sample. Fig. 2(b) shows the Rietveld refined XRD data plot of LMO–Co3O4 composites using the GSAS-II. The estimated composition percentage from the Rietveld refined XRD data for the LMO–Co3O4 composites reveals that the compositions closely match the intended ratios. The estimated composition of samples is LMO–Co3O4 (89.9%:10.1%), LMO–Co3O4 (69%:31%), and LMO–Co3O4 (48%:52%), close to the expected composition of the composites.
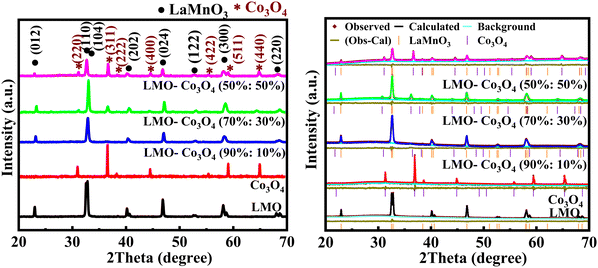 |
| | Fig. 2 (a) XRD patterns (left) and (b) Rietveld refined XRD data (right) of LMO–Co3O4 composites. | |
3.1.2. Field emission scanning electron microscopy.
Fig. 3 presents the FESEM images, EDX elemental mapping patterns, and spectra of the LMO–Co3O4 composites. Fig. 3(a) illustrates the spongy, porous structure of the LMO sample. The Co3O4 morphology appears to be hollow structures that interconnect, forming chain-like configurations that create interior cavities and loose structures (Fig. 3(b)). The fluffy, porous nature of LMO is retained in the LMO–Co3O4 (90%:10%) composites, but these composites exhibit small interior cavities due to the presence of Co3O4 (Fig. 3(c)). As the ratio of Co3O4 in the composite increases, the morphology of LMO–Co3O4 (70%:30%) composites remains consistent but evolves into a more chain-like structure (Fig. 3(d)). Additionally, the degree of aggregation of Co3O4 compounds on the LMO surface increases in the LMO–Co3O4 (50%:50%) composites (Fig. 3(e)) with cavities or voids. Fig. 3(f)–(j) of the EDX elemental map depicts the presence of La, Mn, Co, and O elements. The sharp peaks observed between 0 to 1 keV and 6 to 8 keV confirm the presence of Co, while peaks between 4 to 6 keV indicate the presence of La and Mn, and peaks observed between 0 to 1 keV confirmed the presence of oxygen. The spectra also show the presence of gold (Au) due to the gold coating applied to samples before capturing the images.
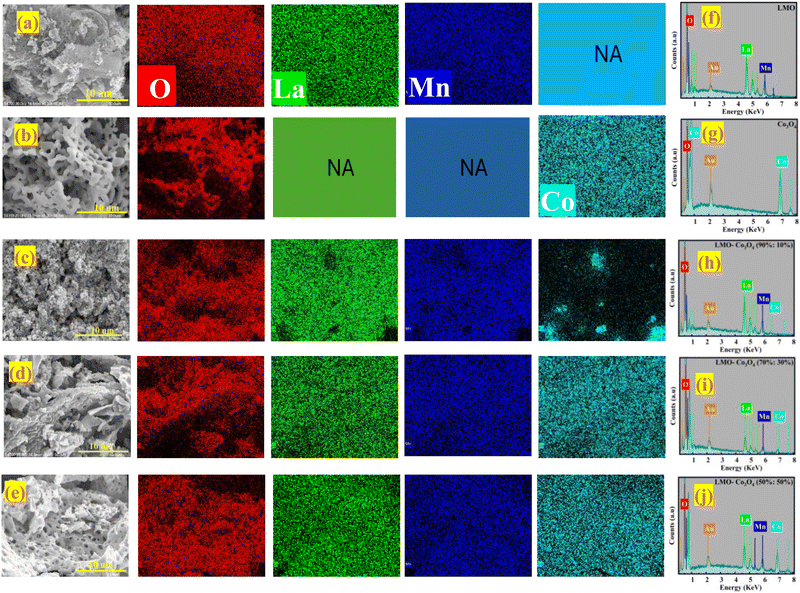 |
| | Fig. 3 FESEM images of (a) LMO, (b) Co3O4, (c) LMO–Co3O4 (90%:10%), (d) LMO–Co3O4 (70%:30%), and (e) LMO–Co3O4 (50%:50%) and elemental mapping patterns of the different composites of LMO–Co3O4; La (green), Mn (blue), O (red), and Co (Crane) color. (f)–(j) EDX spectra of LMO–Co3O4 composites (NA – not applicable). | |
3.1.3. Surface adsorption/desorption analysis.
The materials’ surface area and pore size distribution were characterized by N2 adsorption–desorption isotherm analysis of LMO–Co3O4 composites measured at 77 K, presented in Fig. 4. All the samples display similar isotherms with different hysteresis loops and can be categorized as type-IV isotherms.27 The multipoint BET surface area, pore volume, and pore size distribution were calculated using Brunauer–Emmett–Teller (BET) methods and summarized in Table 1. The surface area and average pore radius of LMO–Co3O4 (90%:10%) is 3.73 m2 g−1 and 3.11 nm, which is further increased in the LMO–Co3O4 (70%:30%) composites and reached the highest values of 6.79 m2 g−1 and 13.48 nm, respectively. Usually, an increase in the specific surface area and average pore size (radius) of the samples corresponds to an increase in its specific capacitance due to enhanced surface area, more interaction with electrolytes and electrodes, larger pores allowing better access for electrolyte ions, shorten diffusion pathways for ions, reducing resistance, and faster ion transport in charge/discharge conditions.
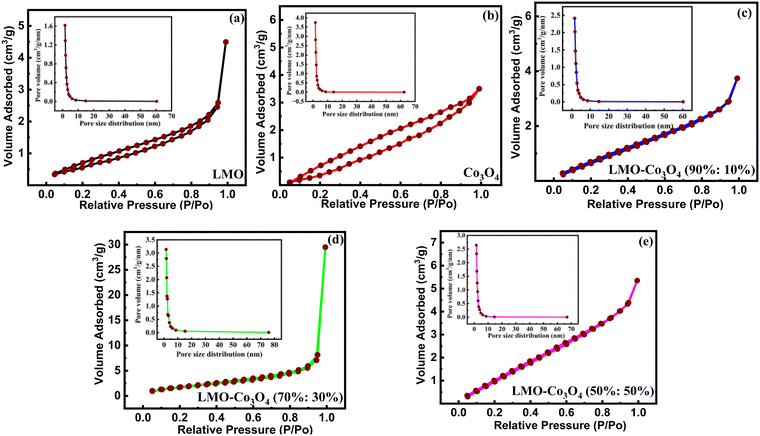 |
| | Fig. 4 (a)–(e) BET plots of LMO–Co3O4 composites measured at 77 K. | |
Table 1 Specific surface area and pore size distribution of LMO–Co3O4 composites
| Composites |
Mass (g) |
BET surface area (m2 g−1) |
Average pore size (radius nm) |
Total pore volume (cc g−1) |
| LMO |
0.22 |
2 |
05.91 |
0.007 |
| Co3O4 |
0.18 |
3 |
03.18 |
0.005 |
| LMO–Co3O4 (90%:10%) |
0.21 |
4 |
03.11 |
0.006 |
| LMO–Co3O4 (70%:30%) |
0.20 |
7 |
13.48 |
0.050 |
| LMO–Co3O4 (50%:50%) |
0.19 |
6 |
02.72 |
0.008 |
3.1.4. XPS.
XPS tests were conducted on the LMO–Co3O4 composites to investigate their elemental valence states and components. The binding energy of the La 3d3/2 and La 3d5/2 orbitals (Fig. 5(a)) in LMO–Co3O4 composites were estimated to be 833.5 and 850.3 eV, respectively, with spin–orbit splitting ∼16.8 eV,28 which proves the presence of La ion in the trivalent state. In the Co 2p spectrum of Fig. 5(b), two major peaks located at 795.6 and 780.2 eV can be detected, corresponding to the Co 2p3/2 and Co 2p1/2 peaks, with a spin energy separation of 15.4 eV.29 The binding energy of Mn 2p3/2 and Mn 2p1/2 is centered at 654.1 and 642.4 eV, respectively, with energy separation between them at 11.8 eV (Fig. 5(c)), which is matched with the previously reported values.30,31 The Mn 2p3/2 signal was separated into three peaks at around 640.5 (Mn2+), 641.4 (Mn3+), and 643.0 eV (Mn4+). The Mn 2p1/2 signals are at around 652.0 (Mn2+), 653.0 (Mn3+), and 654.6 eV (Mn4+).32 The major two peaks of Co (Fig. 5(d)) from the signal Co 2p3/2 are at 780.2 (Co3+) and 781.9 eV (Co2+), and for Co 2p1/2 also are at 794.9 (Co3+), and 796.3 eV (Co2+), respectively.33 Here, the ratio of Mn2+, Mn3+, and Mn4+ ions decreases, while Co3+ and Co2+ ions’ concentration naturally rises as the Co3O4 content increases in the composite. The increase in Co2+ and Co3+ ions may help to optimize the interfacial interaction, enhancing the specific capacitance. In Fig. 5(e), the O 1s spectra are deconvoluted into two compounds of the lattice oxygen (Co3O4) at 529.4 eV for the main lattice oxygen and a second much more intense peak at 530.8 eV.34 For the LMO, O 1s spectra are deconvoluted into three peaks, and they correspond to lattice oxygen in either La or manganese oxide (OL), surface adsorbed oxygen species or OH− (OA), physisorbed or chemisorbed H2O molecules (OW), and located at ∼529.0, ∼529.6, ∼531.0, ∼532.6 eV, respectively.35,36 Among the three oxygenated species, OA species are closely related to the oxygen vacancy and are beneficial for enhancing the electrochemical properties of the materials.37
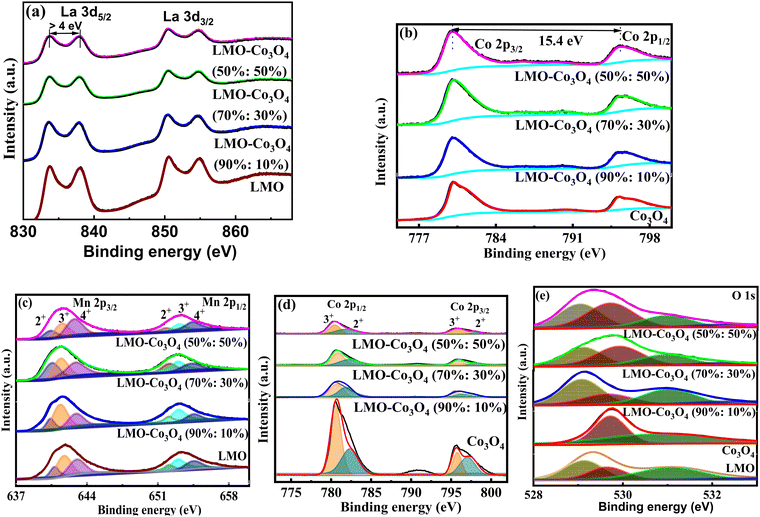 |
| | Fig. 5 High-resolution spectrum of (a) La 3d and (b) Co 2p, deconvoluted peaks of (c) Mn 2p, (d) Co 2p, and (e) O 1s of LMO–Co3O4 composites. | |
3.2. Electrochemical analysis
3.2.1. Cyclic voltammetry test.
The electrochemical behavior of the LMO–Co3O4 composites is measured by a cyclic voltammetry (CV) test in a three-electrode electrochemical setup in the 1 M KOH electrolyte. Fig. 6 represents the comparative CV curves at a constant scan rate, 10 mV s−1 of LMO–Co3O4 composites in the potential window 0 to 0.6 V. All the REDOX peaks in the CV curves pointed towards the pseudocapacitive behavior.
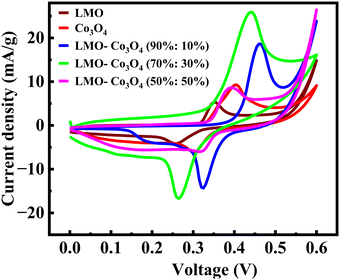 |
| | Fig. 6 Cyclic voltammetry of LMO–Co3O4 composites at 10 mV s−1 scan rate in 1 M KOH electrolyte. | |
Fig. 7 represents the CV curves of LMO–Co3O4 composites obtained at scan rates from 1 to 300 mV s−1 to analyze the chemical kinetics. The graph shows that the CV curves are affected by the scan rates. With increasing scan rate, the anodic peaks current shifts more positive potentials, and reduction peaks shift enormously towards the negative potential. The peak anodic and cathodic voltage difference, ΔEa,c, increases with increasing the sweep rate. Generally, the difference between the anodic and cathodic peak positions, ΔEa,c, and the voltage shift of the anodic and cathodic peaks with changing voltage defines the level of the reversibility of the electrochemical reactions. The ΔEa,c is generally small for pseudocapacitors having good reversibility and remains constant over a wide scan rate range. In contrast, a large ΔEa,c value is attributed to battery-type materials that could undergo phase transformation during the electrochemical process.38,39 The REDOX peaks are attributed to the alternation of valence states of Mn (Mn2+, Mn3+, and Mn4+) in LMO and Co (Co2+ and Co3+) in Co3O4 facilitating the ionic intercalation/deintercalation over the electrode material. As demonstrated by LMO–Co3O4 composite electrodes, the battery-type behavior ensues from the long diffusion and intercalation of ions accompanied by faradaic reactions. The fast scan rates wash out oxidation peaks in 10 and 30 wt% composite due to reactions not keeping pace with the rapid potential changes. As the scan rate increases, the peaks may shift, and the intensity of the peaks changes significantly, reflecting the slower ion diffusion. At higher scan rates, the time available for the electron transfer reactions (oxidation or reduction) to occur decreases. If the electrochemical reaction kinetics are slow compared to the faster potential sweep, the peak current may not reach its maximum, leading to a less pronounced oxidation peak. Further, at higher scan rates, the electrode surface may become saturated with reaction products, preventing further oxidation. If the products remain on the surface and are not adequately removed, they can inhibit the oxidation reaction from occurring. Further, capacitive currents (due to double-layer charging) can dominate the response at higher sweep rates, overshadowing the faradaic (redox) currents. This can lead to broadening and flattening of the peaks.
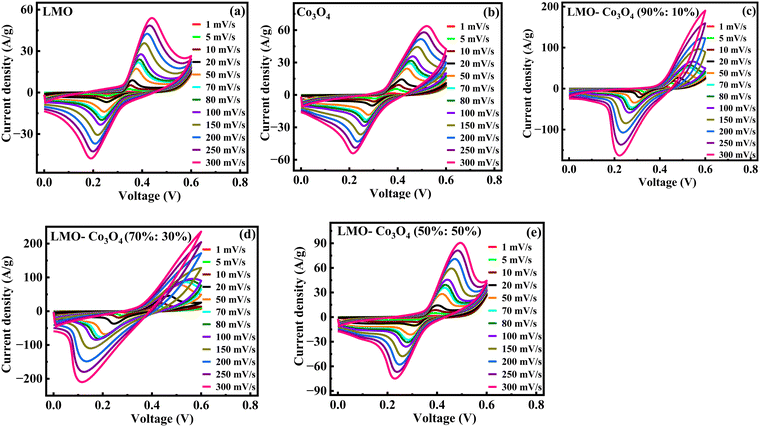 |
| | Fig. 7 (a)–(e) Cyclic voltammetry of LMO–Co3O4 composites at different scan rates from 1 to 300 mV s−1 in 1 M KOH electrolytes. | |
Based on the CV and XPS results provided, along with the previously reported article,15,40 the electrochemical storage mechanism of LMO perovskites and Co3O4 in an alkaline electrolyte involves the intercalation of oxygen and hydroxide ions. This process is driven by the oxidation of Mn atoms (B-site cations) for LMO and Co atoms for Co3O4; the phenomenon can be represented by eqn (2)–(5).35,41
| | | La[Mn2δ2+, Mn1−2δ3+]O3−δ + 2δOH− ↔ LaMn3+O3 + δH2O + 2δe− | (2) |
| | | LaMn3+O3 + 2δOH− ↔ La[Mn2δ4+, Mn1−2δ3+]O3+δ + δH2O + 2δe− | (3) |
| | | Co3O4 + OH− + H2O ↔ 3CoOOH + e− | (4) |
| | | CoOOH + OH− ↔ CoO2 + H2O + e− | (5) |
In CV measurements, the total current measured under a potential sweep rate can be interpreted as the sum of the current elated to the slow diffusion-controlled process (idiff) and the current required to charge the double layer at the electrolyte interface or to initiate fast faradaic reactions on the exposed electrode surface (icap). To understand these contributions, the following empirical power-law relationship between the current and scan rate is used (eqn (6) and (7)):42,43
| | | i = icap + idiff = avb | (6) |
or
| | log(i) = log(a) + b![[thin space (1/6-em)]](https://www.rsc.org/images/entities/char_2009.gif) log(v) log(v) | (7) |
where,
i represents peak current,
v is scanning rate, and
a and
b are the constants.
Parameter b is determined from the slope of the linear plot of log(i) vs. log(v), which provides kinetic information about the electrochemical reactions (Fig. 8(a)). Typically, two well-defined conditions for the b value are b = 0.5 and b = 1. A b value of 1 indicates contributions from rapid near-surface processes, such as fast surface redox reactions and the charging/discharging of electric double-layer capacitors (EDLCs). In contrast, when b = 0.5, the charge storage mechanism is diffusion controlled.44Fig. 8(a) shows a slope change in the linear plot at around 90 mV s−1 scan rate, signifying a change in the reaction kinetics. Corresponding b values are plotted in Fig. 8(d). This plot clearly shows that LMO–Co3O4 (90%:10%) and LMO–Co3O4 (70%:30%) composites have dominant diffusion contributions at lower scan rates with increased dominance of capacitive contributions in higher scan rate regions. Their b values ∼0.5 at a lower scan rate represent the slow semi-infinite diffusion-controlled faradaic process that occurs in the bulk, such as battery-type processes. However, limiting diffusion processes from the ohmic contribution, such as active material resistance and solid–electrolyte interphase resistance, could not be ignored.45,46
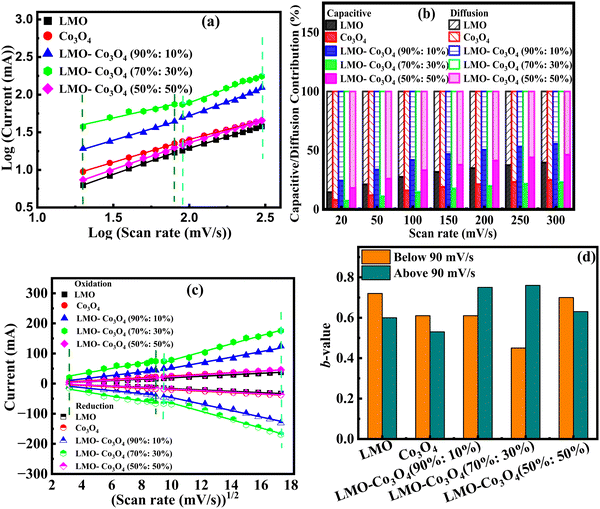 |
| | Fig. 8 (a) Relationship between log(ip) and log (mV s−1), (b) the capacitive and diffusion contribution percentage to the total charge storage, (c) relationship between peak current and square root of scan rate from 10 to 300 mV s−1 scan rate, and (d) bar graph of b-values of LMO–Co3O4 composites. | |
As discussed above, parameter b is desirable for distinguishing between capacitive processes and diffusion-controlled intercalation. This distinction is essential for gaining a deeper understanding of the underlying charge storage mechanisms and can greatly inform the selection of materials and the design of devices. When surface-dominant reactions control the process, the response current varies linearly with v (i.e., di/dv = constant = capacitance). If the process is controlled by semi-infinite diffusion, the response current varies linearly with v1/2 (i.e., di/dv1/2 = constant). Thus, the general expression for current with the mixed presses is expressed as, eqn (8) and (9),47
| | | i(V) = icap + idiff = k1v + k2v1/2 | (8) |
or
| |  | (9) |
where
i(
v) is the peak current, function of scan rate (
v), and both
k1 (slope) and
k2 (Y-intercept) are constants (
Fig. 8(b)). The electrode material will store charge through surface contribution when
k1 ≠ 0 and
k2 = 0; or charge stored through diffusion-contribution when
k1 = 0 and
k2 ≠ 0; or when
k1 ≠ 0 and
k2 ≠ 0 the charge storage contributions contributed by both the capacitance and the diffusion. The LMO–Co
3O
4 composites have non-zero
k1 and
k2 values, indicating a mixture of diffusion and capacitive control contribution to the charge storage mechanism. In a low scan rate, the
k1 values are much less near zero than the
k2 values, indicating that diffusion is a dominating contribution to the charge storage mechanism. With increasing scan rate, diffusion contribution decreases, or capacitive contribution increases due to insufficient time for electrons to penetrate the electrode. Most composites still have a higher percentage of diffusion contribution, even at 300 mV s
−1.
The positive and negative voltammetric peak currents in Fig. 8(c) have been used to calculate the chemical diffusion coefficient of LMO–Co3O4 composites by the Randles–Sevcik equation, eqn (10):48
| | | ip = 2.69 × 10⁵AC0n3/2D1/2v1/2 | (10) |
where
ip is the peak current,
A is the electrode area (cm
2),
n is the number of electrons involved in the reaction of the redox couple,
D is the diffusion coefficient (cm
2 s
−1),
C0 is the concentration of electroactive material (mol cm
−3), and
v is the scan rate.
Fig. 8(c) shows a linear relationship between the peak current and the square root of the scan rate, confirming that diffusion-controlled mechanisms dominate the electrochemical process in LMO–Co
3O
4 composites. The higher slope implies a higher diffusion coefficient, which implies that the electroactive species can move quickly through the electrolyte to the electrode surface. Here, LMO–Co
3O
4 (70%:30%) composites display a higher slope, which could be an optimized composite for achieving higher diffusion rates.
The area enclosed by the current–potential curve is directly proportional to the specific capacitance of the material. The specific capacitance was calculated from the CV curves by integrating the area under the current–potential curve, eqn (11):49
| |  | (11) |
where
Csp (F g
−1) is the specific capacitance,
m is the mass of the active material in the electrode,
v (mV s
−1) is the scan rate,
Vc −
Va is a potential window, and
I(
V) is the response current. The integral part gives the area under the current potential curve. LMO and Co
3O
4 have specific capacitances of 307 F g
−1 and 479 F g
−1 at 1 mV s
−1 scan rate. The values increased to 756 F g
−1 for LMO–Co
3O
4 (90%:10%) and further increased to 1614 F/g for LMO–Co
3O
4 (70%:30%) composites (
Fig. 9).
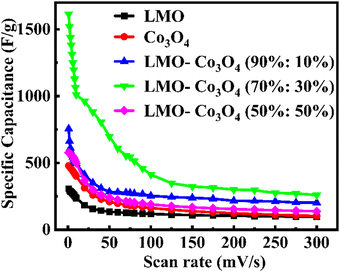 |
| | Fig. 9 Specific capacitance, Csp, of LMO–Co3O4 composites at different scan rates. | |
These optimal specific capacitances may be due to the synergetic effect of LMO and Co3O4. However, a further increase in the ratio of Co3O4 in the LMO; LMO–Co3O4 (50%:50%) composites decrease the specific capacitance to 577 F g−1. A decrease in specific capacitance with increased Co3O4 content could be attributed to (1) excess of Co3O4 might disrupt the optimal electron or ion pathways in the composites, (2) the Co3O4 might not mix properly, or LMO and Co3O4 exist separately, which can reduce the effective interface area and leads poor charge transfer and lower capacitance, and (3) excess of Co3O4 in LMO may form larger cavities or voids, which can reduce the contact between conductive particles within the electrode, leading to increased internal resistance, hindering charge transport, and decreasing specific capacitance. The formation of larger voids is evident in the SEM images in Fig. 3(e). The specific capacitance of LMO–Co3O4 composites at a scan rate of 1 mV s−1 is presented in Table 2. The LMO–Co3O4 (70%:30%) composites have a higher specific capacitance.
Table 2 Specific capacitance, Csp, of LMO–Co3O4 composites at 1 mV s−1 scan rate measured from voltammetry
| Sample |
C
sp (F g−1) |
| LMO |
307.4 |
| Co3O4 |
479.3 |
| LMO–Co3O4 (90%:10%) |
755.8 |
| LMO–Co3O4 (70%:30%) |
1614.0 |
| LMO–Co3O4 (50%:50%) |
576.8 |
3.2.2. Chronopotentiometry test.
The chronopotentiometry test is generally used to evaluate the performance of electrode materials by examining their response to constant current. This helps assess the material's conductivity, stability, and electrochemical activity. Especially for supercapacitor evaluation, it helps understand how the devices perform under constant current conditions and provides information on charge and discharge characteristics. The chronopotentiometry test is conducted at the current densities of 0.5 to 15 A g−1. Fig. 10 shows the chronopotentiomety charge/discharge (charge/discharge) curve of LMO–Co3O4 composites at a scan rate of 1 A g−1 current density. The discharge time is directly proportional to the specific capacitance of the compounds. Here, the LMO–Co3O4 (70%:30%) composite displays a longer discharge time, suggesting that its specific capacitance could be higher than others. Also, an increased plateau region is observed with Co3O4 content, indicating that the electrochemical process is occurring at a relatively constant potential due to the nature of the reaction and the kinetics involved. This suggests that the material is undergoing a process where the reaction rate or the electrochemical dynamics stabilize over a range of potentials. This typical asymmetric charge–discharge process is common to batteries where diffusion, phase transition, or polarization plays a distinct role.
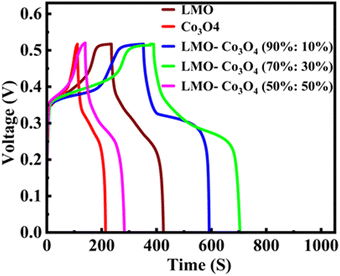 |
| | Fig. 10 Charge/discharge curves of LMO–Co3O4 composites at 1 A g−1 current density in 1 M KOH electrolyte. | |
Charge/discharge curves at different current densities (0.5 to 15 A g−1) were conducted to understand the charge/discharge kinetics, mechanisms, and rate capability of LMO–Co3O4 composites (Fig. 11). The discharge time is longest at a current density of 0.5 A g−1 but decreases with increasing current density. The decrease in discharge time at higher current densities due to the diffusion of ions within the electrode materials becomes less efficient, and the electrochemical reactions are increasingly confined to the surface of the electrodes. From the charge/discharge curve, the specific capacitance (Csp) was calculated using eqn (12),50 and the values are presented in Table 3.
| |  | (12) |
where
Im is the current density,
m is the mass of the active material, Δ
t is the discharge time, and Δ
V is the potential window.
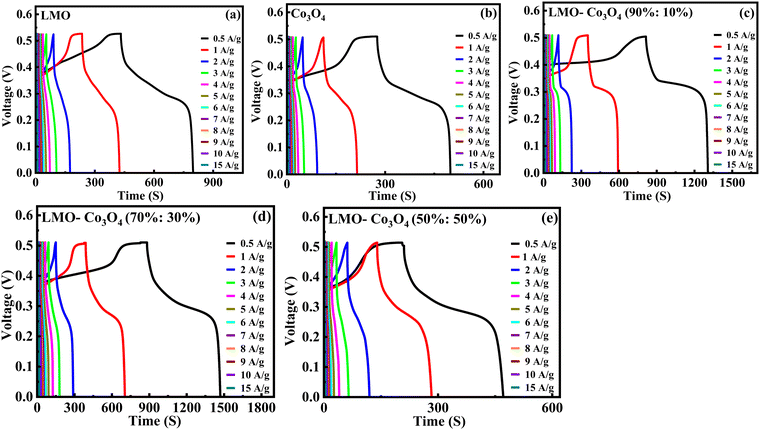 |
| | Fig. 11 (a)–(e) Charge/discharge curves of LMO–Co3O4 composites at different current densities. | |
Table 3 Specific capacitance, energy, and power density of the LMO–Co3O4 composites at 0.5 A g−1 current density
| Composites |
Specific capacitance, Csp (F g−1) |
Energy density, E (W h kg−1) |
Power density, P (W kg−1) |
| LMO |
355.8 |
17.8 |
172.7 |
| Co3O4 |
223.4 |
11.2 |
180.4 |
| LMO–Co3O4 (90%:10%) |
492.8 |
24.6 |
177.5 |
| LMO–Co3O4 (70%:30%) |
660.0 |
33.0 |
202.7 |
| LMO–Co3O4 (50%:50%) |
266.2 |
13.3 |
176.8 |
Fig. 12(a) shows the relationship between the specific capacitance and the current density of the LMO–Co3O4 composites. The specific capacitance of LMO, Co3O4, LMO–Co3O4 (90%:10%), LMO–Co3O4 (70%:30%), and LMO–Co3O4 (50%:50%) is 356, 223, 493, 660, and 266 F g−1, respectively at 0.5 A g−1 current density presented in Table 3. Here, increasing the ratio of Co3O4 in the LMO, the specific capacitance increases and has a maximum at the LMO–Co3O4 (70%:30%). However, the specific capacitance decreases with a further increase in Co3O4 content in the LMO.
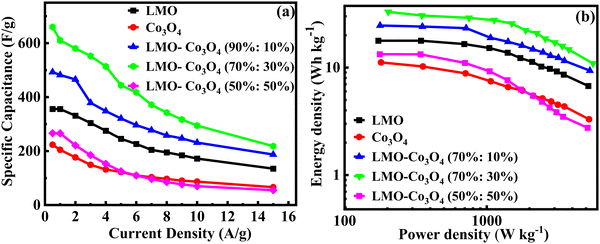 |
| | Fig. 12 (a) Specific capacitance vs. current density and (b) the Ragone plot, relation between the log energy density and power density of LMO–Co3O4 composites. | |
The energy density (E; W h kg−1) and power density (P; W kg−1) are calculated from the following eqn (13) and (14):51
| |  | (13) |
| |  | (14) |
where
E is the energy density (W h kg
−1),
Csp represents specific capacitance (F g
−1), and Δ
v is the voltage window (V),
P is the power density (W kg
−1), and
t is the discharge time (s).
The Ragone plot of LMO–Co3O4 composites at different current densities are plotted in Fig. 12(b), gives the optimum power-energy characteristics, where the energy density of 31 W h kg−1 at power density 349 W kg−1 for LMO–Co3O4 (70%:30%) composites at 659.9 F g−1 of specific capacitance and shown in Table 3. Comparing these values, it is evident that the synergistic effects in LMO–Co3O4 are at play in improving the energy and power densities of the composite.
In order to better understand the stability performance in the electrochemical analysis, we conducted the charge/discharge 2000 cycles test at a current density of 10 A g−1. Fig. 13 depicts the relationship between specific capacitance and the number of cycles. After testing for 2000 cycles, the specific capacitance retention is 94, 88, 96, 99, and 93% for LMO, Co3O4, LMO–Co3O4 (90%:10%), LMO–Co3O4 (70%:30%) and LMO–Co3O4 (50%:50%) from 169.8, 83.2, 231.7, 274.7, and 67.3 F g−1 to 160.1, 73.4, 223.5, 271.9, and 62.4 F g−1, respectively. High cyclic stability indicates that the charge–discharge process is highly reversible. For battery-type capacitors, where energy is stored via redox reactions, reversibility ensures that no significant side reactions or irreversible changes in the chemical composition occur, leading to minimal loss of active materials over time. Further, the sustained performance across cycles reflects that ion transport (e.g., diffusion of lithium ions, protons, etc.) within the electrode materials remains effective over time. It suggests that the pathways for ion diffusion are not obstructed or degraded even after many cycles of operation. Coulombic efficiency measures how effectively electrical charge is input into useful electrical output during charge and discharge cycles. It is calculated for LMO–Co3O4 composites at 10 A g−1 using η = (tD/tc) × 100%52 and inset in Fig. 13. Where tD and tC are the discharge and charging time. Here, the coulombic efficiency is almost 100% over 2000 cycles. High coulombic efficiency means that most of the charge added during charging is recovered during the discharging, implying no loss or minimal loss of charge through side reactions or other inefficiencies.
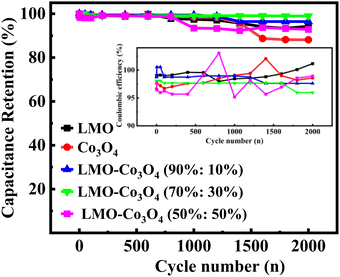 |
| | Fig. 13 Cyclic-stability and coulombic efficiency test (inset) of LMO–Co3O4 composites of chronopotentiometry charge–discharge at a current density at 10 A g−1 for 2000 cycles. | |
Table 4 summarizes the electrochemical performance of LaMnO3 and Co3O4-based electrode materials and composites. The table compares the energy and power densities obtained from the literature with the electrode developed in this work. The LMO–Co3O4 (70%:30%) composites have relatively higher specific capacitance than the previously reported values.
Table 4 Comparison of specific capacitance, energy, and power density of LMO–Co3O4 composites with previously reported values or relative compounds
| Material |
Current density or scan rate |
Electrolyte (Na2SO4) |
Specific capacitance, CP (F g−1) |
Energy density, E (W h kg−1) |
Power density, P (W kg−1) |
Ref. |
| LaMn1±xO3 |
1 A g−1 |
1 M KOH |
549 mA h g−1 |
— |
— |
31
|
| LaCoO3 |
1 A g−1 |
1 M KOH |
203 |
— |
— |
53
|
| La0.5Ca0.5MnO3 |
1 A g−1 |
1 M KOH |
170 |
7.6 |
160 |
24
|
| LMO–Co3O4 (70%:30%) |
0.5 A g−1 |
1 M KOH |
660.0 |
33.0 |
202.7 |
Present work |
| Hollow dendritic Co3O4/CeO2 |
0.5 A g−1 |
6 M KOH |
276.3 |
— |
— |
54
|
| Hollow spherical La2CoMnO6 |
1 A g−1 |
1 M |
376 |
— |
— |
55
|
| LaMnO3@NiCo2O4Ni |
0.5 A g−1 |
6 M KOH |
811 C g−1 |
— |
— |
22
|
| La0.85Sr0.15MnO3/NiCo2O4 |
0.5 A g−1 |
1 M Na2SO4 |
1341 |
63.5 |
900 |
56
|
| La0.7Sr0.3CoO3−δ |
2 A g−1 |
1 M |
747.75 |
34.8 |
400 |
57
|
| LaMnO3–Mn3O4 (70%:30%) |
1 A g−1 |
6 M KOH |
478.8 |
23.9 |
355.7 |
21
|
| NiO/NiCo2O4/Co3O4 |
5 mA cm−2 |
2 M KOH |
1717 |
— |
— |
58
|
| LaMnO3/CeO2 |
1 A g−1 |
1 M |
262.0 |
— |
— |
59
|
3.2.3. EIS fitting.
The Electrochemical Impedance Spectroscopy (EIS) analysis was carried out across a frequency range of 10 mHz to 100 kHz (Fig. 14). The EIS diagram is categorized into three distinct sections. The high-frequency region is marked by the initial intercept, known as the comprehensive resistance (Rs or R1). This resistance includes the contact resistance between the electrode material and the collecting fluid, the resistance associated with ion transport within the electrolyte, and the inherent resistance of the electrode material. The intermediate-frequency region features a semicircular curve representing the charge transfer resistance (R2). In our analysis, the absence of this semicircle indicates a very low charge transfer resistance and a high diffusion coefficient. The low-frequency region is characterized by a linear plot, representing the Warburg impedance (W0) resulting from the diffusion of ions at the electrolyte–electrode interface.60 A steeper line slope would mean a smaller diffusion impedance in low-frequency regions. The inset plot shows the fitted equivalent circuit diagram of the LMO–Co3O4 composites by using the Gamry Echem Analyst software. That equivalent circuit contains R1, R2, W0, and constant phase element (CPE1 and CPE2). The impedance of the CPE is ZCPE = 1/Q(iω)α. Where Q is the CPE constant, related to the admittance of the element. The exponent α in the CPE represent the phase deviation from the ideal scenario, where the impedance plot (Zrevs. Zim) would form a vertical line perpendicular to the real axis and parallel to the imaginary axis. When α = 1, the CPE behaves like a pure capacitor; when α = 0, it resembles a resistor; and when α = 0.5, it behaves as Warburg impedance.
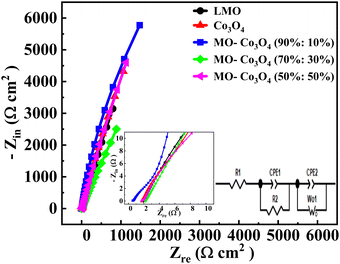 |
| | Fig. 14 Nyquist plot of LMO–Co3O4 composites. | |
The charge transfer resistance (R2) was calculated to be 38.31, 11.37, 11.36, 7.12, and 35.00 Ω for LMO, Co3O4, LMO–Co3O4 (90%:10%), LMO–Co3O4 (70%:30%), and LMO–Co3O4 (50%:50%) composites, respectively and presented on Table 5. The decrease in R2 trends from the LMO samples to LMO–Co3O4 (50%:50%) composites should be associated with the increased electrode and electrolyte interface contact area. Its W0 value is also highest at 0.389 Ω, indicating ions’ diffusion between the electrode and electrolyte interface.
Table 5 Equivalent fitting values of Nyquist plot of LMO–Co3O4 composites
| Composites |
R
1 (Ω) |
R
2 (Ω) |
W
0 (Ω, ×10−3) |
CPE1 (α) |
CPE1 (Q; Ω−1 sα) |
CPE2 (α) |
CPE2 (Q, Ω−1 sα) |
Goodness of fit (×10−3) |
| LMO |
1.901 |
38.31 |
0.183 |
0.703 |
0.005 |
0.906 |
0.003 |
0.152 |
| Co3O4 |
1.709 |
11.37 |
0.086 |
0.716 |
0.005 |
0.894 |
0.002 |
0.261 |
| LMO–Co3O4 (90%:10%) |
1.913 |
11.36 |
0.398 |
0.624 |
0.001 |
0.866 |
0.003 |
0.108 |
| LMO–Co3O4 (70%:30%) |
0.57 |
7.12 |
0.186 |
0.608 |
0.008 |
0.976 |
0.002 |
0.186 |
| LMO–Co3O4 (50%:50%) |
1.834 |
34.99 |
0.173 |
0.698 |
0.003 |
0.928 |
0.002 |
1.132 |
The specific capacitance of pure LMO and Co3O4 is lower compared to their composites, which can be attributed to several synergistic factors: (1) the composite has a higher specific surface area and pore radius, LMO–Co3O4 (70%:30%) has the highest specific surface area, 6.79 m2 g−1, and average pore size (radius) 13.48 nm, respectively provide more accessible active sites for electrochemical reactions, enhancing ion adsorption and desorption, (2) LMO is known for its good pseudocapacitive properties due to the multiple valence states of Mn, but its tendency to aggregate limits its effectiveness. On the other hand, Co3O4 is naturally porous. When combined, LMO and Co3O4 form composites that reduce LMO aggregation, resulting in a more porous structure. This enhanced porosity is beneficial for electrochemical analysis, as it increases the surface area available for reactions, improves ion diffusion, and ultimately enhances the overall electrochemical performance of the composite, (3) both materials undergo multiple oxidation states, contributing significantly to the overall charge storage, (4) increased Co3O4 content may create oxygen vacancies in LMO, enhancing electrochemical performance, and (5) improved interfacial interaction between LMO and Co3O4 facilitates efficient electron transfer and ion exchange, leading to higher specific capacitance.
4. Conclusion
In this study, LMO–Co3O4 composites were synthesized using the autocombustion method to enhance supercapacitor performance. The LMO–Co3O4 (70%:30%) composites with relatively high surface area and pore density demonstrated a significantly high specific capacitance of 1614 F g−1 at a scan rate of 1 mV s−1 and 660 F g−1 at a current density of 0.5 A g−1, which are 5.25 and 1.85 times greater, respectively, than those of LMO alone. This substantial increase in specific capacitance is attributed to the synergistic effects between LMO and Co3O4. The Co3O4 component effectively mitigates kinetic challenges related to charge transfer and ion transport within the LMO–Co3O4 (70%:30%) composites. These composites exhibit excellent cyclic stability with battery-type behavior, retaining 99% of their capacity after 2000 cycles. These impressive attributes make LMO–Co3O4 composites a promising and effective electrode material for high-performance supercapacitors and energy storage devices.
Data availability
Data for this article, including BET, electrochemical analysis, XPS, and XRD of LMO–Co3O4 composites are available at Zenodo at https://zenodo.org/uploads/14159771.
Conflicts of interest
There are no conflicts to declare.
Acknowledgements
The authors acknowledge the University of Memphis for their support in conducting this research work.
References
- M. Winter and R. J. Brodd, What are batteries, fuel cells, and supercapacitors?, Chem. Rev., 2004, 104, 4245–4270 CrossRef CAS PubMed.
- S. Chu, Y. Cui and N. Liu, The path towards sustainable energy, Nat. Mater., 2017, 16, 16–22 CrossRef PubMed.
- A. Dhakal, F. A. Perez and S. R. Mishra, Electrochemical assessment of tailored Mn2O3 cuboidal hierarchical particles prepared using urea and Piperazine, Electrochim. Acta, 2024, 507, 145169 CrossRef CAS.
- P. Simon and Y. Gogotsi, Materials for electrochemical capacitors, Nat. Mater., 2008, 7, 845–854 CrossRef CAS PubMed.
- F. Béguin, V. Presser, A. Balducci and E. Frackowiak, Carbons and electrolytes for advanced supercapacitors, Adv. Mater., 2014, 26, 2219–2251 CrossRef.
- G. A. Muller, J. B. Cook, H. S. Kim, S. H. Tolbert and B. Dunn, High performance pseudocapacitor based on 2D layered metal chalcogenide nanocrystals, Nano Lett., 2015, 15, 1911–1917 CrossRef CAS PubMed.
- L. Yang, S. Cheng, Y. Ding, X. Zhu, Z. L. Wang and M. Liu, Hierarchical network architectures of carbon fiber paper supported cobalt oxide nanonet for high-capacity pseudocapacitors, Nano Lett., 2012, 12, 321–325 CrossRef CAS PubMed.
- E. Frackowiak and F. Beguin, Carbon materials for the electrochemical storage of energy in capacitors, Carbon, 2001, 39, 937–950 CrossRef CAS.
- S. Yoon, J. Lee, T. Hyeon and S. M. Oh, Electric double-layer capacitor performance of a new mesoporous carbon, J. Electrochem. Soc., 2000, 147, 2507 CrossRef CAS.
- E. Frackowiak and F. Beguin, Electrochemical storage of energy in carbon nanotubes and nanostructured carbons, Carbon, 2002, 40, 1775–1787 CrossRef CAS.
- W. Raza, F. Ali, N. Raza, Y. Luo, K. H. Kim and J. Yang,
et al., Recent advancements in supercapacitor technology, Nano Energy, 2018, 52, 441–473 CrossRef CAS.
- J. Suntivich, H. A. Gasteiger, N. Yabuuchi, H. Nakanishi, J. B. Goodenough and Y. Shao-Horn, Design principles for oxygen-reduction activity on perovskite oxide catalysts for fuel cells and metal–air batteries, Nat. Chem., 2011, 3, 546–550 CrossRef CAS PubMed.
-
T. Ishihara, Perovskite oxide for solid oxide fuel cells, Springer Science & Business Media, 2009 Search PubMed.
- N. J. Jeon, J. H. Noh, W. S. Yang, Y. C. Kim, S. Ryu and J. Seo,
et al., Compositional engineering of perovskite materials for high-performance solar cells, Nature, 2015, 517, 476–480 CrossRef CAS.
- J. Töpfer and J. B. Goodenough, Transport and Magnetic Properties of the Perovskites La1−yMnO3 and LaMn1−zO3, Chem. Mater., 1997, 9, 1467–1474 CrossRef.
- J. T. Mefford, W. G. Hardin, S. Dai, K. P. Johnston and K. J. Stevenson, Anion charge storage through oxygen intercalation in LaMnO3 perovskite pseudocapacitor electrodes, Nat. Mater., 2014, 13, 726–732 CrossRef CAS PubMed.
- T. Zhu, C. Xia, B. Wu, J. Pan, H. Yang and W. Zhang,
et al., Inbuilt photoelectric field of heterostructured cobalt/iron oxides promotes oxygen electrocatalysis for high-energy-efficiency zinc-air batteries, Appl. Catal., B, 2024, 124315 CrossRef CAS.
- J. A. M. Van Roosmalen, E. H. P. Cordfunke, R. B. Helmholdt and H. W. Zandbergen, The defect chemistry of LaMnO3±δ: 2. Structural aspects of LaMnO3+δ, J. Solid State Chem., 1994, 110, 100–105 CrossRef CAS.
- V. V. Deshmukh, H. V. Harini, H. P. Nagaswarupa, R. Naik and C. R. Ravikumar, Development of novel Co3+ doped LaMnO3 perovskite electrodes for supercapacitors and sensors: mechanism of electrochemical energy storage and oxygen intercalation, J. Energy Storage, 2023, 68, 107805 CrossRef.
- N. Zhang, E. Liu, H. Chen, J. Hou, C. Li and H. Wan, High-performance of LaCoO3/Co3O4 nanocrystal as anode for lithium-ion batteries, Colloids Surf., A, 2021, 628, 127265 CrossRef CAS.
- A. Dhakal, F. A. Perez, S. Karna and S. R. Mishra, LaMnO3–Mn3O4 nanocomposite: synergetic effect towards high electrochemical performance, J. Alloys Compd., 2024, 1008, 176262 CrossRef CAS.
- H. Tian, X. Lang, H. Nan, P. An, W. Zhang and X. Hu,
et al., Nanosheet-assembled LaMnO3@NiCo2O4 nanoarchitecture growth on Ni foam for high power density supercapacitors, Electrochim. Acta, 2019, 318, 651–659 CrossRef CAS.
- P. Ma, N. Lei, B. Yu, Y. Liu, G. Jiang and J. Dai,
et al., Flexible supercapacitor electrodes based on carbon cloth-supported LaMnO3/MnO nano-arrays by one-step electrodeposition, Nanomaterials, 2019, 9, 1676 CrossRef CAS PubMed.
- G. W. Piburn, J. T. Mefford, N. Zinni, K. J. Stevenson and S. M. Humphrey, Synthesis and charge storage properties of templated LaMnO3–SiO2 composite materials, Dalton Trans., 2017, 46, 977–984 RSC.
- H. Mo, H. Nan, X. Lang, S. Liu, L. Qiao and X. Hu,
et al., Influence of calcium doping on performance of LaMnO3 supercapacitors, Ceram. Int., 2018, 44, 9733–9741 CrossRef CAS.
- L. A. Chick, L. R. Pederson, G. D. Maupin, J. L. Bates, L. E. Thomas and G. J. Exarhos, Glycine-nitrate combustion synthesis of oxide ceramic powders, Mater. Lett., 1990, 10, 6–12 CrossRef CAS.
- M. Thommes, K. Kaneko, A. V. Neimark, J. P. Olivier, F. Rodriguez-Reinoso and J. Rouquerol,
et al., Physisorption of gases, with special reference to the evaluation of surface area and pore size distribution (IUPAC Technical Report), Pure Appl. Chem., 2015, 87, 1051–1069 CrossRef CAS.
- J. L. Ortiz-Quinonez, L. García-González, F. E. Cancino-Gordillo and U. Pal, Particle dispersion and lattice distortion induced magnetic behavior of La1−xSrxMnO3 perovskite nanoparticles grown by salt-assisted solid-state synthesis, Mater. Chem. Phys., 2020, 246, 122834 CrossRef CAS.
- Y. Liu, Z. Cheng, H. Sun, H. Arandiyan, J. Li and M. Ahmad, Mesoporous Co3O4 sheets/3D graphene networks nanohybrids for high-performance sodium-ion battery anode, J. Power Sources, 2015, 273, 878–884 CrossRef CAS.
- M. Toupin, T. Brousse and D. Bélanger, Charge storage mechanism of MnO2 electrode used in aqueous electrochemical capacitor, Chem. Mater., 2004, 16, 3184–3190 CrossRef CAS.
- A. L. M. Reddy, M. M. Shaijumon, S. R. Gowda and P. M. Ajayan, Coaxial MnO2/carbon nanotube array electrodes for high-performance lithium batteries, Nano Lett., 2009, 9, 1002–1006 CrossRef CAS.
- Z. A. Elsiddig, H. Xu, D. Wang, W. Zhang, X. Guo and Y. Zhang,
et al., Modulating Mn4+ ions and oxygen vacancies in nonstoichiometric LaMnO3 perovskite by a facile sol-gel method as high-performance supercapacitor electrodes, Electrochim. Acta, 2017, 253, 422–429 CrossRef CAS.
- W. Kang, Y. Zhang, L. Fan, L. Zhang, F. Dai and R. Wang,
et al., Metal–organic framework derived porous hollow Co3O4/N–C polyhedron composite with excellent energy storage capability, ACS Appl. Mater. Interfaces, 2017, 9, 10602–10609 CrossRef CAS.
- S. C. Petitto, E. M. Marsh, G. A. Carson and M. A. Langell, Cobalt oxide surface chemistry: the interaction of CoO (1 0 0), Co3O4 (1 1 0) and Co3O4 (1 1 1) with oxygen and water, J. Mol. Catal. A: Chem., 2008, 281, 49–58 CrossRef CAS.
- H. Miao, X. Wu, B. Chen, Q. Wang, F. Wang and J. Wang,
et al., A-site deficient/excessive effects of LaMnO3 perovskite as bifunctional oxygen catalyst for zinc-air batteries, Electrochim. Acta, 2020, 333, 135566 CrossRef CAS.
- S. Ponce, M. A. Peña and J. L. G. Fierro, Surface properties and catalytic performance in methane combustion of Sr-substituted lanthanum manganites, Appl. Catal., B, 2000, 24, 193–205 CrossRef CAS.
- Y. Zhu, W. Zhou, J. Yu, Y. Chen, M. Liu and Z. Shao, Enhancing electrocatalytic activity of perovskite oxides by tuning cation deficiency for oxygen reduction and evolution reactions, Chem. Mater., 2016, 28, 1691–1697 CrossRef CAS.
- L. Bing, Y. Huatang, Z. Yunshi, Z. Zuoxiang and S. Deying, Cyclic voltammetric studies of stabilized α-nickel hydroxide electrode, J. Power Sources, 1999, 79, 277–280 CrossRef CAS.
- D. A. Corrigan and R. M. Bendert, Effect of coprecipitated metal ions on the electrochemistry of nickel hydroxide thin films: cyclic voltammetry in 1 M KOH, J. Electrochem. Soc., 1989, 136, 723 CrossRef.
- H. Zhao, Q. Zhu, X. Ye, L. Wang and S. Dong, Electrochemical Properties of LaMO3 (M = Cr, Mn, and Co) Perovskite Materials, Coatings, 2024, 14, 147 CrossRef CAS.
- M. Chen, Q. Ge, M. Qi, X. Liang, F. Wang and Q. Chen, Cobalt oxides nanorods arrays as advanced electrode for high performance supercapacitor, Surf. Coat. Technol., 2019, 360, 73–77 CrossRef CAS.
- T. Brezesinski, J. Wang, S. H. Tolbert and B. Dunn, Ordered mesoporous α-MoO3 with iso-oriented nanocrystalline walls for thin-film pseudocapacitors, Nat. Mater., 2010, 9, 146–151 CrossRef CAS PubMed.
- D. M. MacArthur, The proton diffusion coefficient for the nickel hydroxide electrode, J. Electrochem. Soc., 1970, 117, 729 CrossRef.
- H. Lindström, S. Södergren, A. Solbrand, H. Rensmo, J. Hjelm and A. Hagfeldt,
et al., Li+ ion insertion in TiO2 (anatase). 2. Voltammetry on nanoporous films, J. Phys. Chem. B, 1997, 101, 7717–7722 CrossRef.
- V. Augustyn, J. Come, M. A. Lowe, J. W. Kim, P. L. Taberna and S. H. Tolbert,
et al., High-rate electrochemical energy storage through Li+ intercalation pseudocapacitance, Nat. Mater., 2013, 12, 518–522 CrossRef CAS PubMed.
- M. Park, X. Zhang, M. Chung, G. B. Less and A. M. Sastry, A review of conduction phenomena in Li–ion batteries, J. Power Sources, 2010, 195, 7904–7929 CrossRef CAS.
- T. Liu, W. G. Pell, B. E. Conway and S. L. Roberson, Behavior of molybdenum nitrides as materials for electrochemical capacitors: comparison with ruthenium oxide, J. Electrochem. Soc., 1998, 145, 1882 CrossRef CAS.
- R. S. Nicholson, Theory and application of cyclic voltammetry for measurement of electrode reaction kinetics, Anal. Chem., 1965, 37, 1351–1355 CrossRef CAS.
-
B. E. Conway, Electrochemical supercapacitors: scientific fundamentals and technological applications, Springer Science & Business Media, 2013 Search PubMed.
- Y. Wang, Y. Song and Y. Xia, Electrochemical capacitors: mechanism, materials, systems, characterization and applications, Chem. Soc. Rev., 2016, 45, 5925–5950 RSC.
-
A. J. Bard, L. R. Faulkner and H. S. White, Electrochemical methods: fundamentals and applications, John Wiley & Sons, 2022 Search PubMed.
- B. D. Adams, J. Zheng, X. Ren, W. Xu and J. Zhang, Accurate determination of coulombic efficiency for lithium metal anodes and lithium metal batteries, Adv. Energy Mater., 2018, 8, 1702097 CrossRef.
- Y. Guo, T. Shao, H. You, S. Li, C. Li and L. Zhang, Polyvinylpyrrolidone-assisted solvothermal synthesis of porous LaCoO3 nanospheres as supercapacitor electrode, Int. J. Electrochem. Sci., 2017, 12, 7121–7127 CrossRef CAS.
- H. Xie, Q. Geng, X. Liu, X. Xu, F. Wang and L. Mao,
et al., Solvent-assisted synthesis of dendritic cerium hexacyanocobaltate and derived porous dendritic Co3O4/CeO2 as supercapacitor electrode materials, CrystEngComm, 2021, 23, 1704–1708 RSC.
- Z. Meng, J. Xu, P. Yu, X. Hu, Y. Wu and Q. Zhang,
et al., Double perovskite La2CoMnO6 hollow spheres prepared by template impregnation for high-performance supercapacitors, Chem. Eng. J., 2020, 400, 125966 CrossRef CAS.
- X. Lang, H. Zhang, X. Xue, C. Li, X. Sun and Z. Liu,
et al., Rational design of La0.85Sr0.15MnO3@NiCo2O4 Core–Shell architecture supported on Ni foam for high performance supercapacitors, J. Power Sources, 2018, 402, 213–220 CrossRef CAS.
- Y. Cao, B. Lin, Y. Sun, H. Yang and X. Zhang, Symmetric/asymmetric supercapacitor based on the perovskite-type lanthanum cobaltate nanofibers with Sr-SUBSTITUTION, Electrochim. Acta, 2015, 178, 398–406 CrossRef CAS.
- M. C. Liu, L. B. Kong, C. Lu, X. M. Li, Y. C. Luo and L. Kang, A sol–gel process for fabrication of NiO/NiCo2O4/Co3O4 composite with improved electrochemical behavior for electrochemical capacitors, ACS Appl. Mater. Interfaces, 2012, 4, 4631–4636 CrossRef CAS.
- Y. Cao, J. Liang, X. Li, L. Yue, Q. Liu and S. Lu,
et al., Recent advances in perovskite oxides as electrode materials for supercapacitors, Chem. Commun., 2021, 57, 2343–2355 RSC.
- M. S. Javed, S. Dai, M. Wang, D. Guo, L. Chen and X. Wang,
et al., High performance solid state flexible supercapacitor based on molybdenum sulfide hierarchical nanospheres, J. Power Sources, 2015, 285, 63–69 CrossRef CAS.
|
| This journal is © The Royal Society of Chemistry 2025 |
Click here to see how this site uses Cookies. View our privacy policy here.  Open Access Article
 *a,
Felio A.
Perez
b and
Sanjay R.
Mishra
*a

![[thin space (1/6-em)]](https://www.rsc.org/images/entities/char_2009.gif) log(v)
log(v)


