DOI:
10.1039/D5YA00040H
(Paper)
Energy Adv., 2025,
4, 878-895
Urea-driven hydrothermal synthesis of Mn2O3: electrochemical performance across various electrolytes for supercapacitor applications
Received
13th February 2025
, Accepted 2nd May 2025
First published on 5th May 2025
Abstract
In this study, cubic Mn2O3 was synthesized using different urea concentrations (3, 6, 9, and 12 mM) via a hydrothermal method. During synthesis, an increase in urea content resulted in decreased particle and crystallite sizes and increased lattice parameters, with a concomitant increase in the surface area and number of Mn3+ ions in Mn2O3 particles. The electrochemical performance of the Mn2O3-9 mM urea sample outperformed samples prepared with other urea contents. The Mn2O3-9 mM urea sample exhibited high specific capacitance (Csp) values in 1 M and 3 M KOH electrolytes, achieving 881.3 F g−1 and 1043.2 F g−1, respectively, at a scan rate of 1 mV s−1. Furthermore, at a current density of 1 A g−1, the Csp of Mn2O3 in 1 M KOH was 758.5 F g−1. The values increased to 891.4 F g−1 with energy density and power density of 44.7 W h kg−1 and 398.1 W kg−1, respectively, in 3 M KOH. Owing to the superior electrochemical performance of the Mn2O3-9 mM urea sample, its electrochemical performance was assessed in basic KOH and NaOH and neutral Na2SO4 and NaNO3 aqueous electrolytes. Moreover, the Mn2O3-9 mM urea sample demonstrated a Csp of 721.0 and 446.3 F g−1 in 3 M concentrations of NaOH and NaNO3 electrolytes, respectively. The Mn2O3-9 mM urea sample with the highest content of Mn3+ ions displayed the highest Csp in KOH electrolytes compared with the others owing to the smaller hydration radii of K+ and high ionic diffusivity and conductivity of OH− compared with other basic and neutral salts. These results highlight that the synthesis process, electrolyte choice, and concentration of electrolytes significantly influence the electrochemical properties of Mn2O3 battery-type, emphasizing their critical role in optimizing material performance for supercapacitor applications.
1. Introduction
Considering the increasing concerns about global warming and depletion of fossil fuels, more sophisticated energy storage technologies and the immediate development of clean alternative energies are required.1 In recent years, supercapacitors, often called as electrochemical capacitors, have gained popularity as one of the most appealing energy storage technologies.2 Supercapacitors are the most promising options for next-generation energy storage devices because they feature faster charge–discharge rates, better power densities, and longer life spans than existing energy storage devices like batteries.3–5 Supercapacitors store energy either via ion adsorption (electrochemical double layer capacitors, and EDLCs) or fast redox reaction (pseudocapacitors). Sometimes, both types of charge storage mechanisms occur (ion adsorption and fast redox reaction), and they are called hybrid capacitors.6,7
EDLCs, which are based on carbon-based compounds (e.g., carbon-based materials and graphenes), usually display very high surface areas, and their electrochemical capacitance is directly proportional to the surface area accessible to the electrolytes.4,8–11 These supercapacitors can store significantly more energy per unit mass or volume than conventional capacitors by several orders of magnitude. This is because charge separation occurs over a minimal distance within the electrical double-layer at the interface between the electrode and the adjacent electrolyte,4,12 and a larger amount of charge can be stored on the highly extended electrode surface area created by numerous pores within the high surface-area electrode material.13 Pseudocapacitors have better energy density than EDLCs, drawing more attention to the energy storage field.14,15 Among the transition metal oxides (oxides of Mn, Mo, W, Ru, Ni, and Co) used as pseudocapacitors, RuO2·xH2O shows excellent electrochemical performance;16 however, its toxicity, less abundance of raw materials, and high cost limit its commercial application.
Many researchers have focused on developing electrode materials that are abundant in nature, low-cost, and environmentally friendly. Among them, Mn-oxides like MnO2, Mn2O3, and Mn3O4 received great attention due to their excellent applications in many fields, including catalysis, magnetic materials, electronics, and supercapacitors.17 Moreover, they can provide various oxidation states for redox charge transfer, enabling high energy and theoretical specific capacitance.18–20 The specific capacitance of the materials depends upon various factors like structure, porosity, and electrolytes. Wenyao Li et al. synthesized porous Mn2O3 by a facile hydrothermal process and exhibited a specific capacitance of 191.1 F g−1 at a current density of 100 mA g−1 in 0.5 M Na2SO4 electrolyte.21 Zhen-Yu Li et al. synthesized Mn2O3 nanowalls on nickel foam through the facial hydrothermal route and obtained a specific capacitance of 480 F g−1 at 10 mV s−1 scan rate in 6 M KOH electrolyte.22 Ravinder N. Reddy et al. prepared amorphous Na0.25MnO2·0.5H2O using the sol–gel method and reported the specific capacitance of 110 F g−1 at a scan rate of 5 mV s−1 in 2 M KCl electrolyte.23 Recently, A. Dhakal et al. synthesized Mn2O3-6 using urea and piperazine by a hydrothermal process and obtained the specific capacitance of 952 F g−1 at a scan rate of 1 mV s−1 in 6 M KOH electrolyte.24
In this work, we synthesized Mn2O3 using the hydrothermal process and observed the variation of structural and morphological changes with varying concentrations of urea during the synthesis of Mn2O3. The electrochemical performance of the as-synthesized Mn2O3 electrode was assessed in different electrolytes. The choice of electrolyte affects the ionic conductivity, potential window, and overall electrochemical stability, directly impacting the supercapacitor's energy storage capability and efficiency.25 The suitability of Mn2O3 as an electrode material for supercapacitors was evaluated in four different electrolytes: potassium hydroxide (KOH), sodium hydroxide (NaOH), sodium sulfate (Na2SO4), and sodium nitrate (NaNO3) in 1 and 3 M aqueous solution. Meanwhile, hydroxide salts are strong bases providing a high ionic strength due to the OH− concentration, which can influence the conductivity and the diffusion of reactants. Sulfate and nitrate salts are natural salts having low ionic strength, but provide a more stable environment for electrode materials, reducing the risk of corrosion or degradation compared with alkaline solutions. Thus, selecting an appropriate electrolyte is crucial as it influences the electrode's electrokinetic behavior regarding reaction kinetics, stability, and conductivity, affecting energy and power density performance. By exploring various electrolytes, this study aims to optimize the electrochemical performance of Mn2O3, highlighting the profound impact of electrolyte selection on supercapacitor efficiency and stability.
2. Experimental section
2.1. Synthesis of Mn2O3
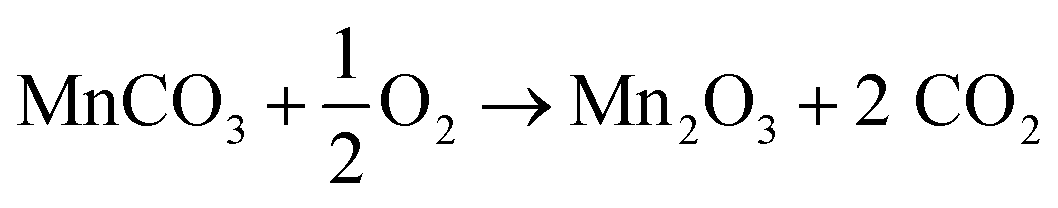
The Mn2O3 compound was synthesized using a hydrothermal method. Manganese(II) nitrate tetrahydrate (2 mmol, Mn(NO3)2·4H2O, Sigma-Aldrich Chemicals) and urea (x = 3, 6, 9, and 12 mmol, NH2CONH2, Sigma-Aldrich Chemicals) were mixed in a 2![[thin space (1/6-em)]](https://www.rsc.org/images/entities/char_2009.gif) :x ratio in 40 mL of deionized water (DI). The solution was magnetically stirred for 1 hour. Consequently, the 40 mL of precursor solution was transferred into a stainless-steel autoclave with a Teflon-lined 50 mL beaker. The mixture was autoclaved and maintained at a vacuum furnace temperature of 180 °C for 24 h. After cooling to room temperature, the sample was centrifuged and washed multiple times with DI water to achieve a pH of 7. The residue was dried on a hot plate at 60 °C and finally heated in a furnace at 900 °C for three hours. The resulting black powder was Mn2O3-x (x = 3, 6, 9, and 12 mM urea) particles, which are named Mn2O3-3, Mn2O3-6, Mn2O3-9, and Mn2O3-12, respectively. The main reactions were related to the following process: (1) urea decomposes at high temperatures and pressure and generates CO32− and OH− (2) Mn2+ reacts with CO32− to form a precipitate of MnCO3. Finally, Mn2O3 can be obtained after thermal treatment (eqn (1)–(5)).26,27Fig. 1 shows the schematic diagram of the Mn2O3 hydrothermal synthesis process.
:x ratio in 40 mL of deionized water (DI). The solution was magnetically stirred for 1 hour. Consequently, the 40 mL of precursor solution was transferred into a stainless-steel autoclave with a Teflon-lined 50 mL beaker. The mixture was autoclaved and maintained at a vacuum furnace temperature of 180 °C for 24 h. After cooling to room temperature, the sample was centrifuged and washed multiple times with DI water to achieve a pH of 7. The residue was dried on a hot plate at 60 °C and finally heated in a furnace at 900 °C for three hours. The resulting black powder was Mn2O3-x (x = 3, 6, 9, and 12 mM urea) particles, which are named Mn2O3-3, Mn2O3-6, Mn2O3-9, and Mn2O3-12, respectively. The main reactions were related to the following process: (1) urea decomposes at high temperatures and pressure and generates CO32− and OH− (2) Mn2+ reacts with CO32− to form a precipitate of MnCO3. Finally, Mn2O3 can be obtained after thermal treatment (eqn (1)–(5)).26,27Fig. 1 shows the schematic diagram of the Mn2O3 hydrothermal synthesis process.| | | NH2CONH2 + H2O → CO2 + 2NH3 | (1) |
| | | 2NH3 + H2O → 2NH4+ + OH− | (2) |
| | | CO2 + H2O → CO32− + 2H+ | (3) |
| |  | (5) |
 |
| | Fig. 1 Schematic of the hydrothermal synthesis process of Mn2O3. Created with BioRender.com. | |
2.2. Preparation of electrode
Nickel foam with an area of 1 cm × 1 cm was cleaned by ultrasonication in 20 mL of 37% HCl solution for 10 minutes. Afterward, the nickel foam was rinsed several times with deionized water and ultrasonicated for 10 minutes in deionized water and ethanol. The cleaned nickel foam was dried at 100 °C for 2 hours in a furnace. For electrode preparation, 1 mL of N-methylpyrrolidone (NMP) was added to a mixture of 6 mg Mn2O3 and 1 mg polyvinylidene fluoride (PVDF) and magnetically stirred for 6 hours to ensure uniform distribution. Subsequently, 0.5 mL of the solution was applied to the surface of the nickel foam and heated in a furnace at 100 °C for 20 hours. The weight of the sample loaded on the nickel foam was determined by subtracting the clean nickel foam's weight from the nickel foam's weight with the sample applied.
2.3. Characterization
Mn2O3 particles were characterized using an X-ray diffractometer (Bruker D8 Advance, Germany) with a Cu Kα radiation source (λ = 0.15406 Å, 40 kV, 40 mA, step size of 0.04, scan rate of 0.2 min per step, 20° ≤ 2θ ≤ 70°). The morphology of Mn2O3 particles was evaluated using a field emission scanning electron microscope (FESEM, Hitachi S-4700) with an acceleration voltage of 20 kV and an emission current of 10 mA. The surface composition and chemical state of Mn2O3 particles were analyzed using X-ray photoelectron spectroscopy (XPS) with a Thermo Scientific K-Alpha system, employing a 0.1 eV step size and a standard Al X-ray source (1486.6 eV photons). A surface area analyzer measured the BET surface area and pore size distribution (Quantachrome Nova Touch NT2LX-2) at 77 K using nitrogen as an adsorbate gas. The electrochemical performance of Mn2O3 particles was evaluated using an electrochemical analyzer (Gamry IFC 1000-07045, USA). The electrochemical properties were studied in a three-electrode configuration within the voltage range of 0 to +0.6 V in 1 and 3 M base electrolytes, viz., KOH, NaOH, and neutral electrolytes, viz., NaNO3 and Na2SO4, with a platinum plate as the counter electrode, an Ag/AgCl reference electrode, and the nickel foam (1 × 1 cm2) with the loaded sample as the working electrode. In this study, we did not use a 3 M Na2SO4 electrolyte due to issues with the solubility limit of salt in aqueous solution at room temperature.28
3. Results and discussion
3.1. Structure and morphology
3.1.1. X-ray diffraction study.
The phase formation and crystallographic information of Mn2O3-x determined by analyzing the XRD patterns (Fig. 2(a)) and using Rietveld refinement with the GSAS-II program (Fig. 2(b)) present the Rietveld refined XRD patterns, featuring sharp diffraction peaks, which demonstrate the crystalline nature of the sample. The diffraction peaks are attributed to cubic phase Mn2O3 (PDF 00-041-1442) with a space group of Ia![[3 with combining macron]](https://www.rsc.org/images/entities/char_0033_0304.gif) .
.
 |
| | Fig. 2 (a) XRD patterns and (b) Rietveld refined patterns of Mn2O3. | |
The Williamson–Hall (W–H) equation is used to calculate the crystallite size (D) and microstrain (ε) of Mn2O3:29
| |  | (6) |
where
β represents the full-width-at-half-maximum (FWHM),
θ denotes the angle of diffraction,
k is a constant (shape factor ∼0.9),
λ represents the wavelength of the X-ray used (0.15406 Å). The crystallite size and average microstrain were calculated using the W–H plot from individual phases of all main peaks at (211), (222), (400), (332), (134), (440), and (622) and presented in
Table 1.
Table 1 Structural characteristics of Mn2O3-x
| Samples |
Average particle length (μm) |
a (Å) |
V (Å3) |
Crystallite size (nm) |
Microstrain (10−3) |
| Mn2O3-3 |
11.82 |
9.408 |
832.60 |
129.58 |
1.52 |
| Mn2O3-6 |
9.94 |
9.405 |
831.89 |
124.91 |
1.63 |
| Mn2O3-9 |
8.64 |
9.410 |
833.16 |
113.65 |
1.68 |
| Mn2O3-12 |
8.32 |
9.412 |
833.85 |
87.20 |
1.73 |
As listed in Table 1, the urea content is observed to influence the lattice parameter of Mn2O3. Urea can decompose during hydrothermal synthesis to release ammonia (NH3) and carbon dioxide (CO2). This may affect the oxidation state of manganese, leading to the creation of oxygen vacancies. An increase in oxygen vacancies can cause lattice expansion due to the relaxation of bonds in the crystal structure, increasing the lattice parameter. Further, upon hydrolysis, urea forms ammonia, raising the pH of the solution. Changes in pH could also lead to different degrees of hydration or hydroxylation at the surface, indirectly affecting the internal structure and lattice parameters.30 On the other hand, both average particle and crystallite sizes are observed to decrease with the increase in urea content. The rise in pH upon the hydrolysis of urea can increase the supersaturation level of the metal cations, leading to a faster nucleation rate. When the nucleation rate is higher, smaller nuclei form instead of a few large particles, which leads to a decrease in average particle and crystallite size. The increase in pH also affects the surface charge of the growing particles. A higher surface charge can increase repulsive electrostatic interactions between particles, preventing their coalescence and resulting in smaller particles. The steric hindrance or surface passivation effect, and the adsorption of decomposition products such as NH3 and CO2 reduces the chance of small particles clumping together, contributing to smaller particle sizes.
3.1.2 Morphological study.
The surface morphology of the synthesized Mn2O3 was characterized by field emission scanning electron microscopy (FESEM) shown in Fig. 3(a)–(d). The morphology of the synthesized sample is cubic and porous. First, the particles’ length was measured using ImageJ software from the FESEM images. Then, the average particle size was estimated by fitting the log-normal distribution as shown in eqn (7).31| |  | (7) |
where f(L) is the function of length (L), and μ and σ represent the mean and standard deviation. The average length (arithmetic mean of a log-normally distributed variable L) is calculated from the exp(μ + σ2/2) expression. The calculated average length of the particles decreased with an increase in the concentration of urea during the synthesis of Mn2O3, with values of 10.56, 9.44, 7.71, and 7.39 μm for Mn2O3-3, Mn2O3-6, Mn2O3-9, and Mn2O3-12, respectively (Fig. 3(a′)-(d′)). The decrease in average particle length with increasing urea content during the synthesis of Mn2O3 is primarily due to the influence of urea on nucleation and growth processes. High urea concentrations enhance the nucleation rate, limiting individual particle growth and resulting in smaller sizes.
 |
| | Fig. 3 FESEM images of (a) Mn2O3-3, (b) Mn2O3-6, (c) Mn2O3-9, (d) Mn2O3-12, and (a′)–(d′) histograms with log-normal distribution of length of Mn2O3 particles. | |
3.1.3 Surface adsorption/desorption.
The surface area and porosity of Mn2O3 are measured using their N2 adsorption–desorption isotherms. Fig. 4(a)–(d) shows a type IV isotherm.32 The pore size distribution of mesoporous Mn2O3 was calculated from the isotherm (inset of Fig. 4) in the 5–15 nm range. Using a Brunauer–Emmett–Teller (BET) surface analysis, the specific surface area of mesoporous Mn2O3-3, 6, 9, and 12 are 7.33, 11.54, 9.54, and 9.93 m2 g−1 with an average pore size of 3.14, 3.10, 3.00, and 2.88 nm, and the total pore volume of 0.012, 0.018, 0.014, and 0.014 cm3 g−1, respectively, as listed in Table 2. Mn2O3-6 has the highest specific surface area.
 |
| | Fig. 4 (a)–(d) N2 adsorption and desorption plots of the Mn2O3 particles measured at 77 K. The inset shows pore size distribution. | |
Table 2 BET surface area and pore size distribution of Mn2O3
| Compound (Mn2O3 with different urea ratios) |
Weight (g) |
BET surface area (m2 g−1) |
Average pore size (radius nm) |
Total pore volume (cc g−1) |
| Mn2O3-3 |
0.244 |
7.32 |
3.15 |
0.012 |
| Mn2O3-6 |
0.185 |
11.53 |
3.11 |
0.018 |
| Mn2O3-9 |
0.203 |
9.54 |
3.00 |
0.014 |
| Mn2O3-12 |
0.223 |
9.93 |
2.88 |
0.014 |
3.1.4. X-ray photoelectron spectroscopy study.
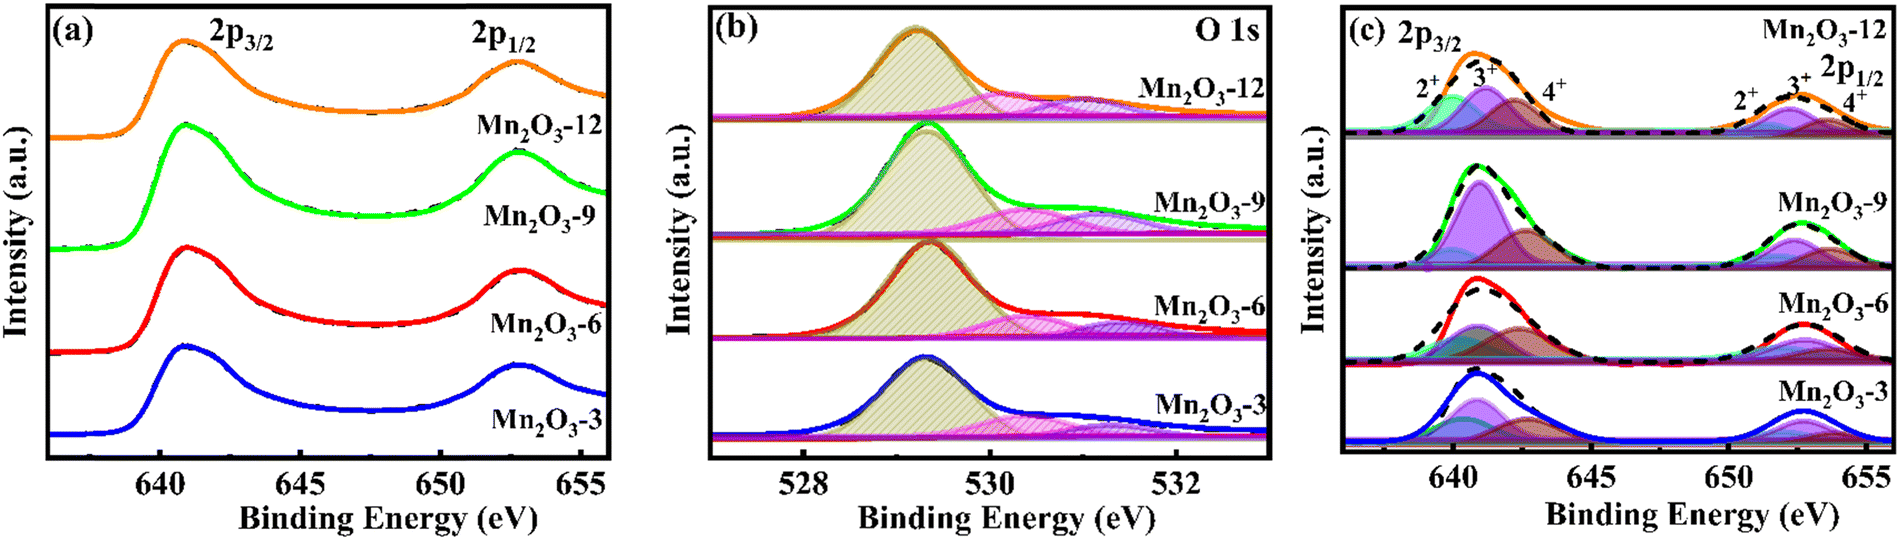
Fig. 5(a)–(c) shows the XPS plots of Mn2O3 particles. The XPS survey shows the characteristic peaks for Mn and O in the porous Mn2O3 particles. The high-resolution Mn 3s spectrum of porous Mn2O3 cubes peaks at 640.8 eV and 652.7 eV correspond to 2p3/2 and 2p1/2 transitions, respectively (Fig. 5(a)). This agrees with the reported binding energy values of the oxidation states of Mn3+.23,33Fig. 5(b) depicts the high-resolution spectrum of O 1s. The binding energy peaks at 528.9 and 530.7 eV indicate Mn–O–Mn formation, as these binding energy peaks are typically attributed to the O2−.34 The deconvoluted peaks of the Mn 2p spectra of Mn2O3 samples are shown in Fig. 5(c), indicating the presence of 2+, 3+, and 4+ oxidation states. The Mn 2p3/2 signal exhibits peaks at 640.5 eV for Mn2+, 641.4 eV for Mn3+, and 643.0 eV for Mn4+. The Mn 2p1/2 signal is divided into three peaks at around 652.0 eV for Mn2+, 653.0 eV for Mn3+, and 654.6 eV for Mn4+.35 These values are consistent with the reported values of Mn2O3.36 The primary oxidation state detected for Mn2O3 is +3 (magenta), followed by +4 (orange), and there is a very low presence of the +2 oxidation state (cyan color). The oxidation peak ratios of Mn3+/Mn2+ are 1.5, 1.7, 3.3, and 1.4, and for Mn3+/Mn4+ the oxidation peak ratios are 1.3, 1.2, 1.6, and 1.4 for Mn2O3-3, 6, 9, and 12, respectively, indicating a predominance of Mn3+ states in the Mn2O3-9 mM urea sample. The XPS data shows a noticeable oxygen deficiency in Mn2O3, as noted in a lower-than-expected O 1s peak intensity. The estimated composition from the XPS data is Mn2O1.33, Mn2O1.28, Mn2O1.27, and Mn2O1.29 for Mn2O3-3, 6, 9, and 12, respectively. This suggests an oxygen vacancy (Mn2O3−δ) or surface reduction of the Mn2O3 structure, contributing to altered electrochemical properties.
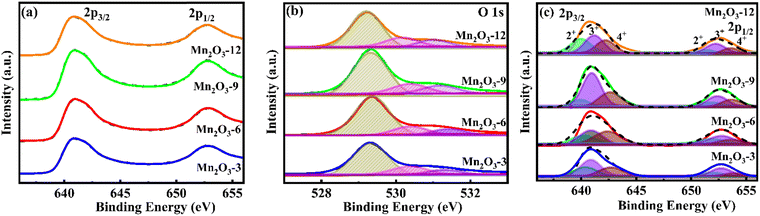 |
| | Fig. 5 X-ray photoelectron spectra. (a) High-resolution spectra of Mn 2p, (b) O 1s, and (c) deconvoluted peaks of Mn 2p of Mn2O3 particles. | |
3.2. Electrochemical analysis
3.2.1. Cyclic voltammetry.
The capacitive performance and electrochemical behavior of the supercapacitor's electrode have been determined by three-electrode systems’ cyclic voltammetry (CV) measurements. In particular, CV measurements distinguish between capacitive (non-faradaic) and faradaic (redox) processes, allowing for a better understanding of the electrode's behavior.
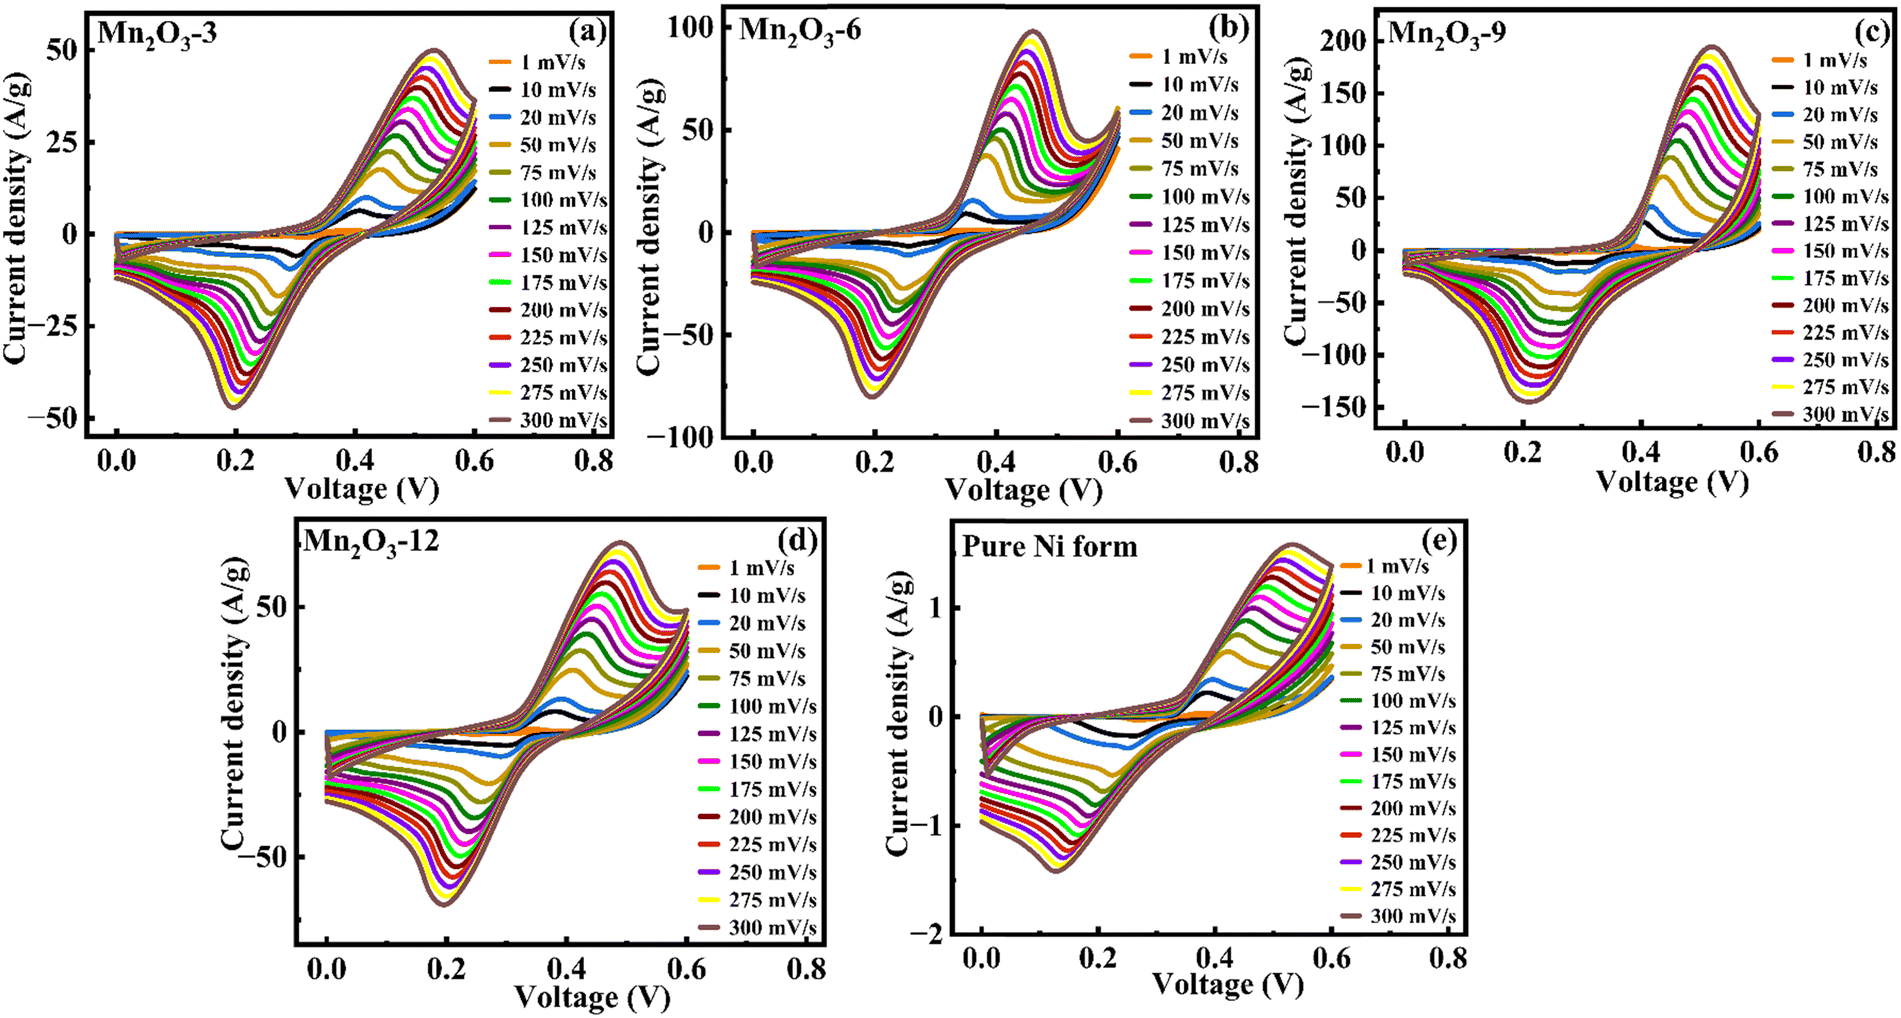
Fig. 6(a)–(d) shows the cyclic voltammetry measurement of Mn2O3-x at different scan rates from 1 to 300 mV s−1 in 1 M KOH electrolyte. The scan rate voltammetry provides insight into the rate capability and kinetics of the electrode material. The noticeable oxidation and reduction peaks represent reversibility, and the shifting of oxidation and reduction peaks with increasing scan rate shows the battery-type behavior of electrodes.37,38
 |
| | Fig. 6 Cyclic voltammetry curves of (a)–(d) Mn2O3-x and (e) pure Ni form at different scan rates from 1–300 mV s−1 in 1 M KOH electrolyte. | |
The specific capacitance (Csp) (Fig. 7) of Mn2O3-x samples was calculated using eqn (14), revealing that Mn2O3-9 exhibited a higher Csp. The Csp values at a scan rate of 1 mV s−1 were 224, 319, 881, 238, and 10 F g−1 for Mn2O3-3, Mn2O3-6, Mn2O3-9, Mn2O3-12, and pure Ni form, respectively. Thus, pure Ni foam's specific capacitance is significantly lower than that of Mn2O3-x. Therefore, we can assume that the specific capacitance of electrodes originates from the Mn2O3 compound rather than Ni foam. Moreover, the superior Csp of Mn2O3-9 suggests enhanced electrochemical performance compared with the other concentrations. The specific surface area is not higher in Mn2O3-9 than in others; however, most of the Mn ions are in the Mn3+ oxidation state, which helps to enhance the electrochemical behavior. The oxidation states of Mn play an important role in the redox rate. Mn2+ has a half-filled 3d5 configuration, which is relatively stable due to the symmetry and exchange energy in a half-filled shell. This stability makes Mn2+ less prone to oxidation (losing an electron) to Mn3+. Meanwhile, Mn4+ has a 3d3 configuration and is generally more stable than Mn3+ because it is closer to a noble gas configuration when paired with ligands in a compound. Thus, Mn4+ tends to be less reactive in redox reactions than Mn3+. Alternatively, Mn3+ has a 3d4 configuration, which is less stable than Mn2+ because it lacks the symmetry and stabilization of the half-filled shell. Therefore, Mn3+ is more reactive in redox reactions, as it can either gain or lose an electron to achieve a more stable state. Also, abundant oxygen vacancies (Mn2O3−δ) provide a fast diffusion pathway for the electrolyte ions and more active sites and help maintain the structural integrity, which is crucial to enhance the electrochemical behavior.39 Consequently, the Mn2O3-9 mM urea sample was selected for further electrochemical characterization in different electrolytes to explore its potential for energy storage applications.
 |
| | Fig. 7 Specific capacitance (Csp) vs. scan rate of Mn2O3-x. | |
Fig. 8(a) and (b) show the cyclic voltammetry measurement at a scan rate of 1 mV s−1 in 1 and 3 M KOH, NaOH, and NaNO3 electrolytes. Mn2O3-9 enclosed the highest surface area in 1 M KOH electrolytes compared with other electrolytes. The CV curves' highest enclosed surface area pointed towards the superior electrochemical performance in the KOH electrolytes.
 |
| | Fig. 8 Cyclic voltammetry curves of Mn2O3-9 in (a) 1 M and (b) 3 M concentrations of different electrolytes. | |
The CV measurements are conducted at different scan rates to understand the reaction kinetics, diffusion processes, electrode behavior, and material characteristics. Fig. 9(a) and (b) show the CV plots of Mn2O3 electrodes at different scan rates from 1–300 mV s−1 between 0.0 and 0.6 V in 1 and 3 M of various electrolytes, respectively. A pair of redox peaks and non-rectangular shapes of CV curves suggest that the Mn2O3 electrode stores energy significantly from the dominant faradaic process in different electrolytes. The distinct, broad, symmetric anodic and cathodic peaks of the CV curves indicate a reversible faradaic redox reaction in charge storage involving Mn oxidation states (e.g., Mn2+ ↔ Mn3+ ↔ Mn4+) of Mn2O3 in different electrolytes. In the electrochemical storage mechanism, the redox interaction of cations x− (x− = OH−, NO3−, SO42− ions from the KOH, Na2SO4, and NaOH electrolytes) with Mn2O3-9 in different electrolytes can be described using eqn (8) and (9).40,41
| | | Mn2O3 + x− ↔ Mn4+[Mn3+]x−O3 + e− | (8) |
The redox intercalation/de-intercalation of cations (M
+ = Na
+, K
+, and H
+) in the electrode of Mn
2O
3 can be expressed in
eqn (9):
42| | | Mn2O3 + M+ + e− ↔ Mn4+[Mn3+]M+O3 | (9) |
 |
| | Fig. 9 Cyclic voltammetry curves of Mn2O3-9 at different scan rates in (a)–(d) 1 M and (a′)–(c′) 3 M concentrations of different electrolytes. | |
The charge storage mechanism in electrochemical systems can be predominantly categorized into two types: non-faradaic contributions from the electric double layer (capacitive) and faradaic contributions from diffusion-controlled processes. To identify the dominant contribution to the charge storage mechanism, the relationship between current and scan rate is analyzed using the power law:43
where
a and
b are the adjustable parameters, and exponent
b is derived from the slope of the logarithmic plot of
eqn (10). The value of
b typically ranges from 0.5 to 1. Values closer to 0.5 suggest a predominant contribution from diffusion-controlled processes, whereas values approaching 1 indicate a greater contribution from surface charge effects. Mn
2O
3 has
b-values of 0.56, 0.68, 0.73, and 0.71 in 1 M KOH, NaOH, NaNO
3, and Na
2SO
4, and 0.69, 0.59, and 0.73 in 3 M KOH, NaOH, and NaNO
3 electrolytes, respectively (
Fig. 10). Our observations show that
b-values across all electrolytes are consistently closer to 0.5, indicating that diffusion-controlled contributions predominantly govern the charge storage mechanism in these systems.
 |
| | Fig. 10
b-Values plots of Mn2O3-9 in (a) 1 M and (b) 3 M concentrations of different electrolytes. | |
The Randles–Sevcik equation is used in CV to analyze the linear relationship between the peak current and the square root of the scan rate (ip ∝ v1/2), which gives insight into reaction kinetics and diffusion-controlled processes.44
| | | ip = 2.69 × 10⁵AC0n3/2D1/2v1/2 | (11) |
where
ip is the peak current,
C0is the surface concentration,
A is the surface area,
D represents the diffusion coefficient, and
v is the scan rate. The observed linear relationship between the square root of the scan rate and the current suggests that the predominant contribution to charge storage arises from diffusion-controlled reactions. The slope of
eqn (11) is directly proportional to the square root of the diffusion coefficient. It is observed that Mn
2O
3-9 demonstrated a more pronounced slope in 3 M electrolytes, reflecting enhanced electron transfer efficiency during redox reactions. This indicates that a significant portion of the charge storage is governed by a diffusion-controlled mechanism, as shown in
Fig. 11(a) and (b). This implies that increasing the electrolyte concentration enhances the diffusion-controlled charge storage capacity, likely due to efficient ion transport.
 |
| | Fig. 11 (a) and (b) Relationship between the peak currents in cyclic voltammetry and the square root of scan rates in 1 M and 3 M concentrations of different electrolytes. | |
As b-values are not exactly 0.5, the material exhibits a hydride charge storage mechanism: a combination of surface-controlled (k1v) and diffusion-controlled (k2v1/2). The quantitative difference between the capacitive and diffusion-controlled contribution to the total charge storage was calculated according to:45
For analytical purposes, this equation can be rearranged as:
| |  | (13) |
where
v is the scan rate. The
k1 and
k2 values are determined from the slope and the y-intercept of
eqn (12), respectively.
Eqn (12) and (13) analyze complex electrode processes involving surface-controlled (where
k2 = 0 or
b = 1) and diffusion-controlled (where
k1 = or
b = 0.5) ion or electron transfer processes. The quantitative representation of the diffusion-controlled and surface-controlled contributions to total energy storage is presented in the bar graph (
Fig. 12(a) and (b)). The diffusion-controlled contribution is more than 50% in all electrolytes, even at a scan rate of 300 mV s
−1.
 |
| | Fig. 12 Percentage capacitive and diffusion contribution to the total charge storage in the Mn2O3-9 mM urea sample measured in (a) 1 M and (b) 3 M electrolyte concentrations at different scan rates. | |
The specific capacitance, Csp, is estimated by integrating the area under the current–potential curve, as described in eqn (14):4
| |  | (14) |
where
Csp (F g
−1) is the specific capacitance,
m is the mass of the active material in the electrode,
v is the scan rate (mV s
−1),
Vc–
Va is a potential window, and
I(
V) is the response current. The integral part gives the area under the current potential curve. As seen in
Fig. 13, the mesoporous Mn
2O
3-9 electrode shows the
Csp of 641, 240, 588, and 300 F g
−1 in 1 M KOH, Na
2SO
4, NaOH, and NaNO
3, and 1043, 768, and 519 F g
−1 in 3 M KOH, NaOH, and NaNO
3 electrolytes at a scan rate of 1 mV s
−1, respectively, presented in
Table 3. The
Csp values of KOH electrolytes are higher than those of others owing to the hydrated cationic radius, cationic mobility, conductivity, and their effect on charge/ion exchange and diffusion. V Nithya
et al. studied the electrochemical performance of Bi
2WO
6 particles in various electrolytes, such as 1 M KOH, 6 M KOH, 1 M LiOH, 1 M NaOH, and 1 M Na
2SO
4 solutions. They reported that the current response of Bi
2WO
6 in various electrolytes decreases in the order 6 M KOH > 1 M KOH > 1 M NaOH > 1 M LiOH > 1 M Na
2SO
4. This higher current response of KOH compared with the other electrolytes is due to the different hydration sphere radius of K
+ (3.31 Å) and Na
+ (3.58 Å). The cationic radius is higher in K
+-H
2O
δ− < Na
+-H
2O
δ−. The reported conductivity of K
+ (73 cm
2 Ω mol
−1) and Na
+ (50 cm
2 Ω mol
−1) at room temperature implies that the mobility of ions is higher for K
+ than Na
+. By changing the anionic species, higher mobility and conductivity were observed. The OH
− ion has higher conductivity (198 cm
2 Ω mol
−1) and mobility (2.06 × 10
−6 cm
2 V
−1 s
−1) compared with other NO
3− and SO
42− ions.
46 Therefore, due to the smaller hydrated ions and higher mobility and conductivity of K
+ ions, Mn
2O
3 displays the highest
Csp in 1 M and 3 M KOH electrolytes. Additionally, owing to the smaller hydration sphere radius of K
+ ions, they acquire a small charge density (weaker solvation interactions with water molecules, which favor easier polarization during the desolvation process), which further helps in easy transfer of K
+ ions into the electrode during the redox reactions.
47
 |
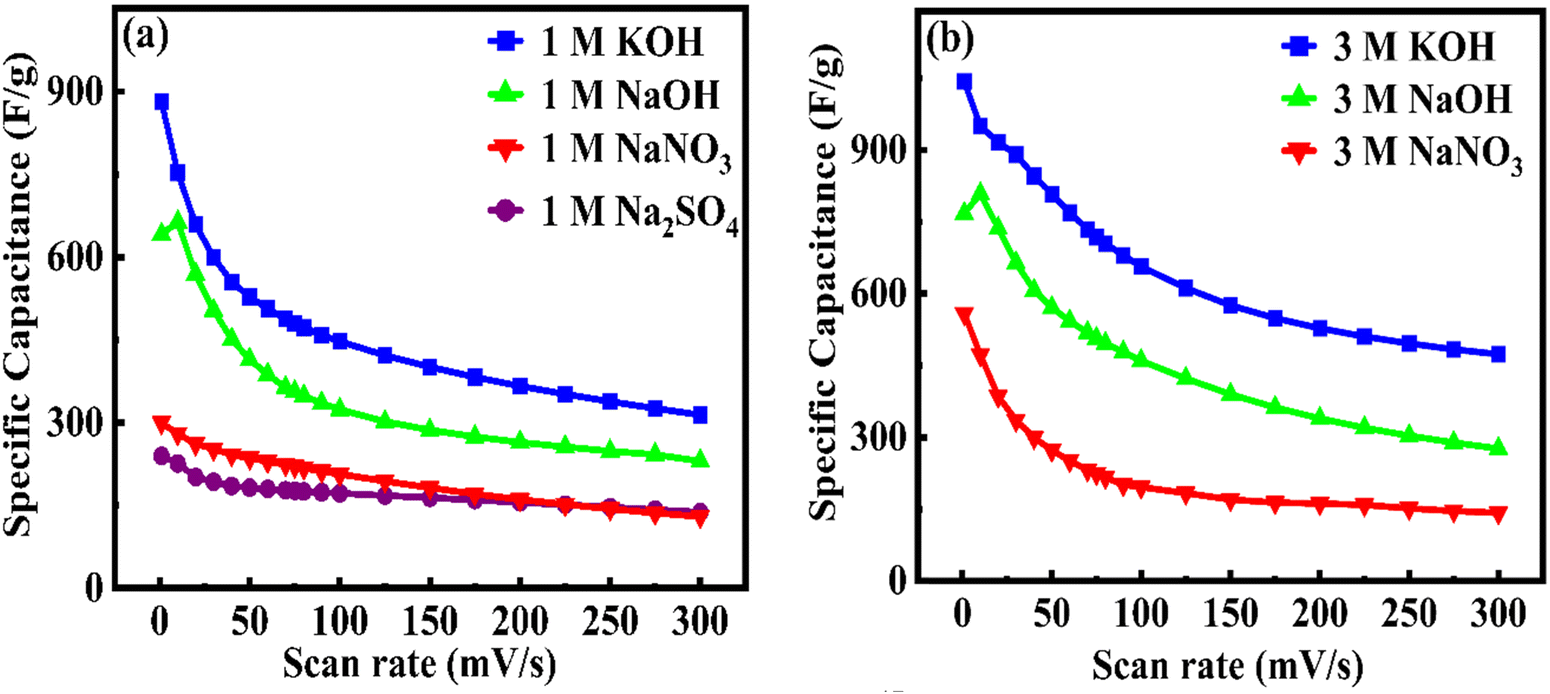
| | Fig. 13 Relationship between Csp and the scan rates for Mn2O3-9 measured in (a) 1 M and (b) 3 M concentrations of different electrolytes. | |
Table 3 Specific capacitance, Csp, of Mn2O3-9 in different electrolytes at a scan rate of 1 mV s−1
| Electrolytes |
Csp (F g−1) |
| 1 M |
3 M |
| KOH |
881.3 |
1043.2 |
| NaOH |
641.1 |
767.8 |
| NaNO3 |
299.7 |
558.4 |
| Na2SO4 |
239.9 |
— |
The Csp of the Mn2O3 electrode in NaOH, Na2SO4, and NaNO3 electrolytes has different values. The results show that electrodes display higher Csp in KOH electrolytes. The Csp follows OH− > NO3− > SO42− due to the increased anionic size of the nitrate and sulfate ions compared with hydroxyl ions.48 The Csp values increased with electrolyte concentrations (1 and 3 M), implying that higher-concentration electrolytes have more ions. The abundance of ions leads to more charge carriers, which can efficiently move between the electrode and the electrolyte, increasing the overall mobility and conductivity.
3.2.2 Charge–discharge studies.
Further, charge–discharge experiments were conducted to test the ability of the capacitors. Fig. 14(a) and (b) show the charge–discharge curves at a current density of 1 A g−1 of Mn2O3-9 in different electrolytes: KOH, NaOH, NaNO3, and Na2SO4 at 1 and 3 M (except Na2SO4). In both cases, the charge/discharge characteristics of Mn2O3-9 showed asymmetry between the nonlinear charge and discharge curves, further proving the strong faradaic behavior of the electrode.
 |
| | Fig. 14 Chronopotentiometry charge–discharge curves of Mn2O3-9 at a current density of 1 A g−1 in (a) 1 M and (b) 3 M concentrations of different electrolytes. | |
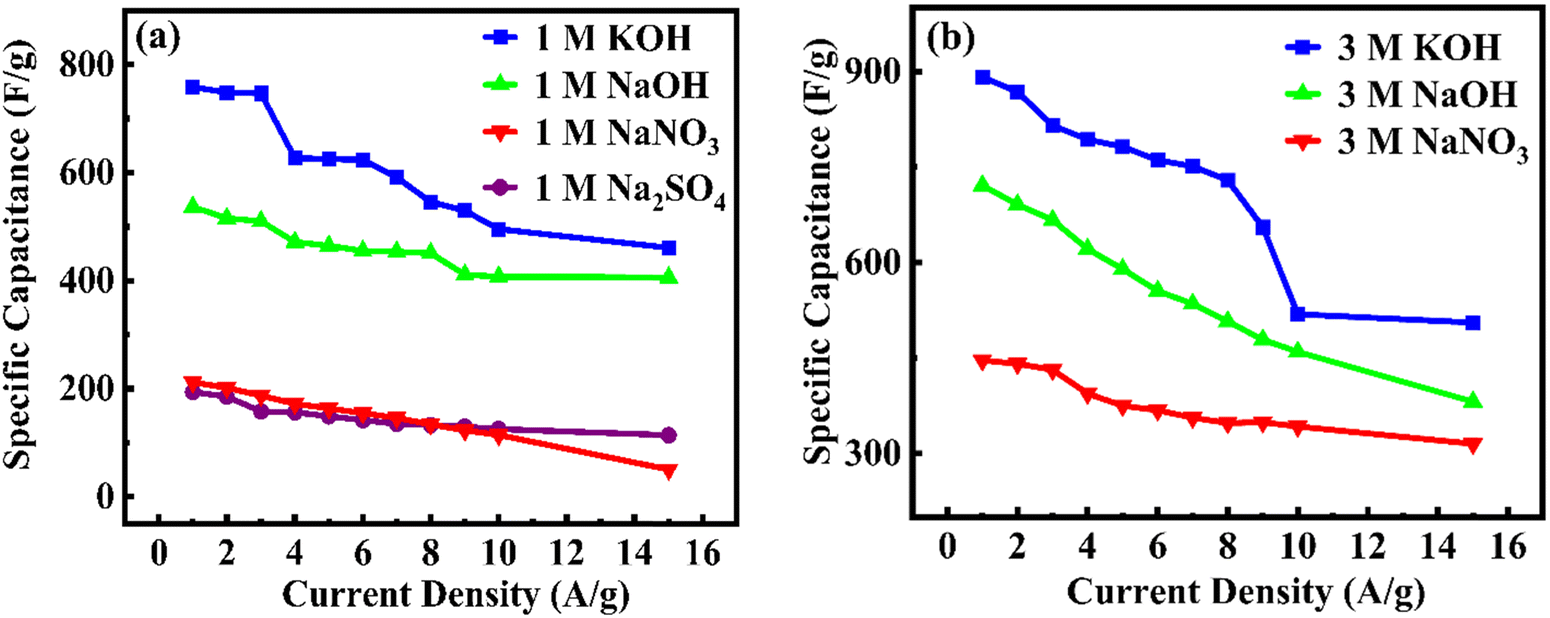
The charge–discharge measurements were also carried out at different current densities from 1 to 15 A g−1 to understand rate capability, capacity retention, and charge storage kinetics. Fig. 15(a) and (b) show the charge–discharge curves of Mn2O3-9 at different current densities.
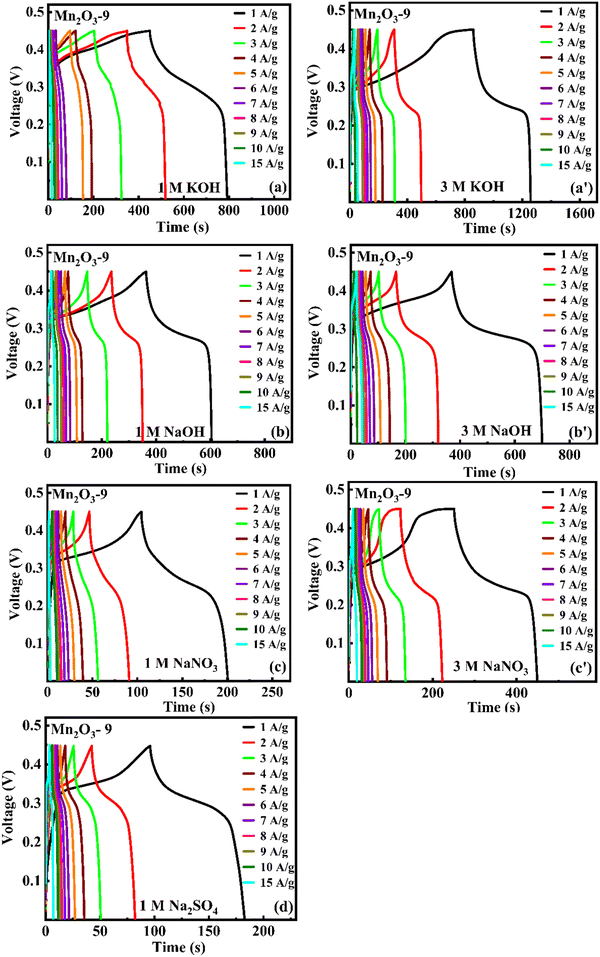 |
| | Fig. 15 Chronopotentiometry charge/discharge curves of Mn2O3-9 at different current densities in (a)–(d) 1 M and (a′)–(c′) 3 M concentrations of different electrolytes. | |
Mn2O3 undergoes pseudocapacitive behavior in alkaline KOH and NaOH electrolytes. In these electrolytes, Mn2O3 participates in faradaic redox reactions, where it undergoes reversible changes in its oxidation states (e.g., Mn3+ ↔ Mn4+) and forms manganese oxyhydroxides (MnOOH) at the surface. This interaction allows the material to efficiently store charges, contributing to a higher capacitance and ultimately, a longer discharge time. Meanwhile, in neutral electrolytes (Na2SO4 and NaNO3), Mn2O3 does not undergo the same redox reactions or surface transformations. Thus, the material cannot take advantage of pseudocapacitive behavior to the same extent. The charge storage process is primarily an EDLC type, which is less efficient and provides lower charge storage capacity and a shorter discharge time in these neutral electrolytes.
The Csp of Mn2O3-9 (Fig. 16) was calculated from the charge–discharge curve using eqn (15):49
| |  | (15) |
where
Im is the current density,
m is the mass of the active material, Δ
t is the discharge time, and Δ
V is the potential window. The
Csp is highest at a current density of 1 A g
−1 in all electrolytes and decreases with increasing current density. As the current density increases, the charge/discharge processes occur more rapidly, limiting the time available for ions to diffuse into deeper or less accessible parts of the electrode. This implies incomplete utilization of the active material, reduced ion adsorption, and decreased
Csp. The
Csp of Mn
2O
3-9 is 759 F g
−1 and 891 F g
−1 in 1 and 3 M KOH electrolytes, respectively, which is higher than that in other aquatic electrolytes, presented in
Table 4.
 |
| | Fig. 16
C
sp
vs. current densities measured via chronopotentiometry in different electrolytes at (a) 1 M and (b) 3 M concentrations of electrolytes. | |
Table 4 Specific capacitance, Csp, energy density, and power density of Mn2O3-9 in different electrolytes measured at 1 A g−1 current density
| Mn2O3-9 |
Electrolytes |
C
sp (F g−1) |
Energy density (W h kg−1) |
Power density (W kg−1) |
| 1 M |
KOH |
758.5 |
10.6 |
397.7 |
| NaOH |
536.5 |
26.8 |
398.3 |
| NaNO3 |
211.9 |
10.6 |
397.7 |
| Na2SO4 |
193.8 |
9.7 |
400.6 |
|
|
| 3 M |
KOH |
891.4 |
44.6 |
398.1 |
| NaOH |
721.0 |
36.0 |
394.7 |
| NaNO3 |
446.3 |
22.3 |
397.3 |
Fig. 17(a) and (b) show the Ragone plot of Mn2O3-9, which is the relation between the log of energy density and power density. Energy density and power density are important parameters for understanding the electrochemical behavior of the materials. The energy density (E, W h kg−1) and power density (P, W kg−1) are calculated from eqn (16) and (17):50
| |  | (16) |
| |  | (17) |
where
E is the energy density (W h kg
−1),
Csp represents specific capacitance (F g
−1), and Δ
v is the voltage window (
V);
P is the power density (W kg
−1), and
t is the discharge time (s).
 |
| | Fig. 17 Ragone plot of Mn2O3-9 in (a) 1 M and (b) 3 M concentrations of electrolytes measured at a current density range from 1 to 15 A g−1. | |
In Fig. 17(a) and (b), Csp in 1 and 3 M KOH exhibits the highest energy densities across all power densities, demonstrating superior performance to other electrolytes.
The stability test of Mn2O3-9 electrode was evaluated for 5000 cycles at 10 A g−1 current density. Fig. 18(a) and (b) present the cyclic stability in different electrolytes. The electrode demonstrates excellent stability throughout the cycling process across all electrolytes and concentrations (1 and 3 M). After 5000 cycles, the Csp retention is 89.5, 99.4, 81.0, and 86.1% in 1 M of KOH, NaOH, NaNO3, and Na2SO4 electrolytes, respectively. Moreover, the Csp retention is 93.0, 94.0, and 89.5%, in 3 M of KOH, NaOH, and NaNO3 electrolytes, respectively. The inset graphs in Fig. 18(a) and (b) show the Coulombic efficiency of Mn2O3-9 electrode.
 |
| | Fig. 18 Cyclic performance of Mn2O3-9 in (a) 1 M and (b) 3 M concentrations of electrolytes. The inset displays the Coulombic efficiency (CE) measured at 10 A g−1 current density. | |
The Coulombic efficiency (CE) is calculated as the ratio of the charge released during the discharge (tD) to the charge input during charging (tC), expressed as a percentage using the formula:  . The CE values are almost 100% for the electrode for every electrolyte used until 5000 cycles. The Csp and energy density are higher in our work than in previously reported electrodes, as presented in Table 5. The inset in Fig. 18 shows that Mn2O3-9 has a higher Coulombic efficiency in NaOH, NaNO3, and Na2SO4 than KOH electrolytes, which might be because Na+ ions are smaller than K+ ions. The smaller the ions, the more efficiently they can migrate through the electrolyte and participate in the electrochemical reactions.51
Table 5 Comparison of the electrochemical performance of Mn2O3 with previously reported electrodes
| Material |
Current density or scan rate |
Electrolyte |
C
sp (F g−1) |
Energy density (W h kg−1) |
Power density (W kg−1) |
Ref. |
| Mn2O3 nanoparticle |
10 mV s−1 |
6 M KOH |
460 |
— |
— |
52
|
| Mn2O3-piperazine |
1 A g−1 |
6 M KOH |
809.0 |
40.4 |
365 |
24
|
| Mn2O3 |
1 A g−1 |
1 M Na2SO4 |
209.1 |
— |
— |
53
|
| Mn2O3@nickel foam |
5 mV s−1 |
LiCl |
781 |
— |
— |
54
|
| Mn2O3-carbon aerogel |
1 mV s−1 |
6 M KOH |
368 |
— |
— |
55
|
| Mn2O3-9 |
1 A g−1 |
3 M KOH |
891.4 |
44.6 |
398.1 |
Present work |
| Mn2O3-9 |
1 A g−1 |
1 M Na2SO4 |
193.8 |
9.7 |
400.6 |
Present work |
| Mn2O3-9 |
1 A g−1 |
3 M NaNO3 |
446.3 |
22.3 |
397.3 |
Present work |
| Mn2O3-9 |
1 A g−1 |
3 M NaOH |
721.0 |
36.0 |
394.7 |
Present work |
| Mn2O3 nanofiber |
0.5 A g−1 |
0.5 M Na2SO4 |
358 |
46.4 |
4.42 |
56
|
| Porous Mn2O3 nanobars |
0.2 A g−1 |
3 M KOH |
249.7 |
— |
— |
57
|
| Mn2O3-cable-like nanofibers |
0.5 A g−1 |
6 M KOH |
216 |
— |
— |
58
|
| Mn2O3-carbon |
5 mV g−1 |
6 M KOH |
651 |
— |
— |
59
|
3.2.3. Electrochemical impedance spectroscopy (EIS).
To understand the electrochemical and electrical properties of the electrode, EIS was carried out on the synthesized Mn2O3-9. Fig. 19(a) and (b) show the EIS plots conducted in the frequency range of 0.1 to 100 kHz. The inset is the fitted equivalent circuit using “Gamry Echem Analysis” software, which consists of solution resistance (R1), constant phase element (CPE1, CPE2), charge-transfer resistance (R2), and Warburg impedance (W01). The fitted data of the equivalent circuit are presented in Table 6.
 |
| | Fig. 19 Nyquist plots of Mn2O3-9 in (a) 1 M and (b) 3 M concentrations of different electrolytes. The insets are the equivalent circuits. | |
Table 6 Fitted parameters derived from fitting EIS curves using the equivalent circuit method for electrodes of Mn2O3-9 (Fig. 19)
| Mn2O3-9 |
R
1 (Ω) |
R
2 (Ω) |
W
0 (Ω × 10−3) |
CPE1 (α) |
CPE1 (Q; Ω−1 sα) |
CPE2 (α) |
CPE2 (Q; Ω−1 sα) |
Goodness of fit (×10−3) |
| 1 M |
KOH |
1.878 |
14.98 |
0.211 |
0.719 |
0.004 |
0.914 |
0.003 |
0.171 |
| NaOH |
1.207 |
9.801 |
0.066 |
0.719 |
0.004 |
0.856 |
0.002 |
0.140 |
| NaNO3 |
2.217 |
83.73 |
0.254 |
0.732 |
0.002 |
0.951 |
0.001 |
0.656 |
| Na2SO4 |
3.427 |
129.8 |
0.179 |
0.736 |
0.001 |
0.958 |
0.001 |
0.682 |
|
|
| 3 M |
KOH |
1.182 |
9.941 |
0.126 |
0.638 |
0.01 |
0.960 |
0.002 |
0.166 |
| NaOH |
0.900 |
5.221 |
0.213 |
0.701 |
0.007 |
0.926 |
0.002 |
0.183 |
| NaNO3 |
6.606 |
38.75 |
0.153 |
0.634 |
0.005 |
0.979 |
0.002 |
0.614 |
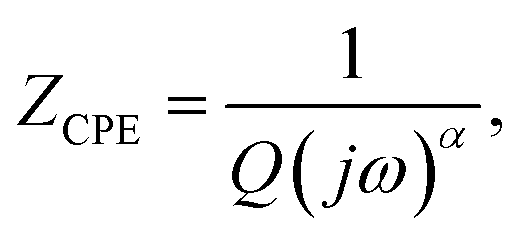
The Nyquist plot is divided into three parts. In the high-frequency region, the X-axis touching the intercept of curves represents the internal resistance (R1), which includes the intrinsic resistance of the active material's contact resistance between the active materials and the current collector interface, and the ionic resistance of the electrolyte. The straight line in the low-frequency region is the Warburg impedance, known as the ion diffusion resistance from the electrolyte to the electrode interface. The middle part is the charge-transfer resistance R2, which is the diameter of the semicircle.60,61 The absence of a semicircular curve indicates that the R2 values are small and that the ions or charge can easily transfer between the electrode and electrolyte. The R2 values of Mn2O3-9 are around 15, 10, 84, 130 Ω for 1 M KOH, NaOH, NaNO3, Na2SO4, and 10, 39, and 56 Ω for 3 M KOH, NaOH, NaNO3 electrolytes, respectively. The frequency dispersion is generally attributed to a phenomenon known as “capacitance dispersion,” which is described using a constant phase element (CPE) and used in modeling the non-ideal capacitive behavior in electrochemical systems, particularly at the electrode–electrolyte interface marred with surface roughness, inhomogeneities, or complex geometries. The impedance of the CPE is expressed as  where Q (Ω−1 sα) is the CPE parameter and α is the CPE exponent. The exponent α (0 ≤ α ≤ 1) indicates the deviation from ideal capacitive behavior. The CPE behaves as a capacitor for α = 1, a resistor for α = 0, an inductor for α = −1, and the Warburg impedance for α = 0.5.62 This result indicates that the NaOH electrolyte exhibits better conductivity for Mn2O3-9.
As evident from the above discussion, the Csp of Mn2O3 is notably higher in KOH electrolytes than in other electrolytes. The superior performance of electrodes in KOH electrolytes can be understood in terms of the molecular size of the hydrated ions and the molar conductance of electrolytes. As per the literature, the Na+ ionic radius of 0.95 Å is smaller than the K+ ionic radius of 1.33 Å.63,64 This implies that Na+ can easily intercalate compared to K+. However, Mn2O3 displays the highest Csp in KOH, followed by NaOH. Contrary to the expectation, this result is explained based on the ionic radii of hydrated ions.51,65 In fact, the smaller ions form larger hydrated ions. For example, the hydrated cation of Li+ has an ionic radius of 3.82 Å, which is larger than the hydrated cation ionic radius of Na+ of 3.58 Å and the hydrated cation ionic radius of K+ of 3.31 Å.59 Also, Ho et al.'s conductivity measurements report the conductance of KOH > NaOH.66 Thus, smaller hydrated ionic radii of K+ ions contribute to the higher ionic conductivity of the KOH electrolyte than that of NaOH.67 Further, OH− ions exhibit superior conductivity and mobility compared with NO3− and SO42−, contributing to a higher capacitive performance. The hydroxide ion is relatively small, and it forms a less extensive hydration shell when it is hydrated in water, compared with larger, more complex anions like NO3− and SO42−. Due to their smaller size and less bulky hydration shell, OH− ions move more easily through the solution, resulting in higher mobility. In contrast, nitrate ions are larger and more symmetrical, forming a more extensive hydration shell because their charge is spread over a larger area, which increases resistance to movement and lowers their mobility compared with OH−. The sulfate ion is even larger and carries a higher charge (−2), causing a very strong interaction with water molecules and creating a highly hydrated, bulky complex. This large hydration shell significantly hinders its mobility and reduces its conductivity. Overall, the electrochemical performance of supercapacitors in aqueous electrolytes is strongly influenced by the types of cations and anions, ion concentrations, hydrated ion sizes, conductivity, and ion mobility.
4. Conclusion
We have successfully synthesized Mn2O3 using different concentrations of urea by a hydrothermal method. Among the four samples (Mn2O3-3, 6, 9, and 12), the Mn2O3-9 mM urea sample with relatively higher Mn3+ content displayed a higher Csp in 1 M KOH electrolytes. Consequently, a detailed electrochemical analysis of Mn2O3-9 was conducted in different base and neutral electrolytes. The measured Csp for Mn2O3-9is higher at 881 F g−1 and 1043 F g−1 at a scan rate of 1 mV s−1 in 1 and 3 M KOH electrolytes, respectively. Similarly, the Csp exhibited 891 F g−1 with an energy density of 45 W h kg−1 and 398 W kg−1 power density in 3 M KOH at a 1 A g−1 current density. The measured Csp, energy, and power densities are superior in KOH > NaOH > NaNO3 > Na2SO4 electrolytes. The capacitive retention after 5000 cycles was higher in base electrolytes compared with neutral ones. This work introduces innovative strategies to enhance the Csp, energy density, and power density of Mn2O3-based battery-type electrode materials by optimizing their crystal structure and choice of electrolytes. The findings demonstrate the potential of these materials as promising candidates for large-scale supercapacitor applications. The study conclusively shows that the electrochemical performance of supercapacitors is greatly affected by factors such as the type of electrolytes, including the types of cations and anions, salt concentration, hydrated ion size, conductivity, and ion mobility. These properties play a crucial role in determining ion transport dynamics, charge storage capacity, and the overall efficiency and stability of the device.
Author contributions
Alisha Dhakal: synthesis, methodology, formal analysis, data curation, and writing – original draft. Dr Felio Perez: XPS measurement and analysis. Dr Sanjay R Mishra: project supervision, conceptualization, review, and editing.
Data availability
Data for this article, including BET, electrochemical analysis, XPS, and XRD, are available at Zenodo at https://zenodo.org/uploads/14866457.
Conflicts of interest
The authors declare that they have no known competing financial interests or personal relationships that could have appeared to influence the work reported in this paper.
Acknowledgements
This study did not receive any financial support. The authors acknowledge the University of Memphis's support for this research.
References
- A. Evans, V. Strezov and T. J. Evans, Assessment of utility energy storage options for increased renewable energy penetration, Renewable Sustainable Energy Rev., 2012, 16, 4141–4147 CrossRef.
- C. Liu, F. Li, M. Lai-Peng and H. M. Cheng, Advanced Materials for Energy Storage, Adv. Mater., 2010, 22, E28–E62 CAS.
- J. R. Miller and P. Simon, Electrochemical capacitors for energy management, Science, 2008, 321, 651–652 CrossRef CAS PubMed.
- P. Simon and Y. Gogotsi, Materials for electrochemical capacitors, Nat. Mater., 2008, 7, 845–854 CrossRef CAS PubMed.
- D. Wei, M. R. J. Scherer, C. Bower, P. Andrew, T. Ryhänen and U. Steiner, A nanostructured electrochromic supercapacitor, Nano Lett., 2012, 12, 1857–1862 CrossRef CAS PubMed.
-
B. Conway, Electrochemical supercapacitors: scientific fundamentals and technological applications, Springer Science & Business Media, 2013 Search PubMed.
- H. Chen, T. Cong, W. Yang, C. Tan, Y. Li and Y. Ding, Progress in electrical energy storage system: a critical review, Prog. Natl. Sci., 2009, 19, 291–312 CrossRef CAS.
- A. G. Pandolfo and A. F. Hollenkamp, Carbon properties and their role in supercapacitors, J. Power Sources, 2006, 157, 11–247 CrossRef CAS.
- S. Sarangapani, B. V. Tilak and C. P. Chen, Materials for electrochemical capacitors: theoretical and experimental constraints, J. Electrochem. Soc., 1996, 143, 3791–3799 CrossRef CAS.
- A. Dhakal, F. A. Perez and S. R. Mishra, Synergetic effect towards high electrochemical performance in LaMnO3–Co3O4 composites, Energy Adv., 2025, 4, 162–175 RSC.
- S. Rudra, K. Janani, G. Thamizharasan, M. Pradhan, B. Rani, N. K. Sahu and A. K. Nayak, Fabrication of Mn3O4–WO3 nanoparticles based nanocomposites symmetric supercapacitor device for enhanced energy storage performance under neutral, Electrochim. Acta, 2022, 406, 139870 CrossRef CAS.
- J. Chmiola, G. Yushin, Y. Gogotsi, C. Portet, P. Simon and P. L. Taberna, Anomalous increase in carbon capacitance at pore sizes less than 1 nanometer, Science, 2006, 313, 1760–1763 CrossRef CAS PubMed.
- R. Kötz and M. Carlen, Principles and applications of electrochemical capacitors, Electrochim. Acta, 2000, 45, 2483–2498 CrossRef.
- B. E. Conway, V. Birss and J. Wojtowicz, The role and utilization of pseudocapacitance for energy storage by supercapacitors, J. Power Sources, 1997, 66, 1–14 CrossRef CAS.
- Y. Jiang and J. Liu, Definitions of pseudocapacitive materials: a brief review, Energy Environm. Mater., 2019, 2, 30–37 CrossRef.
- J. P. Zheng, P. J. Cygan and T. R. Jow, Hydrous ruthenium oxide as an electrode material for electrochemical capacitors, J. Electrochem. Soc., 1995, 142, 2699–2703 CrossRef CAS.
- A. Dhakal, F. A. Perez, S. Karna and S. R. Mishra, LaMnO3–Mn3O4 nanocomposite: Synergetic effect towards high electrochemical performance, J. Alloys Compd., 2024, 1008, 176262 CrossRef CAS.
- H. Y. Lee, S. W. Kim and H. Y. Lee, Expansion of active site area and improvement of kinetic reversibility in electrochemical pseudocapacitor electrode, Electrochem. Solid-State Lett., 2001, 4, A19 CrossRef CAS.
- A. L. M. Reddy, M. M. Shaijumon, S. R. Gowda and P. M. Ajayan, Multisegmented Au–MnO2/Carbon Nanotube Hybrid Coaxial Arrays for High-Power Supercapacitor Applications, J. Phys. Chem. C, 2010, 114, 658–663 CrossRef CAS.
- S. C. Pang, M. A. Anderson and T. W. Chapman, Novel electrode materials for thin-film ultracapacitors: comparison of electrochemical properties of sol–gel-derived and electrodeposited manganese dioxide, J. Electrochem. Soc., 2000, 147, 444 CrossRef CAS.
- W. Li, J. Shao, Q. Liu, X. Liu, X. Zhou and J. H. E. Acta,
et al., Facile synthesis of porous Mn2O3 nanocubics for high-rate supercapacitors, Electrochim. Acta, 2015, 157, 108–114 CrossRef CAS.
- Z. Y. Li, M. S. Akhtar, P. T. M. Bui and O. B. Yang, Predominance of two dimensional (2D) Mn2O3 nanowalls thin film for high performance electrochemical supercapacitors, Chem. Eng. J., 2017, 330, 1240–1247 CrossRef CAS.
- R. N. Reddy and R. G. Reddy, Synthesis and electrochemical characterization of amorphous MnO2 electrochemical capacitor electrode material, J. Power Sources, 2004, 132, 315–320 CrossRef CAS.
- A. Dhakal, F. A. Perez and S. R. Mishra, Electrochemical assessment of tailored Mn2O3 cuboidal hierarchical particles prepared using urea and Piperazine, Electrochim. Acta, 2024, 507, 145169 CrossRef CAS.
- K. Xu, Nonaqueous liquid electrolytes for lithium-based rechargeable batteries, Chem. Rev., 2004, 104, 4303–4317 CrossRef CAS PubMed.
- Y. Fang, Y. Huang, S. Zhang, W. Jia, X. Wang, Y. Guo, D. Jia and L. Wang, Synthesis of unique hierarchical mesoporous layered-cube Mn2O3 by dual-solvent for high-capacity anode material of lithium-ion batteries, Chem. Eng. J., 2017, 315, 583–590 CrossRef CAS.
- N. F. M. Yusoff, N. H. Idris, M. F. M. Din, S. R. Majid, N. A. Harun and M. M. Rahman, Investigation on the Electrochemical Performances of Mn2O3 as a Potential Anode for Na-Ion Batteries, Sci. Rep., 2020, 10, 9207 CrossRef CAS PubMed.
-
D. Lide, CRC handbook of chemistry and physics: a ready-reference book of chemical and physical data, 1995 Search PubMed.
- V. D. Mote, Y. P. Purushotham and B. N. Dole, Williamson–Hall analysis in estimation of lattice strain in nanometer-sized ZnO particles, J. Theor. Appl. Phys., 2012, 6, 1–8 CrossRef.
- A. Cihan, P. Zarzycki and Z. Hao, Surface Hydroxylation-Induced Electrostatic Forces Thicken Water Films on Quartz, Langmuir, 2024, 40, 15099–15106 CrossRef CAS PubMed.
- S. Y. Park and A. K. Bera, Maximum entropy autoregressive conditional heteroskedasticity model, J. Econometrics, 2009, 150, 219–230 CrossRef.
- R. Bardestani, G. S. Patience and S. Kaliaguine, Experimental methods in chemical engineering: specific surface area and pore size distribution measurements—BET, BJH, and DFT, Can. J. Chem. Eng., 2019, 97, 2781–2791 CrossRef CAS.
- H. W. Nesbitt and D. Banerjee, Interpretation of XPS Mn(2p) spectra of Mn oxyhydroxides and constraints on the mechanism of MnO2 precipitation, Am. Miner., 1998, 83, 305–315 CrossRef CAS.
- W. Lu, Y. Li, M. Yang, X. Jiang, Y. Zhang and Y. Xing, Construction of Hierarchical Mn2O3@MnO2 Core–Shell Nanofibers for Enhanced Performance Supercapacitor Electrodes, ACS Appl. Energy Mater., 2020, 3, 8190–8197 CrossRef CAS.
- J. X. Flores-Lasluisa, F. Huerta, D. Cazorla-Amorós and E. Morallon, Manganese oxides/LaMnO3 perovskite materials and their application in the oxygen reduction reaction, Energy, 2022, 247, 123456 CrossRef CAS.
- M. A. Langell, C. W. Hutchings, G. A. Carson and M. H. Nassir, High resolution electron energy loss spectroscopy of MnO(100) and oxidized MnO(100), J. Vac. Sci. Technol., A, 1996, 3, 1656–1661 CrossRef.
- H. B. Li, M. H. Yu, F. X. Wang, P. Liu, Y. Liang and J. Xiao,
et al., Amorphous nickel hydroxide nanospheres with ultrahigh capacitance and energy density as electrochemical pseudocapacitor materials, Nat. Commun., 2013, 4, 1894 CrossRef CAS PubMed.
- L. Fan, L. Tang, H. Gong, Z. Yao and R. Guo, Carbon-nanoparticles encapsulated in hollow nickel oxides for supercapacitor application, J. Mater. Chem., 2012, 22, 16376–16381 RSC.
- Z. Fang, S. ur Rehman, M. Sun, Y. Yuan, S. Jin and H. Bi, Hybrid NiO–CuO mesoporous nanowire array with abundant oxygen vacancies and a hollow structure as a high-performance asymmetric supercapacitor, J. Mater. Chem. A, 2018, 6, 21131–21142 RSC.
- Q. T. Qu, B. Wang, L. C. Yang, Y. Shi, S. Tian and Y. P. Wu, Study on electrochemical performance of activated carbon in aqueous Li2SO4, Na2SO4 and K2SO4 electrolytes, Electrochem. Commun., 2008, 10, 1652–1655 CrossRef CAS.
- V. Srinivasan and J. W. Weidner, Studies on the capacitance of nickel oxide films: effect of heating temperature and electrolyte concentration, J. Electrochem. Soc., 2000, 147, 880 CrossRef CAS.
- P. Y. Chen, A. Adomkevicius, Y. T. Lu, S. C. Lin, Y. H. Tu and C. C. Hu, The ultrahigh-rate performance of alkali ion-pre-intercalated manganese oxides in aqueous Li2SO4, Na2SO4, K2SO4 and MgSO4 electrolytes, J. Electrochem. Soc., 2019, 166, A1875–A1883 CrossRef CAS.
- T. Brezesinski, J. Wang, S. H. Tolbert and B. Dunn, Ordered mesoporous α-MoO3 with iso-oriented nanocrystalline walls for thin-film pseudocapacitors, Nat. Mater., 2010, 9, 146–151 CrossRef CAS PubMed.
- R. S. Nicholson, Theory and application of cyclic voltammetry for measurement of electrode reaction kinetics, Anal. Chem., 1965, 37, 1351–1355 CrossRef CAS.
- T. C. Liu, W. G. Pell, B. E. Conway and S. L. Roberson, Behavior of molybdenum nitrides as materials for electrochemical capacitors: comparison with ruthenium oxide, J. Electrochem. Soc., 1998, 145, 1882–1888 CrossRef CAS.
- H. Wu, X. Wang, L. Jiang, C. Wu, Q. Zhao, X. Liu, B. Hu and L. Yi, The effects of electrolyte on the supercapacitive performance of activated calcium carbide-derived carbon, J. Power Sources, 2013, 226, 202–209 CrossRef CAS.
- B. Pal, S. Yang, S. Ramesh, V. Thangadurai and R. Jose, Electrolyte selection for supercapacitive devices: a critical review, Nanoscale Adv., 2019, 1, 3807–3835 RSC.
- Y. U. Jeong and A. Manthiram, Nanocrystalline manganese oxides for electrochemical capacitors with neutral electrolytes, J. Electrochem. Soc., 2002, 149, A1419 CrossRef CAS.
- Y. Wang, Y. Song and Y. Xia, Electrochemical capacitors: mechanism, materials, systems, characterization and applications, Chem. Soc. Rev., 2016, 45, 5925 RSC.
-
A. Bard, L. Faulkner and H. White, Electrochemical methods: fundamentals and applications, John Wiley & Sons, 2022 Search PubMed.
- Z. Chang, Y. Yang, M. Li, X. Wang and Y. Wu, Green energy storage chemistries based on neutral aqueous electrolytes, J. Mater. Chem. A, 2014, 2, 10739–10755 RSC.
- Y. H. Son, P. T. M. Bui, H. R. Lee, M. S. Akhtar, D. K. Shah and O. B. Yang, A Rapid Synthesis of Mesoporous Mn2O3 Nanoparticles for Supercapacitor Applications, Coatings, 2019, 9, 631 CrossRef.
- X. Chen, L. Li, X. Wang, K. Xie and Y. Wang, Effect of manganese valence on specific capacitance in supercapacitors of manganese oxide microspheres, Chem. – Eur. J., 2021, 27, 9152–9159 CrossRef CAS PubMed.
- M. S. Javed, H. U. Shah, N. Shaheen, R. Lin, M. Qiu, J. Xie, J. Li, R. Raza, W. Mai and C. Hu, High energy density hybrid supercapacitor based on 3D mesoporous cuboidal Mn2O3 and MOF-derived porous carbon polyhedrons, Electrochim. Acta, 2018, 282, 1–9 CrossRef CAS.
- X. Wang, L. Liu, X. Wang, L. Yi, C. Hu and X. Zhang, Mn2O3/carbon aerogel microbead composites synthesized by in situ coating method for supercapacitors, Mater. Sci. Eng., B, 2011, 176, 1234–1238 Search PubMed.
- M. S. Kolathodi, S. N. H. Rao, T. S. Natarajan and G. Singh, Beaded manganese oxide (Mn2O3) nanofibers: preparation and application for capacitive energy storage, J. Mater. Chem. A, 2016, 4, 7883–7891 RSC.
- S. Maiti, A. Pramanik and S. Mahanty, Electrochemical energy storage in Mn2O3 porous nanobars derived from morphology-conserved transformation of benzenetricarboxylate-bridged metal–organic, CrystEngComm, 2016, 1–3 Search PubMed.
- J. Liang, L. T. Bu, W. G. Cao, T. Chen and Y. C. Cao, Facile fabrication of coaxial-cable like Mn2O3 nanofiber by electrospinning: application as electrode material for supercapacitor, J. Taiwan Inst. Chem. Eng., 2016, 65, 584–590 CrossRef CAS.
- L. L. Zhang, T. Wei, W. Wang and X. S. Zhao, Manganese oxide–carbon composite as supercapacitor electrode materials, Microporous Mesoporous Mater., 2009, 123, 260–267 CrossRef CAS.
- M. E. Orazem and B. Tribollet, Electrochemical impedance spectroscopy, New Jersey, 2008, 1, 383–389 Search PubMed.
- B.-Y. Chang and S.-M. Park, Electrochemical impedance spectroscopy, Ann. Rev. Anal. Chem., 2010, 3, 207–229 CrossRef CAS PubMed.
- J. B. Jorcin, M. E. Orazem, N. Pébère and B. Tribollet, CPE analysis by local electrochemical impedance spectroscopy, Electrochim. Acta, 2006, 51, 1473–1479 CrossRef CAS.
- J. Zhi, Y. Wang, S. Deng and A. Hu, Study on the relation between pore size and supercapacitance in mesoporous carbon electrodes with silica-supported carbon nanomembranes, RSC Adv., 2014, 4, 40296–40300 RSC.
- R. Wang, Q. Li, L. Cheng, H. Li, B. Wang, X. S. Zhao and P. Guo, Electrochemical properties of manganese ferrite-based supercapacitors in aqueous electrolyte: the effect of ionic radius, Colloids Surf., A, 2014, 457, 94–99 CrossRef CAS.
- M. M. Vadiyar, S. C. Bhise, S. K. Patil, S. S. Kolekar, J. Y. Chang and A. V. Ghule, Comparative Study of Individual and Mixed Aqueous Electrolytes with ZnFe2O4 Nano–flakes Thin Film as an Electrode for Supercapacitor Application, ChemistrySelect, 2016, 1, 959–966 CrossRef CAS.
- P. C. Ho, D. A. Palmer and R. H. Wood, Conductivity measurements of dilute aqueous LiOH, NaOH, and KOH solutions to high temperatures and pressures using a flow-through cell, J. Phys. Chem. B, 2000, 104, 12084–12089 CrossRef CAS.
- K. Fic, A. Platek, J. Piwek and E. Frackowiak, Sustainable materials for electrochemical capacitors, Mater. Today, 2018, 21, 437–454 CrossRef CAS.
|
| This journal is © The Royal Society of Chemistry 2025 |
Click here to see how this site uses Cookies. View our privacy policy here. 
 Open Access Article
 This Open Access Article is licensed under a Creative Commons Attribution-Non Commercial 3.0 Unported Licence
 *a,
Felio
Perez
b and
Sanjay R
Mishra
*a
*a,
Felio
Perez
b and
Sanjay R
Mishra
*a


 . The CE values are almost 100% for the electrode for every electrolyte used until 5000 cycles. The Csp and energy density are higher in our work than in previously reported electrodes, as presented in Table 5. The inset in Fig. 18 shows that Mn2O3-9 has a higher Coulombic efficiency in NaOH, NaNO3, and Na2SO4 than KOH electrolytes, which might be because Na+ ions are smaller than K+ ions. The smaller the ions, the more efficiently they can migrate through the electrolyte and participate in the electrochemical reactions.51
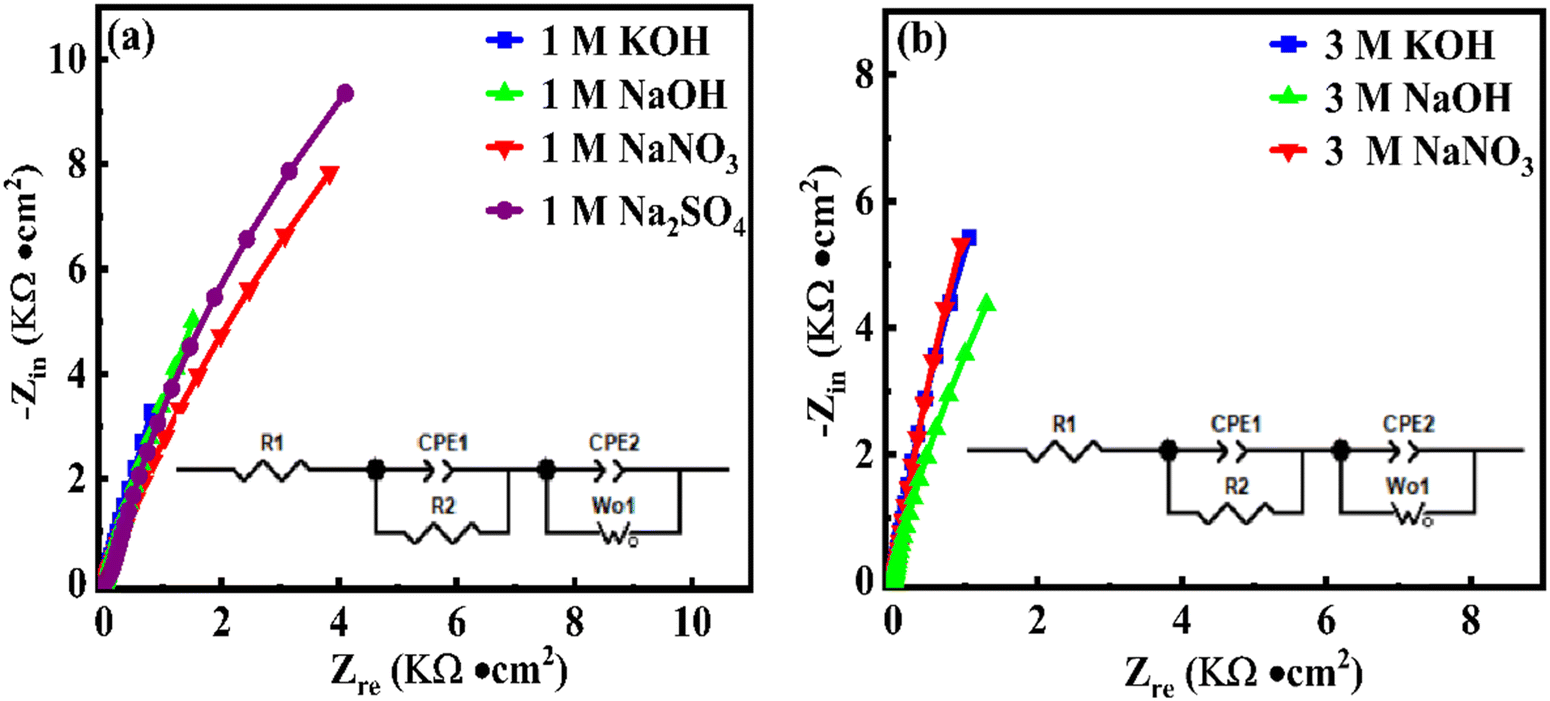
 where Q (Ω−1 sα) is the CPE parameter and α is the CPE exponent. The exponent α (0 ≤ α ≤ 1) indicates the deviation from ideal capacitive behavior. The CPE behaves as a capacitor for α = 1, a resistor for α = 0, an inductor for α = −1, and the Warburg impedance for α = 0.5.62 This result indicates that the NaOH electrolyte exhibits better conductivity for Mn2O3-9.