Size-dependent upconversion luminescence and temperature sensing behavior of spherical Gd2O3:Yb3+/Er3+ phosphor
Yue Tian*a,
Bining Tianb,
Cai'e Cuia,
Ping Huanga,
Lei Wanga and
Baojiu Chen*b
aKey Lab of Advanced Transducers and Intelligent Control System of Ministry of Education, College of Physics and Optoelectronics, Taiyuan University of Technology, Taiyuan 030024, PR China. E-mail: tianyue@tyut.edu.cn; Tel: +86-351-6018030
bDepartment of Physics, Dalian Maritime University, Dalian, Liaoning 116026, PR China. E-mail: chenmbj@sohu.com; Fax: +86-411-84728909; Tel: +86-411-84728909
First published on 22nd January 2015
Abstract
Yb3+/Er3+ codoped spherical Gd2O3 phosphors with different particle sizes were prepared via a urea-assisted homogeneous precipitation process by adjusting the molar ratio of rare earth ions and urea followed by annealing at high temperature. The phases, morphologies, and luminescence properties of the as-prepared samples were characterized by X-ray diffraction (XRD), field emission scanning electron microscopy (FE-SEM), and upconversion luminescence (UCL) spectra, respectively. The spherical Gd2O3:Yb3+/Er3+ phosphors showed size-dependent upconversion luminescence properties under the excitation of 980 nm-laser. The temperature sensing behavior of spherical Gd2O3:Yb3+/Er3+ phosphors with different particle sizes was studied based on the change of emission intensities from two thermally coupled 2H11/2 and 4S3/2 levels. It is interesting to observe that the sensing sensitivity of the sample increases with decreasing particle size and a sensitivity of 84 × 10−4 K−1 was obtained for the sample with a particle size of 45 nm. Finally, Judd–Ofelt theory was used for explaining and predicting the effect of particle size on sensing sensitivity.
1. Introduction
Upconversion luminescence (UCL), where a low frequency excitation phonon can be converted into a high frequency emission one, has attracted considerable interest during the past decade due to its potential applications in three-dimensional displays, solid state lasers, biomedicine, clean energy, etc.1–5 Rare earth ions (RE3+) are often employed as UCL centers because of their unique optical properties originating from the intra-4f transitions which are barely affected by external crystal fields since the electrons in the 4f orbital are shielded by the filled outer 5s and 5p orbitals. Among these RE3+ ions, Er3+ ion, which has a rich and ladder-like electronic energy level structure, is a very excellent candidate for UCL. Unfortunately, the absorption cross section of Er3+ is narrow in the infrared region, leading to a lower luminescent efficiency in Er3+ single doped materials. In order to get over this shortcoming, another RE3+ ion, Yb3+ is commonly used as a sensitizer in UCL to harvest pumping photons and subsequently promote neighboring activator ions to excited states because of its peculiar characteristics including the simple two-level structure of Yb3+ which ensures a high quenching concentration, large absorption cross-section of Yb3+ at 980 nm leading to efficient absorption of pumping energy and large spectral overlap between Yb3+ emission (2F5/2 → 2F7/2) and Er3+ absorption (4I15/2 → 5I11/2) driving efficient energy transfer (ET) from Yb3+ to Er3+.6–8 Besides sensitizers, UCL of Er3+ ions is also strongly dependent on other factors, such as particle size, doping concentration, temperature, pumping power, and so on.9–12 However, hitherto, the illustration of the influence of particle size on UCL is not clear enough due to the obstacle in preparation of materials with a uniform size. Therefore, further work is still necessary to prepare suitable samples and study their UCL properties in detail, because it is beneficial to understand the complex size-dependent UCL mechanism in Yb3+/Er3+ codoped inorganic materials.Optical thermometry based on the fluorescence of RE3+ ions has gained extensive attention in recent years because it can provide a non-contact temperature measurement via probing the dependence of fluorescence intensities on ambient temperature.13 Compared with conventional temperature monitoring devices, fluorescence based optical temperature sensors do not affect the temperature field and are particularly advantageous operating in electromagnetically and/or thermally harsh environments, such as at electrical power stations, near high power electric transmission lines, and remote temperature detection in buildings on fire. As an optical thermometry method, the fluorescence intensity ratio (FIR) technique is based on the measurement of fluorescence intensities from two thermally coupled levels of one RE3+ ion, which is independent of spectral losses and fluctuations in the excitation intensity, consequently leading to a much higher accuracy.13 The 2H11/2 and 4S3/2 levels of Er3+ ion are thermally coupled and the optical thermometry based on these two green UC emissions have been widely reported in various materials including powder phosphors and glasses.14–17 However, the sensitivity based on Er3+-doped materials is not still high enough for the practical application. To improve the sensitivity, choosing proper host materials is being considered as a promising approach for achieving this goal now.16 To the best our knowledge, however, the effect of the particle size on the sensing sensitivity based on FIR technique has not been paid attention yet.
Herein, we prepared spherical Yb3+, Er3+ codoped Gd2O3 phosphors with different particle sizes via a urea-assisted homogeneous precipitation process by controlling the molar ratio of RE3+ ions and urea in the solution. The size-dependent UCL and optical temperature sensing behavior were studied. Increased sensing sensitivity is observed as the particle size of sample decreased, which is attributed to the highly disordered local symmetry environment around Er3+ in Gd2O3 phosphor with smaller particle size. This paper will provide an efficient approach to improve the sensitivity of optical thermometry system based on the FIR technique.
2. Experimental section
2.1 Materials
The rare earth oxides RE2O3 (99.99%, Ln = Eu, La, Nd, Sm) and urea were purchased from Aladdin Chemical Reagent Factory (China). All chemicals are of analytical grade and used directly without further purification in this work. Gd(NO3)3·6H2O, Yb(NO3)3·6H2O and Er(NO3)3·6H2O powders were obtained by dissolving the corresponding rare earth oxide in 6 mol L−1 of nitric acid and re-crystallizing four times.2.2 Synthesis of spherical Gd2O3:Yb3+, Er3+ phosphors
Spherical Gd2O3:Yb3+, Er3+ phosphors were prepared via a simple urea-assisted homogenous precipitation process. In a typical synthesis procedure, 1.86 mmol of Gd(NO3)3·6H2O, 0.1 mmol of Yb(NO3)3·6H2O and 0.04 mmol of Er(NO3)3·6H2O (molar ratio of Gd, Yb and Er is 93![[thin space (1/6-em)]](https://www.rsc.org/images/entities/char_2009.gif) :
:![[thin space (1/6-em)]](https://www.rsc.org/images/entities/char_2009.gif) 5
5![[thin space (1/6-em)]](https://www.rsc.org/images/entities/char_2009.gif) :
:![[thin space (1/6-em)]](https://www.rsc.org/images/entities/char_2009.gif) 2) were dissolved in 150 mL of distilled water to form transparent aqueous solution in a three-necked flask under vigorously stirring. Then 50 mL of urea aqueous solution (molar ratio of urea and RE3+ ions is 30) was dropped in the above rare earth nitrates solution slowly under magnetically stirring. Keeping stirring for 15 min, the obtained solution was heated at 90 °C for 2 h. As the three-necked flask cooled to room temperature naturally, the white precipitation was directly separated by centrifugation, and washed several times with absolute ethanol and distilled water in sequence, and finally vacuum-dried at 80 °C for 6 h. Finally, the as-prepared amorphous sample was calcined at 850 °C for 2 h in muffle furnace to obtain the Gd2O3:5 mol% Yb3+, 2 mol% Er3+ phosphor. Herein, the molar ratio of urea and RE3+ ions in aqueous solution is an important factor that can influence the particle size of product greatly. Therefore, different molar ratios of urea and RE3+ ions were used to control the particle sizes of the samples in this work.
2) were dissolved in 150 mL of distilled water to form transparent aqueous solution in a three-necked flask under vigorously stirring. Then 50 mL of urea aqueous solution (molar ratio of urea and RE3+ ions is 30) was dropped in the above rare earth nitrates solution slowly under magnetically stirring. Keeping stirring for 15 min, the obtained solution was heated at 90 °C for 2 h. As the three-necked flask cooled to room temperature naturally, the white precipitation was directly separated by centrifugation, and washed several times with absolute ethanol and distilled water in sequence, and finally vacuum-dried at 80 °C for 6 h. Finally, the as-prepared amorphous sample was calcined at 850 °C for 2 h in muffle furnace to obtain the Gd2O3:5 mol% Yb3+, 2 mol% Er3+ phosphor. Herein, the molar ratio of urea and RE3+ ions in aqueous solution is an important factor that can influence the particle size of product greatly. Therefore, different molar ratios of urea and RE3+ ions were used to control the particle sizes of the samples in this work.
2.3 Characterization
X-ray powder diffraction (XRD) of the prepared samples was measured by a Shimadzu XRD-6000 diffractometer with CuKα1 radiation (λ = 0.15406 nm). The XRD data were collected by using a scanning mode in the 2θ ranging from 15° to 60° with a scanning step size of 0.02° and a scanning rate of 2.0° min−1. The morphologies of the samples were observed by means of a field emission scanning electron microscopy (FE-SEM, Japan, Hitachi, S-4800). The upconversion spectra were recorded on a fluorescence spectrophotometer (Hitachi F-4600, Japan) equipped with a power-tunable 980 nm optical fiber laser (4 W, BWT KS3-11312, BWT Beijing Ltd, China) as excitation source. The upconversion spectra for all the obtained samples were measured under the same condition. A homemade temperature control system was used to measure temperature-dependent upconversion emission spectra from 25 to 450 °C, in which the measuring and controlling accuracy of the temperature is about ±0.5 °C.3. Results and discussion
3.1 Structure and morphology of products
Fig. 1a shows the XRD patterns of the annealed Gd2O3:5 mol% Yb3+, 2 mmol% Er3+ phosphors prepared with different urea/RE3+ molar ratios. It can be observed that all the diffraction peak positions of the studied samples are in good agreements with the International Center for Diffraction data (ICDD) for cubic Gd2O3 crystal reported in the PDF card no. 86-2477, as shown in Fig. 1a. No other impurity peaks can be found from the XRD patterns, which indicates that the annealed samples are pure and Yb3+ and Er3+ ions have incorporated into the Gd2O3 host lattices successfully. In addition, as shown in the insert of Fig. 1a, the obvious broadening of diffraction peaks can be found with the increase of urea/RE3+ molar ratio, which implies that the particles size of sample would decrease with the increase of urea/RE3+ molar ratio. In order to further inspect the morphology and particle size of the annealed samples, the FE-SEM measurement was carried out and typical FE-SEM images are shown in Fig. 1(b–d). It is clear that the nearly monodispersed and uniform spherical Gd2O3:Yb3+, Er3+ particles with high yield can be obtained via urea-assisted homogeneous precipitation. Furthermore, we can see that with the increase of the molar ratio of urea/RE3+, the particle size of resultant Gd2O3 phosphor decreases obviously. As can be seen from Fig. 1(b–d), the average particle size of the as-prepared Gd2O3:Yb3+/Er3+ phosphors is about 200, 95, and 45 nm when the molar ratio of urea/RE3+ is 30, 300 and 1500, respectively.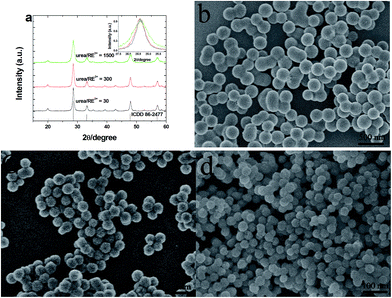 | ||
| Fig. 1 XRD patterns (a) and FE-SEM images (b–d) of the annealed Gd2O3:Yb3+, Er3+ prepared with different urea/RE3+ molar ratios. (b) 30, (c) 300 and (d) 1500. | ||
3.2 Size-dependent upconversion luminescence
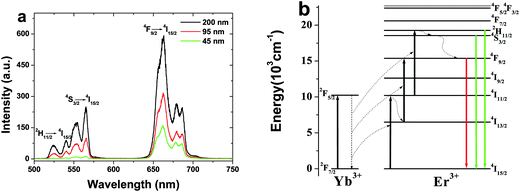
UCL spectra of spherical Gd2O3:5 mol% Yb3+, 2 mol% Er3+ phosphors with different sizes under the excitation of a 980 nm optical fiber laser with the power density of 10 W cm−2 are shown in Fig. 2a. We can clearly find the two emission bands in green (500–575 nm) and red (625–700 nm) regions for all the samples, which correspond to the 2H11/2, 4S3/2 → 4I15/2 and 4F9/2 → 4I15/2 transitions of Er3+ ions, respectively.7,8 Moreover, the red emission of 4F9/2 → 4I15/2 is dominant for all the samples. With increasing the particle size, the UCL intensity increases obviously. It should be also noted that the intensity ratio of the green to red decreases dramatically from 0.39 to 0.09 with decreasing particle size. The above results can be mainly attributed to the surface effect and the specific explanations will be given in the following sections.10Fig. 2b shows the energy level diagrams of Yb3+ and Er3+ ions as well as the possible UC pathways in the Gd2O3 phosphor under the excitation of 980 nm.18 When the samples are excited by 980 nm optical fiber laser, Er3+ ions on the ground state (4I15/2) are excited to 4I11/2 via the ground state absorption (GSA) and/or energy transfer (ET) of Yb3+ → Er3+ firstly. Then a part of excited electrons on the 4I11/2 level will be further excited from the 4I11/2 to the 2H11/2 levels by excited state absorption (ESA) or the second-step ET of Yb3+ → Er3+. Finally, the electrons relax to 4S3/2, 2H11/2, generating green 4S3/2, 2H11/2 → 4I15/2 transitions. For the red upconversion emission, two possible routes are involved for populating the 4F9/2 level. One is that, after populating the 4I11/2 level, the other part of excited electrons will relax to 4I13/2 besides being exited to the 2H11/2 level. Then they are further excited into the 4F9/2 level, generating red 4F9/2 → 4I15/2 transition. The other is that the nonradiative relaxation from the green 4S3/2, 2H11/2 level to the 4F9/2 level. For both nonradiative relaxation channels to population the 4F9/2 level, the energy gaps are 3500 and 2000 cm−1, which can be bridged easily by the groups with large phonon energy (OH−, CO32−, etc.). Therefore, as the particle size decreases, a number of surface defects with available large vibrational modes such as CO32− and OH− are involved because of the increase of the ratio of surface to volume, which results in the increase of nonradiative relaxation channels of 4I11/2 → 4I13/2 and 4S3/2, 2H11/2 → 4F9/2. Consequently, the red upconversion emission intensity increases. It should be also noted that as the doping concentration is high enough, cross-relaxation of 4F7/2 + 4I11/2 → 4F9/2 + 4F9/2 also occurs significantly, leading to the relative increase of the red emission.
To understand the UC mechanism, the pumping power dependences of the green (2H11/2/4S3/2 → 4I15/2) and red (4F9/2 → 4I15/2) emissions were studied, as shown in Fig. 3. For any unsaturated UC process, it is well known that the visible emission intensity, Iv increases proportionally to the pumping power (P) of the infrared excitation resource, which can be expressed as18,19
| Iv ∝ Pn | (1) |
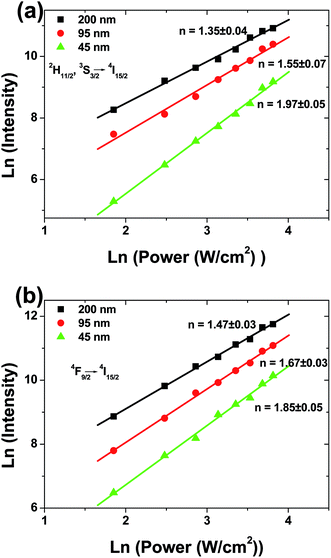 | ||
| Fig. 3 Dependence of UCL intensity on laser power in spherical Gd2O3:Yb3+, Er3+ phosphors with different particle sizes. (a) green emissions, (b) red emission. | ||
3.3 Tunable temperature sensing behavior
The dependence of green emissions on temperature was obtained for the 2 mol% Er3+/5 mol% Yb3+ co-doped Gd2O3 phosphors with different particle sizes in the temperature range between 298 and 723 K. Fig. 4 shows the upconversion emission spectra of the sample with particle size of 45 nm at 298, 423 and 723 K under the excitation with the power density of 10 W cm−2 that include two green emission bands corresponding to the 4S3/2 → 4I15/2, and 2H11/2 → 4I15/2 transitions of Er3+ ions. It can be found that with the increase of the sample temperature, the intensity of two bands changed in the reverse way while the band positions were unchanged. At room temperature (298 K) the intensity corresponding to the 2H11/2 → 4I15/2 transition was very low in comparison to that of the 4S3/2 → 4I15/2 transition while at the higher temperature (723 K) a reverse effect was observed. Therefore, this leads to a great change on fluorescence intensity ratio of these two green emissions (RHS) as a function of temperature.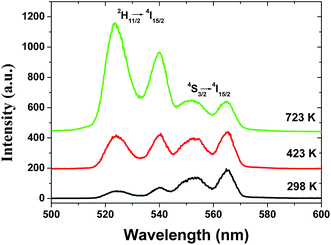 | ||
| Fig. 4 UC green emission spectra of spherical Gd2O3:Yb3+, Er3+ phosphor with the particle size of 45 nm at 298, 423 and 723 K. | ||
In the case of the Er3+ ions, the 2H11/2 and 4S3/2 levels are close to each other (∼770 cm−1).18 The relatively small energy separation allows that the 2H11/2 level can be populated from 4S3/2 level by thermal excitation. Therefore these two levels are thermally coupled and their population follows a Boltzmann type population distribution, which would lead to the variation in the intensities of 2H11/2 → 4I15/2 and 4S3/2 → 4I15/2 of Er3+ at the elevated temperature.16 Therefore, the FIR of the fluorescence arising from the 2H11/2 and 4S3/2 levels to the ground state of Er3+ can be used for the temperature sensor by using the following formula21,22
 | (2) |
 | (3) |
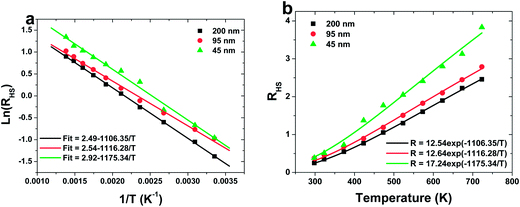
Fig. 5a shows a monolog plot of the FIR of green upconversion emissions from the 2H11/2 and 4S3/2 levels as a function of inverse absolute temperature in the range of 298–723 K. The slope (−ΔE/k) is a very important parameter to judge the optical temperature sensing ability of RE doped materials. The experimental data are fitted to straight line with the slopes (−ΔE/k) of about −1106.35, −1116.28 and −1175.34 for 200, 95 and 45 nm sized sample, respectively. The fluorescence intensity ratio of green UC emissions from the 2H11/2 and 4S3/2 levels relative to the temperature T in range of 298–723 K is shown in Fig. 5b. The coefficient C is obtained by fitting curve of the experimental data.
The rate at which FIR changes with a change in temperature is called sensor sensitivity, which shows the sensing ability of the sensing material and can be defined as16
 | (4) |
The sensor sensitivity of all the samples as a function of the temperature is shown in Fig. 6. It can be seen that the sensitivity increases dramatically with the decreasing the particle size of sample. A sensitivity of 0.0084 K−1 at 570 K can be achieved when the particle size of sample is 45 nm, which is much value found in the Er3+ doped materials by far. Moreover, keeping increasing the temperature, the sensitivity changes slightly, which suggests a excellent sensing stability.
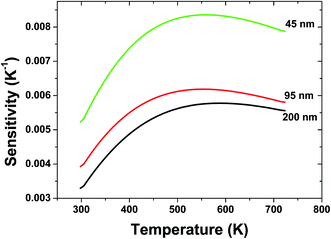 | ||
| Fig. 6 Relative sensitivity of spherical Gd2O3:Yb3+, Er3+ phosphors with different particle sizes for optical thermometry as a function of temperature. | ||
3.4 J–O analysis
In order further analyze the effect of particle size on sensing sensitivity, the Judd–Ofelt (J–O) theory was used. According to J–O theory, the radiative transition probability, AJ–J′ from the level J to level J′, can be gotten from following equation23,24
 | (5) |
 | (6) |
 | (7) |
From the eqn (7) it can be concluded that, therefore, the sensor sensitivity is determined by Ωλ (λ = 2, 4, 6). The energy level of 4S3/2 has only one nonzero reduced matrix element of U6 and the energy level of 4H11/2 has not nonzero reduced matrix elements, but has a bigger U2. Transitions characterized by large values of the U2 matrix element are in general rather sensitive to the environment of the lanthanide ions and have been called as “hypersensitive” by Jorgensen and Judd.25 Therefore, Ω2 is more sensitive to the environments than others J–O parameters (Ω4 and Ω6). So S is mainly determined by Ω2. The Ω2 is strongly related to the hypersensitivity transitions and depends on short range effects, such as the covalency of the RE3+-ligand bond and/or local structural changes in the vicinity of the RE3+ ion.16 It is well known that the nanomaterials have much more disordered local symmetry environment than bulk because of existence of surface defects, which would result in crystal environment with lower symmetry and stronger covalency in nanomaterials.26–28 Therefore, Ω2 parameters for the RE3+ ions are noticeably higher for the nanocrystalline sample than in the bulk.28 Accordingly, the sensor sensitivity increases with decreasing the particle size of sample. From the above discussion, we can conclude that decreasing particle size of materials a promising approach to improve the sensing sensitivity of RE3+ ions doped materials.
4. Conclusion
In conclusion, a simple urea-assisted homogeneous precipitation route has been employed to prepare spherical Gd2O3:Yb3+, Er3+ phosphors with particle size of 200, 95 and 45 nm via adjusting the molar ratio of RE3+/urea followed by calcining at 850 °C. Under the excitation of 980 nm, the dominant red 4F9/2 → 4I15/2 emission of Er3+ was observed in these spherical Gd2O3:Yb3+, Er3+ phosphors as well as the weak green 2H11/2, 4S3/2 → 4I15/2 emissions. Moreover, with decreasing the particle sizes, both the total UCL intensities and the intensity ratios of green and red emissions decrease gradually, which are attributed to the surface effect. The optical temperature sensing behaviors based on the FIR technique from the thermally coupled 2H11/2, 4S3/2 levels in spherical Gd2O3:Yb3+, Er3+ phosphors with different particle sizes were also studied. It was found that the sensitivity increases with decreasing particle size. This is ascribed to more disordered local asymmetry environment in the smaller particles, which is confirmed by J–O theory. Therefore, this work will provide an efficient approach to improve the sensitivity of the optical thermometry based on the FIR technique.Acknowledgements
This work was partially supported by NSFC (National Natural Science Foundation of China, Grant nos. 11374044 and 51302182), the Qualified Personnel Foundation of Taiyuan University of Technology (QPFT) (no: tyut-rc201361a) and the Program for the outstanding Innovative Teams of Higher Learning Institutions of Shanxi.References
- G. Y. Chen, H. L. Qiu, P. N. Prasad and X. Y. Chen, Chem. Rev., 2014, 114, 5161–5214 CrossRef CAS PubMed
.
- S. L. Gai, C. X. Li, P. P. Yang and J. Lin, Chem. Rev., 2014, 114, 2343–2389 CrossRef CAS PubMed
.
- T. R. Hinklin, S. C. Rand, R. M. Laine and R. M. Transpraent, Adv. Mater., 2008, 20, 1270–1273 CrossRef CAS
.
- L. Cheng, C. Wang and Z. Liu, Nanoscale, 2013, 1, 23–37 RSC
.
- Y. Y. Cheng, B. Furkhard, R. W. Macqueen, T. Khoury, R. G. C. R. Clady, T. F. Schulze, N. J. Daukes, M. J. Crossley, B. Stannowski, H. Lips and T. W. Schmidt, Energy Environ. Sci., 2012, 5, 6953–6959 CAS
.
- N. Menyuk, K. Dwight and J. W. Pierce, Appl. Phys. Lett., 1972, 21, 159 CrossRef CAS PubMed
.
- V. Mahalingam, C. Hazra, R. Naccache, F. Vetrone and J. A. Capobianco, J. Mater. Chem. C, 2013, 1, 6536–6540 RSC
.
- H. Dong, L. D. Sun and C. H. Yan, Nanoscale, 2013, 5, 5703–5714 RSC
.
- D. J. Gargas, E. M. Chan, A. D. Ostrowski, S. Aloni, M. V. P. Altoe, E. S. Barnard, B. Sanii, J. J. Urban, D. J. Milliron, B. E. Cohen and P. J. Schuck, Nat. Nanotechnol., 2014, 9, 300–305 CrossRef CAS PubMed
.
- F. Wang, J. Wang and X. G. Liu, Angew. Chem., Int. Ed., 2010, 49, 7456–7460 CrossRef CAS PubMed
.
- W. Yu, W. Xu, H. W. Song and S. Zhang, Dalton Trans., 2014, 43, 6139–6147 RSC
.
- K. Z. Zheng, W. Y. Song, C. J. Lv, Z. Y. Liu and W. P. Qin, CrystEngComm, 2014, 16, 4329–4337 RSC
.
- W. Xu, Z. G. Zhang and W. W. Cao, Opt. Lett., 2012, 37, 4865–4867 CrossRef CAS PubMed
.
- S. W. Hao, G. Y. Chen and C. H. Yang, Theranostics, 2013, 3, 331–345 CrossRef PubMed
.
- B. Dong, B. S. Cao, Y. Y. He, Z. Liu, Z. P. Li and Z. Q. Feng, Adv. Mater., 2012, 24, 1987–1993 CrossRef CAS PubMed
.
- S. F. Leon-Luis, U. R. Rodriguez-Mendoza, I. R. Martin, E. Lalla and V. Lavin, Sens. Actuators, B, 2013, 176, 1167–1175 CrossRef CAS PubMed
.
- N. Rakov and G. S. Maciel, Sens. Actuators, B, 2012, 164, 96–100 CrossRef CAS PubMed
.
- X. Bai, H. W. Song, G. H. Pan, Y. Q. Lei, T. Wang, X. G. Ren, S. Z. Lu, B. Dong and L. B. Fan, J. Phys. Chem. C, 2007, 111, 13611–16317 CAS
.
- Y. Tian, R. N. Hua, N. S. Yu, W. Zhang, L. Y. Na and B. J. Chen, J. Alloys Compd., 2011, 509, 9924–9929 CrossRef CAS PubMed
.
- M. Pollnau, D. R. Gamelin, S. R. Luthi, H. U. Gudel and M. P. Hehlen, Phys. Rev. B: Condens. Matter Mater. Phys., 2000, 61, 3337–3346 CrossRef CAS
.
- W. Xu, L. J. Gao, L. J. Zheng, P. Wang, Z. G. Zhang and W. W. Cao, Appl. Phys. Express, 2012, 5, 070021 Search PubMed
.
- B. Dong, D. P. Liu, X. J. Wang, T. Yang, S. M. Miao and C. R. Li, Appl. Phys. Lett., 2007, 90, 181117 CrossRef PubMed
.
- B. R. Judd, Phys. Rev., 1962, 127, 750–761 CrossRef CAS
.
- G. S. Ofelt, J. Chem. Phys., 1962, 37, 511–521 CrossRef CAS PubMed
.
- C. K. Jorgensen and B. R. Judd, Mol. Phys., 1964, 8, 281–290 CrossRef
.
- L. S. Yang, L. P. Li, M. L. Zhao and G. S. Li, Phys. Chem. Chem. Phys., 2012, 14, 9956–9965 RSC
.
- Z. G. Wei, L. D. Sun, C. S. Liao, J. L. Yin, X. C. Jiang, C. H. Yan and S. Z. Lu, J. Phys. Chem. B, 2002, 106, 10610–10617 CrossRef CAS
.
- J. C. Boyer, F. Vetrone, J. A. Capobianco, A. Speghini and M. Bettinelli, J. Phys. Chem. B, 2004, 108, 20137–20143 CrossRef CAS
.
| This journal is © The Royal Society of Chemistry 2015 |

