 Open Access Article
Creative Commons Attribution 3.0 Unported Licence
A deep conical agarose microwell array for adhesion independent three-dimensional cell culture and dynamic volume measurement†
Andreas R.
Thomsen
 *abc,
Christine
Aldrian
abc,
Peter
Bronsert
 bcde,
Yi
Thomann
f,
Norbert
Nanko
ac,
Nicolas
Melin
g,
Gerta
Rücker
 ch,
Marie
Follo
 ci,
Anca L.
Grosu
 abc,
Gabriele
Niedermann
 abc,
Paul G.
Layer
j,
Anja
Heselich
 k and
Per G.
Lund
 *ac
*ac
aDepartment of Radiation Oncology, Medical Center – University of Freiburg, Germany. E-mail: andreas.thomsen@uniklinik-freiburg.de; per.lund@uniklinik-freiburg.de
bGerman Cancer Consortium (DKTK), Partner Site Freiburg and German Cancer Research Center (DKFZ), Heidelberg, Germany
cFaculty of Medicine, University of Freiburg, Germany
dInstitute for Surgical Pathology, Medical Center – University of Freiburg, Germany
eComprehensive Cancer Center Freiburg, Medical Center – University of Freiburg, Germany
fFreiburg Material Research Center and Institute for Macromolecular Chemistry, Department of Chemistry, University of Freiburg, Germany
gVisceral and Transplantation Surgery, Department of Clinical Research, University of Bern, Switzerland
hInstitute for Medical Biometry and Statistics, Medical Center – University of Freiburg, Germany
iDepartment of Hematology/Oncology, Medical Center – University of Freiburg, Germany
jDevelopmental Biology & Neurogenetics, Faculty of Biology, Technical University of Darmstadt, Germany
kDepartment for Biophysics, GSI Helmholtz Center for Heavy Ion Research, Darmstadt, Germany
First published on 6th December 2017
Abstract
Multicellular spheroids represent a well-established 3D model to study healthy and diseased cells in vitro. The use of conventional 3D cell culture platforms for the generation of multicellular spheroids is limited to cell types that easily self-assemble into spheroids because less adhesive cells fail to form stable aggregates. A high-precision micromoulding technique developed in our laboratory produces deep conical agarose microwell arrays that allow the cultivation of uniform multicellular aggregates, irrespective of the spheroid formation capacity of the cells. Such hydrogel arrays warrant a steady nutrient supply for several weeks, permit live volumetric measurements to monitor cell growth, enable immunohistochemical staining, fluorescence-based microscopy, and facilitate immediate harvesting of cell aggregates. This system also allows co-cultures of two distinct cell types either in direct cell–cell contact or at a distance as the hydrogel permits diffusion of soluble compounds. Notably, we show that co-culture of a breast cancer cell line with bone marrow stromal cells enhances 3D growth of the cancer cells in this system.
Introduction
2D cell cultures are increasingly being replaced by 3D cultures, thereby approaching more in vivo-like conditions.1 Traditional cell culture is based on cell adhesion to surfaces, which does not reflect the physiological situation in tissues including cancer. A scaffold that supports cell adhesion represents a defined material which replaces the extracellular matrix (ECM) to approach a more tissue specific environment.2 In contrast, a scaffold-free 3D culture is based on the concept that suspended cells from cell lines or fresh tissues reform 3D-tissues or spheroids by self-assembly of single cells if adhesion to a substrate is prevented.3–5 These cells adhere only to each other or to ECM molecules secreted by the cells. Despite the simple arrangement in the first instance, spheroids develop complex interactions, such as extensive cell–cell-contacts and -communication, a zonal architecture with gradients in oxygen, nutrients and pH, and polymerisation and remodelling of ECM molecules.6,7Well-established methods to generate spheroids are spinner flasks, liquid overlays (LO) and the hanging drop (HD) technique.8–11 Indeed the HD and LO techniques yield equally sized spheroids, but it remains a challenge to generate several thousand equally sized cell aggregates.12,13 Therefore, micro-structured surfaces with multiple microwells at the bottom of one single culture vessel represent an important alternative approach.14 Agarose is a low-cost, transparent and non-toxic hydrogel, that is permeable to gas and small biomolecules. Cells do not adhere to agarose, thus it favours cell to cell adhesion. Flat bottom agarose microwells for 3D cell culture are useful for drug testing,15,16 whereas pyramid-shaped agarose microwells allow stem cell aggregation and embryonic body formation.17
The design of the microwell defines its applicability for 3D cell culture experiments. For example, the aspect ratio (diameter to depth) of the microwell impacts its cell culture performance. A low aspect ratio yielding shallow microwells facilitates the harvest of spheroids,17 while a high aspect ratio favours long-term culture.18 The geometry of the microwell determines cell aggregate formation.19 Although the use of cubical or cylindrical microwells is widespread in 3D cell culture, conical microwells enhance oxygen and medium delivery to cell aggregates.20 A flat bottom is prone to forming multiple cell aggregates per microwell,21 yet when a sufficiently high number of cells is seeded into a microwell single spheroid formation may be achieved.22 Indeed concave bottoms favour the growth of a single aggregate per microwell,23 are frequently applied to design microwell devices for 3D culture24 of different geometries25 and are increasingly available for high-throughput drug screening in 3D cultures26 commonly in 96- or 384-well formats. Recently, a 1536-well plate format based on hydrogel-coated polyethylene terephthalate was adapted to spheroid culture for testing large numbers of substances simultaneously.27
Spheroids are interesting models to address questions in cancer biology. In particular, the use of patient tumour-derived cells in 3D cultures is emerging as a platform for pre-clinical testing.28 However, a considerable fraction of cancer cell lines is disqualified from the currently available systems, as they fail to form spherical aggregates. As an example, only 26 of the 60 cell lines included in the NCI-60 screen form spheroids that allow monitoring aggregate volume over time.29 Yet 3D culture is also of interest for non-spheroid-forming cells, in order to better approximate the densely packed cell arrangements found in the original tumour. In some cell lines aggregation can be improved by supplementing culture medium with animal-derived basement membrane extracts such as Matrigel,30 but the use of this chemically non-defined supplement introduces unknown factors that may affect the interpretation of results.
Here, we present a novel conical agarose microwell array (CAMA) for 3D cell culture. This array leads to the formation of spheroidal and non-spheroidal cell aggregates. The microwells are of conical shape with a rounded bottom to centre the cells by gravity. Each conical microwell represents a miniaturised conical volume. Importantly, its principle of volume determination is applicable to the measurement of growing cell aggregates. Horizontal surfaces between the microwells are omitted to ensure that the cell distribution is homogeneous. The scaffold-free setup eliminates the requirement to introduce adhesion factors and emphasizes cellular self-organisation. In this study, we demonstrate that CAMA is a versatile tool for 3D cell culture experiments examining growth measurement, treatment response and co-culture, and facilitates histological sample processing.
Materials and methods
Microwell array fabrication
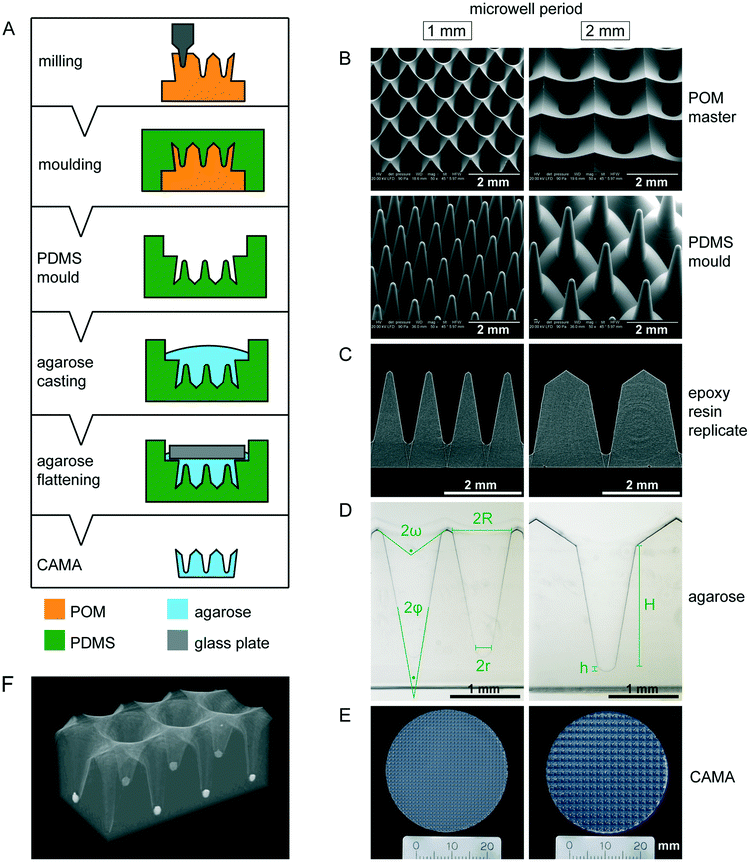
The pattern of the microwell arrays was defined by computer-aided design (CAD). The microwells were machined into polyoxymethylene (POM) blocks under computerized numerical control (CNC), using a VCP 800 3-Axis CNC mill (Mikron, Germany). For the purpose of obtaining conical microwells, custom-made engraving cutters with a tapered shape were applied. The resulting POM master structures had a microwell periodicity of 1 or 2 mm. Moulds were taken with a room temperature vulcanization polydimethylsiloxane (PDMS) (Pricosil shore 31, Schwarzmann, Germany). The PDMS moulds were placed in pre-heated aluminum dishes and loaded with 2.4% agarose solution (DNA grade, SERVA), followed by centrifugation (1 min, 2000 × g) to remove bubbles. Glass plates were then placed on the agarose to create a smooth surface. After gelling on ice, the agarose microwell arrays were unmoulded, immersed in 1× PBS w/o Ca2+/Mg2+ (Invitrogen) and finally sterilized by UV irradiation. The disc-shaped microwell arrays were designed to fit in either 6-well or 24-well plates (34.5 mm and 11 mm, respectively).Scanning electron microscopy
Samples were imaged using a Quanta 250 FGE (FEI Inc.) with a large field detector, low vacuum (90 Pa) and at an accelerating voltage of 20 kV. Samples were tilted 45° to the direction of the e-beam to allow better 3D viewing.Micro-computed tomography (μCT)
μCT was used to perform 3D analysis. This method shows the CAMA in a wet state including cells for 3D visualisation at different perspectives and transparencies. Briefly, samples were scanned in a SkyScan 1272 (Bruker), 3D-reconstruction was done with NRecon software (Bruker) and the 3D-images were processed with CTVox (Bruker).Material testing of agarose microwell arrays
Tensile failure tests were conducted on a servohydraulic materials testing machine (Amsler HC 10, Zwick/Roell AG, Germany) at an extension rate of 0.5 mm s−1. Agarose microwell arrays were trimmed into hourglass shaped strips of 10 mm at the narrowest point and clamped between the branches of the machine using PDMS braces to avoid squeezing damage. The initial length of the sample was 10 mm. The stop criterion was a relative drop in force of 90%. A force–distance curve and the ultimate load to failure (in N) were recorded for each agarose microwell array.Cell culture
Commercially available cancer cell lines were expanded as monolayer cultures in the medium as recommended by the supplier, with 5–10% fetal calf serum (FCS), penicillin (100 U ml−1), streptomycin (1 μg ml−1) and L-glutamine (4 mM). Prior to seeding the cell suspension onto the agarose microwell arrays, the agarose discs were placed into 6-well plates with 3 ml of cell culture medium. Plates were then centrifuged briefly (1 min; 1000 × g) to remove bubbles and were then pre-incubated at 37 °C for 2 h. The cells were trypsinised to produce a single cell suspension, counted in a haemacytometer and diluted according to the required cell count per ml. The pre-incubation medium was then removed and replaced with 9.5 ml of cell suspension containing 2.5% FCS. To harvest cell aggregates, the CAMA was turned upside down and centrifuged (1 min; 500 × g). After removal of the empty CAMA, cell aggregates were floating in the medium and collected with a serological pipette.Readout and volumetry
To monitor volume changes of cell aggregates over time, plates with CAMA were scanned on a high-resolution flatbed scanner (CanoScan 9000F Mark II, Canon Inc.), using the transmitted light modus at 1200 dpi. Optionally, to enhance contrast in the final readout, viable cell aggregates inside CAMA were stained by incubating with 2 ml of DMEM containing 0.5 mg ml−1 MTT (3-(4,5-dimethylthiazol-2-yl)-2,5-diphenyltetrazoliumbromide, Sigma) at 37 °C for 3 h. The staining reaction was stopped by replacing the MTT solution with 2,5% acetic acid. From the central portion of each scan, a selection of 20 mm by 20 mm, comprising 100 or 400 microwells was cropped and stored as a greyscale TIF image. The projected area of each cell aggregate was measured using ImageJ image analysis software (NIH).Volume calibration
A suspension of coloured polystyrene microbeads of 19.98 μm in diameter (microparticles GmbH, Germany) diluted in ethanol and thickened with 0.5% methylcellulose was loaded onto the CAMA and centrifuged to the bottom of the microwells. Images of microbead bulks in conical microwells were taken via a microscope camera and a flatbed scanner. Ethanol was substituted with coconut oil, which filled the space between the microbeads. When cooling to 4 °C, the coconut oil solidified, which allowed retrieval of all microbeads from each microwell using a pointed blade. Microbead bulks from individual microwells were transferred onto microscopic glass slides, embedded with cedar wood oil and spread by gentle pressure onto the coverslip until the microbeads were in one optical plane. Absolute numbers of microbeads were counted by image analysis (ImageJ, NIH) and correlated with the volume calculated from the projected area of microbeads in the respective image.Histology and immunohistochemistry
The CAMA was covered with 2% formalin solution in PBS overnight. To avoid loss of cell aggregates during further processing, microwells were sealed with warm 2.4% (w/v) low melting point agarose. Following paraffin embedding and casting into a block, 2 μm thick sections were cut and mounted onto slides. All slides were stored for two days at 58 °C in a drying chamber, deparaffinized (using xylene) and hydrated (using ethanol). Subsequent slides were stained with haematoxylin and eosin (H&E) according to routine protocols or subjected to immunohistochemistry (IHC). IHC was performed using ready-to-use antibodies for MIB-1 (monoclonal mouse anti-human antigen, Ki-67, Code IR626, MIB-1, Dako), pancytokeratin (monoclonal mouse anti-human antigen, Cytokeratin, Code M0821, MNF116, Dako), E-cadherin (monoclonal mouse anti-human antigen, E-cadherin, Code IR059, NCH-38, Dako), and vimentin (monoclonal mouse anti-human antigen, vimentin, Code IR630, V9, Dako).For the detection of horseradish peroxidase EnVision Flex peroxidase-blocking reagent (DAKO, SM801), EnVision Flex + mouse (LINKER) (DAKO, K8021) and EnVision Flex/HRP (DAKO, SM802) were used. Before adding the coverslip, haematoxylin counterstaining was performed.
Live/dead staining
Cell aggregates in the CAMA were stained for 30 min at 37 °C with 1 μg ml−1 fluorescein-diacetate (FDA) and 50 μg ml−1 propidium iodide (PI) in cell culture medium. After washing twice with medium, samples were examined with an inverted fluorescence microscope (IMT2 and scan^R, Olympus).Treatment and irradiation of cell aggregates
Cisplatin was diluted in cell culture medium and added at a final concentration of 10 μM. Irradiation was performed using 137Cs in a Gammacell 40 Exactor (Best Theratronics, Canada) at a dose rate of 0.67 Gy min−1.Isolation of human mesenchymal stromal cells (hMSC)
The use of hMSCs from bone marrow for this study was approved by the ethics committee of the University Medical Center of Freiburg (vote number 212/16). The donor was informed about the study in detail, and provided written consent the day before tissue harvest. The identity of the donor was protected by the use of blinded probes. Primary hMSC were isolated from a bone marrow aspirate from a 43 year-old healthy male volunteer. Bone marrow aspirates of about 10 ml were drawn from the pelvic bone using a Jamshidi needle and a syringe pre-loaded with 1 ml of heparin solution. Aspirates were diluted with a 10-fold volume of media, so that bone marrow particles could be transferred into T75 flasks, in which 20–30 particles each were cultivated as explants in DMEM/F12 (Invitrogen) with 5% autologous human serum, insulin (2 IE l−1), basic fibroblast growth factor (bFGF, 10 ng ml−1), epidermal growth factor (EGF, 20 ng ml−1), antibiotics, and 50 μg ml−1 ascorbic acid-2-phosphate (Sigma) at 37 °C and 5% carbon dioxide. After 8–12 days, adherent hMSCs from explant cultures were sub-cultured and further expanded for another 2–3 weeks, including 1–2 passages. Human MSCs were functionally validated by the demonstration of adipogenic, osteogenic and chondrogenic differentiation (Fig. S1†).Statistical analyses
The means of the measurements were compared using the unpaired Student's t test. Statistical analyses were performed with GraphPad Prism 6.0 (GraphPad Software, Inc., CA, USA).Results and discussion
Physical properties of conical agarose microwell arrays
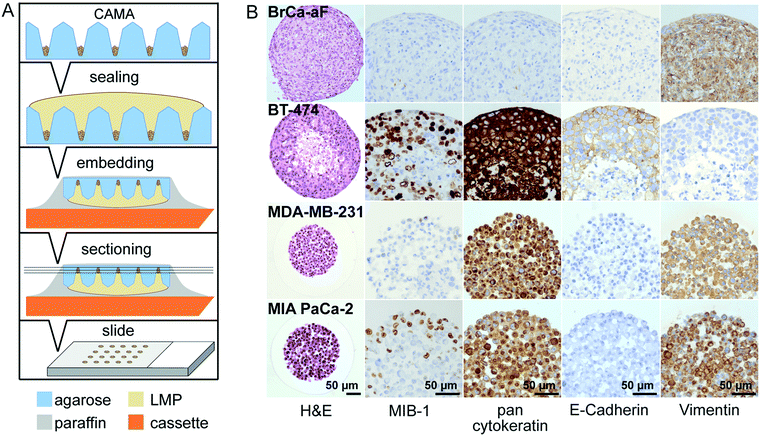
The CAMA, when fabricated as described (Fig. 1A), yields a reproducible geometry with defined distances between the microwells. The CAMA is generated in two formats, with a microwell periodicity of either 1 or 2 mm, corresponding to 100 and 25 microwells per cm2. The microwell density differs with respect to the distance between the centres of the cones, while the size of the cones remains unaffected. Scanning electron microscopy revealed the high accuracy in shape obtained by milling of the POM master structure and its subsequent moulding into PDMS (Fig. 1B). μCT scans of the final CAMA and of epoxy resin replicates confirm the precision of the replica moulding process (Fig. 1C, Video S1†). Each microwell of the CAMA is designed as a truncated right circular cone. Measurements indicate the following approximate dimensions: the opening angle of the cone (2φ) is 20°, the microwell depth (H) is 1775 μm with the lowest diameter (2r) between 237 and 255 μm, and the highest (2R) between 830 and 852 μm. The total volume of a single cone is 465 × 106 μm3. The apex is replaced by a rounded bottom of 40 μm in height (h) at the site of truncation. The volume of this part is 1.68 × 106 μm3. At the upper end of the cone a linear slope formed by an opening angle (2ω) of about 115° serves to guide the cells into the microwell (Fig. 1D, Table S1†). The CAMA (Fig. 1E) is designed to fit into a 6-well plate. A μCT reconstruction reveals the 3D shape and the arrangement of cell aggregates in the CAMA (Fig. 1F). The mechanical stability of the CAMA is not significantly altered after cell cultivation for 2 weeks (Fig. S2†).The CAMA represents a technological advance for 3D cell culture due to the following features:
•Agarose hydrogels are low-adhesive materials that not only support scaffold-free cell aggregate formation, but also allow diffusion of nutrients, oxygen and catabolites,31 in contrast to synthetic polymers such as PDMS and polystyrene (Fig. S3†).
•CNC-milling was previously shown to result in high shape accuracy of cylindrical microwells in polystyrene dishes32 and, in combination with replica moulding, in polyethylene glycol (PEG).33
•Contrary to cylindrical microwells, the conical shape centres the seeded cells, leading to formation of a single cell aggregate within each microwell.
•The conical microwells allow determination of the filling level corresponding to the cell aggregate volume using microscopic or scanner imaging in view of the rotational axis.
Remarkably, established precision methods such as photolithography and soft lithography usually result in perpendicular boundaries for microstructures,34 while sloped or tapered boundaries are more difficult to generate. Because of this there have been few attempts to produce conical microwells to date. Laser ablation of a polyester surface bound to a glass substrate results in eccentrical cones with non-uniform taper angles.20 Despite optimized laser programming, power setting and writing speed, this method has failed to produce axisymmetrical cones. A femtosecond laser wet-etching process on silica glass produces microcones of defined angles with a diameter and height of 100 and 150 μm.35 Therefore, we chose to mill the microwells into the material on a CNC machine, which has no size restrictions and allows fabrication of both cylindrical and tapered geometries by choice of the milling tool.36 The production of a single master structure provides the opportunity to draw an almost unlimited number of PDMS moulds. This fabrication process ensures high fidelity of shape for each microwell and each CAMA. This is crucial for an even cell distribution among the microwells.
Arrangement of cells in the CAMA
We observe that cells distributed onto the CAMA sediment into the microwells within 2 h to 4 h and form conical aggregates. During cultivation the cells either remain as conical aggregates or form spheroids. In both cases the volume of each aggregate is proportional to the projected area (Fig. 2A) and calculated after scanning (Fig. S4†) using the formulas as indicated (Fig. S5†). In contrast to cylindrical microwells the projected area seen from the bottom in conical microwells increases with the filling level (Fig. S6†). In order to validate that the measured volume is proportional to a given number of physical entities of a defined volume, we loaded microbeads onto the CAMA. Linear regression analysis shows that the calculated volume correlates with the number of microbeads loaded (r2 = 0.99) (Fig. 2B). Equally, the number of cells seeded per microwell significantly correlates with the volume of the cell aggregates (r2 = 0.94 (HT-29); r2 = 0.99 (Panc-1); r2 = 0.96 (MDA-MB-231)) (Fig. 2C). A narrow distribution of cell aggregate volumes in between the individual microwells is seen when a defined cell number is loaded (Fig. 2D).Several cell lines have been tested in the CAMA to determine their 3D-aggregation and growth properties (Table 1).
CAMA not only shares the benefit of the spheroid model in which volumes of individual spheroids may easily be determined from the diameter or projected area,11 but extends this feature to non-spheroid forming cell types. We observe a linear correlation between the loaded cell number and the volume measured for spheroid forming (HT-29, Panc-1) and non-spheroid forming cell aggregates (MDA-MB-231). CAMA generates homogenously sized and shaped cell aggregates. Limited to spheroid forming cells, this has been shown in another microwell device approach.37 Cell aggregates of irregular shape require more complex imaging and calculation modalities to approximate the volume,38 which hampers high-throughput measurement of cell aggregates. Importantly, a considerable fraction of cancer cell lines relevant for cancer research fails to form spheroids.29 CAMA overcomes this limitation by shaping these cells into a conical cell aggregate, which enables volume determination regardless of their capacity for spheroid formation. In addition, deep microwells with a high-aspect ratio such as CAMA provide the advantage that cells or cell aggregates remain trapped. The cells are not easily lost when medium is exchanged or the array is moved.
Histological processing
In this work, we present a simple method for histological processing of spheroids and cell aggregates in the CAMA (Fig. 3A, Fig. S7†) as described in Materials & methods. The arrangement of the cells is revealed by H&E-staining, whereas IHC shows cell line specific marker profiles (Fig. 3B). Breast cancer associated fibroblasts (BrCa-aF) were negative for staining with the epithelium-specific marker pan-cytokeratin and positive for vimentin. In contrast, all epithelium-derived cancer cell lines were pan-cytokeratin positive. Notably, BT-474 exhibits a central necrotic zone, while proliferating (MIB-1-positive) cells dominate in the periphery of the tumour spheroids. This observation is consistent with the pattern expected for tumour spheroids.8The size of the spheroids makes them susceptible to loss or damage during histological processing.39 Available protocols that are adapted to manual fixation dehydration and embedding of spheroids have been shown to result in good preservation of morphology. However, such methods comprise several manual steps and are not easily adapted to automated sample processing.40,41 In the CAMA the cell aggregates can be subjected to standard histological processing, because the microwells are sealed with a second layer of agarose to immobilise the cells. Subsequent paraffin embedding and slice preparation follows established procedures. Therefore, CAMA facilitates histological preparation of 3D cell cultures.
Modulation of microwell spacing affects cell growth
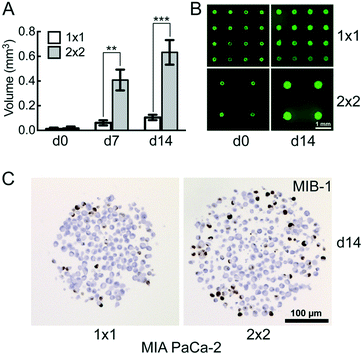
The distance between the microwells is 1 mm with 100 microwells per cm2 in the 1 × 1 CAMA, and 2 mm with 25 microwells per cm2 in the 2 × 2 CAMA, respectively. To determine the effect of microwell spacing on cell growth we compared the increase of MIA PaCa-2 cell aggregate volumes in both formats after seeding identical cell numbers per microwell. The growth of the cell aggregates is significantly enhanced in the 2 × 2 format (Fig. 4A and B). IHC staining of the proliferation marker MIB-1 reveals a higher fraction of proliferating cells in the 2 × 2 format (Fig. 4C).The increase in distance between spheroids results in a gain of culture medium available per cell aggregate. This may explain the correlation of distance between spheroids and spheroid volume that has been reported previously.42 The advantage of a high density of microwells per cm2 is the high number of replicates, with the disadvantage of rapid shortage of nutrients and accumulation of waste products (Fig. S8†). Consequently, for seeding >1000 cpm (cells per microwell) or experiments that require cell cultivation for several weeks, the 2 × 2 CAMA is recommended. As metabolic demands and proliferation rates may greatly differ among cell lines, metabolic measures may be performed to further adjust seeding densities. Indeed, it is a unique feature of the CAMA that microwell spacing is variable, while the volume of the microwell remains unchanged. Therefore, it differs from previously designed 3D-microwell arrays where an increase in microwell spacing is coupled to an increase in microwell diameter.18,43
The decrease in MIB-1 expression from the periphery to the centre of the MIA PaCa-2 cell aggregates (Fig. 4C) corresponds to an outer proliferation zone that can be distinguished from a central quiescent zone. This arrangement is caused by diffusion gradients and occurs in tumours in vivo.44 This has so far been shown in classical spheroids,45 but not in aggregates of non-spheroid forming cells such as MIA PaCa-2. Therefore, this finding indicates that CAMA allows non-spheroid forming cells to grow as 3D aggregates with an in vivo-like microenvironment.
CAMA in comparison to the hanging drop and liquid overlay methods
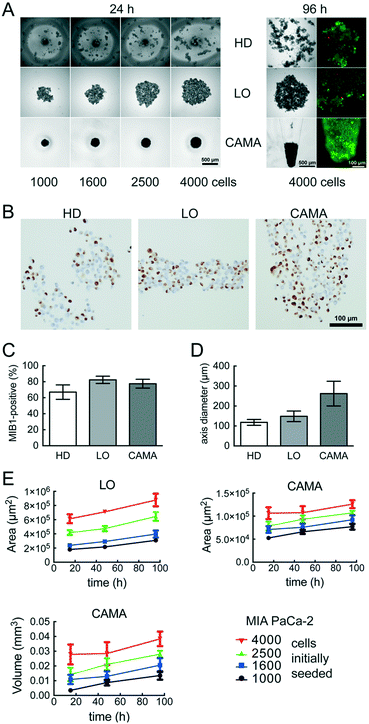
We compared the growth of the spheroid forming cell line T47D and the non-spheroid forming cell line MIA PaCa-2 using.Hanging drop (HD), liquid overlay (LO) and CAMA, in order to determine differences in cell proliferation and cell density. T47D show similar spheroid formation in HD, LO and CAMA (data not shown). In contrast, MIA PaCa-2 form stable cell aggregates in CAMA, loose cell aggregates in LO and only small, dispersed aggregates in HD (Fig. 5A). While the ratio of MIB-1-positive cells is slightly decreased in HD compared to LO and CAMA (Fig. 5B and C), the minor axis diameter is significantly increased in the CAMA (Fig. 5D). MIA PaCa-2 cell aggregates cultivated in CAMA grow to higher cell densities compared to LO, thereby covering a smaller area. In HD the area is not measured due to cell dispersion. Notably, the volume of the cell aggregates can be determined only in CAMA (Fig. 5E).
In clinical oncology tumour size is the central parameter for evaluation of treatment response46 and is similarly considered to be a superior read-out in 3D-cell culture assays, compared to metabolic measurements.47,48 CAMA meets this demand by enabling non-destructive, repeatable volume determination over several weeks (Fig. S9†).
Treatment and irradiation of cell aggregates in the CAMA
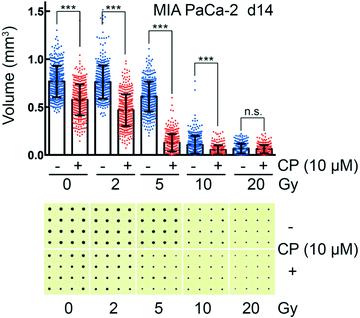
CAMA allows monitoring dose-dependent effects of complex treatments using cell aggregate volume as readout. For example, in radiation oncology chemotherapy is frequently combined with irradiation. Combination of cisplatin with irradiation reveals a radiosensitising effect on MIA PaCa-2 cell aggregates, reaching its maximum at 5 Gy (Fig. 6). MIA PaCa-2 has an undifferentiated, E-cadherin-negative, non-cohesive phenotype49 and does not form spheroids. Importantly, MIA PaCa-2 belongs to a group of non-spheroid, yet cell aggregate forming tumour cells that could not be analysed with hitherto existing culture methods.In comparison to high-throughput 3D assays that allow screening of 384 to 1536 conditions per plate, one plate loaded with the CAMA is limited to a screen of 6 to 24 conditions. Nevertheless, CAMA offers the advantage of screening hundreds of replicates per treatment condition. This ensures high statistical significance. Furthermore, in experiments where a heterogeneous treatment response is expected, a high number of replicates is essential to yield significant results and to eliminate outliers. In particular, this is the case in irradiation experiments, where stochastic events are involved and the fractions of treatment responders and non-responders needs to be identified based on a high number of replicates (Fig. S10†). In particular, when cells are derived from a tumour mass that consists of genetically instable and therefore heterogeneous populations the treatment response may vary considerably.
Co-culture in CAMA
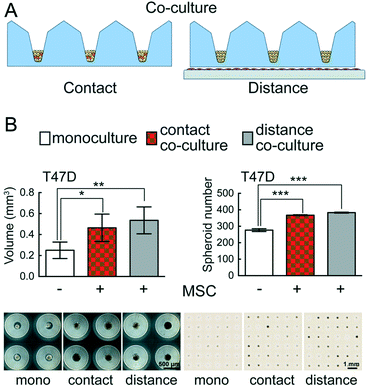
The interaction of distinct cell types determines tissue development and plays a major role in disease biology. The fate of cancer cells depends largely on their interactions with different cell types in the tumour microenvironment.50 Special emphasis has been put on investigating the interaction between stromal and cancer cells.51,52 Two classical approaches in co-culture experiments have been established: contact (direct) and distance (indirect) co-culture. However, the vast majority of co-culture experiments are performed in 2D systems.Importantly, CAMA can easily be applied to perform both contact and distance 3D co-culture experiments (Fig. 7A). We have found that the growth and absolute number of spheroids formed is significantly enhanced in T47D breast cancer cells in contact and distance co-culture with human MSCs as compared to monoculture (Fig. 7B). The conical cell aggregate forming MIA PaCa-2 pancreatic cancer cells were co-cultured with human MSCs under the same conditions, but no changes in growth were observed compared to monoculture (data not shown).
The PREDECT (New Models for Preclinical Evaluation of Drug Efficacy in Common Solid Tumours) consortium aims to improve preclinical methods, including in vitro 3D organotypic (co-) cultures that permit greater predictability of drug efficacy, with the goal of studying samples of tumour patient cohorts. In this context 2D and 3D models of stromal cells co-cultured with breast, prostate and lung cancer cell lines were compared. Cells were tested for drug sensitivity as 2D monolayers, as spheroids in suspension and spheroids embedded in defined substrates.53 Co-culture experiments in CAMA upgrade the portfolio of available methods, eliminating the effects on co-culture due to exogenous factors such as those found in Matrigel. In distance co-culture the spatial separation of stromal cells (adherent to the culture dish) from the tumour cells (in the microwells) allows selective treatment of one cell type. Thus, changes in volume can be attributed to the treatment of one cell type. In contact co-cultures the situation is more intricate. Here both cell types are affected by the treatment in the first instance, so that a volume change could be due to effects on stromal or tumour cells or both. Yet we found that hMSCs do not proliferate under contact co-culture conditions (Fig. S11†). Therefore, in this case a volume change can be attributed to the tumour cells. However, even in cases when two proliferating cell types are seeded into contact co-culture, the CAMA enables IHC staining to distinguish the two cell types and to analyse underlying mechanisms.
Conclusions
In summary, CAMA supports the formation and long-term 3D-culture of cell aggregates in a scaffold-free system. The CAMA method is unique because the compact, conical shape of the wells allows them to function as a form of “measuring cup”, allowing easy and accurate quantification of cell aggregate volume over time. The rugged design of the agarose hydrogel array results in high reproducibility. This allows its introduction into standard cell culture laboratories, where it is can be used for high-throughput applications. Importantly, CAMA is not limited to spheroid forming cells, allowing this platform to extend the number of cell types that can be tested in a scaffold-free 3D mono- and co-culture system. It is noteworthy that monoculture experiments can easily be translated into co-culture experiments. Analyses include a variety of applications such as the measurement of dose–response drug and irradiation kinetics and a simple, efficient procedure for preparation of histological and immunohistological slides.Conflicts of interest
A patent application covering this work is published as EP 2917326 A1 and WO 2014072432 A1. ART, NN and GN are named as inventors in the patent application. In case a patent should be granted and lead to a commercial product (which is currently considered for distribution under the name of “CoSeedis”), it is anticipated that the University of Freiburg will receive license fees, of which shares would be distributed to the inventors and to the Department of Radiation Oncology. The remaining authors have no conflicts to declare.Acknowledgements
This work was supported by the Dr. med. h. c. Erwin Braun Foundation. The authors wish to thank Markus Kühs for preparation and staining of paraffin sections, Dr. Lukas Konstantinidis for help with material testing, Dr. Anne-Marie Lüchtenborg and Dr. Horst Ibelgaufts for discussions.References
- V. E. Santo, S. P. Rebelo, M. F. Estrada, P. M. Alves, E. Boghaert and C. Brito, Biotechnol. J., 2017, 12, 1600505 CrossRef PubMed
.
- E. Carletti, A. Motta and C. Migliares, Methods Mol. Biol., 2010, 695, 17–39 Search PubMed
.
- W. Mc Limans, E. V. Davis, F. L. Glover and G. W. Rake, J. Immunol., 1957, 79, 428–433 CAS
.
- J. M. Kelm, L. M. Ittner, W. Born, V. Djonov and M. Fussenegger, J. Biotechnol., 2006, 121, 86–101 CrossRef CAS PubMed
.
- M. A. Kinney, C. Y. Sargent and T. C. McDevitt, Tissue Eng., Part B, 2011, 17, 249–262 CrossRef PubMed
.
- J. Friedrich, R. Ebner and L. A. Kunz-Schughart, Int. J. Radiat. Biol., 2007, 83, 849–871 CrossRef CAS PubMed
.
- E. Fennema, N. Rivron, J. Rouwkema, C. van Blitterswijk and J. de Boer, Trends Biotechnol., 2013, 31, 108–115 CrossRef CAS PubMed
.
- R. M. Sutherland, B. Sordat, J. Bamat, H. Gabbert, B. Bourrat and W. Mueller-Klieser, Cancer Res., 1986, 46, 5320–5329 CAS
.
- J. M. Kelm, N. E. Timmins, C. J. Brown, M. Fussenegger and L. K. Nielsen, Biotechnol. Bioeng., 2003, 83, 173–180 CrossRef CAS PubMed
.
- A. Nagelkerke, J. Bussink, F. C. G. J. Sweep and P. N. Span, Anal. Biochem., 2013, 437, 17–19 CrossRef CAS PubMed
.
- B. Rodday, F. Hirschhaeuser, S. Walenta and W. Mueller-Klieser, J. Biomol. Screening, 2011, 16, 1119–1124 CrossRef PubMed
.
- A. Ivascu and M. Kubbies, J. Biomol. Screening, 2006, 11, 922–932 CrossRef CAS PubMed
.
- D. R. Albrecht, G. H. Underhill, T. B. Wassermann, R. L. Sah and S. N. Bhatia, Nat. Methods, 2006, 3, 369–375 CrossRef CAS PubMed
.
- Y. Miyamoto, M. Ikeuchi, H. Noguchi, T. Yagi and S. Hayashi, Cell Medicine, 2015, 8, 47–56 CrossRef PubMed
.
- X. Gong, C. Lin, J. Cheng, J. Su, H. Zhao, T. Liu, X. Wen and P. Zhao, PLoS One, 2015, 10, e0130348 Search PubMed
.
- Y. Tang, J. Liu and Y. Chen, Microelectron. Eng., 2016, 158, 41–45 CrossRef CAS
.
- J. Dahlmann, G. Kensah, H. Kempf, D. Skvorc, A. Gawol and D. A. Elliott,
et al.
, Biomaterials, 2013, 34, 2463–2471 CrossRef CAS PubMed
.
- A. P. Napolitano, D. M. Dean, A. J. Man, J. Youssef, D. N. Ho and A. P. Rago,
et al.
, BioTechniques, 2007, 43, 496–500 CrossRef
.
- X. Xu, W. Wang, K. Kratz, L. Fang, Z. Li, A. Kurtz, N. Ma and A. Lendlein, Adv. Healthcare Mater., 2014, 3, 1991–2003 CrossRef CAS PubMed
.
- S. Selimović, F. Piraino, H. Bae, M. Rasponi, A. Redaelli and A. Khademhosseini, Lab Chip, 2011, 11, 2325–2332 RSC
.
- J. Carlsson and J. M. Yuhas, Recent Results Cancer Res., 1984, 95, 1–23 CAS
.
- B. Patra, C. C. Peng, W. H. Liao, C. H. Lee and Y. C. Tung, Sci. Rep., 2016, 6, 21061 CrossRef CAS PubMed
.
- K. C. Hribar, D. Finlay, X. Ma, X. Qu, M. G. Ondeck, P. H. Chen and F. Zanella,
et al.
, Lab Chip, 2015, 15, 2412–2418 RSC
.
- Y. C. Chen, X. Lou, Z. Zhang, P. Ingram and E. Yoon, Sci. Rep., 2015, 5, 12175 CrossRef PubMed
.
- G. H. Lee, Y. E. Park, M. Cho, H. Park and J. Y. Park, Lab Chip, 2016, 16, 3565–3575 RSC
.
- A. Kang, H. I. Seo, B. G. Chung and S. H. Lee, Nanomedicine, 2015, 11, 1153–1161 CrossRef CAS PubMed
.
- F. Madoux, A. Tanner, M. Vessels, L. Willetts, S. Hou, L. Scampavia and T. P. Spicer, SLAS Discov., 2017, 22, 516–524 Search PubMed
.
- K. Halfter and B. Mayer, Biotechnol. J., 2017, 12, 1600295 CrossRef PubMed
.
- J. Friedrich, C. Seidel, R. Ebner and L. A. Kunz-Schughart, Nat. Protoc., 2009, 4, 309–324 CrossRef CAS PubMed
.
- G. Benton, I. Arnaoutova, J. George, H. K. Kleinman and J. Koblinski, Adv. Drug Delivery Rev., 2014, 79-80, 3–18 CrossRef CAS PubMed
.
- M. Sittinger, J. Bujia, W. W. Minuth, C. Hammer and G. R. Burmester, Biomaterials, 1994, 15, 451–456 CrossRef CAS PubMed
.
- J. Fukuda and K. Nakazawa, Tissue Eng., 2005, 11, 1254–1262 CrossRef CAS PubMed
.
- K. Nakazawa, Y. Yoshiura, H. Koga and Y. Sakai, J. Biosci. Bioeng., 2013, 116, 628–633 CrossRef CAS PubMed
.
- J. C. Love, J. L. Ronan, G. M. Grotenbreg, A. G. van der Veen and H. L. Ploegh, Nat. Biotechnol., 2006, 24, 703–707 CrossRef CAS PubMed
.
- H. Bian, Q. Yang, F. Chen, H. Liu, G. Du, Z. Deng, J. Si, F. Yun and X. Hou, Mater. Sci. Eng., C, 2013, 33, 2795–2799 CrossRef CAS PubMed
.
- D. J. Guckenberger, T. E. de Groot, A. M. Wan, D. J. Beebe and E. W. Young, Lab Chip, 2015, 15, 2364–2378 RSC
.
- H. C. Moeller, M. K. Mian, S. Shrivastasa, B. G. Chung and A. Khademhosseini, Biomaterials, 2008, 29, 752–763 CrossRef CAS PubMed
.
- M. Zanoni, F. Piccinini, C. Arienti, A. Zamagni, S. Santi, R. Polico, A. Bevilacqua and A. Tesei, Sci. Rep., 2016, 6, 19103 CrossRef CAS PubMed
.
- T. R. Olsen, B. Mattix, M. Casco, A. Herbst, C. Williams, A. Tarasidis, L. Jenkins, C. L. McMahan, D. Simionescu, R. P. Visconti and F. Alexis, J. Histotechnol., 2014, 37, 138–142 CrossRef
.
- P. K. Kabadi, M. M. Vantangoli, A. L. Rodd, E. Leary, S. J. Madnick, J. R. Morgan, A. Kane and K. Boekelheide, BioTechniques, 2015, 59, 279–286 CrossRef CAS PubMed
.
- J. Kang, D. W. Lee, H. J. Hwang, S. E. Yeon, M. Y. Lee and H. J. Kuh, Lab Chip, 2016, 16, 2265–2276 RSC
.
- H. Hardelauf, J. P. Frimat, J. D. Stewart, W. Schormann, Y. Y. Chiang, P. Lampen, J. Franzke, J. G. Hengstler, C. Cadenas, L. A. Kunz-Schughart and J. West, Lab Chip, 2011, 11, 419–428 RSC
.
- M. D. Ungrin, C. Joshi, A. Nica, C. Bauwens and P. W. Zandstra, PLoS One, 2008, 3, e1565 Search PubMed
.
- C. Carmona-Fontaine, M. Deforet, L. Akkari, C. B. Thompson, J. A. Joyce and J. B. Xavier, Proc. Natl. Acad. Sci. U. S. A., 2007, 114, 2934–2939 CrossRef PubMed
.
- D. R. Grimes, P. Kannan, A. McIntyre, A. Kavanagh, A. Siddiky, S. Wigfield, A. Harris and M. Partridge, PLoS One, 2016, 11, e0153692 Search PubMed
.
- E. A. Eisenhauer, P. Therasse, J. Bogaerts, L. H. Schwartz, D. Sargent, R. Ford, J. Dancey, S. Arbuck, S. Gwyther, M. Mooney, L. Rubinstein, L. Shankar, L. Dodd, R. Kaplan, D. Lacombe and J. Verweij, Eur. J. Cancer, 2009, 45, 228–247 CrossRef CAS PubMed
.
- D. P. Ivanov, T. L. Parker, D. A. Walker, C. Alexander, M. B. Ashford, P. R. Gellert and M. C. Garnett, PLoS One, 2014, 9, e103817 Search PubMed
.
- M. Jennewein, M. Bubel, S. Guthörl, W. Metzger, M. Weigert, T. Pohlemann and M. Oberringer, Cell Tissue Res., 2016, 365, 279–293 CrossRef CAS PubMed
.
- J. M. Winter, A. H. Ting, F. Vilardell, E. Gallmeier, S. B. Baylin, R. H. Hruban, S. E. Kern and C. A. Iacobuzio-Donahue, Clin. Cancer Res., 2008, 14, 412–418 CrossRef CAS PubMed
.
- M. Pickup, S. Novitskiy and H. L. Moses, Nat. Rev. Cancer, 2013, 13, 788–799 CrossRef CAS PubMed
.
- C. J. Olsen, J. Moreira, E. M. Lukanidin and N. S. Ambartsumian, BMC Cancer, 2010, 10, 444 CrossRef PubMed
.
- F. Ozawa, K. Ino, T. Arai, J. Ramon-Azcon, Y. Takahashi, H. Shiku and I. Matsue, Lab Chip, 2013, 13, 3128–3135 RSC
.
- K. Stock, M. F. Estrada, S. Vidic, K. Gjerde, A. Rudisch, V. E. Santo and M. Barbier,
et al.
, Sci. Rep., 2016, 6, 28951 CrossRef CAS PubMed
.
Footnote |
| † Electronic supplementary information (ESI) available: Table S1, Fig. S1–S11 and Video S1. See DOI: 10.1039/c7lc00832e |
| This journal is © The Royal Society of Chemistry 2018 |

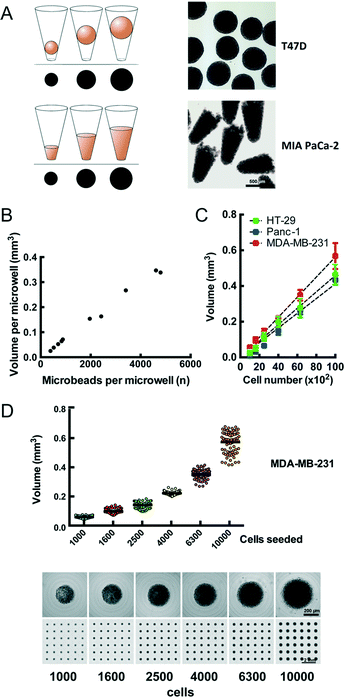
![[thin space (1/6-em)]](https://www.rsc.org/images/entities/char_2009.gif) 542 microbeads was loaded onto the CAMA, centrifuged, scanned and photographed for the microwell in its defined position. From each microwell the microbeads were extracted, counted and correlated to the calculated aggregate volume. (C) Calibration of cell aggregate volume against cell number. Three cell lines were seeded at defined cell numbers 6 h before scanning. Regression curves are indicated. Each data point represents the mean of 81 replicates. Representative data for one out of two experiments are shown. (D) Dot plot for volume distribution of MDA-MB-231 cell aggregates seeded at defined numbers (upper row). Corresponding single cell aggregates and scans of CAMA regions are shown (lower row).
542 microbeads was loaded onto the CAMA, centrifuged, scanned and photographed for the microwell in its defined position. From each microwell the microbeads were extracted, counted and correlated to the calculated aggregate volume. (C) Calibration of cell aggregate volume against cell number. Three cell lines were seeded at defined cell numbers 6 h before scanning. Regression curves are indicated. Each data point represents the mean of 81 replicates. Representative data for one out of two experiments are shown. (D) Dot plot for volume distribution of MDA-MB-231 cell aggregates seeded at defined numbers (upper row). Corresponding single cell aggregates and scans of CAMA regions are shown (lower row).


