 Open Access Article
Simultaneous dual-colour tracking lipid droplets and lysosomes dynamics using a fluorescent probe†
Xujun
Zheng‡
ab,
Wencheng
Zhu‡
c,
Fan
Ni
a,
Hua
Ai
*c,
Shaolong
Gong
 a,
Xiang
Zhou
 a,
Jonathan L.
Sessler
d and
Chuluo
Yang
 *ab
*ab
aDepartment of Chemistry, Hubei Key Lab on Organic and Polymeric Optoelectronic Materials, Wuhan University, Wuhan 430072, P. R. China. E-mail: clyang@whu.edu.cn
bShenzhen Key Laboratory of Polymer Science and Technology, College of Materials Science and Engineering, Shenzhen University, Shenzhen, 518060, P. R. China
cNational Engineering Research Center for Biomaterials, Sichuan University, Chengdu 610064, P. R. China. E-mail: huaai@scu.edu.cn
dCenter for Supramolecular Chemistry and Catalysis, Shanghai University, Shanghai 200444, P. R. China
First published on 27th December 2018
Abstract
After entering a cell, most small molecule fluorescent probes are dispersed in the cytoplasm before they then accumulate in a specific organelle or subcellular zone. Molecules that can enter two or more organelles with high selectivity are all but unknown. In this work, we report a naphthalimide-based fluorescent probe, NIM-7, that allows lipid droplets and lysosomes to be labelled simultaneously and with high specificity. These subcellular entities can then be visualized readily through yellow and red fluorescence, using different excitation and detection channels. NIM-7 allows 3D imaging and quantitative visualizing of lipid droplets and lysosomes. It is also able to track simultaneously the movement of lipid droplets and lysosomes in real-time. We also report here that NIM-7 can be used to image both different cell lines and zebrafish embryos.
Introduction
Lipid droplets (LDs) and lysosomes are specialized subunits within cells. These organelles perform specific tasks that are critical to a host of cellular functions. For example, as the most hydrophobic sub-structures within cells, LDs contain a hydrophobic core of neutral lipids (mainly cholesterol and acyl-glycerol)1 and serve to store lipids for energy generation and membrane synthesis. Lysosomes are typically acidic organelles (pH 4.5–5.0) that play a critical role in the digestion and clearance of endocytosed and endogenous intracellular materials.2 LDs and lysosomes also interact with one another in the context of certain biological processes. For instance, lysosomes are involved in the metabolism of lipid droplets. Moreover, a dynamic cooperation between LDs and lysosomes is critical for cellular energy metabolism with dysfunction being correlated with various metabolic3 and lysosomal storage diseases.4 An ability to label and track LDs and lysosomes could provide new insights into their mutual interactions, as well as their individual roles within working cells. Appropriate probes for this purpose could also see utility in the evaluation of therapeutic agents and the organelle-specific effects of toxins, cellular stress, and disease. Here we report a naphthalimide-based fluorescent probe, NIM-7, that allows lipid droplets and lysosomes to be labelled simultaneously and visualized separately using different excitation and detection channels. Specifically, as a result of the disparate subunits within NIM-7 and the different microenvironments of these two organelles, emission in the yellow and red fluorescence regions is seen for lipid droplets and lysosomes, respectively. This permits quantitative imaging in various cell lines by means of high resolution microscopy.Owing to their high selectivity, sensitivity, and ease of use, fluorescent probes have assumed central roles within both the chemical and biological communities.5 Traditionally, probes were designed to show specific response toward a specific analyte or class of analytes. However, probes capable of displaying different response functions when exposed to different inputs, have attracted increasing attention in recent years, in part because they show promise for the construction of so-called molecular logic gates and molecular keypad lock devices.6 Although a considerable number of multi-functional fluorescent probes have been reported to date, as a general rule a differential response is displayed only upon exposure to vastly different species (neutral vs. ionic analytes)7 or localization in disparate biological environments.8 Differential organelle labelling remains a particular challenge. This is mainly due to the fact that small molecule fluorescent probes are generally dispersed in the cytoplasm after penetrating the cell membrane before accumulating in a specific organelle or subcellular zone. Although poor probe specificity affords obliquely the possibility of imaging two or more organelles, there are no reports to our knowledge on the use of a single molecule to label and image two or more organelles simultaneously with high selectivity in living cells.
Recently, so-called super-resolution microscopic (SRM) techniques, including STED (stimulated emission depletion),9 SIM (structured illumination microscopy),10 STORM (stochastic optical reconstruction microscopy)11/PALM (photoactivated localization microscopy),12 and RESOLFT (reversible saturatable optically linear fluorescence transitions),13 have emerged as powerful tools in cell biology due to their resolution beyond the diffraction-limit, axial sectioning capability, as well as high imaging speed. These features have permitted new and exciting insights into the structural organization of cells, as well as the dynamics of biomolecular assemblies over a wide range of timescales.13,14 Therefore, combined with an appropriate probe, SRM could permit the concurrent monitoring lipid droplets and lysosomes. The present study was designed to test this possibility.
Inspired by our recent discoveries that a weakly basic derivative of naphthalimide can be protonated within the acidic microenvironment of lysosomes,15 we were prompted to test further what we expected would be a naphthalimide-based multi-organelle specific fluorescent probe, namely the previously reported system [(E)-2-(2-(dimethylamino)ethyl)-6-(4-(diphenylamino)styryl)-1H-benzo[de]isoquinoline-1,3(2H)-dione] (termed NIM-7).16 In NIM-7, the diphenylamine, styryl, and 1,8-naphthalimide moieties were expected to act as an electron donor (D), a π-bridge, and an electron acceptor (A), respectively. Predicative photophysical analyses (vide infra) revealed that the emission colour of NIM-7 is not influenced by the acidity. Therefore, protonation of the dimethylamino group of NIM-7, which was expected to drive accumulation of the probe molecules in lysosomes,17 was not expected to perturb the inherent red fluorescence. In contrast, the emission characteristics of NIM-7 proved quite sensitive to the polarity of the solvent medium. In particular in hydrophobic environments, such as within LDs, NIM-7 gives rise to a yellow fluorescence. As a result, we postulated that NIM-7 might have a role to play as a two-colour fluorescent probe capable of imaging LDs (or lipid-rich tissue) and lysosomes simultaneously by monitoring the different emission colours produced in these two subcellular environments (Scheme 1). Test of this hypothesis are described below. Briefly, we found that the microenvironment (that is, polarity and acidity) of these two organelles (or tissues) can in fact be distinguished as inferred from cell studies and zebrafish embryos. NIM-7 is able to track LDs and lysosomes dynamics concurrently in real-time. In addition, probe NIM-7 could be used to achieve the super-resolution imaging of LDs and lysosomes at the nanoscale level and at higher resolution than typically seen using laser scanning confocal microscopy (CLSM).
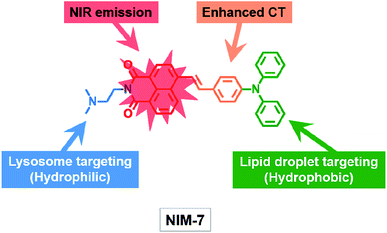 | ||
| Scheme 1 Molecular structure of the fluorescent probe NIM-7. The function of each moiety within the overall NIM-7 structure is highlighted (CT: charge transfer; NIR: near infrared). | ||
Results and discussion
NIM-7 was synthesized via the Heck coupling of N,N-diphenyl-4-vinylaniline with 6-bromo-2-(2-(dimethylamino)ethyl)-1H-benzo[de]-isoquinoline-1,3(2H)-dione in moderate yield according to the previously reported literature (Scheme S1†).16 The structure NIM-7 was determined by 1H-NMR and 13C-NMR spectroscopies and high-resolution mass spectrometry (HRMS), while the purity was assessed by high performance liquid chromatography (HPLC).In order to evaluate whether NIM-7 could act as a fluorescent cell imaging probe, we first investigated the chemical stability of NIM-7 in the presence of intracellular nucleophiles, including GSH, Cys, and H2O2. As shown in Fig. S1,† treatment with an excess of these species cause negligible spectroscopic changes. This leads us to suggest that NIM-7 might prove stable in various subcellular environments. The cytotoxicity and photostablility of NIM-7 in cells were also determined. As shown in Fig. S2a,† it was found that NIM-7 has no obvious cytotoxicity on four test cell lines (Hep3B, HepG2, HeLa and IMCD3) after 24 h incubation. This was true even when a 10-fold excess was used relative to what expected to be used for cellular imaging. The photostability of NIM-7 was also tested. Under conditions of CLSM imaging in HeLa cells, ca. 90% of the original fluorescence intensity remained after 15 min of irradiation (Fig. S2b†). On the basis of these predicative studies, we considered it worth testing NIM-7 in the context of cellular imaging.
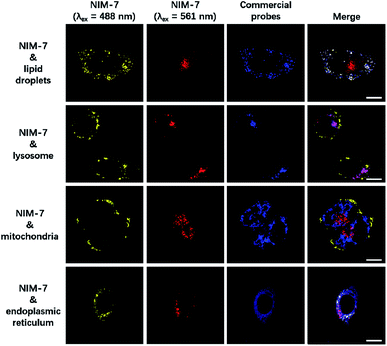
A first set of CLSM imaging studies were carried out using HeLa cells incubated in the presence of NIM-7. As shown in Fig. 1 (first panel), after excitation at 488 nm, the cells were characterized by the presence of dozens of yellow fluorescent spots which nicely colocalized with a commercially available dye (HCS LipidTOX™ Deep Red Neutral Lipid Stain) for lipid imaging. Upon excitation at 561 nm, numerous red fluorescent spots were observed; again, these were found to colocalize with commercial dye (LysoTracker® Blue DND-22) for lysosome imaging (Fig. 1, second panel). However, these two fluorescent signals do not colocalize with two other organelle-specific dyes, namely MitoTracker™ Deep Red FM and ER-Tracker™ Blue-White DPX that are used to probe the mitochondrion and the endoplasmic reticulum, respectively. Moreover, an analysis of the merger of the two excitation outputs (yellow and red) seen for NIM-7 provides support for the contention that the two signals are not located in the same subcellular zone. We thus infer that the signals are derived from the two targeted organelles, LDs and lysosomes. NIM-7 was also tested in several other cell lines, such as HepG2, Hep3B, and IMCD3. The results, presented in Fig. S3,† are consistent with the notion that NIM-7 can be used as a general probe to visualize simultaneously LDs and lysosomes in a range of cell lines.
To obtain insights into the localization mechanism of NIM-7 in living cells, we disrupted the acidic microenvironment characteristic of lysosomes by adding chloroquine (CQ), which can elevate the pH of the lysosome from 4.5 to 6.5.15,18 After pre-incubation with 50 μM CQ for 0.5 h, a lower level of NIM-7 accumulation in lysosomes was observed compared to the untreated case (Fig. S4†). However, this pretreatment did not influence the LD-based signal produced by NIM-7 (Fig. S4b and e†).
It is recognized that LDs are highly dynamic organelles, particularly in the face of an energy shortage. Previous studies have led to an appreciation that autophagy can regulate lipid metabolism under conditions of nutrient deprivation, events that involve the lysosomes.19 Several of the authors have also shown that the contents of lipid droplets can be metabolized during glucose starvation.20 Therefore, an effort was made to test whether NIM-7 could be used to observe the dynamics of lipid droplet change in cells deprived of glucose. As shown in Fig. S5,† the number of lipid droplets decreased dramatically after IMCD3 cells were cultured for 12 h culture in the absence of glucose. However, no obvious changes on lysosome number were observed. We thus believe that protonation within the acidic microenvironments of lysosomes is the key factor that allows NIM-7 to be used for labelling lysosomes, while the hydrophobicity of NIM-7 permits its use in visualizing hydrophobic LDs.
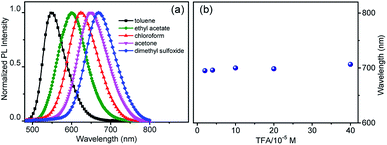
To explain the imaging colour of NIM-7 in these two organelles, the photophysical behaviour of NIM-7 in solvents with different polarities was investigated. As shown in Fig. 2a and Table S1,† the photoluminescence (PL) emission spectra of NIM-7 displayed apparent positive solvatochromism; i.e., with increasing solvent polarity, the emission maximum of NIM-7 was red-shifted [e.g., λPLmax = 549 nm in toluene; λPLmax = 670 nm in dimethyl sulfoxide (DMSO)]. Quantum yields that decreased with polarity were also seen (e.g., φPL = 0.81 in Tol, φPL = 0.015 in DMSO).16 In mixtures of Tol + DMSO, intermediate behaviour was seen that was a clear function of the solvent ratio (Fig. S6†). Such spectral changes are consistent with strong intramolecular charge transfer (ICT) character in the lowest singlet excited state. However, as can be seen from an inspection of Fig. 2b, the emission wavelength of NIM-7 is insensitive to the pH in a mixture of DMSO/H2O (v/v, 75/25).
Taking into consideration that NIM-7 is hydrophobic (Fig. S7†), as well as the fact that fetal serum albumin (FSA) is present in the culture medium and that NIM-7 may interact with this and other proteins, we carried out imaging experiments with bovine serum albumin (BSA) either present in, or absent from, the medium. As shown in Fig. S8,† we found that protein in fact plays an important role in the internalization of NIM-7. In the absence of serum, the localization of NIM-7 in both lipid droplets and lysosomes decreased. However, the expectation that BSA or other proteins would be present under most conditions of use, led us to explore whether NIM-7 could be used to probe the microenvironments of LDs and lysosomes.
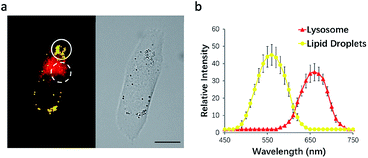
To test this possibility, HeLa cells were incubated with NIM-7. The fluorescence emission features of the cells were then recorded. As shown in Fig. 3a, the lipid droplet-rich and lysosome-rich zones gave rise to very different emission spectra (Fig. 3b). As noted above, relative to LDs, lysosomes constitute more polar microenvironments characterized by relatively high acidity. These organelles give rise to fluorescence emission features that are similar to those of NIM-7 in DMSO. In contrast, the lipid-rich microenvironments of LDs are reflected in a fluorescence emission spectrum for NIM-7 that resembles that produced in toluene. These differences provide support for the contention that NIM-7 may be used to visualize simultaneously both lipid droplets and lysosomes.
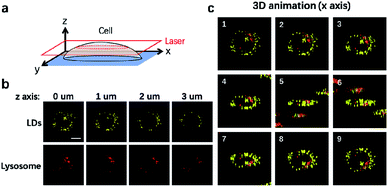
It is well-established that cells are complex three-dimensional objects with organelles distributed in different subcellular zones. CLSM is usually used to capture single layer information upon imaging. CLSM can also be applied to scan different layers of the cells through the z axis to obtain 3D information (Fig. 4a). We thus used CLSM to carry out 3D imaging of LDs and lysosomes in NIM-7 stained HeLa cells. As shown in Fig. 4b, the cellular distribution and numbers of these two organelles were found to be different at each layer along the z axis. From the resulting information, we are able to generate a 3D image of the cells in question (Fig. 4c).
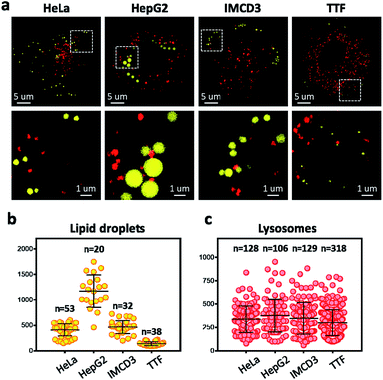
To overcome the diffraction limit associated with conventional fluorescent microscopy and obtain high-resolution images of lysosomes and LDs, we performed super-resolution imaging of NIM-7 in cells using a structured illumination microscope (SIM). Four cell lines were chosen for these studies. The first were HeLa (human cervical cancer) and HepG2 (human liver cancer) cells. Both are human cancer cells. The third and fourth were the IMCD3 (mouse inner medullary collecting duct cell) and TTF (mouse tail-tip fibroblast) cell lines; both are mouse normal cells. Super-resolution imaging of the lysosomes and LDs allowed the structures of these two organelles to be imaged at a higher level than possible using traditional confocal microscopy (Fig. 5a, lower panel). In fact, we could measure quantitatively the number and diameter of the two organelles as established by previous studies.21 Compared to the HeLa cells (mean = 408 nm), the HepG2 cells (mean = 1173 nm) are generally contain much larger LDs (Fig. 5b). In the mouse cells, the diameter of the LDs from TTF (mean = 465 nm) is smaller than the ones from IMCD3 cells (mean = 135 nm). However, TTF cells have many more lysosomes than IMCD3 cells (Fig. 5c). These results suggested that NIM-7 can be used to support super-resolution imaging of LDs and lysosomes with good specificity.
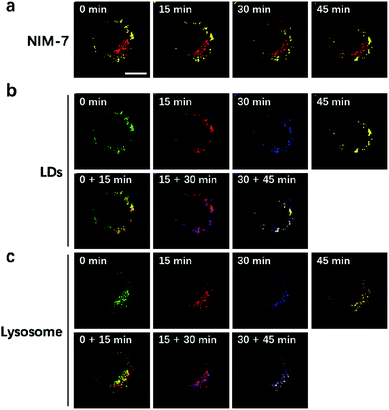
LDs and lysosomes are not static. They typically move within the cytoplasm, presumably to affect more efficiently their dedicated biological functions. To date, only a few reports involving the dynamic tracking lipid droplets20,22 or lysosomes15b,23 have appeared in the literature. Encouraged by the good specificity, high photostability, and low cytotoxicity of NIM-7, it was applied to track concurrently the movement of LDs and lysosomes within HeLa cells. As true in our previous reports,15b,20 both LDs and lysosomes were seen to move quickly over the course of a short observation period (15 min, Fig. 6). Specifically, during a 45 minute imaging window, over 90% of these two organelles had moved under normal culture conditions. Of note, the fluorescence intensity did not show an obvious decrease during the imaging time (cf. Fig. S2b†).
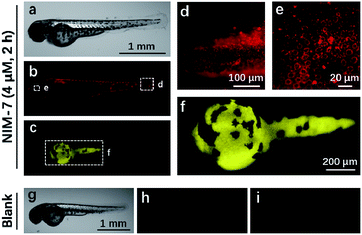
Zebrafish (Danio rerio), have been widely used as a model vertebrate organism.24 We thus sought to test if NIM-7 could be used to visualize lysosomes and lipid-rich tissue in living zebrafish. Predicative studies revealed that NIM-7 displays good photostability and little toxicity in zebrafish embryos (Fig. S2 and S9†). Thus zebrafish embryos (3 days post-fertilization, pdf) were labelled with 4 μM NIM-7 for 2 h. Under the green channel, no obvious staining pattern was noted in an overall view (Fig. 7b). However, upon zooming in, a classic lysosome staining pattern could be observed from the lower portion of the eye to the tail of the embryo (Fig. 7d and e). Such a finding provides qualitative support for the suggestion that NIM-7 may be used to visualize lysosomes in vivo. To confirm this inference, we treated the zebrafish embryos with CQ (200 μM) for 2 h followed by NIM-7 staining (4 μM) for another 2 h. However, there were no obvious red fluorescent spots observed (Fig. S10†). We thus conclude that NIM-7 may be used to visualize lysosomes in zebrafish embryos. We also imaged the stained embryos using a blue channel. Under these imaging conditions, the yolk sac showed yellow fluorescence (Fig. 7c and f). The embryonic yolk zone is well-known to be lipid-rich, thus this result provides support for the notion that NIM-7 may be useful for imaging yolk lipids, as has been seen for other hydrophobic dyes.25
Conclusions
In summary, a fluorescent probe (NIM-7) has been developed that allows for the specific and concurrent imaging of both LDs (or lipid-rich tissue) and lysosomes in cell lines and zebrafish embryos. NIM-7 accumulates in lipid droplets, a microenvironment rich in neutral lipids, where it gives rise to an easy-to-discern yellow fluorescence. NIM-7 also accumulates in lysosomes, a classic acidic microenvironment, where it displays red fluorescence. This probe is able to visualize LDs and lysosomes via super-resolution microscopy. It also allows 3D imaging and real-time tracking using CLSM. To the best of our knowledge, this is the first small-molecule fluorescent probe to stain LDs and lysosomes specifically through different fluorescent emission colours. It and other dual imaging probes may thus emerge as useful tools for quantifying and characterizing various subcellular microenvironments.Conflicts of interest
There are no conflicts to declare.Acknowledgements
We gratefully acknowledge financial support from the Foundation for Innovative Research Groups of the National Natural Science Foundation (No. 21721005), the Shenzhen Peacock Plan (KQTD20170330110107046), the National Basic Research Program of China (973 Program 2013CB933903), the National Natural Science Foundation of China (No. 91433201 and No. 81621003), and Shanghai University.Notes and references
- (a) R. H. Eckel, K. Alberti, S. M. Grundy and P. Z. Zimmet, J.-Lancet, 2010, 375, 181 CrossRef; (b) T. C. Walther and R. V. Farese, Biochim. Biophys. Acta, Mol. Cell Biol. Lipids, 2009, 1791, 459 CrossRef CAS PubMed; (c) L. Kuerschner, C. Moessinger and C. Thiele, Traffic, 2008, 9, 338 CrossRef CAS PubMed.
- (a) B. Turk, D. Turk and V. Turk, Biochim. Biophys. Acta, Protein Struct. Mol. Enzymol., 2000, 1477, 98 CrossRef CAS; (b) V. Turk, B. Turk and D. Turk, EMBO J., 2001, 20, 4629 CrossRef CAS PubMed.
- (a) A. H. Mokdad, E. S. Ford, B. A. Bowman, W. H. Dietz, F. Vinicor, V. S. Bales and J. S. Marks, JAMA, 2003, 289, 76 CrossRef PubMed; (b) W. Rathmann and G. Giani, Diabetes Care, 2004, 27, 2568 CrossRef PubMed; (c) K. F. Adams, A. Schatzkin, T. B. Harris, V. Kipnis, T. Mouw, R. Ballard-Barbash, A. Hollenbeck and M. F. Leitzmann, N. Engl. J. Med., 2006, 355, 763 CrossRef CAS PubMed.
- (a) C. Jedeszko and B. F. Sloane, Biol. Chem., 2004, 385, 1017 CAS; (b) N. Fehrenbacher and M. Jäättelä, Cancer Res., 2005, 65, 2993 CrossRef CAS PubMed.
- (a) S. Atilgan, T. Ozdemir and E. U. Akkaya, Org. Lett., 2008, 10, 4065 CrossRef CAS PubMed; (b) K. C. Ko, J.-S. Wu, H. J. Kim, P. S. Kwon, J. W. Kim, R. A. Bartsch, J. Y. Lee and J. S. Kim, Chem. Commun., 2011, 47, 3165 RSC; (c) Z. Guo, S. Nam, S. Park and J. Yoon, Chem. Sci., 2012, 3, 2760 RSC; (d) B. Rout, L. Unger, G. Armony, M. A. Iron and D. Margulies, Angew. Chem., Int. Ed., 2012, 51, 12477 CrossRef CAS PubMed; (e) M. H. Lee, B. Yoon, J. S. Kim and J. L. Sessler, Chem. Sci., 2013, 4, 4121 RSC; (f) A. Atilgan, E. Tanriverdi Eçik, R. Guliyev, T. B. Uyar, S. Erbas-Cakmak and E. U. Akkaya, Angew. Chem., Int. Ed., 2014, 53, 10678 CrossRef CAS PubMed; (g) S. Bhuniya, S. Maiti, E. J. Kim, H. Lee, J. L. Sessler, K. S. Hong and J. S. Kim, Angew. Chem., Int. Ed., 2014, 53, 4469 CrossRef CAS PubMed; (h) Y. Nissinkorn, N. Lahav-Mankovski, A. Rabinkov, S. Albeck, L. Motiei and D. Margulies, Chem.–Eur. J., 2015, 21, 15981 CrossRef CAS PubMed; (i) K. Selvakumar, L. Motiei and D. Margulies, J. Am. Chem. Soc., 2015, 137, 4892 CrossRef CAS PubMed; (j) H. S. Jung, J.-H. Lee, K. Kim, S. Koo, P. Verwilst, J. L. Sessler, C. Kang and J. S. Kim, J. Am. Chem. Soc., 2017, 139, 9972 CrossRef CAS PubMed; (k) J. Li, N. Kwon, Y. Jeong, S. Lee, G. Kim and J. Yoon, ACS Appl. Mater. Interfaces, 2018, 10, 12150 CrossRef CAS PubMed; (l) Q. Gong, R. Zou, J. Xing, L. Xiang, R. Zhang and A. Wu, Adv. Sci., 2018, 5, 1700664 CrossRef PubMed; (m) B. Gu and Q. Zhang, Adv. Sci., 2018, 5, 1700609 CrossRef PubMed; (n) X. Xue, S. Jin, Z. Li, C. Zhang, W. Guo, L. Hu, P. C. Wang, J. Zhang and X.-J. Liang, Adv. Sci., 2017, 4, 1700229 CrossRef PubMed; (o) L. Yuan, W. Lin, K. Zheng and S. Zhu, Acc. Chem. Res., 2013, 46, 1462 CrossRef CAS PubMed; (p) L. Yuan, W. Lin, K. Zheng, L. He and W. Huang, Chem. Soc. Rev., 2013, 42, 622 RSC; (q) L. Yuan, W. Lin, S. Zhao, W. Gao, B. Chen, L. He and S. Zhu, J. Am. Chem. Soc., 2012, 134, 13510 CrossRef CAS PubMed.
- (a) O. A. Bozdemir, R. Guliyev, O. Buyukcakir, S. Selcuk, S. Kolemen, G. Gulseren, T. Nalbantoglu, H. Boyaci and E. U. Akkaya, J. Am. Chem. Soc., 2010, 132, 8029 CrossRef CAS PubMed; (b) A. P. de Silva and S. Uchiyama, Nat. Nanotechnol., 2007, 2, 399 CrossRef CAS PubMed.
- (a) J. Y. Lee, S. K. Kim, J. H. Jung and J. S. Kim, J. Org. Chem., 2005, 70, 1463 CrossRef CAS PubMed; (b) S. Y. Park, J. H. Yoon, C. S. Hong, R. Souane, J. S. Kim, S. E. Matthews and J. Vicens, J. Org. Chem., 2008, 73, 8212 CrossRef CAS PubMed; (c) R. Guliyev, S. Ozturk, Z. Kostereli and E. U. Akkaya, Angew. Chem., 2011, 123, 10000 CrossRef; (d) Z. Guo, N. R. Song, J. H. Moon, M. Kim, E. J. Jun, J. Choi, J. Y. Lee, C. W. Bielawski, J. L. Sessler and J. Yoon, J. Am. Chem. Soc., 2012, 134, 17846 CrossRef CAS PubMed; (e) M. Ishida, P. Kim, J. Choi, J. Yoon, D. Kim and J. L. Sessler, Chem. Commun., 2013, 49, 6950 RSC; (f) Y. Yeon, S. Leem, C. Wagen, V. M. Lynch, S. K. Kim and J. L. Sessler, Org. Lett., 2016, 18, 4396 CrossRef CAS PubMed.
- (a) L. Long, M. Huang, N. Wang, Y. Wu, K. Wang, A. Gong, Z. Zhang and J. L. Sessler, J. Am. Chem. Soc., 2018, 140, 1870 CrossRef CAS PubMed; (b) Y. Baek, S. J. Park, X. Zhou, G. Kim, H. M. Kim and J. Yoon, Biosens. Bioelectron., 2016, 86, 885 CrossRef CAS PubMed; (c) L. Motiei, Z. Pode, A. Koganitsky and D. Margulies, Angew. Chem., Int. Ed., 2014, 53, 9289 CrossRef CAS PubMed; (d) M. H. Lee, J. H. Han, J. H. Lee, N. Park, R. Kumar, C. Kang and J. S. Kim, Angew. Chem., Int. Ed., 2013, 52, 6206 CrossRef CAS PubMed; (e) L. Li, X. Shen, Q. H. Xu and S. Q. Yao, Angew. Chem., Int. Ed., 2013, 52, 424 CrossRef CAS PubMed; (f) L. Unger-Angel, B. Rout, T. Ilani, M. Eisenstein, L. Motiei and D. Margulies, Chem. Sci., 2015, 6, 5419 RSC; (g) Z. Pode, R. Peri-Naor, J. M. Georgeson, T. Ilani, V. Kiss, T. Unger, B. Markus, H. M. Barr, L. Motiei and D. Margulies, Nat. Nanotechnol., 2017, 12, 1161 CrossRef CAS PubMed; (h) W. Xu, Z. Zeng, J.-H. Jiang, Y.-T. Chang and L. Yuan, Angew. Chem., Int. Ed., 2016, 55, 13658 CrossRef CAS PubMed; (i) Y. Liu, J. Niu, W. Wang, Y. Ma and W. Lin, Adv. Sci., 2018, 5, 1700966 CrossRef PubMed.
- S. W. Hell and J. Wichmann, Opt. Lett., 1994, 19, 780 CrossRef CAS PubMed.
- M. G. Gustafsson, J. Microsc., 2000, 198, 82 CrossRef CAS PubMed.
- M. J. Rust, M. Bates and X. Zhuang, Nat. Methods, 2006, 3, 793 CrossRef CAS PubMed.
- E. Betzig, G. H. Patterson, R. Sougrat, O. W. Lindwasser, S. Olenych, J. S. Bonifacino, M. W. Davidson, J. Lippincott-Schwartz and H. F. Hess, Science, 2006, 313, 1642 CrossRef CAS PubMed.
- S. W. Hell, Science, 2007, 316, 1153 CrossRef CAS PubMed.
- B. Huang, H. Babcock and X. Zhuang, Cell, 2010, 143, 1047 CrossRef CAS PubMed.
- (a) X. Zheng, W. Zhu, D. Liu, H. Ai, Y. Huang and Z. Lu, ACS Appl. Mater. Interfaces, 2014, 6, 7996 CrossRef CAS PubMed; (b) W. Zhu, X. Zheng, Y. Huang, Z. Lu and H. Ai, Sci. China: Chem., 2018, 61, 483 CrossRef CAS.
- H.-H. Lin, Y.-C. Chan, J.-W. Chen and C.-C. Chang, J. Mater. Chem., 2011, 21, 3170 RSC.
- (a) F. K. Fan, S. Nie, D. M. Yang, M. J. Luo, H. Shi and Y. H. Zhang, Bioconjugate Chem., 2012, 23, 1309 CrossRef CAS PubMed; (b) X. F. Zhang, C. Wang, Z. Han and Y. Xiao, ACS Appl. Mater. Interfaces, 2014, 6, 21669 CrossRef CAS PubMed; (c) M. H. Li, Y. T. Wang, G. J. Liu, H. J. Lu and G. W. Xing, Chin. J. Org. Chem., 2017, 37, 356 CrossRef CAS.
- F. Yu, Y. Wang, W. C. Zhu, Y. Huang, M. H. Yang, H. Ai and Z. Y. Lu, RSC Adv., 2014, 4, 36849 RSC.
- R. Singh, S. Kaushik, Y. Wang, Y. Xiang, I. Novak, M. Komatsu, K. Tanaka, A. M. Cuervo and M. J. Czaja, Nature, 2009, 458, 1131 CrossRef CAS PubMed.
- X. Zheng, W. Zhu, F. Ni, H. Ai and C. Yang, Sens. Actuators, B, 2018, 255, 3148 CrossRef CAS.
- (a) R. Perera, S. Stoykova, B. N. Nicolay, K. N. Ross, J. Fitamant, M. Boukhali, J. Lengrand, V. Deshpande, M. K. Selig, C. R. Ferrone, J. Settleman, G. Stephanopoulos, N. J. Dyson, R. Zoncu, S. Ramaswamy, W. Haas and N. Bardeesy, Nature, 2015, 524, 361 CrossRef CAS PubMed; (b) R. Allison, J. R. Edgar, G. Pearson, T. Rizo, T. Newton, S. Gunther, F. Berner, J. Hague, J. W. Connell, J. Winkler, J. Lippincott-Schwartz, C. Beetz, B. Winner and E. Reid, J. Cell Biol., 2017, 216, 1337 CrossRef CAS PubMed; (c) C. M. Blouin, S. Le Lay, A. Eberl, H. C. Kofeler, I. C. Guerrera, C. Klein, X. Le Liepvre, F. Lasnier, O. Bourron, J. F. Gautier, P. Ferre, E. Hajduch and I. Dugail, J. Lipid Res., 2010, 51, 945 CrossRef CAS PubMed; (d) Y. Y. Chau, R. Bandiera, A. Serrels, O. M. Martinez-Estrada, W. Qing, M. Lee, J. Slight, A. Thornburn, R. Berry, S. McHaffie, R. H. Stimson, B. R. Walker, R. M. Chapuli, A. Schedl and N. Hastie, Nat. Cell Biol., 2014, 16, 367 CrossRef CAS PubMed.
- M. Gao, H. Su, S. Li, Y. Lin, X. Ling, A. Qin and B. Z. Tang, Chem. Commun., 2017, 53, 921 RSC.
- (a) Y. M. Ho, N. P. Au, K. L. Wong, C. T. Chan, W. M. Kwok, G. L. Law, K. K. Tang, W. Y. Wong, C. H. Ma and M. H. Lam, Chem. Commun., 2014, 50, 4161 RSC; (b) M. Grossi, M. Morgunova, S. Cheung, D. Scholz, E. Conroy, M. Terrile, A. Panarella, J. C. Simpson, W. M. Gallagher and D. F. O'Shea, Nat. Commun., 2016, 7, 10855 CrossRef CAS PubMed.
- (a) G. J. Lieschke and P. D. Currie, Nat. Rev. Genet., 2007, 8, 353 CrossRef CAS PubMed; (b) V. E. Fako and D. Y. Furgeson, Adv. Drug Delivery Rev., 2009, 61, 478 CrossRef CAS PubMed; (c) S. K. Ko, X. Chen, J. Yoon and I. Shin, Chem. Soc. Rev., 2011, 40, 2120 RSC.
- (a) K. S. Jones, A. P. Alimov, H. L. Rilo, R. J. Jandacek, L. A. Woollett and W. T. Penberthy, Nutr. Metab., 2008, 5, 23 CrossRef PubMed; (b) Y. F. Kang, Y. H. Li, Y. W. Fang, Y. Xu, X. M. Wei and X. B. Yin, Sci. Rep., 2015, 5, 11835 CrossRef PubMed.
Footnotes |
| † Electronic supplementary information (ESI) available: Experimental details, spectroscopic and cell imaging data, and 1H NMR, 13C NMR, HRMS and HPLC spectra. See DOI: 10.1039/c8sc04462g |
| ‡ These authors contributed equally to this work. |
| This journal is © The Royal Society of Chemistry 2019 |

![[thin space (1/6-em)]](https://www.rsc.org/images/entities/char_2009.gif) :
: