 Open Access Article
A simple yet effective AIE-based fluorescent nano-thermometer for temperature mapping in living cells using fluorescence lifetime imaging microscopy†
Hui
Gao
ab,
Chuen
Kam
a,
Tsu Yu
Chou
a,
Ming-Yu
Wu
 ac,
Xin
Zhao
 d and
Sijie
Chen
 *a
*a
aMing Wai Lau Centre for Reparative Medicine, Karolinska Institutet, Hong Kong, China. E-mail: sijie.chen@ki.se
bSchool of Aeronautic Science and Engineering, Beihang University, Beijing, China
cSchool of Life Science and Engineering, Southwest Jiaotong University, Chengdu 610031, China
dDepartment of Biomedical Engineering, The Hong Kong Polytechnic University, Hong Kong, China
First published on 27th November 2019
Abstract
We designed and synthesized a novel nano-thermometer using aggregation-induced-emission (AIE) dye as the reporter and household butter as the matrix. This temperature nanosensor showed decreased fluorescence intensities (∼2%/°C) and shorter fluorescence lifetimes (∼0.11 ns/°C) upon increasing the environmental temperature in the physiological temperature range. Such fluorescence responses were reversible and independent of the environmental pH and ionic strength. The application of these nano-thermometers in temperature sensing in living cells using fluorescence lifetime imaging microscopy (FLIM) was also demonstrated. To the best of our knowledge, this is the first example of AIE-based nano-thermometer for temperature sensing in living cells. This work also provides us with a simple and low-cost method for rapid fabrication of an effective nanosensor based on AIE mechanism.
New conceptsTemperature is a fundamental and important parameter in living organisms. Not until recently have researchers successfully used fluorescent thermometers to measure temperature in single cell. Nonetheless, those temperature sensing tools, such as fluorescent polymeric thermometers, possess complex structures and require tedious fabrication procedures. This very much limits the choice and application of cellular thermometers as a tool for the analysis of the physiological status. We report here a novel design of a fluorescent thermometer containing household butter as a temperature-responsive matrix and aggregation-induced-emission (AIE)-active dye as a reporter which is simple to fabricate. By using hexaphenyl-1H-silole as an example of AIEgen, we showed that this nano-thermometer was sensitive to temperature change with a high temperature resolution. The readout of fluorescence intensity and fluorescence lifetime had a good reversibility and were independent of the environmental pH and ionic strength. Intracellular temperature mapping in living cells was also achieved using a fluorescence lifetime imaging microscope. Conceptually, our design is applicable to every AIEgen that is sensitive to temperature-induced viscosity change of the matrix microenvironment, thus leading to vast possibilities of choosing AIEgens with different emission wavelengths as reporters. This study provides a new concept of cellular nano-thermometers with an experimentally demonstrated example. |
Introduction
Temperature is a fundamental parameter in life sciences because it affects every biochemical reaction, including the enzyme activity, gene expression, cell division and energy metabolism, inside living cells.1,2 At the cellular level, mild hyperthermia enhances differentiation of T lymphocytes into effector cells,3 whereas mild hypothermia favours proliferation of oligodendrocyte precursor cells.4 The abnormal temperature is usually associated with disease states such as tumours or inflammation. Indeed, pathological studies reveal that malignant cells within tissues show higher temperature compared with healthy cells because of the increased metabolic rate.2 Besides, recent studies on stem cell biology reveal that temperature modulates differentiation of adipocytes from bone marrow stem cells and it is critical for the functionality of induced pluripotent stem cell derived cardiomyocytes.5,6 Hence, accurate temperature measurement in cells is important as it may help physicians to understand physiological conditions and promote early diagnosis and therapies.7,8Unfortunately, accurate detection of the local temperature in the single-cell level is still challenging.9 Conventional techniques and devices such as thermography and thermocouples are sensitive and accurate, but they show low spatial resolution (up to 10 μm) and cannot measure the temperature in a small confined space, for example, within an individual cell.2 On the other hand, fluorescent sensors have good sensitivity, high spatial resolution, fast response and are minimally invasive, which make them particularly useful for biological applications.8,10 Fluorescent temperature sensors based on rare-earth doped nanoparticles,11,12 semiconducting quantum dots,2,13 metal nanoclusters,14,15 and small organic dyes16,17 have been proposed and widely studied in the past few decades. To reduce the cytotoxicity, surface modification is necessary for these rare-earth doped materials, semiconducting quantum dots (e.g., CdSe, CdTe, etc.) and metal nanoclusters.18 In comparison, organic dyes are more compatible with living cells. However, most of the conventional organic dyes have limited sensitivity to the physiological temperature changes on their own or their fluorescence can be easily interfered by the ionic strength/pH changes.17 To fabricate a fluorescent temperature sensor, researchers covalently link a fluorescent reporter to temperature-responsive polymers, usually poly(N-isopropylacrylamide) (PNIPAM) or its co-polymers.16 PNIPAM has increased hydrophobicity and becomes insoluble above its critical temperature which is close to human body temperature.19 By conjugating a viscosity-sensitive or solvent polarity-sensitive small organic fluorescent dye to the polymer, the phase transition of the polymer can be reported, and a fluorescent thermometer is constructed. However, chemical modification of a polymer with fluorescent dyes involves complex, harsh and high-cost synthetic processes.1 Few of them have been applied in sensing the temperature in cells.1 A simple, interference-resistant and cost-effective fluorescent thermometer that can be used for bioimaging is still highly desirable.
Fluorophores with aggregation-induced emission (AIE) properties are now widely used as biosensors.20–28 The fluorescence turn-on property of these probes is largely attributed to the restriction of intramolecular motion. They are inherently sensitive to microenvironmental viscosity since the viscous environment results in reduced intramolecular motion that leads to enhanced fluorescence intensity and prolonged fluorescence lifetime of AIE molecules.29,30 Several AIE-based PNIPAM fluorescent temperature sensors have been reported.22–28 These AIE probes are excellent reporters; however, like other dye-PNIPAM sensors, considerable synthetic effort are needed for the fabrication of AIE-PNIPAM sensors and the application of these sensors in cells has not been well demonstrated yet.
In this contribution, we developed a simple yet effective temperature sensing system that could be applied in detecting intracellular temperature based on the AIE nanostructure. This system utilized butter, a cheap, biocompatible and common dairy product with a phase change temperature close to the human body temperature, as the matrix. The viscosity of the matrix decreased with an increase in temperature. An AIE dye was used as the reporter which reflected changes in viscosity in the micro-environment. 1,2-Distearoyl-sn-glycero-3-phosphoethanolamine-N-(biotin[polyethylene-glycol]-2000-Biotin) (DSPE-PEG-Biotin) was used as a surfactant to stabilize the nanostructure. The AIE/Butter/DSPE-PEG-Biotin nanostructure could be easily synthesized by mixing all three components while sonicating followed by organic solvent removal. These nanostructures could serve as a robust nano-thermometer by showing differences in fluorescence intensities and fluorescence lifetimes at different temperatures. Since the reporter was encapsulated inside butter/DSPE-PEG-Biotin, the signal from the reporter showed high resistance to pH or ionic strength changes. The application of the nano-thermometer in fluorescence lifetime imaging of live cells was also demonstrated.
Results and discussion
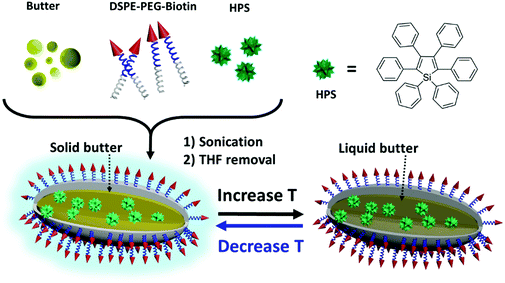
We chose butter as the thermosensitive matrix material and AIE dye as the reporter. With a low critical temperature, butter undergoes a reversible phase transition and experiences viscosity changes in a range of temperatures near the body temperature of humans and most animals.31–34 Theoretically, most AIE dyes can be used as a reporter of microenvironmental viscosity changes in the designed system. To demonstrate the feasibility, hexaphenyl-1H-silole (HPS), a typical AIE dye, was chosen as a model AIE dye and used as the reporter to convert the temperature-induced phase change of butter into photoluminescence signal differences, thus facilitating the detection via a fluorescence spectrometer. In particular, the weight ratio of HPS to butter was well controlled at 1![[thin space (1/6-em)]](https://www.rsc.org/images/entities/char_2009.gif) :
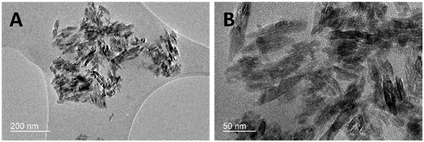
:![[thin space (1/6-em)]](https://www.rsc.org/images/entities/char_2009.gif) 10 to ensure that the nanostructure possessed high thermosensitivity. As shown in Scheme 1, HPS molecules were trapped inside the butter matrix and the whole nanostructure was stabilized by the surfactant, DSPE-PEG-Biotin. The properties of the resulting nanostructure were studied in detail. TEM images in Fig. 1 revealed that the HPS/Butter/DSPE-PEG-Biotin nanostructure had a rod-like morphology of around 25 nm in width and 50–150 nm in length. Besides, DLS measurements showed that the hydrodynamic radius of the HPS/Butter/DSPE-PEG-Biotin nanostructure was around 160 nm (Fig. S1, ESI†), which matched with the TEM results well. Hereafter, the nanostructure will be referred to as a nanorod. The zeta potential test revealed that such a nanorod was negatively charged, showing a zeta potential of around −50 mV.
10 to ensure that the nanostructure possessed high thermosensitivity. As shown in Scheme 1, HPS molecules were trapped inside the butter matrix and the whole nanostructure was stabilized by the surfactant, DSPE-PEG-Biotin. The properties of the resulting nanostructure were studied in detail. TEM images in Fig. 1 revealed that the HPS/Butter/DSPE-PEG-Biotin nanostructure had a rod-like morphology of around 25 nm in width and 50–150 nm in length. Besides, DLS measurements showed that the hydrodynamic radius of the HPS/Butter/DSPE-PEG-Biotin nanostructure was around 160 nm (Fig. S1, ESI†), which matched with the TEM results well. Hereafter, the nanostructure will be referred to as a nanorod. The zeta potential test revealed that such a nanorod was negatively charged, showing a zeta potential of around −50 mV.
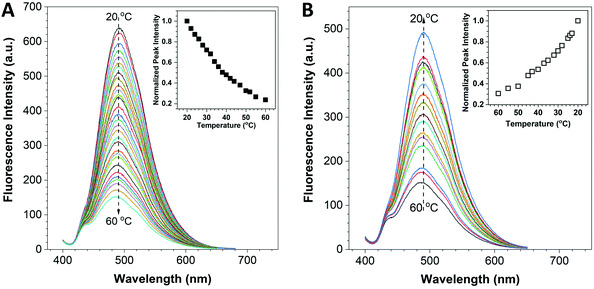
The fluorescence response of the HPS/Butter/DSPE-PEG-Biotin nanorod to temperature was investigated using a fluorescence spectrometer. The UV-vis absorption spectra of Butter/DSPE-PEG-Biotin (the control sample) and the HPS/Butter/DSPE-PEG-Biotin nanorod at the same concentration are given in Fig. S2 (ESI†), which indicate that the control nanorod displayed nearly zero absorbance around 370 nm while the HPS incorporated nanorod and HPS aggregates showed an obvious absorption peak at around 370 nm. The Butter/DSPE-PEG-Biotin particle showed negligible signal at 490 nm when excited at 375 nm (Fig. S4, ESI†). The fluorescence spectra of the HPS/Butter/DSPE-PEG-Biotin nanorod are shown in Fig. 2, which demonstrated that the emission intensity of the nanorod solution had a remarkable temperature-dependent property. When increasing the temperature from 20 to 60 °C, fluorescence intensities at 490 nm decreased gradually, as displayed in Fig. 2A. Data analysis indicates that the fluorescence intensity of the nanorod at 60 °C was only around 20% of that at 20 °C. Fig. 2B shows that the fluorescence intensity increased back in a reverse manner when decreasing the temperature to 20 °C. To further demonstrate its robust reversibility, the peak fluorescence intensity of HPS/Butter/DSPE-PEG-Biotin was recorded when adjusting the temperature repeatedly between 20 °C and 50 °C several times, as shown in Fig. S6 (ESI†). This reveals that the nanorod displayed a reliable reversibility. Additionally, the emission spectra in Fig. 2 revealed that there was almost no shift in the peak position. This implies that the nanorod has better stability than quantum dots since most quantum dots show a spectral shift upon changing the environmental temperature.35
The working mechanism of the nano-thermometer can be explained as follows (Scheme 1). The nano-thermometer is constructed by blending of an AIE dye, HPS, butter and DSPE-PEG-biotin. At low temperature, HPS molecules are structurally constrained in the solid butter matrix and thus exhibit bright fluorescence. When increasing the temperature, butter becomes softer and finally melts into liquid. The increase in temperature and liquefaction of butter reduce the confinement on HPS, promote the intramolecular motions of HPS and enable the excitons to decay through non-radiative pathways, which result in the decrease in the emission intensity.36–40
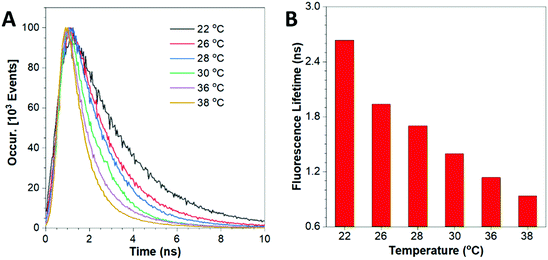
The thermo-sensitivity of this nano-probe can also be revealed by the variation in the fluorescence lifetime at different temperatures. As shown in Fig. 3, the fluorescence lifetime was 2.635 ns at 22 °C and decreased to 0.894 ns at 38 °C. These results display an accelerated decay trend of the HPS/Butter/DSPE-PEG-Biotin nanorod at higher temperature. The images of the corresponding nanorod taken using a FLIM are shown in Fig. S7 (ESI†). The prolonged fluorescence lifetime of the nano-probe at lower temperature is mainly due to the reduced intramolecular motion of HPS molecules at lower temperature and in the harder butter matrix.36–40 To further study the reversibility of fluorescence response of this nano-sensor to temperature variations, the temperature of the nanorod solution was repeatedly adjusted between 26 °C and 36 °C several times and the corresponding fluorescence lifetime was recorded, as shown in Fig. S8 (ESI†). These data suggest that their fluorescence responses are robust and last for multiple cycles, which is consistent with the result of peak fluorescence reversibility as shown in Fig. S6 (ESI†).
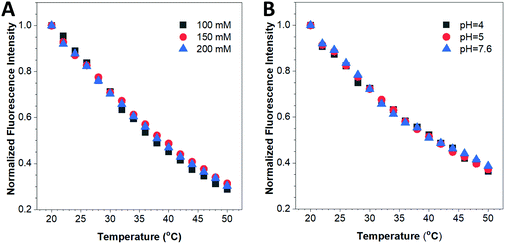
The biochemical environment in living cells is complex. For example, the ionic strength and pH vary in different subcellular compartments. Previous reports have demonstrated that emitting materials such as semiconducting quantum dots or small organic dyes show differences in their fluorescence properties such as the emission intensity and/or emission peak position when altering the environmental ion concentration or pH value.17,41 To ensure the accuracy and reliability of this fluorescent nanothermometer, influence of these biochemical factors on its optical properties has to be investigated. Fig. 4A reveals that the fluorescence response of the HPS/Butter/DSPE-PEG-Biotin nanorod was almost the same at different ionic strengths (100–200 mM NaCl). The fluorescence response was also confirmed to be independent of the environmental pH within the physiological pH range as displayed in Fig. 4B. Additionally, the as-prepared HPS/Butter/DSPE-PEG-Biotin nanorod showed prominent colloidal stability as no precipitate was observed in the nanorod suspension after storage at room temperature for five months (data not shown), which was largely due to its relatively high surface charge (around −50 mV). Hence, the HPS/Butter/DSPE-PEG-Biotin nanorod shows high sensitivity to temperature but is insensitive to physiological ionic strength and pH, demonstrating its promising potential for practical applications.
Cytotoxicity is another problem that limits the application of many luminescent thermometers in the field of biology. Prior to the bio-application of this nanoprobe in cells, we evaluated the cytotoxicity of the HPS/Butter/DSPE-PEG-Biotin nanorod towards cells by the CCK-8 assay. Data from Fig. S9 (ESI†) illustrate that the HPS/Butter/DSPE-PEG-Biotin nanorod had less than 10% reduction of cell viability below a concentration of 10 μg mL−1, which demonstrated its good biocompatibility.
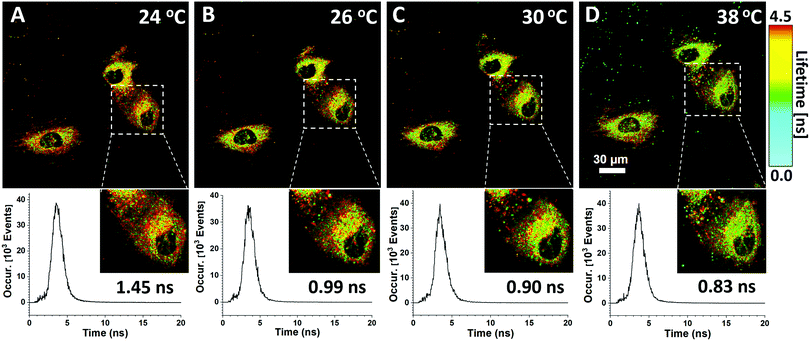
Both the fluorescence intensity and fluorescence lifetime of the HPS/Butter/DSPE-PEG-Biotin nanorod are responsive to temperature changes. Unlike the fluorescence intensity, the fluorescence lifetime is an intrinsic property of a fluorescent probe and largely independent of the fluorophore concentration or the excitation power under different experimental conditions.42 In a cell, probes are usually unevenly distributed that leads to a variation of fluorescence intensity. Therefore, the fluorescence lifetime of this nanoprobe is a better parameter for us to study the local temperature. In this regard, fluorescence lifetime imaging of the HPS/Butter/DSPE-PEG-Biotin nanorod in cells was employed for intracellular temperature mapping. The extracellular temperature was controlled using a heating stage equipped with a microscope system and a digital thermocouple. Fig. 5 shows fluorescence lifetime images of the HPS/Butter/Biotin nanorod endocytosed in HUVEC cells at different temperatures. Pseudocolor coding for different fluorescence lifetimes was shown in the FLIM image. Nanosensors both inside and outside HUVEC cells showed a longer fluorescence lifetime at lower temperature and a shorter lifetime when the stage was heated up as indicated by more red and green coloured pixels, respectively. The fluorescence lifetime of the nano-sensor within HUVEC cells became shorter when the temperature of culture medium was increased, indicating an elevated intracellular temperature. The insets in Fig. 5 show enlarged views of selected areas. The corresponding fluorescence decay profiles of the selected area at different temperatures showed that the fluorescence lifetime of the selected area was around 1.45 ns at 24 °C while it was only 0.83 ns at 38 °C. The heterogeneity of the fluorescence lifetime distribution inside the cell suggests that cells have diverse subcellular temperature and cultured cells do not have exactly the same temperature throughout the cytoplasm as the external environment. These results demonstrate that the HPS/Butter/DSPE-PEG-Biotin nanorod works well as a nano-thermometer and is suitable for intracellular temperature mapping using fluorescence lifetime imaging.
Conclusions
In this work, we have developed a novel oil dispersible AIEgen and butter-based nano-thermometer, which can be used for intracellular temperature sensing. The synthesized HPS/Butter/DSPE-PEG-Biotin nanomaterial has rod-like morphology, with a size of around 25 nm in width and 50–150 nm in length. It has good stability and biocompatibility. In particular, the fluorescence responses upon temperature change are reversible and are independent of the environmental pH and ionic strength within the physiological range. The potential application of such a nanorod in sensing the intracellular temperature was demonstrated for the first time via a FLIM using HUVEC cells as a cell-based model. It is expected that this work will inspire the development of more new AIE-based nano-sensors.Experimental methods
Materials
All chemicals were of analytical grade and were used as received. 1,1,2,3,4,5-Hexaphenyl-1H-silole (HPS) was obtained from Tokyo Chemical Industry Co., Ltd. Butter (unsalted, HERITAGE from Belgium) was purchased from a local shop. 1,2-Distearoyl-sn-glycero-3-phosphoethanolamine-N-[biotinyl(polyethylene glycol)-2000] biotin (DSPE-PEG-Biotin) was bought from NANOCS. NaCl and THF were received from J & K Scientific Ltd. Dulbecco's modified Eagle's medium (DMEM) was obtained from ThermoFisher, UK. Cell Counting Kit-8 was purchased from Beyotime Biotechnology, China. Ultrapure water was used throughout the whole experiment.Instruments
Fluorescence emission spectra were taken from a LS-55 fluorescence spectrophotometer (PerkinElmer). Transmission electron microscopy (TEM) experiments were performed with a transmission electron microscope (JEM-2100F) working at an accelerating voltage of 200 kV. Dynamic light scattering (DLS) experiments were conducted on a ZEN3600 Zetasizer nano ZS instrument (Malvern). The fluorescence lifetime decays and images of the nanorod solution as well as living cells endocytosed with nanorods were acquired on a Nikon C2 confocal microscope (Nikon) coupled with a 375 nm laser for excitation and a bandpass filter of 464–500 nm for fluorescence detection. The time-resolved fluorescence of the DSPE-PEG-Biotin nanorod was detected using a hybrid photomultiplier detector (PicoQuant) in a LSM Upgrade Kit (PicoQuant). A 375 nm laser was used in the excitation of FLIM. Data were collected and analysed by NIS-Elements (Nikon) software and SymPhoTime 64 (Picoquant) software.Nanorod synthesis
HPS/Butter/DSPE-PEG-Biotin nanorods were prepared by a facile nanoprecipitation method. In a typical procedure, HPS (0.2 mg), butter (2 mg) and DSPE-PEG-Biotin (0.5 mg) were dissolved in 1 mL of THF solution. The organic solution was then quickly poured into 10 mL of Milli-Q water under sonication for 4 min using an ultrasonic probe sonicator at 15 W output. Finally, THF in the solution was removed by evaporation, and the nanorods were obtained for further use.Temperature sensing
A thermostat water bath (TENLIN, DC-0506, China) and a digital thermocouple (LINI-T UT325 Thermometer) were used to control the solution temperature during the measurement of fluorescence emission via a LS-55 spectrometer. Generally, 2.5 mL of HPS/Butter/DSPE-PEG-Biotin solution (0.08 μg mL−1 depending on HPS concentration) was introduced into a quartz cuvette, and the corresponding fluorescence spectra of the solution were recorded at different temperatures ranging from 20 to 60 °C.Cell culture and fluorescence imaging
HeLa cells were culture in DMEM medium supplemented with 10% (v/v) fetal bovine serum (Gibco). HUVEC cells were cultured in vascular cell basal medium (ATCC) supplemented with endothelial cell growth kit-BBE (ATCC). Cell lines were maintained in the presence of 5% CO2 in a humidified incubator at 37 °C. For fluorescence imaging, cells were seeded in 35 mm glass bottom dishes (NEST) for 4 h to allow cell attachment and incubated with the HPS/Butter/DSPE-PEG-Biotin nanorod (dispersed in fresh cell culture medium, 0.8 μg mL−1 depending on HPS concentration) for 20 h. The cells were then washed with PBS three times, cultured in fresh medium and measured by fluorescence imaging.Cell viability assay
The cell viability was determined using the Cell Counting Kit-8 (CCK-8, Beyotime, China). HeLa cells (5 × 10⁴ cells per mL, 100 μL per well) were seeded in 96-well plates overnight before treatment. After attachment, the cells were then washed with PBS three times and exposed to HPS/Butter/DSPE-PEG-Biotin nanorods (dispersed in fresh cell culture medium) with the corresponding concentrations (0, 5, 10 and 20 μg mL−1) for 24 h. After each treatment, 10 μL of CCK-8 was added to each well and the cells were incubated at 37 °C for another 3 h. The absorbance of each well was then measured at a wavelength of 460 nm using a SpectraMax M2 microplate reader (Molecular Devices).Conflicts of interest
There are no conflicts to declare.Acknowledgements
We thank Dr Chunlei Zhu from Nankai University for the helpful discussion, Dennis Tsim from Chinetek Scientific (China) Ltd for assistance with fluorescence lifetime imaging, Qiang Zhang and Yu Tian from The Hong Kong Polytechnic University for assistance with TEM imaging, Li Liu from Southwest Jiaotong University for the DLS measurement and Alex Y. H. Wong from Karolinska Institutet for preparing the graphic image. S. Chen acknowledges the start-up funding from Ming Wai Lau Centre for Reparative Medicine, Karolinska Institutet and the support from the Innovation and Technology Commission (ITS/022/18, ITC, HK).Notes and references
- K. Okabe, N. Inada, C. Gota, Y. Harada, T. Funatsu and S. Uchiyama, Nat. Commun., 2012, 3, 705 CrossRef PubMed
.
- F. Ye, C. Wu, Y. Jin, Y. H. Chan, X. Zhang and D. T. Chiu, J. Am. Chem. Soc., 2011, 133, 8146–8149 CrossRef CAS PubMed
.
- T. A. Mace, L. Zhong, C. Kilpatrick, E. Zynda, C. T. Lee, M. Capitano, H. Minderman and E. A. Repasky, J. Leukocyte Biol., 2011, 90, 951–962 CrossRef CAS PubMed
.
- S. Imada, M. Yamamoto, K. Tanaka, C. Seiwa, K. Watanabe, Y. Kamei, S. Kozuma, Y. Taketani and H. Asou, J. Neurosci. Res., 2010, 88, 3457–3466 CrossRef CAS PubMed
.
- E. Laurila, A. Ahola, J. Hyttinen and K. Aalto-Setälä, Biochim. Biophys. Acta, Mol. Cell Res., 2016, 1863, 1864–1872 CrossRef CAS PubMed
.
- K. Velickovic, H. A. Lugo Leija, I. Bloor, J. Law, H. Sacks, M. Symonds and V. Sottile, Sci. Rep., 2018, 8, 4974 CrossRef PubMed
.
- K. M. McCabe and M. Hernandez, Pediatr. Res., 2010, 67, 469–475 CrossRef PubMed
.
- Z. Chen, K. Y. Zhang, X. Tong, Y. Liu, C. Hu, S. Liu, Q. Yu, Q. Zhao and W. Huang, Adv. Funct. Mater., 2016, 26, 4386–4396 CrossRef CAS
.
- Y. Lyu and K. Pu, Adv. Sci., 2017, 4, 1600481 CrossRef PubMed
.
- C. Gota, K. Okabe, T. Funatsu, Y. Harada and S. Uchiyama, J. Am. Chem. Soc., 2009, 131, 2766–2767 CrossRef CAS PubMed
.
- L. Yang, H. S. Peng, H. Ding, F. T. You, L. L. Hou and F. Teng, Microchim. Acta, 2014, 181, 743–749 CrossRef CAS
.
- Z. Wang, P. Zhang, Q. Yuan, X. Xu, P. Lei, X. Liu, Y. Su, L. Dong, J. Feng and H. Zhang, Nanoscale, 2015, 7, 17861–17870 RSC
.
- P. Haro-González, L. Martinez-Maestro, I. R. Martin, J. García-Solé and D. Jaque, Small, 2012, 8, 2652–2658 CrossRef
.
- H. Huang, H. Li, J. J. Feng and A. J. Wang, Sens. Actuators, B, 2016, 223, 550–556 CrossRef CAS
.
- Y. T. Wu, C. Shanmugam, W. B. Tseng, M. M. Hiseh and W. L. Tseng, Nanoscale, 2016, 8, 11210–11216 RSC
.
- C. Y. Chen and C. T. Chen, Chem. Commun., 2011, 47, 994–996 RSC
.
- H. Itoh, S. Arai, T. Sudhaharan, S. C. Lee, Y. T. Chang, S. Ishiwata, M. Suzuki and E. B. Lane, Chem. Commun., 2016, 52, 4458–4461 RSC
.
-
V. Kumar, N. Dasgupta and S. Ranjan, Nanotoxicology: Toxicity Evaluation, Risk Assessment and Management, CRC Press, Florida, 2018, ch. 3 Search PubMed
.
- E. Burdukova, H. Li, N. Ishida, J. P. O'Shea and G. V. Franks, J. Colloid Interface Sci., 2010, 342, 586–592 CrossRef CAS PubMed
.
- Y. Cheng, J. Dai, C. Sun, R. Liu, T. Zhai, X. Lou and F. Xia, Angew. Chem., Int. Ed., 2018, 57, 3123–3127 CrossRef CAS PubMed
.
- F. Xia, J. Wu, X. Wu, Q. Hu, J. Dai and X. Lou, Acc. Chem. Res., 2019, 52, 3064–3074 CrossRef CAS
.
- H. Ma, C. Qi, C. Cheng, Z. Yang, H. Cao, Z. Yang, J. Tong, X. Yao and Z. Lei, ACS Appl. Mater. Interfaces, 2016, 8, 8341–8348 CrossRef CAS PubMed
.
- X. Guan, L. Meng, Q. Jin, B. Lu, Y. Chen, Z. Li, L. Wang, S. Lai and Z. Lei, Macromol. Mater. Eng., 2018, 303, 1700553 CrossRef
.
- H. Zhou, F. Liu, X. Wang, H. Yan, J. Song, Q. Ye, B. Z. Tang and J. Xu, J. Mater. Chem. C, 2015, 3, 5490–5498 RSC
.
- M. Li, X. Song, T. Zhang, L. Zeng and J. Xing, RSC Adv., 2016, 6, 86012–86018 RSC
.
- J. Yang, K. Gu, C. Shi, M. Li, P. Zhao and W. H. Zhu, Mater. Chem. Front., 2019, 3, 1503–1509 RSC
.
- L. Tang, J. K. Jin, A. Qin, W. Z. Yuan, Y. Mao, J. Mei, J. Z. Sun and B. Z. Tang, Chem. Commun., 2009, 4974–4976 RSC
.
- T. Li, S. He, J. Qu, H. Wu, S. Wu, Z. Zhao, A. Qin, R. Hu and B. Z. Tang, J. Mater. Chem. C, 2016, 4, 2964–2970 RSC
.
- Y. Hong, J. W. Lam and B. Z. Tang, Chem. Soc. Rev., 2011, 40, 5361–5388 RSC
.
- C. Zhu, R. T. K. Kwok, J. W. Y. Lam and B. Z. Tang, ACS Appl. Bio Mater., 2018, 1, 1768–1786 CrossRef CAS
.
- T. Nakae, K. Kataoka and T. Miyamoto, Jpn. J. Zootech. Sci., 1974, 45, 347–351 Search PubMed
.
-
J. Potter, in Cooking for Geeks: Real Science, Great Hacks, and Good Food, ed. M. Blanchette, O'Reilly Media, Sebastopol, 2010, ch. 3 Search PubMed
.
- V. Prosapio and I. T. Norton, J. Food Eng., 2019, 261, 165–170 CrossRef CAS
.
- C. Liu, Z. Zheng, C. Cao and Y. Liu, Food Chem., 2019, 300, 125219 CrossRef CAS
.
- L. M. Maestro, C. Jacinto, U. R. Silva, F. Vetrone, J. A. Capobianco, D. Jaque and J. G. Solé, Small, 2011, 7, 1774–1778 CrossRef CAS PubMed
.
- J. Chen, C. C. W. Law, J. W. Y. Lam, Y. Dong, S. M. F. Lo, I. D. Williams, D. Zhu and B. Z. Tang, Chem. Mater., 2003, 15, 1535–1546 CrossRef CAS
.
- Y. Ren, J. W. Y. Lam, Y. Dong, B. Z. Tang and K. S. Wong, J. Phys. Chem. B, 2005, 109, 1135–1140 CrossRef CAS
.
- Y. Hong, J. W. Y. Lam and B. Z. Tang, Chem. Commun., 2009, 4332–4353 RSC
.
- N. B. Shustova, T. C. Ong, A. F. Cozzolino, V. K. Michaelis, R. G. Griffin and M. Dincă, J. Am. Chem. Soc., 2012, 134, 15061–15070 CrossRef CAS
.
- J. Mei, Y. Hong, J. W. Y. Lam, A. Qin, Y. Tang and B. Z. Tang, Adv. Mater., 2014, 26, 5429–5479 CrossRef CAS PubMed
.
- J. M. Yang, H. Yang and L. Lin, ACS Nano, 2011, 5, 5067–5071 CrossRef CAS PubMed
.
- M. Y. Berezin and S. Achilefu, Chem. Rev., 2010, 110, 2641–2684 CrossRef CAS PubMed
.
Footnote |
| † Electronic supplementary information (ESI) available. See DOI: 10.1039/c9nh00693a |
| This journal is © The Royal Society of Chemistry 2020 |

