 Open Access Article
Redox mediators accelerate electrochemically-driven solubility cycling of molecular transition metal complexes†
Katherine J.
Lee‡
 ,
Kunal M.
Lodaya‡
 ,
Cole T.
Gruninger
,
Eric S.
Rountree
and
Jillian L.
Dempsey
,
Cole T.
Gruninger
,
Eric S.
Rountree
and
Jillian L.
Dempsey
 *
*
Department of Chemistry, University of North Carolina, Chapel Hill, North Carolina 27599-3290, USA. E-mail: dempseyj@email.unc.edu
First published on 10th September 2020
Abstract
The solubility of molecular transition metal complexes can vary widely across different redox states, leaving these compounds vulnerable to electron transfer-initiated heterogenization processes in which oxidation or reduction of the soluble form of the redox couple generates insoluble molecular deposits. These insoluble species can precipitate as suspended nanoparticles in solution or, under electrochemical conditions, as an electrode-adsorbed material. While this electrochemically-driven solubility cycling is technically reversible, the reverse electron transfer to regenerate the soluble redox couple state is a practical challenge if sluggish electron transfer kinetics result in a loss of electronic communication between the molecular deposits and the electrode. In this work, we present an example of this electrochemically-driven solubility cycling, report a novel strategy for catalytically enhancing the oxidation of the insoluble material using homogeneous redox mediators, and develop the theoretical framework for analysing and digitally simulating the action of a homogeneous catalyst on a heterogeneous substrate via cyclic voltammetry. First, a mix of electrochemical and spectroscopic methods are used to characterize an example of this electrochemically-driven solubility cycling which is based on the two-electron reduction of homogeneous [Ni(PPh2NPh2)2(CH3CN)]2+ (PPh2NPh2 = 1,3,5,7-tetraphenyl-1,5-diaza-3,7-diphosphacyclooctane). The limited solubility of the doubly-reduced product in acetonitrile leads to precipitation and deposition of molecular [Ni(PPh2NPh2)2]. While direct oxidation of this heterogeneous [Ni(PPh2NPh2)2] at the electrode surface is possible, this electron transfer is kinetically limited. We demonstrate how a freely diffusing redox mediator (ferrocene) – which shuttles electrons between the electrode and the molecular material – can be used to overcome these slow electron transfer kinetics, enabling catalytic regeneration of soluble [Ni(PPh2NPh2)2]2+. Finally, mathematical models are developed that describe the current–potential response for a generic EC′ mechanism involving a homogeneous catalyst and surface-adsorbed substrate. This novel strategy has the potential to enable reversible redox chemistry for heterogeneous, molecular deposits that are adsorbed on the electrode or suspended as nanoparticles in solution.
Introduction
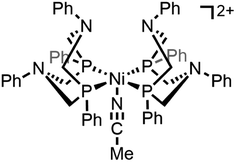
Molecular transition metal complexes that can mediate multi-electron redox reactions have widespread potential applications as charge carriers in electrochemical energy storage technologies, garnering considerable interest both as catalysts for multi-step fuel-forming reactions and in energy storage systems like redox flow batteries where they could enable high energy densities at modest concentrations.1–5 An important consideration is that the properties of these redox active complexes can vary considerably upon traversing different redox states and care must be taken to ensure that each relevant redox state is compatible with the electrochemical system as a whole (e.g., solvent, supporting electrolyte).6–9 One possible challenge arises when one (or more) of the redox states of the transition metal complex has reduced solubility in the solvent of interest.10 In this scenario, oxidation or reduction of the soluble transition metal complex to this insoluble redox state will result in precipitation of the complex either as suspended nanoparticles in solution or as an electrode-adsorbed material. Redox transformations that change the solubility of the complex contrast the more widely discussed case where oxidation or reduction of the soluble transition metal complex triggers an irreversible degradation reaction (e.g., demetallation, ligand destruction) that generates a heterogeneous species that is no longer molecular in nature.11,12 Heterogenization arising from the reduced solubility of one or more redox states is reversible because the species formed upon electron transfer precipitates and deposits on the electrode surface while maintaining the integrity of the molecular core. The reverse redox process which regenerates the soluble transition metal complex will be facile if electronic communication is maintained between the electrode and the resulting precipitated species. However, this recovery process can be a practical challenge if heterogenization of the molecular complex results in sluggish electron transfer kinetics. Herein, we demonstrate how freely diffusing molecular redox shuttles can be used to catalytically enhance the transfer of electrons between an active electrode material and a transition metal that is insoluble in its fully reduced form. The redox shuttle mediates the oxidation of the poorly conducting film adhered to the electrode surface, ultimately regenerating the soluble, oxidized form of the complex.This example of electrochemically-driven solubility cycling is based on the two-electron reduction of the homogeneous transition metal complex [Ni(PPh2NPh2)2(CH3CN)][BF4]2 (PPh2NPh2 = 1,3,5,7-tetraphenyl-1,5-diaza-3,7-diphosphacyclooctane; abbreviated [Ni(PPh2NPh2)2]2+, Scheme 1) in acetonitrile. Best known as a molecular catalyst for electrochemical hydrogen evolution, the reactivity of [Ni(PPh2NPh2)2]2+ in acetonitrile has been extensively evaluated via electrochemical and spectroscopic methods under catalytic conditions.13–17 In contrast, the electrochemistry of [Ni(PPh2NPh2)2]2+ in the absence of a proton source – in particular, its high degree of sensitivity to the concentration of [Ni(PPh2NPh2)2]2+ – remains largely unexplored. In this report, we present detailed electrochemical analysis of [Ni(PPh2NPh2)2]2+ in the absence of a proton source across a range of concentrations (0.5 to 10 mM) which, when coupled with spectroscopic monitoring, identifies an electrochemically-driven solubility cycle. The two-electron reduction of [Ni(PPh2NPh2)2]2+ generates a neutral species, [Ni(PPh2NPh2)], with far more limited solubility in acetonitrile that can precipitate on the electrode surface as a heterogeneous material that remains molecular in nature. In-depth assessment of current–potential responses collected at high concentrations of [Ni(PPh2NPh2)2]2+ indicate that the surface-adsorbed [Ni(PPh2NPh2)2] deposits can passivate the electrode surface and, in the most extreme cases, completely block electron transfer at the electrode.18 While the forward reaction to generate heterogeneous [Ni(PPh2NPh2)2] is facile, reversing this process is limited by slow electron transfer kinetics between heterogeneous [Ni(PPh2NPh2)2] and the electrode. However, we demonstrate that the rate of this re-solubilization can be greatly enhanced through the use of a freely diffusing redox shuttle (ferrocene) which can catalytically regenerate soluble [Ni(PPh2NPh2)2]2+ from these inert deposits. Alongside this case study, we present theoretical models that enable analysis and digital simulations of catalytic film dissolution in the presence and absence of interfacial electron transfer inhibition. We envision that the fundamental understanding of the interfacial redox process presented here could lead to new strategies to facilitate challenging electron transfers to electrode-adsorbed materials as well as aid in the solubilization of suspended nanoparticles when coupled with a hydrodynamic set-up like an electrochemical flow cell.
Results and discussion
Part 1: Reduction-initiated chemical reactivity of [Ni(PPh2NPh2)2]2+
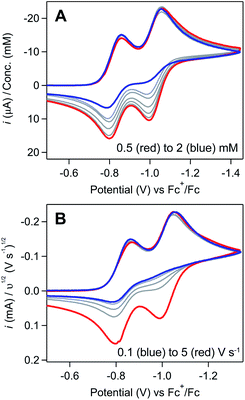
Regime 1. At low concentrations (ca. [[Ni(PPh2NPh2)2]2+] ≤ 0.5 mM), both the NiII/I and NiI/0 redox couples are electrochemically and chemically reversible (Fig. 1A). Scan rate dependence studies show a linear relationship between the cathodic peak current for both couples and υ1/2, as predicted by the Randles–Sevcik equation for a homogeneous species (SI-1, ESI I†).
Regime 2. As concentration is increased (ca. 0.5 mM < [[Ni(PPh2NPh2)2]2+] ≤ 3 mM), the chemical reversibility for both redox couples is increasingly lost (Fig. 1A). While the peak currents for the anodic features progressively decrease, the cathodic peak currents maintain the anticipated linear dependence on concentration and υ1/2 (SI-1, ESI I†). Upon increasing the scan rate, the redox couples regain reversibility (Fig. 1B and SI-1, ESI I†).
Regime 3. At high concentrations (ca. [[Ni(PPh2NPh2)2]2+] > 3 mM), the NiI/0 cathodic feature transitions from a diffusional peak – consistent with a homogeneous species – to a sharp feature (Fig. 2A and SI-1, ESI I†). The cathodic peak current for the NiI/0 wave no longer linearly depends on concentration (SI-1, ESI I†) and is higher than the current predicted for a reversible redox couple (Fig. 2A). In contrast, the NiII/I cathodic feature remains diffusional in nature (Fig. 2A) and its peak current still linearly depends on concentration (SI-1, ESI I†). At potentials negative of the NiI/0 cathodic peak, the current continues to decay until complete current inhibition is observed (Fig. 2B). At ca. −0.8 V on the return scan, some amount of current is regained, a phenomenon that is discussed in detail below. Increasing scan rate broadens the NiI/0 cathodic peak into a shape more akin to that of a diffusion-controlled feature (Fig. 2B). Upon reaching sufficiently fast scan rates, current inhibition is no longer observed and the characteristics of the redox couples increasingly resemble the voltammogram described for regime 2.
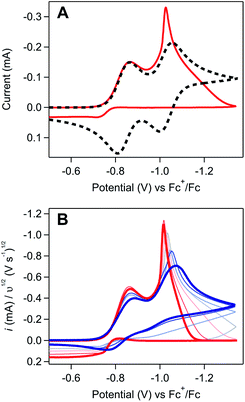 | ||
Fig. 2 (A) Comparison of an experimentally obtained cyclic voltammogram at 10 mM [Ni(PPh2NPh2)2]2+ (red) to the theoretical voltammogram that would be obtained in the absence of a coupled chemical step (dashed black). Experimental voltammograms recorded at 0.1 V s−1. Theoretical voltammogram obtained via digital simulation of two successive one-electron reductions of a species P with redox couples at E1/2 = −0.83 and −1.03 V. Both electron transfers set at 10![[thin space (1/6-em)]](https://www.rsc.org/images/entities/char_2009.gif) 000 cm s−1 with α = 0.5, scan rate as 0.1 V s−1, and concentration of P as 0.01 M. Diffusion coefficient of all species set at the experimentally determined value of 5.9 × 106 cm2 s−1 (SI-1, ESI I†). Simulated with DigiElch 8.FD. (B) Scan rate dependence studies at 10 mM [Ni(PPh2NPh2)2]2+. Cyclic voltammograms recorded across scan rates ranging from 0.025 V s−1 to 5 V s−1 (red to blue) and normalized to υ1/2. All experimental voltammograms recorded in 0.25 M [NBu4][PF6] acetonitrile using a glassy carbon working electrode. 000 cm s−1 with α = 0.5, scan rate as 0.1 V s−1, and concentration of P as 0.01 M. Diffusion coefficient of all species set at the experimentally determined value of 5.9 × 106 cm2 s−1 (SI-1, ESI I†). Simulated with DigiElch 8.FD. (B) Scan rate dependence studies at 10 mM [Ni(PPh2NPh2)2]2+. Cyclic voltammograms recorded across scan rates ranging from 0.025 V s−1 to 5 V s−1 (red to blue) and normalized to υ1/2. All experimental voltammograms recorded in 0.25 M [NBu4][PF6] acetonitrile using a glassy carbon working electrode. | ||
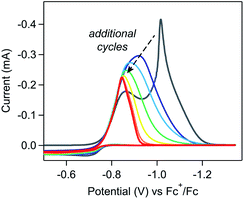
The weakly-adsorbed nature of this material – which will dissolve or desorb when rinsed or left to equilibrate in an electrolyte solution (see SI-3, ESI I† for a more detailed discussion) – precluded more rigorous analysis of the structure and morphology of this film via traditional surface characterization techniques.10,20 However, repetitive cycling experiments show that this material will remain adsorbed to the electrode when maintained in appropriate conditions. As cyclic voltammetry is a non-destructive technique, collecting multiple scans of a homogeneous redox-active species with the same electrode should yield identical results, assuming the diffusion layer is refreshed between scans.21 Irreproducibility from scan to scan will be observed if the deposition of heterogeneous materials during the voltammogram modifies the properties of the electrode, resulting in changes to the electroactive surface area or electron transfer kinetics.10,18,22–24 In these repetitive cycling experiments, a series of voltammograms were collected in which the potential was scanned between −0.5 V and −1.35 V at 0.1 V s−1. Between each voltammogram, the solution was mixed to refresh the diffusion layer with no bias applied to the electrode during mixing. At high concentrations of [Ni(PPh2NPh2)2]2+ (10 mM), drastic changes to the electrochemical response were observed with each additional cycle (Fig. 3) with more subtle changes observed during analogous experiments performed at lower concentrations (SI-2, ESI I†). When reproducing this experiment at high concentrations of [Ni(PPh2NPh2)2]2+, drastic changes were consistently observed cycle-to-cycle within a series of voltammograms from a single experiment, but the exact evolution of the shape of the voltammetric responses as a function of scan number differed from experiment-to-experiment (SI-2, ESI I†). While this irreproducibility makes extracting quantitative information from repetitive cycling unviable, it does not detract from the conclusion that a deposited material is generated upon electrolysis which remains at least partially adsorbed when maintained in appropriate conditions.
For a self-inhibition reaction in which the electrode-adsorbed species completely blocks electron transfer, analytical tools for extracting kinetic information and monitoring film growth from cyclic voltammetry and repetitive cycling experiments have been previously derived.18,19,25 These derivations identify the experimental parameters (e.g., scan rate, concentration of starting material) that govern the peak characteristics of first-scan voltammograms (i.e., a scan with a freshly polished electrode) and how the current response will evolve during repetitive cycling experiments. While the cathodic feature of the NiI/0 redox couple in the first-cycle voltammogram qualitatively conforms to the peak characteristics predicted by these models (i.e., thinner peaks, current that reaches zero), deviations of the experimental data from the quantitative trends predicted by this theoretical treatment indicate that more complex factors are governing film growth in this system. This precludes the application of these previously developed models.
First, the changes in the waveform during multiple cycling experiments do not conform to the trends predicted by this theoretical treatment. These models assume that the electrode is irreversibly derivatized with inhibiting material such that any area of the electrode coated in blocking islands will remain passivated. As such, once the electrode is fully covered in inhibiting materials, no additional current will be observed during the remainder of the sweep or (in the case of repetitive cycling experiments) in any subsequent voltammogram. During repetitive cycling experiments at 10 mM [Ni(PPh2NPh2)2]2+, a current response is clearly observed in each cycle despite complete current inhibition during the cathodic sweep of the first voltammogram (Fig. 3), indicating that passivation is reversible (see below).
Second, the relationship between the governing parameters (e.g., scan rate, concentration of [Ni(PPh2NPh2)2]2+) and the characteristics of the NiI/0 cathodic feature deviate from the trends predicted by this theoretical treatment.18,19,25 These trends only quantitatively hold if the portion of the surface covered in inert deposits is totally inhibited towards further electron transfer such that the current response can be approximated as (1 − θ)I0, where θ is the fractional coverage of the surface that is coated in inhibiting material and I0 is the current in the absence of inhibition. This assumption is only valid when the electroactive areas which separate the “blocking islands” are on the same order of magnitude or larger than the diffusion layer (for example, in the other extreme where the electroactive sites and “blocking islands” are small compared to the dimensions of the diffusion layer, the current response will be the same as a bare electrode but with a lower apparent rate of heterogeneous electron transfer).19,26,27 As such, we attribute the deviations in our experimental data from these mathematical models to the formation of a material that does not rigorously conform to the extreme geometric constraints and irreversible film formation assumed in this theoretical treatment.
The product generated upon oxidation-initiated delamination was characterized by monitoring the composition of the solution during double potential step chronoamperometry (DPSC) via thin-layer UV-vis absorbance spectroscopy (Fig. 5).29,30 In the absence of an applied potential, [Ni(PPh2NPh2)2]2+ absorbs strongly in the visible with a prominent feature at 480 nm.13 When a reducing potential negative of the NiI/0 redox couple (−1.4 V) is applied, the solution absorbance bleaches across the visible spectrum without the concomitant growth of prominent new features, behaviour consistent with formation of an electrode-adsorbed material following the two-electron reduction of [Ni(PPh2NPh2)2]2+.10 If the electrode is then held at oxidizing potentials (0.3 V), a feature at 480 nm grows in with a nearly identical magnitude as the spectrum for [Ni(PPh2NPh2)2]2+ obtained at the beginning of the experiment, indicating that homogeneous [Ni(PPh2NPh2)2]2+ is regenerated in its molecular form. The regeneration of homogeneous [Ni(PPh2NPh2)2]2+ upon oxidation of the deposited material provides evidence that the deposition event is not associated with an irreversible chemical transformation such as a degradation reaction.7,8 Instead, the limited solubility of [Ni(PPh2NPh2)2] generated upon reduction results in precipitation of molecular, heterogenized [Ni(PPh2NPh2)2] on the electrode surface. While it is possible that some other Ni-based degradation product may be co-depositing with the heterogeneous [Ni(PPh2NPh2)2]2+, the near quantitative regeneration of homogeneous [Ni(PPh2NPh2)2]2+ observed via spectroelectrochemistry (Fig. 5) indicates that – if this parallel reaction is operative – it is a minor pathway at best.
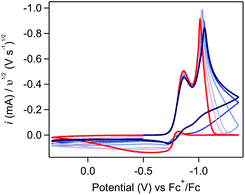
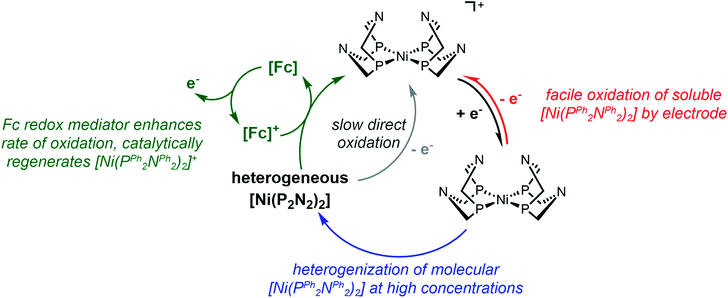
These data support the basic mechanistic proposal described in Scheme 2 where the two-electron reduction to generate [Ni(PPh2NPh2)2] (reaction (1) & (2)) is followed by a heterogenization process to form suspended particles in solution (reaction (3A)) or, in the presence of an electrode, surface deposits (reaction (3B)). While heterogenization is technically chemically reversible because the molecular core remains intact, it is practically limited by poor electronic communication between the electrode and the heterogeneous material.21,28 This poor electronic communication is evident in the oxidative electrochemistry of the surface-adsorbed [Ni(PPh2NPh2)2] generated in regime 3 (Fig. 4). In these cyclic voltammograms, prolonged polarization at oxidizing potentials is necessary for complete delamination of the adsorbed material due to sluggish electron transfer kinetics between the underlying glassy carbon electrode and heterogeneous [Ni(PPh2NPh2)2].
Part 2: Redox-mediators enhance oxidation of heterogeneous [Ni(PPh2NPh2)2]
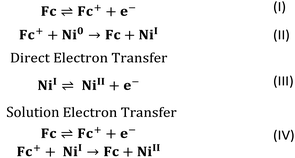
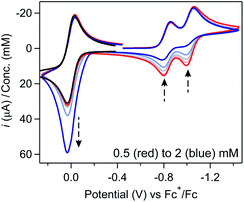
One notable aspect of the electrochemically-driven solubility cycling of [Ni(PPh2NPh2)2]2+ is that while the generation of the heterogeneous [Ni(PPh2NPh2)] is facile, the reverse reaction – where soluble [Ni(PPh2NPh2)2]2+ is regenerated – is kinetically limited by slow electron transfer between the electrode and the heterogeneous deposits. We postulated that this rate of electron transfer could be accelerated by addition of a molecular, freely diffusing redox mediator, a strategy that has been shown to facilitate challenging electron transfers in other systems where there is poor electronic communication between the electrode and a redox active centre, such as proteins31,32 and poorly-conducting lithium-insertion materials.33,34 Ferrocene (Fc) was selected as a redox mediator due to its electrochemical stability, facile reversible electron transfer reactivity, and general chemical inertness in both its oxidized and reduced forms. This would proceed through the EC′ catalytic mechanism described in Scheme 3: the homogeneous Fc catalyst is oxidized at the electrode to generate Fc+ (reaction (I)), electrochemically-generated Fc+ oxidizes the heterogeneous [Ni(PPh2NPh2)2] substrate by one electron to generate the product [Ni(PPh2NPh2)2]+ and regenerate Fc which can be further oxidized at the electrode surface and – if substrate is still available – re-enter the catalytic cycle (reaction (II)). [Ni(PPh2NPh2)]+ is further oxidized to [Ni(PPh2NPh2)2]2+via either direct heterogeneous electron transfer at the electrode (reaction (III)) or a solution electron transfer (SET) reaction35 with another equivalent of Fc+ (reaction (IV)).In voltammograms collected at 0.5 mM [Ni(PPh2NPh2)2]2+ (regime 1), the anticipated reversible, one-electron Fc+/0 couple is observed (Fig. 6). As [Ni(PPh2NPh2)2]2+ concentration is increased and the NiII/I and NiI/0 features transition to regime 2, the magnitude of the anodic and cathodic peak currents of the Fc+/0 wave begin to diverge; the anodic peak current increases relative to the amount predicted based on the Fc concentration while the cathodic feature is unperturbed (Fig. 6 and SI-5, ESI I†). This current distortion is only observed in cyclic voltammograms that first scan through the NiI/0 couple. The synchrony between the loss of the NiII/I and NiI/0 anodic peaks and the anodic current enhancement at the Fc+/0 redox couple shows that ferrocene only begins to act as a redox shuttle when heterogenization of [Ni(PPh2NPh2)2] results in a loss of electronic communication with the electrode. The cathodic peak of the Fc+/0 redox couple is unperturbed in the cyclic voltammograms with a 1![[thin space (1/6-em)]](https://www.rsc.org/images/entities/char_2009.gif) :
:![[thin space (1/6-em)]](https://www.rsc.org/images/entities/char_2009.gif) 1 ratio of [Ni(PPh2NPh2)2]2+
1 ratio of [Ni(PPh2NPh2)2]2+![[thin space (1/6-em)]](https://www.rsc.org/images/entities/char_2009.gif) :
:![[thin space (1/6-em)]](https://www.rsc.org/images/entities/char_2009.gif) Fc (Fig. 6), suggesting that Fc oxidation is not followed by a stoichiometric reaction in which the Fc+ is consumed when it oxidizes [Ni(PPh2NPh2)2] and instead it proceeds via an EC′ mechanism described in Scheme 3.28,30,36,37
Fc (Fig. 6), suggesting that Fc oxidation is not followed by a stoichiometric reaction in which the Fc+ is consumed when it oxidizes [Ni(PPh2NPh2)2] and instead it proceeds via an EC′ mechanism described in Scheme 3.28,30,36,37
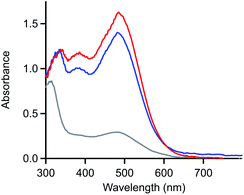
UV-vis spectroelectrochemistry was used to confirm that the reaction between ferrocene and the deposited material consists solely of electron transfer to regenerate homogeneous [Ni(PPh2NPh2)2]2+ and does not involve a chemical reaction which irreversibly modifies the molecular core of [Ni(PPh2NPh2)2] (Fig. 7A and SI-5, ESI I†). UV-vis spectroelectrochemical experiments were conducted in a solution of 4 mM [Ni(PPh2NPh2)2]2+ with 0.33 mM Fc using the same DPSC procedure described above. As with spectroelectrochemistry experiments conducted in the absence of ferrocene, applying a reducing potential (−1.4 V) resulted in bleaching of the solution absorbance. Subsequent application of an oxidizing potential positive of the Fc+/0 couple (0.3 V) resulted in a spectrum with absorbance features nearly identical to those for the [Ni(PPh2NPh2)2]2+ solution prior to the double potential step chronoamperogram, indicating that the [Ni(PPh2NPh2)2]2+ was not consumed during the reaction with Fc and that the reaction between Fc+ and [Ni(PPh2NPh2)2] is a simple electron transfer process.
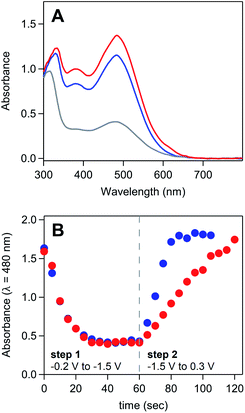 | ||
| Fig. 7 (A) UV-vis absorbance spectrum of a solution of 4 mM [Ni(PPh2NPh2)2]2+ and 0.33 mM ferrocene during spectroelectrochemistry experiments. Spectra collected in the absence of an applied potential (blue), after holding the honeycomb electrode at −1.4 V for 60 seconds (grey), and after stepping the fouled honeycomb to 0.3 V for 60 seconds (red). (B) Absorbance measured at 480 nm over the course of a double potential step chronoamperometry in a solution of 5 mM [Ni(PPh2NPh2)2]2+ in the absence of ferrocene (red) and in the presence of 0.25 mM ferrocene (blue). Double potential step chronoamperometry employed a two-step sequence in which the electrode was held at −1.5 V (step 1) and 0.3 V (step 2) for 60 seconds. Dashed grey line marks transition from step 1 to step 2. Corresponding absorbance spectra available in SI-5.† All spectroelectrochemistry experiments recorded in 0.25 M [NBu4][PF6] acetonitrile with a platinum honeycomb electrode. | ||
UV-vis spectroelectrochemistry was then used to confirm that Fc accelerates the kinetics of [Ni(PPh2NPh2)2]2+ regeneration. Double potential step chronoamperograms (step 1 = −1.5 V for 60 seconds, step 2 = 0.3 V for 60 seconds) were recorded in a solution of 5 mM [Ni(PPh2NPh2)2]2+ in the absence and presence of 0.25 mM ferrocene, collecting UV-vis absorbance spectra every 5 seconds (Fig. 7B and SI-5, ESI I†). The precipitation of [Ni(PPh2NPh2)2] during the forward step and regeneration of [Ni(PPh2NPh2)2]2+ during the reverse step were monitored as a function of time by tracking the loss and growth of the feature at 480 nm during step 1 and step 2, respectively. The bleach of this feature during step 1 occurred at a nearly identical rate for both samples, suggesting the presence of sub-stoichiometric amounts of ferrocene has minimal impact on the kinetics of [Ni(PPh2NPh2)2] precipitation. While the bleach of this absorbance feature under reducing conditions was unperturbed, the subsequent increase in signal intensity under oxidizing conditions occurred at a far faster rate in the presence of ferrocene, with the timescale required for complete regeneration of soluble [Ni(PPh2NPh2)2]2+ decreasing from 60 seconds in the [Ni(PPh2NPh2)2]2+ only solution to 20 seconds upon addition of ferrocene. This data suggests that ferrocene accelerates the rate of film oxidation and has little impact on the rate of film formation.
To electrochemically evaluate whether this catalytically enhanced film dissolution had a measurable impact on the ‘un-blocking’ of the electrode surface, double potential step chronoamperograms (step 1 = −1.45 V for 10 to 20 seconds, step 2 = −0.3 V for 20 seconds) were recorded in [Ni(PPh2NPh2)2]2+ solutions (5–10 mM) with or without 0.05 equivalents of ferrocene using a glassy carbon electrode. The current transient obtained during the forward step is comparable for the [Ni(PPh2NPh2)2]2+ only and ferrocene containing solutions (SI-5, ESI I†): after an initial spike associated with double-layer charging and adsorption/desorption, the current rapidly decays, eventually reaching zero at the highest concentrations sampled. Converting the chronoamperograms collected during the forward step to their corresponding Cottrell plot by plotting current as a function of t−1/2 shows a far faster current decay than the linear relationship predicted by the Cottrell equation for a diffusional species.19 This negative deviation from linearity is consistent with the passivation of the electrode observed during cyclic voltammograms in regime 3 (Fig. 2).
While the rate of current inhibition under reducing conditions (step 1) is comparable for the [Ni(PPh2NPh2)2]2+ only and ferrocene containing solutions, major deviations were observed during the second step to oxidizing potentials (Fig. 8 and SI-5, ESI I†). In the absence of ferrocene, a small current spike is observed followed by a slow decay to the capacitive current anticipated for a bare glassy carbon electrode, as expected for a direct oxidation process that is kinetically limited by poor interfacial electron transfer. In contrast, a large anodic current spike is observed in the presence of ferrocene which rapidly decays to the diffusion-controlled wave anticipated for homogeneous ferrocene, behaviour consistent with the accelerated regeneration of the bare glassy carbon electrode.
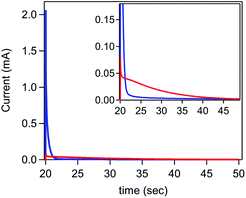 | ||
| Fig. 8 Second step of a double potential step chronoamperogram comparing the delamination of [Ni(PPh2NPh2)2] in a solution of 7.5 mM [Ni(PPh2NPh2)2]2+ in the absence of ferrocene (red) and in the presence of 0.325 mM ferrocene (blue). Working electrode held at −1.5 V for 20 seconds to electrodeposit [Ni(PPh2NPh2)2] (data available in SI-5†) and then stepped to 0.3 V for 30 seconds. Inset highlights differences in magnitude of the current spike at early time points. All chronoamperograms recorded in 0.25 M [NBu4][PF6] using a glassy carbon electrode. | ||
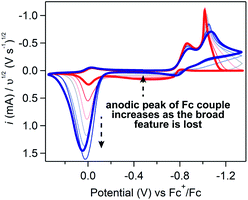
If Fc-mediated oxidation is the dominant oxidative pathway, the magnitude of the Fc+/0 anodic wave ic[Fc+/0] (after correcting for the anodic peak current of the Fc+/0 couple in the absence of substrate) will decrease as scan rate increases (thereby decreasing Γ0A) – a relationship observed at scan rates above 1 V s−1. However, below 1 V s−1 (Fig. 9), the relationship between scan rate and ic[Fc+/0] is inverted: the degree of anodic current enhancement becomes smaller as scan rate decreases with little to no current enhancement observed at the lowest scan rate sampled (0.025 V s−1). This decrease in the current enhancement at the Fc couple is commensurate with an increase in the broad oxidative feature observed at potentials negative of ca. −0.8 V, indicative of a competition between direct oxidation of [Ni(PPh2NPh2)2] at the electrode and Fc-mediated oxidation (SI-5, ESI I†). At slow scan rates, direct oxidation of [Ni(PPh2NPh2)2] results in de-lamination of the deposited material and regeneration of [Ni(PPh2NPh2)2]2+ thereby decreasing the amount of film available to react with Fc+. At faster scan rates, the sluggish direct oxidation pathway is not competitive, leaving more material available for Fc-mediated oxidation and resulting in a larger degree of current enhancement at the Fc+/0 couple.
This competition is consistent with the role of Fc as a redox shuttle which enhances the otherwise sluggish oxidation of insulating heterogeneous [Ni(PPh2NPh2)2] deposits and, we suggest, is actually crucial for this mediated pathway to be effective when electrodeposition completely blocks electron transfer under reducing conditions. To initiate this mediated reactivity, Fc must itself first be oxidized at the electrode surface; this electron transfer would be greatly hindered if the electrode were completely passivated, as it is at potentials negative of ca. −0.8 V in regime 3.38,39 Given this caveat, we suggest that the kinetically slow direct oxidation of the film and the resulting delamination of the inhibiting material is critical for exposing electroactive surface area through which homogeneous Fc can be oxidized to Fc+ in regime 3.
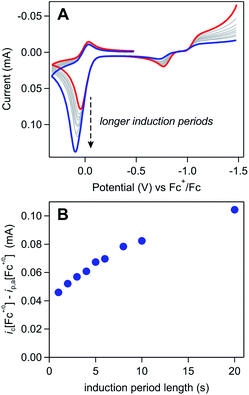
The impact of each of the aforementioned experimental parameters was evaluated using a series of induction period experiments. The basic experimental set-up of these trials involved holding a freshly pre-treated electrode at −1.5 V (i.e., the induction period) in a solution of [Ni(PPh2NPh2)2]2+ and Fc and then collecting a voltammogram in which the electrode was scanned from this resting potential through the Fc+/0 couple. Because the potential applied during the induction period is negative of the NiI/0 redox couple, the length of this induction period can be used to control and systematically tune Γ0A, with longer induction periods increasing the time available for film formation. While the magnitude of Γ0A is generally expected to increase with induction period, one caveat for a self-inhibiting system, like the one explored here, is that saturation of the electrode will block the formation of additional [Ni(PPh2NPh2)2] and force Γ0A to plateau.39 However, in all of the following examples, complete electrode passivation does not occur, allowing the length of the induction period to be used as a proxy for Γ0A (see SI-6, ESI I† for a more detailed discussion).
Trend 1. The magnitude of a catalytic wave increases as a function of Γ0A.
The influence of Γ0A on the magnitude of the Fc+/0 anodic wave was examined by varying the length of the induction period from 1 to 20 seconds in a solution of 3 mM [Ni(PPh2NPh2)2]2+ and 0.65 mM Fc (Fig. 10A). By using the induction period length to control Γ0A while collecting all of the voltammograms at the same scan rate, this experimental design circumvents the complications from direct oxidation observed during the scan rate dependence trials described above because, while direct oxidation is still expected to decrease Γ0A, the amount of material removed will be comparable across the various trials. In these induction period studies, ic[Fc+/0] is consistently larger than the anodic peak current predicted by the Randles–Sevcik equation (ip,a[Fc+/0]) and monotonically increases as a function of induction period length (t) (Fig. 10B). This is consistent with an EC′ process (Scheme 3): increasing Γ0A will result in more catalyst turnover via solution electron transfer which regenerates Fc that is further oxidized at the electrode surface, thereby increasing the size of the anodic wave.
Trend 2. The cathodic peak of the Fc+/0 couple will decrease upon decreasing substrate consumption.
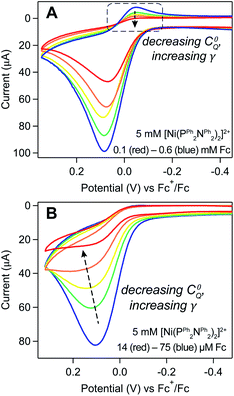
The degree of substrate consumption refers to the percent of material consumed during the course of the scan: ΓfinalA/Γ0A (ΓfinalA = amount of material remaining at the end of the voltammogram). The two extremes are (1) complete substrate consumption (ΓfinalA/Γ0A = 0) where all deposited [Ni(PPh2NPh2)2] is oxidized and (2) the absence of substrate depletion (ΓfinalA/Γ0A ≈ 1) where the amount of deposited [Ni(PPh2NPh2)2] that is oxidized is negligible and the amount of substrate available can be considered constant. The degree of substrate consumption will be inversely related to the substrate-to-catalyst ratio, defined by the excess factor γ = Γ0A/C0Q. Increasing γ (achieved experimentally either by increasing Γ0A or decreasing C0Q) will increase the amount of material that must be consumed relative to the amount of catalyst available to consume it, ultimately serving to decrease the degree of substrate consumption over the course of the scan.
When complete substrate consumption is achieved, ferrocenium cannot be reduced through catalyst turnover and will instead be reduced at the electrode at the typical Fc+/0 redox couple, as was observed in voltammograms collected with a 1![[thin space (1/6-em)]](https://www.rsc.org/images/entities/char_2009.gif) :
:![[thin space (1/6-em)]](https://www.rsc.org/images/entities/char_2009.gif) 1 ratio of [Ni(PPh2NPh2)2]2+
1 ratio of [Ni(PPh2NPh2)2]2+![[thin space (1/6-em)]](https://www.rsc.org/images/entities/char_2009.gif) :
:![[thin space (1/6-em)]](https://www.rsc.org/images/entities/char_2009.gif) Fc (Fig. 6). As the degree of substrate consumption decreases, more ferrocenium is reduced through catalytic turnover and, by extension, less ferrocenium is reduced through heterogeneous electron transfer at the electrode surface.28,40,41 In the voltammogram, the cathodic wave is increasingly lost, eventually disappearing entirely.37
Fc (Fig. 6). As the degree of substrate consumption decreases, more ferrocenium is reduced through catalytic turnover and, by extension, less ferrocenium is reduced through heterogeneous electron transfer at the electrode surface.28,40,41 In the voltammogram, the cathodic wave is increasingly lost, eventually disappearing entirely.37
The anticipated loss of the cathodic wave for Fc+/0 redox couple was observed upon increasing γ. When Γ0A is increased (i.e., increasing the induction period length) while keeping the concentration of Fc (C0Q) constant, a subtle decrease in the cathodic peak is seen at longer induction periods, indicating that more Fc+ is reduced through redox catalysis as Γ0A increases (Fig. 10A and SI-6, ESI I†). Alternatively, when the concentration of ferrocene was varied (0.1–0.6 mM) while the induction period length was kept constant (5 seconds), a similar, but more pronounced, relationship was observed. At the lowest ferrocene concentration employed, the cathodic peak height of the Fc+/0 couple was far smaller than the magnitude predicted by the Randles–Sevcik equation and the ratio of the experimental to theoretical peak current increased as a function of ferrocene concentration, from 0.08 at 0.1 mM to 0.36 at 0.6 mM (Fig. 11A and SI-6, ESI I†).
Trend 3. In the absence of substrate depletion, the catalytic wave transitions to a S-shaped response with a limiting plateau.
When substrate depletion is absent (ΓfinalA/Γ0A ≈ 1) such that steady-state conditions are achieved, the current response will transition from a peak-shape to an S-shaped catalytic wave.30 This transition can be seen when working with micromolar ferrocene concentrations and long induction periods (10 seconds): the peak-shaped Fc oxidative wave transitions to a quasi-plateau shape as C0Q decreases from 75 to 14 μM (Fig. 11B). The current does not reach a completely flat plateau within the experimental potential window, as predicted for redox catalysis. We speculate this is due to in situ changes in the electrode properties; as the scan progresses across the Fc+/0 couple, the ferrocene-initiated reaction leads to desorption of the inhibiting film, resulting in changes in the electrode properties which manifest as a sloping plateau.
Trend 4. Increasing υ will decrease the degree of substrate consumption.
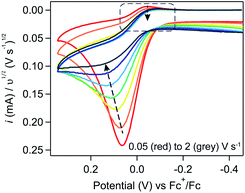
For a system involving a homogeneous catalyst and substrate, the degree of substrate consumption will be inversely related to υ: increasing scan rate decreases the experimental timescale and, by extension, the amount of time available to consume the deposited material.28 As such, increasing υ will result in the same loss of the return feature and peak-to-plateau transition that is observed when increasing γ. In the induction period studies described here, the relationship between scan rate and substrate consumption is slightly more complex when working at very low scan rates. In this regime, the scan rate will also have an observable impact on the amount of deposited substrate available for catalysis (see SI-6, ESI I† for a more rigorous discussion). However, we hypothesized that judicious tuning of experimental parameters (i.e., high scan rates, sufficiently long induction periods) would suppress these convoluting factors and allow the more simple relationship between scan rate and substrate consumption, akin to the one established for a purely-homogeneous catalytic system, to be isolated.
To evaluate this scan rate dependence, induction period studies were conducted using a constant induction period length (5 seconds) and Fc concentration (0.1 mM). Upon increasing the scan rate from 0.05 to 2 V s−1 (Fig. 12), the trends predicted by that more simple relationship were observed – the cathodic peak is lost and a peak-to-plateau transition can be observed at scan rates higher than 1 V s−1 – providing additional qualitative support that ferrocene is acting catalytically.
Induction period studies show that the properties of the Fc+/0 redox couple are governed by Γ0A (Fig. 10), γ (Fig. 11), and υ (Fig. 12) and that tuning these parameters generates waveforms that conform to the characteristic shapes expected for an EC′ catalytic mechanism.42
Part 3: mathematical modelling of catalytic film dissolution by a homogeneous redox mediator
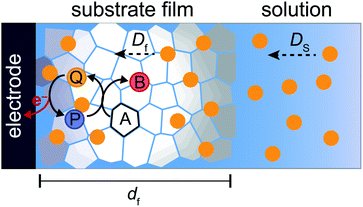
To more deeply understand the factors controlling an EC′ reaction scheme (generically described in Scheme 5) involving a homogeneous catalyst and heterogeneous substrate, we developed models for analysing and simulating catalytic film dissolution via a diffusional redox mediator in the presence and absence of inhibition effects. This analysis is for the oxidative EC′ mechanism but can be readily transposed to the reductive analogue. These models assume homogeneity throughout the film (thereby neglecting the inhomogeneity in film thickness, aggregate size, and film diffusion coefficients which can lead to deviations between theoretical models and experimental results) and do not take into account competition from delamination due to direct oxidation at the electrode surface. As such, while the results from this theoretical treatment are qualitatively consistent with our experimental results, these models are not designed to reach quantitative agreement. Digital simulations based on these models were carried out using a custom MATLAB script which is available in ESI III† (for simulations done in the absence of inhibition) and ESI IV† (for simulations done in the presence of inhibition effects). For the sake of computational tractability, this script assumes that the concentration of the oxidized catalyst (P) is confined within a region close to the electrode of a thickness equal to the thickness of the film at the start of the scan (df). The validity of the model was tested by simulating voltammograms of the diffusional redox mediator in the absence of electrode-adsorbed substrate to ensure that a one-electron reversible redox couple was generated (ESI II†).43 | (1) |
 | (2) |
 | (3) |
From these derivations, three dimensionless parameters that govern the catalytic response can be identified: the excess factor γ (defined above), a dimensionless kinetic parameter λ (eqn (4)), and a dimensionless diffusion coefficient (ω) (eqn (5)):
 | (4) |
 | (5) |
Digital simulations which systematically varied each of these governing parameters were used to explore how these parameters influence the catalytic waveform and whether these changes conform to the chemically intuitive trends discussed above. The current–potential traces from these simulations are plotted in their dimensionless form, with dimensionless current (Ψ) and potential (ξ) given by:
where E0 is the standard potential of the catalyst couple and S is the surface area of the electrode. Increasing Γ0A (corresponding to an increase in γ) results in an increase in the magnitude of the catalytic wave and a loss of the return feature for the catalyst's redox couple (Fig. 14A), consistent with trend 1 and 2 discussed above. Comparable changes are also observed upon decreasing C0Q, which has the effect of decreasing λ and increasing γ concurrently. Upon pushing to sufficiently low values of C0Q, the anticipated transition of the catalytic waveform from a peak to a plateau is observed (Fig. 14B). Varying scan rate – thereby decreasing ω and λ – leads to a comparable loss of the return feature for the catalyst redox couple and peak-to-plateau transition (Fig. 14C). These digital simulations are consistent with our experimental results and provide support that, under the conditions used during these simulations, the homogeneous catalyst-heterogeneous substrate EC′ reaction scheme will follow the chemically intuitive trends discussed above.
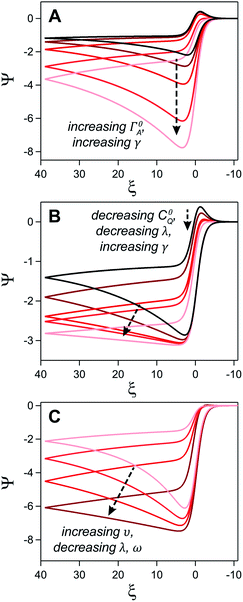 | ||
| Fig. 14 Simulated current–potential responses for a homogeneous catalyst-heterogeneous substrate system where the electrode-adsorbed substrate does not influence the properties of the electrode. (A) Varying parameter γ (the experimental equivalent of increasing C0A) from 5 (black) to 80 (light red) at a constant value leads to an increase in the magnitude of the catalytic wave and a loss of the return feature. Dimensionless parameters ω and λ are constant across all trials and are both set to 0.1. (B) The influence of C0Q on the catalytic waveform was established by concurrently increasing γ and decreasing λ while keeping ω at 0.1. Excess factor, γ, varied from 10 (black), 20, 40, 50, and 100 (light red) and ω varied from 0.1 (black), 0.05, 0.025, 0.02, and 0.01 (light red). (C) The influence of υ established by increasing ω and λ from 0.02 (dark red) to 0.2 (light red) with a constant γ of 60. Simulations generated using custom MATLAB script available in ESI III.† | ||
To simulate this regime, θ is calculated at each time step and CQ, CP, and ΓA are calculated at each point in time and space (as mentioned above, our simulations only consider the region within the film for the sake of computational tractability). The value of kapps is dynamically updated at each time step using the relation (1 − θ)ks. The inhibited current can then be directly calculated as a function of time using the concentration profile of the catalyst.
Inhibition effects are not expected to impact the catalytic voltammogram when the chemical reaction is the rate determining step.27 In this chemical reaction-controlled regime, the catalytic response will be the same at an inhibited and uninhibited electrode. Deviations between the inhibited and uninhibited voltammogram will become increasingly pronounced as the electron transfer kinetics decrease relative to the rate of the chemical reaction, resulting in passage to a mixed chemical reaction-electron transfer controlled regime when the kinetics of the chemical step and electron transfer are comparable and an eventual transition to a pure electron transfer-controlled regime when electron transfer is the rate-limiting step.
This transition from the pure chemical reaction to pure electron transfer zone is readily apparent when the electron transfer kinetics of the underlying electrode is varied at a constant initial surface coverage (θ = 0.9) (Fig. 15A). At the highest value of ks sampled (2000 cm s−1), no differences between the inhibited and uninhibited current are observed. As ks decreases to 20 cm s−1, inhibition begins to have a small, but observable influence on the voltammogram, manifesting as a positive potential shift for the peak potential of the catalytic wave (Ei) relative to the response obtained in the absence of inhibition (Eu). At the lowest ks values sampled (0.2 cm s−1), this potential difference between Ei and Eu (ΔE) is far more pronounced and curve crossing – where the current on the return scan is higher than the current on the forward scan – can be observed.44
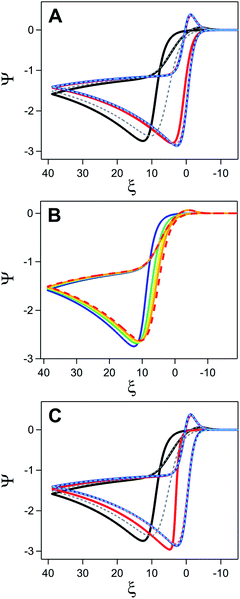 | ||
| Fig. 15 Simulated current–potential responses exploring the influence of inhibition for a homogeneous catalyst-heterogeneous substrate system. (A) Comparison of the catalytic response in the presence (solid lines) and absence (dashed lines) of inhibition when varying ks at a constant value of θ (0.9). Values of ks are 2000 (blue), 20 (red), and 0.2 (black/grey) cm s−1. (B) Simulations varying θ at a constant value of ks (0.2 cm s−1). Catalytic response in the absence of inhibition shown as dashed red line. For electrodes coated in an inhibiting material, fractional surface coverage set to 0.3 (orange), 0.5 (yellow), 0.7 (green), and 0.9 (blue). (C) Simulations with a constant initial kapps value of 0.02 cm s−1 achieved by different ks–θ combinations. Values of ks and θ set to 0.2 cm s−1 and 0.9 (black), 20 cm s−1 and 0.999 (red), and 2000 cm s−1 and 0.99999 (blue). Dashed lines represent corresponding voltammograms in the absence of inhibition. For all simulations, ω = 0.1, γ = 10, and λ = 0.1. Simulations generated using custom MATLAB script available in ESI IV.† | ||
To disentangle the conditions necessary to observe this curve crossing, two additional sets of digital simulations were conducted. In the first, the initial surface coverage of the film was varied from 0.3 to 0.9 while keeping ks constant (0.2 cm s−1) (Fig. 15B). To isolate the effect of surface coverage alone, it is assumed that the amount of adsorbed-substrate available in the film is constant despite the changing θ value. In the absence of inhibition, the catalytic response grows from the redox couple of the catalyst observed in the absence of substrate. In the presence of inhibition, increasing θ results in a shift of the catalytic wave to more positive potentials, consistent with the increasing driving force necessary to generate the same amount of oxidized P as kapps decreases. On the return sweep, the traces rapidly converge indicating that kapps approaches ks for all systems, behaviour consistent with the complete consumption of substrate. The curve crossing phenomena is a direct result of the increase in kapps triggered by removal of the inhibiting material. For a quasi-reversible or irreversible redox couple, a decrease in ks triggers a shift of the anodic peak towards more positive values and – if ks is constant during the potential sweep – a shift of the cathodic peak towards more negative values.19,21 The increase in kapps over the course of the scan due to removal of the material decreases the driving force required for electron transfer and pulls the cathodic peak towards more positive values. As θ increases, the change in kapps over the course of the scan also becomes larger. Eventually, the difference between the effectiveness of electron transfer on the forward and return trace becomes so large that curve crossing will be observed on the return trace.
The next set of simulations kept the initial kapps constant (0.02 cm s−1) while modulating the relative values of ks (0.2, 20, 2000 cm s−1) and θ (0.9, 0.999, 0.99999) (Fig. 15C). Despite the equivalent values of kapps at the beginning of the scan, these simulations produced strikingly different voltammograms. As discussed above (Fig. 15A), for electrodes with a ks of 0.2 cm s−1 and θ of 0.9, Ei falls at far more positive potentials than Eu and curve crossing is observed on the return trace. Increasing ks and θ to 20 cm s−1 and 0.99, respectively, decreases this potential difference, however curve crossing is still observed on the return scan when inhibition is considered (Fig. 15C). This is in contrast to simulations collected with a ks of 20 cm s−1 and a θ of 0.9 where ΔE is negligible and no curve crossing is observed on the return scan (Fig. 15A). However, when a kapps of 0.2 cm s−1 is accomplished by using large ks values (2000 cm s−1) and high surface coverage (0.99999), the voltammogram for the inhibited and uninhibited electrode are nearly identical except for a small change in the onset potential at the foot of the catalytic wave.
These simulations highlight the importance of the electron transfer kinetics of the underlying electrode in dictating whether inhibition leads to observable changes in the cyclic voltammogram. Inhibition effects will only be observed when kapps is sufficiently small relative to ks that it forces an appreciable change in the ability to maintain the Nernstian equilibrium at the electrode surface. When ks is large, this will only occur at near unity surface coverages and will only be maintained over a limited range due to the rapid increase in the kapps as surface area is exposed. As ks decreases and the catalytic response moves into the mixed chemical reaction-electron transfer or electron transfer controlled regime, the voltammogram response becomes increasingly sensitive to film coverage. In these zones, increasing θ results in a greater required driving force to generate the oxidized catalyst Q leading to a positive shift in the potential of the catalytic wave that will eventually manifest in curve crossing.
These simulations provide clarity into this category of EC′ reactions and provide guidance for designing analytical strategies for extracting kinetic information from cyclic voltammetry for systems involving a homogeneous catalyst and heterogeneous substrate. For one, they show that the simpler model describing the action of a homogeneous catalyst on a heterogeneous substrate – where the deposited material is assumed to have no influence on the properties of the electrode surface – can be readily extended to the case where the adsorbed substrate inhibits interfacial electron transfer if the chemical reaction is the rate determining step. This would allow benchmarking strategies derived from the simpler model to be applied for voltammograms purely controlled by the chemical reaction. In addition, they also highlight the enhanced sensitivity of the current response to inhibition effects at the foot of the catalytic wave. As such, while analytical methods which extract kinetic information from the foot of the catalytic wave have garnered widespread popularity in the analysis of purely homogeneous systems,45,46 this enhanced sensitivity in this potential window may hinder extension of such strategies.
Conclusions
The interplay between homogeneous complexes and surface-adsorbed films has important implications when evaluating transition metal complexes for electrochemical energy storage technology. Electrochemical deposition of heterogeneous material is most commonly associated with degradation reactions in which the oxidation or reduction of a molecular starting material generates a heterogeneous species that is no longer molecular in nature. In contrast, the possibility of reversible solubility changes – where electron transfer generates a redox state with far more limited solubility that aggregates and deposits on the electrode surface – has received far less attention. These solubility changes are often quite the nuisance, particularly if slow electron transfer kinetics between the heterogeneous molecular deposits and the electrode limit recovery of the soluble form of the redox couple. While clever tuning of ligand properties or experimental conditions (e.g., solvent) can help circumvent solubility challenges, this approach can needlessly preclude many otherwise promising systems.In this work, we rigorously analyse the electrochemically-driven solubility cycling of homogeneous [Ni(PPh2NPh2)2]2+ in acetonitrile. The limited solubility of the doubly-reduced product leads to precipitation and deposition of molecular [Ni(PPh2NPh2)2], a process which is self-inhibiting due to the passivating nature of the heterogeneous deposits. While direct oxidation of this molecular material at the electrode surface is possible, this electron transfer is limited by poor electron transfer kinetics. Using this platform, we demonstrate how a freely diffusing redox mediator (ferrocene) – which shuttles electrons between the electrode and the insulating material – can be used to overcome these slow electron transfer kinetics, enabling catalytic regeneration of soluble [Ni(PPh2NPh2)2]2+. Cyclic voltammetry was used to qualitatively explore how this unique reaction scheme will manifest in electrochemical data. Alongside this case study, two mathematical models were developed that corroborated the qualitative analysis derived from experimental results and identified the parameters governing the electrochemical response in the absence and presence of inhibition effects. Digital simulations based on this theoretical treatment provide insight into the critical role of interfacial electron transfer kinetics between the electrode and the homogeneous redox catalyst in dictating how inhibition effects manifest in electrochemical data. One benefit of this strategy is that the redox mediators which are facilitating electron transfer to the molecular deposits are homogeneous, making this approach applicable to both electrode-adsorbed materials and – when coupled with an appropriate hydrodynamic set-up – molecular nanoparticles suspended in solution.
Conflicts of interest
There are no conflicts to declare.Acknowledgements
This research was supported by the U.S. Department of Energy, Office of Science, Office of Basic Energy Sciences, under Award DE-SC0015303. We gratefully acknowledge Dr Sean McWilliams for synthetic assistance. J. L. D. acknowledges support from a Packard Fellowship for Science and Engineering and the Alfred P. Sloan Foundation. K. J. L. acknowledges a Dissertation Completion Fellowship and a Lampley Graduate Fellowship from the University of North Carolina. K. M. L acknowledges a Morehead-Cain Scholarship. E. S. R. acknowledges a Dissertation Completion Fellowship from the University of North Carolina.Notes and references
- K. E. Dalle, J. Warnan, J. J. Leung, B. Reuillard, I. S. Karmel and E. Reisner, Chem. Rev., 2019, 119, 2752–2875 CrossRef
.
- D. L. DuBois, Inorg. Chem., 2014, 53, 3935–3960 CrossRef
.
- D. G. Kwabi, Y. Ji and M. J. Aziz, Chem. Rev., 2020, 120, 6467–6489 CrossRef
.
- M. L. Perry and A. Z. Weber, J. Electrochem. Soc., 2016, 163, A5064–A5067 CrossRef
.
- C. Hunt, M. Mattejat, C. Anderson, L. Sepunaru and G. Ménard, ACS Appl. Energy Mater., 2019, 2, 5391–5396 CrossRef
.
- M. Das Bairagya, R. J. Bujol and N. Elgrishi, Chem.–Eur. J., 2020, 26, 3991–4000 Search PubMed
.
- K. J. Lee, B. D. McCarthy, E. S. Rountree and J. L. Dempsey, Inorg. Chem., 2017, 56, 1988–1998 CrossRef
.
- C. A. Downes, J. W. Yoo, N. M. Orchanian, R. Haiges and S. C. Marinescu, Chem. Commun., 2017, 53, 7306–7309 RSC
.
- Y. Ding, C. Zhang, L. Zhang, Y. Zhou and G. Yu, Chem. Soc. Rev., 2018, 47, 69–103 RSC
.
- K. J. Lee, B. D. McCarthy and J. L. Dempsey, Chem. Soc. Rev., 2019, 48, 2927–2945 RSC
.
- D. J. Martin, B. D. McCarthy, N. A. Piro and J. L. Dempsey, Polyhedron, 2016, 114, 200–204 CrossRef CAS
.
- D. J. Martin, B. D. McCarthy, C. L. Donley and J. L. Dempsey, Chem. Commun., 2015, 51, 5290–5293 RSC
.
- E. S. Rountree and J. L. Dempsey, J. Am. Chem. Soc., 2015, 137, 13371–13380 CrossRef CAS
.
- E. S. Rountree and J. L. Dempsey, Inorg. Chem., 2016, 55, 5079–5087 CrossRef CAS
.
- A. D. Wilson, R. H. Newell, M. J. McNevin, J. T. Muckerman, M. Rakowski DuBois and D. L. DuBois, J. Am. Chem. Soc., 2006, 128, 358–366 CrossRef CAS
.
- K. Fraze, A. D. Wilson, A. M. Appel, M. Rakowski DuBois and D. L. DuBois, Organometallics, 2007, 26, 3918–3924 CrossRef CAS
.
- E. S. Wiedner, H. J. S. Brown and M. L. Helm, J. Am. Chem. Soc., 2016, 138, 604–616 CrossRef CAS
.
- I. Bhugun and J.-M. Savéant, J. Electroanal. Chem., 1995, 395, 127–131 CrossRef
.
-
A. J. Bard and L. R. Faulkner, Electrochemical Methods: Fundamentals and Applications, John Wiley & Sons, Inc., Hoboken, NJ, USA, 2nd edn, 2001 Search PubMed
.
- N. Kaeffer, A. Morozan, J. Fize, E. Martinez, L. Guetaz and V. Artero, ACS Catal., 2016, 6, 3727–3737 CrossRef CAS
.
- N. Elgrishi, K. J. Rountree, B. D. McCarthy, E. S. Rountree, T. T. Eisenhart and J. L. Dempsey, J. Chem. Educ., 2018, 95, 197–206 CrossRef CAS
.
- B. D. McCarthy, D. J. Martin, E. S. Rountree, A. C. Ullman and J. L. Dempsey, Inorg. Chem., 2014, 53, 8350–8361 CrossRef CAS
.
- K. J. Lee, C. T. Gruninger, K. M. Lodaya, S. Qadeer, B. E. Griffith and J. L. Dempsey, Analyst, 2020, 145, 1258–1278 RSC
.
- R. P. Wong, J. E. Wong and V. I. Birss, Can. J. Chem., 2004, 82, 1536–1544 CrossRef CAS
.
- P. Allongue, M. Delamar, B. Desbat, O. Fagebaume, R. Hitmi, J. Pinson and J.-M. Savéant, J. Am. Chem. Soc., 1997, 119, 201–207 CrossRef CAS
.
- C. Amatore, J. M. Savéant and D. Tessier, J. Electroanal. Chem. Interfacial Electrochem., 1983, 147, 39–51 CrossRef CAS
.
-
R. G. Compton and C. E. Banks, Understanding Voltammetry, Imperial College Press, London, 2nd edn, 2011 Search PubMed
.
-
J.-M. Savéant, Elements of Molecular and Biomolecular Electrochemistry, John Wiley & Sons, Inc., Hoboken, NJ, USA, 2006 Search PubMed
.
- C. W. Machan, Curr. Opin. Electrochem., 2019, 15, 42–49 CrossRef CAS
.
- K. J. Lee, N. Elgrishi, B. Kandemir and J. L. Dempsey, Nat. Rev. Chem., 2017, 1, 0039 CrossRef CAS
.
- F. A. Armstrong and G. S. Wilson, Electrochim. Acta, 2000, 45, 2623–2645 CrossRef CAS
.
- J. E. Frew and H. A. O. Hill, Eur. J. Biochem., 1988, 172, 261–269 CrossRef CAS
.
- Q. Wang, S. M. Zakeeruddin, D. Wang, I. Exnar and M. Grätzel, Angew. Chem., 2006, 118, 8377–8380 CrossRef
.
- Q. Huang, H. Li, M. Grätzel and Q. Wang, Phys. Chem. Chem. Phys., 2013, 15, 1793–1797 RSC
.
- D. H. Evans, Chem. Rev., 1990, 90, 739–751 CrossRef CAS
.
- C. P. Andrieux, P. Hapiot and J. M. Saveant, Chem. Rev., 1990, 90, 723–738 CrossRef CAS
.
- J. M. Savéant and K. B. Su, J. Electroanal. Chem. Interfacial Electrochem., 1984, 171, 341–349 CrossRef
.
- C. Costentin, T. R. Porter and J.-M. Savéant, J. Am. Chem. Soc., 2016, 138, 5615–5622 CrossRef CAS
.
- A. J. Downard, Langmuir, 2000, 16, 9680–9682 CrossRef CAS
.
- E. S. Rountree, B. D. McCarthy, T. T. Eisenhart and J. L. Dempsey, Inorg. Chem., 2014, 53, 9983–10002 CrossRef CAS
.
- D. J. Martin, B. D. McCarthy, E. S. Rountree and J. L. Dempsey, Dalton Trans., 2016, 45, 9970–9976 RSC
.
- J. Savéant, Chem. Rev., 2008, 108, 2348–2378 CrossRef
.
- E. Kätelhön and R. G. Compton, Analyst, 2015, 140, 2592–2598 RSC
.
- C. Amatore, J. Pinson, J.-M. Savéant, A. Thiebault, J. M. Savéant and A. Thiebault, J. Electroanal. Chem. Interfacial Electrochem., 1980, 107, 59–74 CrossRef CAS
.
- C. Costentin and J.-M. Savéant, ChemElectroChem, 2014, 1, 1226–1236 CrossRef CAS
.
- V. C.-C. Wang and B. A. Johnson, ACS Catal., 2019, 9, 7109–7123 CrossRef CAS
.
Footnotes |
| † Electronic supplementary information (ESI) available. See DOI: 10.1039/d0sc02592e |
| ‡ These authors contributed equally. |
| This journal is © The Royal Society of Chemistry 2020 |

