Hyper-fast gas chromatography and single-photon ionisation time-of-flight mass spectrometry with integrated electrical modulator-based sampling for headspace and online VOC analyses†
Christian
Gehm
a,
Kevin
Schnepel
a,
Hendryk
Czech
 *ab,
Toni
Miersch
a,
Sven
Ehlert
c and
Ralf
Zimmermann
ab
aJoint Mass Spectrometry Centre, Chair of Analytical Chemistry, University of Rostock, 18059 Rostock, Germany. E-mail: hendryk.czech@uni-rostock.de
bJoint Mass Spectrometry Centre, Cooperation Group “Comprehensive Molecular Analytics” (CMA), Helmholtz Zentrum München, 81379 München, Germany
cPhotonion GmbH, 19061 Schwerin, Germany
First published on 4th May 2021
Abstract
We developed a novel fast gas chromatography (fastGC) instrument with integrated sampling of volatile organic compounds (VOCs) and detection by single-photon ionisation (SPI) time-of-flight mass spectrometry (TOFMS). A consumable-free electrical modulator rapidly cools down to −55 °C to trap VOCs and inject them on a short chromatographic column by prompt heating to 300 °C, followed by carrier gas exchange from air to helium. Due to the low thermal mass and optical heating, the fastGC is operated within total runtimes including cooling for 30 s and 15 s, referring to hyper-fast GC, and at a constantly increasing temperature ramp from 30 °C to 280 °C. The application of soft SPI-TOFMS allows the detection of co-eluting VOCs of different molecular compositions, which cannot be resolved by conventional GC (cGC) with electron ionisation (EI). Among other analytical figures of merit, we achieved limits of detection for toluene and p-xylene of 2 ppb and 0.5 ppb, respectively, at a signal-to-noise ratio of 3 and a linear response over a range of more than five orders of magnitude. Furthermore, we demonstrate the performance of the instrument on samples from the fields of environmental research and food science by headspace analysis of roasted coffee beans and needles from coniferous trees as well as by quasi-real-time analysis of biomass burning emissions and coffee roast gas.
Introduction
Direct inlet mass spectrometry (DI-MS) is a powerful method for online analyses of volatile organic compounds (VOCs) when high time resolution is required or in headspace analysis. In particular, soft ionisation techniques, such as single-photon ionisation (SPI) and resonance-enhanced-multiphoton ionisation (REMPI),1 proton-transfer reaction (PTR), selected ion flow tube (SIFT) ionisation as well as chemical ionisation under vacuum (CI) or atmospheric pressure (APCI),2 generate predominantly molecular and quasi-molecular ions, showing advantages compared with fragmenting “hard” electron ionisation (EI) as they increase the interpretability of mass spectra. However, despite the possibility of using mass analysers with high resolution, isomers cannot be individually detected. Thermal desorption or liquid injection gas chromatography (GC) is able to separate isomeric compounds, but with the cost of losing time resolution of the measurement. Additionally, it requires labour-intensive offline sampling, e.g. on adsorbent tubes, in passivated stainless steel canisters or in gas sampling bags, which may be supported by cryogenic trapping, and subsequent sample preparation, such as solid phase microextraction.3 Moreover, VOCs may undergo significant degradation when adsorbed and exposed to atmospheric oxidants during sampling.4 For the online analysis of VOCs in tobacco smoke, a heated sample loop was successfully used; however, because of limitations in the GC operation, the method had an upper limit in analyte volatility equal to that of toluene.5 A portable GC instrument with sensor array detection was reported deploying a multi-stage adsorbent consisting of Carbopack B, Carbopack X and Carboxen 1000 for preconcentration with an integrated injection module with resistive heating, but with limitations to compounds having vapour pressures above 0.4 torr.6GC analysis can be divided based on its runtime and into conventional GC (cGC; runtime >20 min) from fast GC (3–20 min), very-fast GC (1–3 min), hyper-fast GC (1–60 s) and ultra-fast GC (<1 s).7 Starting from cGC, reduced GC runtimes may be achieved by different strategies, for example, by simply shortening column length or increasing the capillary inner diameter,7 leading to a lower peak capacity, plate number and height. Additionally, the GC run is often limited to isothermal conditions or less dynamic temperature programmes because of the time limitations. A unique fastGC approach was recently described with the extension of fast GC to two-dimensional fast GC, substantially increasing the separation performance while keeping the total GC runtime below 20 min.8
The addition of fast gas chromatography with runtimes below 20 min (fastGC) to different mass analysers offers a compromise between chemical specificity and time resolution. Often a baseline separation of two analytes is not necessary for the benefit from a shorter time of analysis to prevail. Such fastGC methods have been described for the analysis of samples from various fields, for example, tobacco smoke by SPI,5 monoterpenes from plants by SIFT,9 doping control by GC combustion isotope ratio MS,10 flame retardants by atmospheric pressure photoionisation (APPI)11 or whole-body, dermal and breath VOC emission from humans by PTR.12
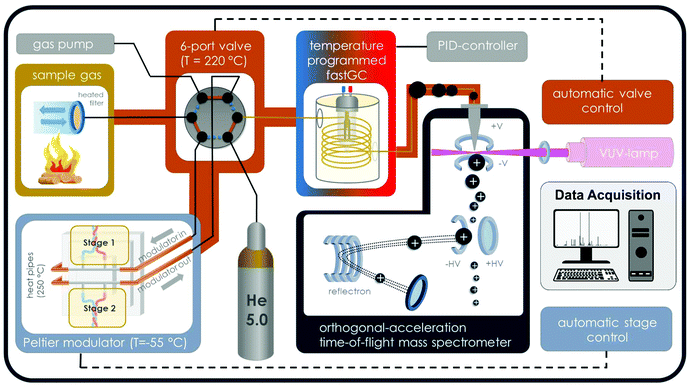
The setup of this study comprises individual devices to perform convenient VOC sampling and a rapid temperature programme to increase the chemical space of VOC detection compared to DI-MS in targeted and untargeted headspace and online analyses of complex mixtures and dynamic processes. An electrical consumable-free modulator with two stages rapidly cools down to −55 °C and heats up to 300 °C in order to trap and release VOCs on a GC column.13 Additionally, an optically heated GC enables fast temperature programmes within GC runtimes of 30 s with maximum heating rates and cooling rates of 10.0 K s−1 and 50 K s−1, respectively.14 After successful application of the optically heated GC for the cryogenic sampling of VOCs evolving from the simulation of nut roasting in thermal gravimetric analysis,15 we present headspace and online measurements of environmental and food samples with carrier gas exchange to helium for rapid analysis with advanced chemical speciation of VOCs by hyper-fast GC-SPI time of-flight mass spectrometry (TOFMS) for quasi-real-time monitoring.
Experimental
Materials, chemicals and samples
Analytical figures of merit were obtained from the analysis of a gas standard consisting of toluene and p-xylene in a pressure vessel filled with nitrogen. The true concentration was obtained from comparing the measured intensities with the intensities from a calibration gas standard (BTXT) of either 10 ppm or 1 ppm in nitrogen 5.0 (benzene, toluene, p-xylene and 1,2,4-trimethylbenzene (TMB); Linde AG, Munich, Germany). Additionally, a standard solution of eight monoterpenes containing α-pinene, β-pinene (99% purity, Sigma-Aldrich, Merck KGaA, Darmstadt, Germany), Δ-3-carene (90% purity, TCI-Tokyo Chemical Industry Co., Ltd, Tokyo, Japan), α-terpinene, camphene (95% purity, Sigma-Aldrich, Merck KGaA, Darmstadt, Germany), limonene, γ-terpinene (95% purity, TCI-Tokyo Chemical Industry Co., Ltd, Tokyo, Japan), and myrcene (technical grade, Sigma-Aldrich, Merck KGaA, Darmstadt, Germany) was prepared in methanol (99.9% purity, ROTISOLV® HPLC Gradient, Carl Roth GmbH + Co. KG, Germany).Pine needles on small twigs of black pine (Pinus nigra) and Serbian spruce (Picea omorika) were collected at suburban sites of Rostock, Germany. Branches and twigs of Scots pine (Pinus sylvestris) and common oak (Quercus robur) from freshly cut branches were stored for two weeks in a dry place at room temperature and burned with a batch size of approximately 2.0 kg in an open fireplace.
Green coffee beans of Arabica coffee from Brazil (Santos) and Colombia (Excelsior) and Robusta coffee from Vietnam (Grade 3) were roasted in a drum roaster (Probatino, PROBAT-Werke von Gimborn Maschinenfabrik GmbH, Emmerich am Rhein, Germany; batch size of 1.5 kg) to a medium-dark roast degree, determined by a reflectance measurement (Colorette 3b, PROBAT-Werke von Gimborn Maschinenfabrik, Emmerich am Rhein, Germany).
Instrumentation
The instrumental setup consists of an electrical 2-stage modulator,13 an optically heated fastGC,14 an orthogonal acceleration time-of-flight mass spectrometer (oa-TOFMS; Tofwerk AG, Thun, Switzerland; 1300 time-of-flight resolution at m/z 92), a deuterium VUV-lamp for ionisation (L2D2 lamp L7293, Hamamatsu Photonics K. K., Japan; spectral distribution from 115 nm to 400 nm, VUV peak emission at 126 nm and 122 nm) and a heated 2-way-6-port valve (Valco Instruments Inc., Houston, TX) (Fig. 1). VOCs were sampled, either directly or from a headspace container (volume of 20 ml, clear glass), through a heated deactivated transfer capillary (Restek MXT Gurad Column, ID of 530 μm, 2 m length, BGB Analytik Vertrieb GmbH; heated to 205 °C) and trapped on a GC column (HT-5, SGE Analytical Science Ltd; ID 250 μm, film thickness 0.1 μm) inside the modulator, which is cooled to −55 °C in sampling mode. Subsequently, the sample was transferred from the modulator stage into the optically heated fastGC unit with 3 m GC column length by rapid temperature increase. At the same time, the 2-way-6-port valve changed its position from “sampling” to “GC”, providing helium as carrier gas. Eluents from fastGC separation over the GC column with a temperature ramp from 30 °C to 280 °C (equal to a temperature ramp of 10 K s−1) were ionised by SPI with VUV photons from the deuterium lamp. The mode of photon energies from the deuterium lamp appears in the range of common ionisation energies for organic molecules and principally for all compounds with ionisation energies below 10.78 eV, equal to the lower emission wavelength limit of 115 nm, may be ionised, but with different ion yields. Consequently, the low amount of excess energy received by a molecule causes only minor fragmentation.1 Finally, the ions were detected by oa-TOFMS with an ion extraction frequency of 70![[thin space (1/6-em)]](https://www.rsc.org/images/entities/char_2009.gif) 000 Hz and a data acquisition rate of 20 Hz. Thus, 3500 individual spectra were accumulated to generate one mass spectrum with a resulting time resolution of 50 ms. After the chromatographic run of 25 s, the fastGC column is cooled by blowing room air for 5 s, enabling the procedure to be repeated. Hence, we sort our fastGC analysis to the class of hyper-fast GC.
000 Hz and a data acquisition rate of 20 Hz. Thus, 3500 individual spectra were accumulated to generate one mass spectrum with a resulting time resolution of 50 ms. After the chromatographic run of 25 s, the fastGC column is cooled by blowing room air for 5 s, enabling the procedure to be repeated. Hence, we sort our fastGC analysis to the class of hyper-fast GC.
Sampling and settings in headspace and online analyses
Headspace analysis of needles and coffee beans was conducted in a glass container with a volume of 20 cm3, which was provided with a hole of 0.5 mm in diameter for equilibrium to avoid low pressure caused by a sample flow of approximately 4 ml min−1 with a 2-way-6-port-valve in the position “sampling” (20 ml min−1 in the valve position “GC” during desorption). Online analyses of hot gases from coffee roasting or biomass burning were performed from a heated sample line with 4 mm inner diameter, consisting of stainless steel, which was heated to 180 °C.We found that compounds at the upper limit of the VOC range sampled from hot exhaust gas of coffee roasting and biomass burning were inefficiently released from the modulator and did not appear as peaks in the chromatogram. Therefore, we increased the time for injecting trapped compounds from the modulator into the GC to 15 s. However, this benefit of increased volatility range for analytes was achieved at the cost of losing sampling time. In headspace analyses at room temperature and calibration gas measurements, the analyte volatility range has a lower ceiling, so the effect of longer injection time was small. However, for comparison purposes, all measurements were carried out with the same modulator settings except the online measurements at the coffee roaster because of high concentrations and higher required time resolution. To achieve the necessary time resolution for the coffee roast gas analysis, we shortened the GC cycle to 15 s with 3 s of modulator sampling and a GC runtime of 12 s with the same start and end temperature, thus increasing the temperature ramp by a factor of 2 compared to the other measurements.
Data analysis
Data processing and analysis was performed using MATLAB (version 2018; The MathWorks Inc., Natick, MA) with self-developed processing routines and the Matlab Statistics Toolbox for non-negative matrix factorisation (NMF). For deconvolution purposes, NMF was applied with a combined multiplicative update algorithm for initial value optimisation followed by an alternating least-squares algorithm16 with a maximum number of 20 iterations in each of the 100 performed replicates.Results and discussion
Analytical figures of merit
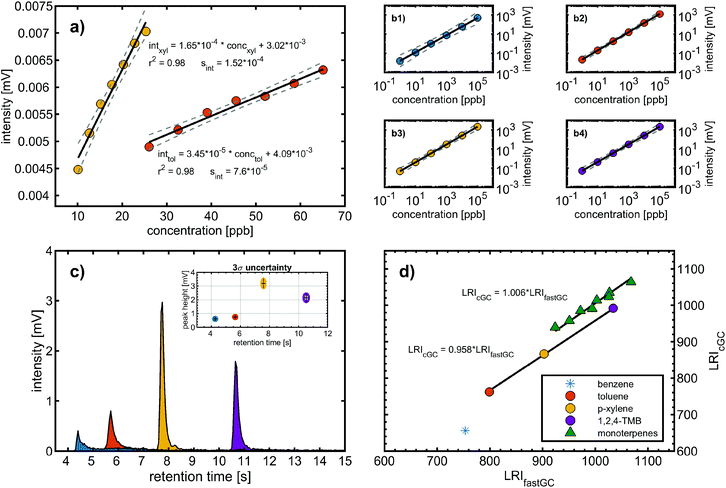
The following figures of merit were determined with the calibration gas standard and comprises the trapping efficiency of the modulator, limit of detection (LOD), linearity and dynamic range related to the mass spectrometric detection, and reproducibility of the chromatographic separation (Fig. 2). | (1) |
It has been found that the photoionisation cross-section at 126 nm of p-xylene differs by less than 25% of the one of toluene;19 we attribute the lower LOD of p-xylene to the higher trapping efficiency.
In the second approach, we created a calibration function starting with six calibration standards of one order of magnitude higher concentrations than the LOD determined based on blank values (LODblank). Similarly, each data point was generated from 10 consecutive chromatograms and the resulting linear regression had a coefficient of determination >0.98 for both calibration functions (Fig. 2a). We obtained LODs from the calibration functions (LODcfun) of 7.1 ppb and 3.0 ppb for toluene and p-xylene, respectively, which are about a factor of 4 higher than LODblank. The LODcfun is directly related to the goodness of the calibration function and the selected parameters, such as distance between the concentrations. From the repeated analyses of 1 ppm of BTXT, we assessed a mean relative measurement uncertainty of 15% (3σ of 36 chromatograms) (Fig. 2c), which is close to the distance between the concentrations causing larger confidence bands and consequently higher LODcfun.
The linearity and dynamic range of the fastGC setup was evaluated with six concentrations standards of 1 ppb to 100 ppm of BTXT prepared in methanol, which was injected using a nebuliser system.20 From the log–log-presentation of the data, we obtained coefficients of determination of 0.97 for benzene and >0.99 for toluene, p-xylene and TMB. Furthermore, the peak intensity at 100 ppm approaches the upper limit of the measurement channel. The dynamic range of an instrument is defined as the ratio of this upper measurement limit and the LOD.21 Hence, the fastGC setup gives a linear response with increasing concentrations over more than five orders of magnitude (Fig. 2b).
The peak shapes were evaluated by the symmetry coefficient S. For this purpose, we drop a perpendicular from the maximum peak height and consider the distances of this perpendicular to the peak on the left (B) and right hand side (A) at 10% peak height:
 | (2) |
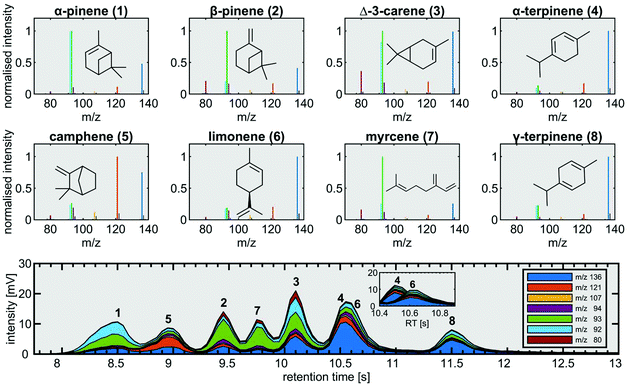
Therefore, S > 1 denotes peak tailing and S < 1 denotes peak fronting. For the aromatic compounds of BTXT, there is a tendency towards tailing eluents, confirmed by the S values from 5.5 (benzene) to 2.4 (TMB) at concentrations in the centre of the dynamic range (Fig. 2c). We attribute this behaviour to relatively strong interactions between the GC column material inside the modulator and the p-orbitals of the aromatic π-systems since the symmetry coefficient S of aliphatic compounds, such as monoterpenes, approaches unity (Fig. 3 bottom).
 | (3) |
For BTXT, we obtained a limited agreement between the LRI from the study by Lai et al. (1995)24 and our measurements (Fig. 2d). In particular for benzene having the highest volatility of all analytes, the LRI from our measurements exceeds the LRI from cGC of 656 by 99, which is distinctly higher than the suggested maximum difference of 1%.25 Other constituents of BTXT also have a higher LRI than that reported in the literature, but with an almost constant positive bias of 4.4% and consequently high correlation (without benzene r2 = 0.999; including benzene: r2 = 0.910). In the data reported by Lai et al. (1995),24 it is evident that increasing the temperature ramp of the GC run increases the LRI, so substantially higher LRIs at a temperature ramp of 600 °C min−1 in our measurements are reasonable. In the case of benzene, the LRI additionally suffers from increased uncertainty because of extrapolation and very low retention time with associated high uncertainty of RTn-hexane. In order to further explore this issue, we investigated the behaviour of the compound class of monoterpenes, which covers boiling points within the range of BTXT, with regard to their LRIs and compared them to a previously reported LRI.26 In fact, the agreement for this compound class was substantially better than for BTXT with differences in the LRI of less than 1% for all monoterpenes except α-pinene, β-pinene and Δ-3-carene (Fig. 2d). Therefore, the suitability of LRIs from different temperature programmes for compound identification in fastGC analysis may differ between compound classes and volatilities. However, the eluting monoterpenes followed the order which can be expected from the LRI determined by cGC. Moreover, we ran a Monte Carlo simulation of 1000 repetitions for limonene, eluting between n-decane and n-undecane, to estimate the uncertainty of its LRI in fastGC based on the uncertainty in retention time we obtained from 36 chromatograms. The resulting root mean squared error (RMSE) of ±2.7 is distinctly higher than the general uncertainty in the LRI for cGC of ±2 or 1% of LRIcGC,24,25 but may still be useful for compound identification if a database for typical temperature-programmed fastGC is available.
Headspace analysis
Measurements with the fastGC setup were conducted for two common applications from the field of environmental chemistry and food science. Rapid measurements in headspace analysis with fastGC may open the possibility of high-throughput screening of multiple samples and enables the analysis of dynamic VOC composition in the case of a static experimental setup with changing experimental conditions.We started our targeted analysis with a mixture of eight individual monoterpenes to obtain their retention times and mass spectra (Fig. 3). The chromatogram was built from two monoterpene standards with alternating retention times not only to attain information on the pure substances, but also to illustrate the situation in a measurement of a real sample.
Despite generally fragment-poor ionisation, the base peaks in the mass spectra of rather labile α-pinene, β-pinene and myrcene did not appear as molecular ions at m/z 136. The main fragments we observed were m/z 80, m/z 92, m/z 93, m/z 94, m/z 107 and m/z 121, which exceeded the intensity of the molecular ion for all monoterpenes except for α-terpinene, γ-terpinene and limonene. With the applied temperature settings, all monoterpenes eluted between the retention times of 8 s and 13 s (Fig. 3). In order to keep the analysis time short, we accepted the poor separation of myrcene and Δ-3-carene as well as α-terpinene and limonene with a chromatographic resolution of 0.52 and less than 0.05, respectively. Although not baseline-resolved, myrcene and Δ-3-carene may be distinguished by their characteristic fragmentation patterns. For the separation problem of α-terpinene and limonene, we exploited those differences by 100 runs of the NMF procedure described in the section on data analysis with a two-factor solution in order to deconvolve the unresolved chromatographic peak. The mean result of NMF outputs gave two distinct peaks having uncentred correlation coefficients of >0.97 with the mass spectra of pure α-terpinene and limonene, respectively (Fig. 3, bottom).
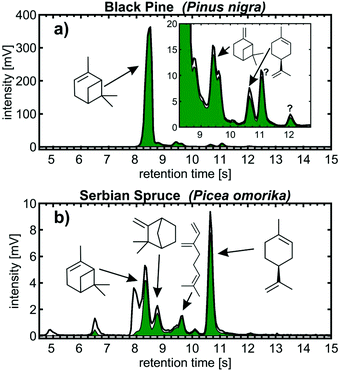
Needles of black pine and Serbian spruce from the pine family Pinaceae were selected as real samples for the headspace analysis of natural monoterpene emissions. All monoterpenes were identified based on their retention time at a peak height within a tolerance of 0.1 s and the uncentred correlation coefficient of the mass spectrum of the pure monoterpene of >0.9. In particular for black pine, monoterpene emissions were strongly dominated by α-pinene,30 accounting for 88% of the total peak height associated with m/z from the monoterpenes (Fig. 4a). Furthermore, β-pinene, myrcene, limonene, Δ-3-carene and, despite the high interfering peak of α-pinene, also camphene were detected together with two unknown peaks with retention times at 11.05 s and 12.05 s. The peaks of retention times beyond the eight targeted monoterpenes showed highest correlations with the fragment-poor mass spectra of α-terpinene, γ-terpene and limonene. Thus, the mass spectral signature points toward a monocyclic monoterpene with a menthane backbone, which is likely β-phellandrene when additionally considering its LRI between limonene and γ-terpinene as well as its general abundance in black pine needles.30 The peak at a retention time of 12.05 s shows a clear contribution from the molecular monoterpene ion at m/z 136, but more substantial fragmentation, giving an indication of an aliphatic or bicyclic monoterpene species.
We could detect almost the same monoterpenes for the needles of Serbian spruce (Fig. 4b) as for black pine, but with more equally distributed concentrations. The highest peaks eluting at 10.65 s and 8.35 s can be attributed to limonene and α-pinene, respectively, followed by minor contributions of camphene, myrcene and Δ-3-carene.
Considering fastGC-SPI-TOFMS as an untargeted analysis, other emissions from conifer needles could also be detected, such as VOCs of higher or similar volatility as monoterpenes indicated by the difference between the monoterpene-related and total peak intensity, which is in particular pronounced for short retention times of the Serbian spruce needles (Fig. 4b). At later retention times, terpenoids (m/z 196), such as bornyl acetate, and sesquiterpenes (m/z 204), such as farnesene or caryophyllene, become visible (Fig. S2†).
For the mentioned applications of coffee headspace analysis, it is not entirely important to identify or even quantify the compounds of each individual peak rather than to increase the chemical space to a level enabling differentiation between coffee cultivars, origins or treatments while keeping cost and benefit balanced. For example, even not resolving isobaric compounds, DI-SPI-TOFMS has been demonstrated as a rapid analyser suitable to track rapid changes during coffee roasting with interpretable mass spectra due to its softness in ionisation.35,36
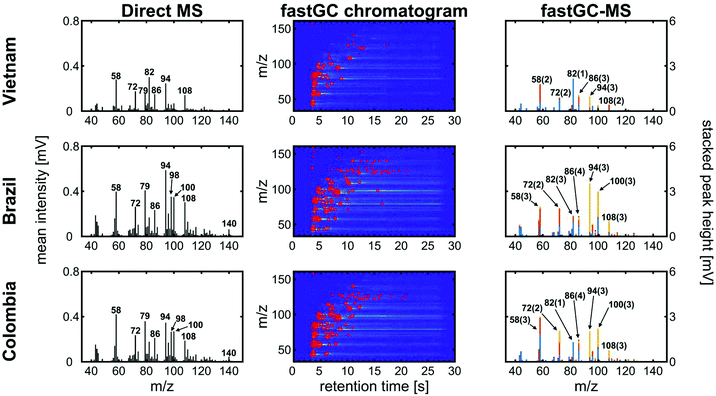
Three different green coffees from Vietnam, Brazil and Colombia were roasted in a drum roaster receiving the same roast profile (Fig. S3†), which resulted in different medium roast degrees. After degassing overnight, the roasted coffee beans were ground and analysed by fastGC-SPI-TOFMS. In the mass spectra without exploiting the chromatographic resolution, the three coffees exhibit differences in their mass spectrometric patterns (Fig. 5, left column). In particular in the lower mass range, some peaks may be unambiguously assigned to molecular structures based on knowledge from previous GC-MS studies, the ionisation threshold determined by the photon energy, the limited number of possible isomers or the strong dominance of an individual compound toward a specific m/z. Such unambiguous assignments not only include methanethiol (m/z 48), ethanethiol (m/z 62), pyrrole (m/z 67), or pyridine (m/z 79), which are directly associated with the coffee flavour37 or indirectly connected to other coffee properties such as antioxidant capacity or roast degree,31,38 but also caffeine (m/z 194) in the higher m/z range.
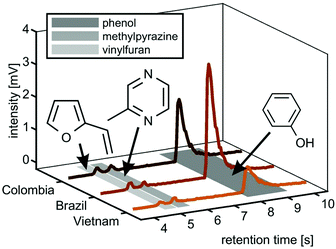
However, the two Arabica coffees from Brazil and Colombia have a high uncentred correlation coefficient of 0.98, while even between the Arabica coffees and the Robusta coffee from Vietnam we obtained good uncentred correlation coefficients of 0.86 (Brazil) and 0.89 (Colombia), respectively. The addition of fastGC gives rapid insights into the contribution of isomeric compounds to each peak (Fig. 5, centre column), which also cannot be resolved at a higher mass resolution. For each nominal m/z, the fastGC detects up to four individual contributions in the case of m/z 86 for Brazilian Arabica coffee, which have been linked to several carbonyl compounds, such as pentanal, butadiones, butyrolactone, methylbutanones and methylbutanols35 (and references therein). Moreover, at m/z 94, we detected three peaks belonging to vinylfuran, 2-methylpyrazine and phenol (Fig. 6), which were assigned using their relative LRI and previous studies on coffee-related VOCs.39,40 2-methylpyrazine is known for its nutty, roasted, and chocolate aroma41 and appears with a high relative abundance already in light roasts,40 whereas phenol increases toward darker roasts caused by high activation energy degradation pathway of chlorogenic acids.42 All three coffee cultivars received the same roast profile, but ended up with different roast degrees. Therefore, the fastGC setup may be capable for offline quality control of roasted coffee.
In total, we increased the number of detected peaks from 31 (Vietnam), 47 (Brazil) and 46 (Colombia) at a nominal m/z in DI-SPI-TOFMS to 53 (Vietnam), 129 (Brazil) and 106 (Colombia) individual contributions for the three coffee samples, pointing toward a higher potential in the performance of fastGC-SPI-TOFMS data in chemometric prediction or discrimination models.
Online analysis
As our fastGC setup allows rapid headspace analysis and increased confidence of the results from frequently repeated measurements, its potential is even more exploited in processes with dynamic changes in VOCs, as shown by Fischer et al. for the case of nut roasting simulation.15 The following section describes the online analyses with a quasi-real-time resolution below 30 s, performed for the monitoring of the evolution of coffee roast gases and VOC emissions from the combustion of biomass.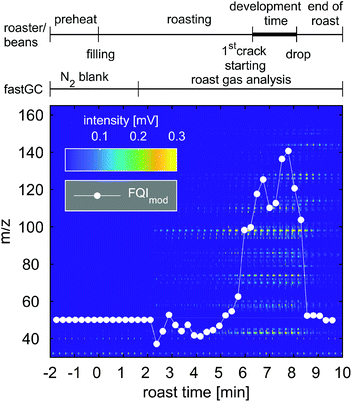 | ||
| Fig. 7 Image plot of 45 consecutive chromatograms of 15 s acquired during one roast experiment with Colombian Arabica coffee. Peak intensities of the chromatogram are illustrated according to the colour bar. The white dots represent the modified Flavour Quality Index (FQImod) comprising hexanal (m/z 100), vinylpyrazine (m/z 106), pyrrole (m/z 67), furfurylmethylketone (m/z 124) and pyridine (m/z 79). The roast profile and individual contributions to FQImod can be found in Fig. S3 and S4.† | ||
Many attempts have been made to correlate and finally predict the sensorial properties of coffee from its VOC composition by chemometric models.32,43 Some of them were simplified to only few compounds, such as the Flavour Quality index (FQI),37 which was obtained from a multiple regression model and calculated by
 | (4) |
We modified the FQI to FQImod by removing the intercept and replacing the concentrations with measured peak heights, so the absolute FQImod differs from the FQI, but adopts its trend. Regarding the included VOCs of the regression model, we note that pyrrole (m/z 67) and pyridine (m/z 79) show a unique nominal m/z with negligible interference from other compounds. At m/z 100, several isomers of the sum formula C6H12O or C5H8O2 are known, such as 2,3-pentadione, 4-methyl-2-pentanone and the so-called “coffee furanone” 2-methyldihydro-3(2H)-furanone,39 which all may interfere with hexanal. We observed two distinct peaks in the chromatogram and recognised that hexanal and 2-methyldihydro-3(2H)-furanone have a higher LRI than other carbonyl compounds at m/z 100.44 However, the peak in the mass spectrum at m/z 101, originating from heavier isotopes, varies and appears between the theoretical values of 5.6% for C5H8O2 and 6.7% for C6H12O of the peak height at m/z 100, indicating contributions from different isomers. Nevertheless, we tentatively assigned the second peak in the chromatogram to hexanal. Moreover, we followed this approach for elution order, considering an elution order of furan < pyrazine < benzene derivatives at the same nominal m/z, and also for the assignment of furfurylmethylketone and vinylpyrazine with the interfering compounds guaiacol (2-methoxyphenol) and benzaldehyde, respectively, to obtain the FQImod. Finally, we transferred the model from offline analysis into the time domain to investigate flavour formation during the coffee roast.
During the blank measurement with N2, the FQImod remained reasonably constant and started to fluctuate after 2 min until approximately 5 min 30 s. At this time, more m/z increase in their intensities as well as FQImod until a roast time of 7 min, referring to a lighter roast (“Cinnamon roast” to “American roast”) after the first crack of the coffee beans which we heard at approximately 6 min 45 s. Thirty seconds later, the FQImod reincreases to its maximum value during the roast, which still appeared before the second crack of the coffee beans. Between the first and second cracks, the coffee beans undergo the most significant changes in their physical and chemical properties, which is associated with flavour formation and known as “development time”.45 The subsequent decline in the FQImod may be explained by the distinct increase and higher relative contribution of pyridine, which is a common indicator for dark or overroast,36 to the intensities of individual roast gas components included in the FQImod (Fig. S4†). Analysing the roast degree of the coffee beans, we obtained in fact a darker roast with a Colorette value of 81, corresponding to a medium-roasted (“City roast”) coffee.
With the FQImod as a proxy for the coffee flavour, we demonstrate that upon shortening the GC runtime to 15 s the fastGC-SPI-TOFMS is capable of recording a rapid flavour formation, occurring within 2 min, as revealed from the roast gas analysis of a commercial drum roaster with a realistic roast profile. Most likely, also the online prediction of other coffee properties, such as roast degree or antioxidant capacity, which have been modelled from the photoionisation TOFMS data,38,46 would benefit from the enhanced chemical specificity of the fastGC addition.
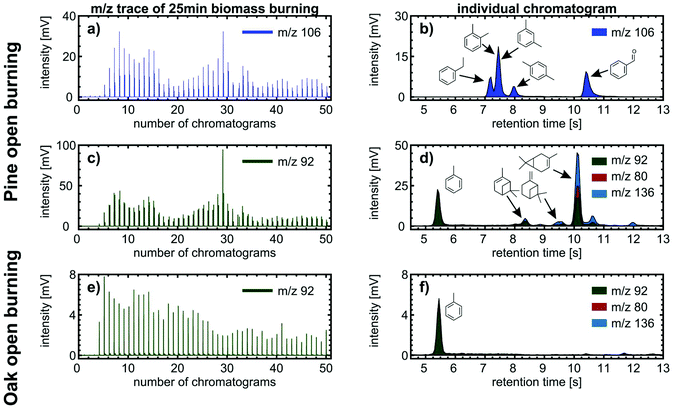
The benefit of the increased chemical space of the analysis is demonstrated using two examples about compound identification with high confidence. For m/z 106 in pine burning emissions, we obtained varying peak heights and four separated peaks between retention times of 7 s and 11 s in each individual chromatogram (Fig. 8a and b). From previous analysis of biomass burning VOCs, we know that alkylated benzenes (C8H10: o-xylene, m-xylene, p-xylene, and ethylbenzene) and benzaldehyde (C7H6O) are present in the emissions, whereas compounds of the sum formulae C4H10O3 were not detected and other possible isobars containing heteroatoms different from oxygen are unlikely to appear at such high intensities.50 Furthermore, we assigned the peaks based on the order of elution in non-polar GC columns, which follows approximately the order of boiling points. Among these five analytes, benzaldehyde has the highest boiling point, so we assigned the peak eluting at 10.4 s. The four aromatic hydrocarbons have less difference in boiling points, which is reflected by a closer LRI;24o- and m-xylene even co-elute in cGC analysis. Hence, the remaining three peaks at 7.2 s, 7.4 s and 7.95 s are assigned to ethylbenzene, co-eluting o- and m-xylene, and p-xylene.
The second example of benefits from additional chromatographic resolution deals with the quantification of individual VOCs in wood combustion emissions by direct SPI-TOFMS, as described in previous studies,49,51 assuming that only a single analyte contributes to the intensity of an individual m/z. We revised this assumption for m/z 78 (benzene), 92 (toluene), 104 (styrene), 116 (indene) and 128 (naphthalene) in open burning experiments of pine branches and twigs including needles. For m/z 78, 104, 116 and 128, we obtained 95% contribution of the tentatively assigned VOCs. However, for m/z 78, the contribution of other compounds, likely from some minor fragmentation of methoxyphenols, may account occasionally up to 45% of its total intensity. The largest discrepancy we observed was for m/z 92, to which toluene may account for less than 20% and 48% on average of the total intensity. In addition to eluting toluene at 5.4 s, further peaks appeared in the retention time range between 8 and 11 s (Fig. 8c and d), which is also covered by monoterpenes. Here, α-pinene and Δ-3-carene are the two monoterpenes with a high intensity of the fragment ion at m/z 92 and the most abundant monoterpene species measured in a Scots pine forest.52
The hypothesis of monoterpenes in the Scots pine burning VOC emissions was supported by burning twigs and foliage of common oak as a negative control because it contains significantly less monoterpenes than coniferous trees and consequently shows significantly smaller peaks than toluene at later retention times for m/z 92 (Fig. 8e and f). Hence, we may expect that toluene quantification by direct SPI-TOFMS was overestimated as in Norway spruce logwood combustion in a modern masonry heater49 and softwood pellet combustion under various pellet boiler conditions.51 However, monoterpenes are more abundant in needles than in bark or stem wood,53 turning the overestimation of toluene by a factor of two into similar ranges as for other quantified VOCs at m/z with assumed contribution of a single VOC.
We compared the averaged mass spectra from fastGC-SPI-TOFMS of open burning common oak and direct SPI-TOFMS measurements of beech logwood burned in a modern masonry heater49 (Fig. S5†). As expected from BTXT measurements on the trapping efficiency, the mass spectrometric pattern from fastGC-SPI-TOFMS has a bell-like shape, whereas the direct SPI-TOFMS measurement reveals declining intensities toward increasing m/z. On the one hand, small VOCs, i.e. very volatile organic compounds (VVOCs), are less efficiently trapped on the modulator, but on the other hand, there is a clear benefit from the fastGC of VOC speciation in the higher m/z range. For example, the fastGC is able to unravel up to 13 different individual contributions to m/z 94 (e.g. phenol and fragments from monoterpenes), separate the isobars 1-methylnaphthalene and 2-methylnaphthalene at m/z 142, and exclude significant contribution at m/z 124 from ions except the common lignin pyrolysis product 2-methoxyphenol (guaiacol).54 These findings were obtained only from prior knowledge about VOC emissions from biomass burning, but may be extended by more systematic work on the effect of LRI from rapid temperature ramps and investigations on the fragmentation behaviour in SPI.
Conclusions
A new fastGC setup with integrated modulator sampling and detection by SPI-TOFMS was presented with its figures of merit and demonstrated in the headspace and online analyses of samples from complementary fields. The total GC cycles of these studies last for 30 s and 15 s, thus classifying our fastGC more precisely as hyper-fast GC. Regarding LOD and precision, its performance is competitive with previously described instruments consisting of fastGC and mass spectrometric detection using soft ionisation techniques, and has advantages in chromatographic separation and GC runtime due to a highly flexible optically heated GC unit and switch of carrier gas to helium. Additionally, the analysis benefits from the soft ionisation as co-eluting analytes of different molecular masses are separated by the mass spectrometric dimension, which does not hold for hard ionisation techniques, such as EI. On the other hand, LRIs in fastGC are fraught with higher uncertainty compared to cGC and are only usable from LRI databases to a limited extent for compound identification, for example, by considering the relative elution order of analytes. However, an implementation of quasi-simultaneous SPI/EI55 and integration of fastGC and MS data with both hard and soft ionisation techniques may substantially enhance compound identification and classification.56Headspace analysis of needles from coniferous trees reveals a sufficient chromatographic separation of the most abundant monoterpenes. However, even without identification by authentic standards, peaks may be assigned to common molecular indicators of the coffee roast degree in the analysis of ground roast coffee beans of different origin. As an alternative use of the short runtime for high-throughput, repeated measurements within the runtime of cGC increases the confidence of an offline measurement result.
All individual components synergise the performance of the fastGC setup in the online analysis with a quasi-real-time resolution. Again, coffee roasting involves complex flavour development, which may be appropriately monitored by a further total GC cycle duration of 15 s, also offering potential for more accurate real-time prediction of coffee properties relevant for human health or quality assurance. Also for the investigation of combustion emissions from solid fuels with dynamic changes in VOC emissions, our fastGC setup is capable of resolving multiple isobaric compounds, which may be of interest for a toxicological assessment of e.g. flaming and smouldering combustion phases or an estimation of formation potential of health- and climate-relevant SOA.
Author contributions
H. C. and C. G. conceptualised the study. H. C. and C. G. coordinated the research planning and execution. C. G., K. S., S. E. and T. M. designed the methodology. K. S. and C. G. performed the experiments, measurements and their validation. C. G. and K. S. carried out the data curation. C. G., K. S. and H. C. carried out the formal analysis. H. C. visualized the data. H. C. wrote the original manuscript draft. H. C. and R. Z. acquired the funding. All authors reviewed and edited the manuscript draft and approved its final version.Conflicts of interest
Sven Ehlert is employed by Photonion GmbH, manufacturer of the fastGC and electrical modulator. Other authors declare that they have no conflict of interest.Acknowledgements
This work was supported by the German Science Foundation (DFG, grant number ZI 764/14-1) and the Helmholtz Association of German Research Centres (HGF) within the Helmholtz International Lab aeroHEALTH (Interlabs-0005). We thank Jan Heide for coffee roasting and comments on flavour formation.References
- L. Hanley and R. Zimmermann, Anal. Chem., 2009, 81, 4174–4182 CrossRef CAS PubMed.
- F. Biasioli, C. Yeretzian, T. D. Märk, J. Dewulf and H. van Langenhove, TrAC, Trends Anal. Chem., 2011, 30, 1003–1017 CrossRef CAS.
- K. Demeestere, J. Dewulf, B. de Witte and H. van Langenhove, J. Chromatogr. A, 2007, 1153, 130–144 CrossRef CAS PubMed.
- H. Sonderfeld, I. R. White, I. C. A. Goodall, J. R. Hopkins, A. C. Lewis, R. Koppmann and P. S. Monks, Atmos. Chem. Phys., 2016, 16, 6303–6318 CrossRef CAS.
- M. S. Eschner, I. Selmani, T. M. Gröger and R. Zimmermann, Anal. Chem., 2011, 83, 6619–6627 CrossRef CAS PubMed.
- Q. Zhong, W. H. Steinecker and E. T. Zellers, Analyst, 2009, 134, 283–293 RSC.
- M. Zoccali, P. Q. Tranchida and L. Mondello, TrAC, Trends Anal. Chem., 2019, 118, 444–452 CrossRef CAS.
- B. Giocastro, M. Piparo, P. Q. Tranchida and L. Mondello, J. Sep. Sci., 2018, 41, 1112–1117 CrossRef CAS PubMed.
- M. Lacko, N. Wang, K. Sovová, P. Pásztor and P. Španěl, Atmos. Meas. Tech., 2019, 12, 4965–4982 CrossRef CAS.
- H. J. Tobias and J. T. Brenna, Analyst, 2018, 143, 1124–1132 RSC.
- R. A. Di Lorenzo, V. V. Lobodin, J. Cochran, T. Kolic, S. Besevic, J. G. Sled, E. J. Reiner and K. J. Jobst, Anal. Chim. Acta, 2019, 1056, 70–78 CrossRef CAS PubMed.
- N. Wang, N. Zannoni, L. Ernle, G. Bekö, P. Wargocki, M. Li, C. J. Weschler and J. Williams, Environ. Sci. Technol., 2021, 55, 149–159 CrossRef CAS PubMed.
- S. Wohlfahrt, M. Fischer, J. Varga, M.-R. Saraji-Bozorgzad, G. Matuschek, T. Denner and R. Zimmermann, Anal. Chem., 2016, 88, 640–644 CrossRef CAS PubMed.
- M. Fischer, S. Wohlfahrt, J. Varga, G. Matuschek, M. R. Saraji-Bozorgzad, T. Denner, A. Walte and R. Zimmermann, Anal. Chem., 2015, 87, 8634–8639 CrossRef CAS PubMed.
- M. Fischer, S. Wohlfahrt, J. Varga, G. Matuschek, M. R. Saraji-Bozorgzad, A. Walte, T. Denner and R. Zimmermann, Food Anal. Methods, 2017, 10, 49–62 CrossRef.
- M. W. Berry, M. Browne, A. N. Langville, V. P. Pauca and R. J. Plemmons, Comput. Stat. Data Anal., 2007, 52, 155–173 CrossRef.
- D. Materić, M. Lanza, P. Sulzer, J. Herbig, D. Bruhn, C. Turner, N. Mason and V. Gauci, Anal. Bioanal. Chem., 2015, 407, 7757–7763 CrossRef PubMed.
- M. J. Meyer, G. M. Schieffer, E. K. Moeker, J. J. Brodersen, O. F. Swenson and A. J. Borgerding, Anal. Chem., 2004, 76, 1702–1707 CrossRef CAS PubMed.
- M. S. Eschner and R. Zimmermann, Appl. Spectrosc., 2011, 65, 806–816 CrossRef CAS PubMed.
- C. Gehm, T. Streibel, J. Passig and R. Zimmermann, Appl. Sci., 2018, 8, 1617 CrossRef.
- L. Fernandez, J. Yan, J. Fonollosa, J. Burgués, A. Gutierrez and S. Marco, Front. Chem., 2018, 6, 209 CrossRef PubMed.
- E. Kováts, Helv. Chim. Acta, 1958, 41(7), 1915–1932 CrossRef.
- H. van den Dool and P. D. Kratz, J. Chromatogr. A, 1963, 11, 463–471 CrossRef CAS.
- W.-C. Lai and C. Song, Fuel, 1995, 74, 1436–1451 CrossRef CAS.
- N. Strehmel, J. Hummel, A. Erban, K. Strassburg and J. Kopka, J. Chromatogr. B: Anal. Technol. Biomed. Life Sci., 2008, 871, 182–190 CrossRef CAS PubMed.
- C. Krill, S. Rochfort and G. Spangenberg, Metabolites, 2020, 10, 276–289 CrossRef CAS PubMed.
- M. Hallquist, J. C. Wenger, U. Baltensperger, Y. Rudich, D. Simpson, M. Claeys, J. Dommen, N. M. Donahue, C. George, A. H. Goldstein, J. F. Hamilton, H. Herrmann, T. Hoffmann, Y. Iinuma, M. Jang, M. E. Jenkin, J. L. Jimenez, A. Kiendler-Scharr, W. Maenhaut, G. McFiggans, T. F. Mentel, A. Monod, A. S. H. Prévôt, J. H. Seinfeld, J. D. Surratt, R. Szmigielski and J. Wildt, Atmos. Chem. Phys., 2009, 9, 5155–5236 CrossRef CAS.
- (a) J. Joutsensaari, P. Yli-Pirilä, H. Korhonen, A. Arola, J. D. Blande, J. Heijari, M. Kivimäenpää, S. Mikkonen, L. Hao, P. Miettinen, P. Lyytikäinen-Saarenmaa, C. L. Faiola, A. Laaksonen and J. K. Holopainen, Atmos. Chem. Phys., 2015, 15, 12139–12157 CrossRef CAS; (b) N. Bertin and M. Staudt, Oecologia, 1996, 107, 456–462 CrossRef CAS PubMed.
- P. H. Chowdhury, Q. He, R. Carmieli, C. Li, Y. Rudich and M. Pardo, Environ. Sci. Technol., 2019, 53, 13949–13958 CrossRef CAS PubMed.
- S. Bojovic, M. Jurc, D. Drazic, P. Pavlovic, M. Mitrovic, L. Djurdjevic, R. S. Dodd, Z. Afzal-Rafii and M. Barbero, Trees - Struct. Funct., 2005, 19, 531–538 CrossRef CAS.
- E. Liberto, M. R. Ruosi, C. Cordero, P. Rubiolo, C. Bicchi and B. Sgorbini, J. Agric. Food Chem., 2013, 61, 1652–1660 CrossRef CAS PubMed.
- C. Lindinger, D. Labbe, P. Pollien, A. Rytz, M. A. Juillerat, C. Yeretzian and I. Blank, Anal. Chem., 2008, 80, 1574–1581 CrossRef CAS PubMed.
- A. N. Gloess, A. Vietri, F. Wieland, S. Smrke, B. Schönbächler, J. A. S. López, S. Petrozzi, S. Bongers, T. Koziorowski and C. Yeretzian, Int. J. Mass Spectrom., 2014, 365–366, 324–337 CrossRef CAS.
- S. Risticevic, E. Carasek and J. Pawliszyn, Anal. Chim. Acta, 2008, 617, 72–84 CrossRef CAS PubMed.
- R. Hertz-Schünemann, T. Streibel, S. Ehlert and R. Zimmermann, Anal. Bioanal. Chem., 2013, 405, 7083–7096 CrossRef PubMed.
- H. Czech, C. Schepler, S. Klingbeil, S. Ehlert, J. Howell and R. Zimmermann, J. Agric. Food Chem., 2016, 64, 5223–5231 CrossRef CAS PubMed.
- R. A. Buffo and C. Cardelli-Freire, Flavour Fragrance J., 2004, 19, 99–104 CrossRef CAS.
- J. Heide, H. Czech, S. Ehlert, T. Koziorowski and R. Zimmermann, J. Agric. Food Chem., 2020, 68, 4752–4759 CrossRef CAS PubMed.
- C. Yeretzian, A. Jordan and W. Lindinger, Int. J. Mass Spectrom., 2003, 223–224, 115–139 CrossRef CAS.
- J.-K. Moon and T. Shibamoto, J. Agric. Food Chem., 2009, 57, 5823–5831 CrossRef CAS PubMed.
- N. Yang, C. Liu, X. Liu, T. K. Degn, M. Munchow and I. Fisk, Food Chem., 2016, 211, 206–214 CrossRef CAS PubMed.
- R. Dorfner, T. Ferge, C. Yeretzian, A. Kettrup and R. Zimmermann, Anal. Chem., 2004, 76, 1386–1402 CrossRef CAS PubMed.
- (a) M. R. Baqueta, A. Coqueiro and P. Valderrama, J. Food Sci., 2019, 84, 1247–1255 CrossRef CAS PubMed; (b) D. Bressanello, E. Liberto, C. Cordero, B. Sgorbini, P. Rubiolo, G. Pellegrino, M. R. Ruosi and C. Bicchi, J. Agric. Food Chem., 2018, 66, 7096–7109 CrossRef CAS PubMed.
- J. M. Ames, R. C. Guy and G. J. Kipping, J. Agric. Food Chem., 2001, 49, 4315–4323 CrossRef CAS PubMed.
- M. Münchow, J. Alstrup, I. Steen and D. Giacalone, Beverages, 2020, 6, 29 CrossRef.
- H. Czech, J. Heide, S. Ehlert, T. Koziorowski and R. Zimmermann, Foods, 2020, 9, 627–650 CrossRef CAS PubMed.
- (a) T. Kanashova, O. Sippula, S. Oeder, T. Streibel, J. Passig, H. Czech, T. Kaoma, S. C. Sapcariu, M. Dilger, H.-R. Paur, C. Schlager, S. Mülhopt, C. Weiss, C. Schmidt-Weber, C. Traidl-Hoffmann, B. Michalke, T. Krebs, E. Karg, G. Jakobi, S. Scholtes, J. Schnelle-Kreis, J. Orasche, L. Müller, A. Reda, C. Rüger, A. Neumann, G. Abbaszade, C. Radischat, C. Hiller, J. Grigonyte, M. Kortelainen, K. Kuuspalo, H. Lamberg, J. Leskinen, I. Nuutinen, T. Torvela, J. Tissari, P. I. Jalava, S. Kasurinen, O. Uski, M.-R. Hirvonen, J. Buters, G. Dittmar, J. Jokiniemi and R. Zimmermann, J. Mol. Clin. Med., 2018, 1, 23–35 Search PubMed; (b) Y. H. Kim, S. H. Warren, Q. T. Krantz, C. King, R. Jaskot, W. T. Preston, B. J. George, M. D. Hays, M. S. Landis, M. Higuchi, D. M. DeMarini and M. I. Gilmour, Environ. Health Perspect., 2018, 126, 17011 CrossRef PubMed.
- (a) J. B. Gilman, B. M. Lerner, W. C. Kuster, P. D. Goldan, C. Warneke, P. R. Veres, J. M. Roberts, J. A. de Gouw, I. R. Burling and R. J. Yokelson, Atmos. Chem. Phys., 2015, 15, 13915–13938 CrossRef CAS; (b) A. Hartikainen, P. Tiitta, M. Ihalainen, P. Yli-Pirilä, J. Orasche, H. Czech, M. Kortelainen, H. Lamberg, H. Suhonen, H. Koponen, L. Hao, R. Zimmermann, J. Jokiniemi, J. Tissari and O. Sippula, Atmos. Chem. Phys., 2020, 20, 6357–6378 CrossRef CAS.
- H. Czech, O. Sippula, M. Kortelainen, J. Tissari, C. Radischat, J. Passig, T. Streibel, J. Jokiniemi and R. Zimmermann, Fuel, 2016, 177, 334–342 CrossRef CAS.
- S. K. Akagi, R. J. Yokelson, C. Wiedinmyer, M. J. Alvarado, J. S. Reid, T. Karl, J. D. Crounse and P. O. Wennberg, Atmos. Chem. Phys., 2011, 11, 4039–4072 CrossRef CAS.
- H. Czech, S. M. Pieber, P. Tiitta, O. Sippula, M. Kortelainen, H. Lamberg, J. Grigonyte, T. Streibel, A. S. H. Prévôt, J. Jokiniemi and R. Zimmermann, Atmos. Environ., 2017, 158, 236–245 CrossRef CAS.
- R. Janson, J. Atmos. Chem., 1992, 14, 385–394 CrossRef CAS.
- U. Bufler, G. Seufert and F. Jüttner, Environ. Pollut., 1990, 68, 367–375 CrossRef CAS PubMed.
- M. Elsasser, C. Busch, J. Orasche, C. Schön, H. Hartmann, J. Schnelle-Kreis and R. Zimmermann, Energy Fuels, 2013, 27, 4959–4968 CrossRef CAS.
- M. S. Eschner, T. M. Gröger, T. Horvath, M. Gonin and R. Zimmermann, Anal. Chem., 2011, 83, 3865–3872 CrossRef CAS PubMed.
- D. R. Worton, M. Decker, G. Isaacman-VanWertz, A. W. H. Chan, K. R. Wilson and A. H. Goldstein, Analyst, 2017, 142, 2395–2403 RSC.
Footnote |
| † Electronic supplementary information (ESI) available. See DOI: 10.1039/d1an00114k |
| This journal is © The Royal Society of Chemistry 2021 |

