Ion mobility mass spectrometry – an efficient tool for the analysis of conformational switch of macrocyclic receptors upon anion binding†
Magdalena
Zimnicka
 *a,
Elina
Kalenius
 b,
Janusz
Jurczak
 a and
Witold
Danikiewicz
 a
a
aInstitute of Organic Chemistry Polish Academy of Sciences, Kasprzaka 44/52, 01-224 Warsaw, Poland. E-mail: magdalena.zimnicka@icho.edu.pl
bDepartment of Chemistry, Nanoscience Center, University of Jyväskylä, FI-40014 Jyväskylä, Finland
First published on 30th June 2021
Abstract
Interactions between anions and synthetic macrocyclic receptors belong to the extensively explored area of research due to the particularly important functions of anions in biological and environmental sciences. Structures of anion-macrocycle complexes are closely related to their function, highlighting the importance of structural analysis of the complexes. Here, we discuss the application of ion mobility mass spectrometry (IM-MS) and theoretical calculations to the structural analysis of tetralactam macrocycles (M) with varying flexibility and structural properties, and their complexes with anions [M + X]−. Collision cross section (CCS) values obtained from both direct drift tube (DT) and indirect using traveling-wave (TW) IM-MS measurements supplemented by theoretical calculations were successfully used to describe the structural properties of various macrocycle-anion complexes, proving the suitability of the IM-MS approach for sensitive, selective, and fast detection of anion complexes and characterization of their structures and conformations.
Introduction
Anions are reactive species relevant to artificial, industrially induced processes and naturally occurring phenomena observed in biological and environmental sciences.1,2 Therefore, the studies on interactions of anions and their recognition are at the heart of modern science.3 In particular, we have focused on understanding and describing the processes driven, induced and regulated by the anions. Anion recognition and sensing by synthetic molecules belong to the widely discussed and extensively explored area of research.4,5 Particularly, the design and synthesis of anion receptors providing selective, specific, and sensitive anion recognition is highly desirable, and hence has become one of the principal research goals for many organic chemists.6–10Functionality of anion receptors (both synthetic and biological) is dictated by their structures and available interaction modes. An important challenge in the design of new receptors, dedicated for anions, is therefore their structural analysis. The traditional methods for structural analytics widely used in studies of anion recognition allow describing anion-receptor complexes in the solid crystalline state by X-ray diffraction analysis, in the solid form by solid-state NMR spectroscopy (ssNMR),11 and in solution by NMR spectroscopy. In addition to these most common analytical approaches, other spectroscopy techniques are also well suited for anion recognition studies, similarly to the analysis of other supramolecular assemblies.12
Difficulties associated commonly with these methods are undesirable structural form (packing effects, noncrystallinity), insolubility (or poor solubility) of the anion-receptor complex, low sensitivity and high complexity of the analysed system for a given analytical method (non-adequate resolving power). Therefore, the combination of various analytical methods supplemented by theoretical calculations is often used to obtain a comprehensive understanding of the anion recognition events. One of the analytical methods that allow overcoming many of these difficulties due to its high sensitivity and selectivity is mass spectrometry, which has long been used as an analytical method in supramolecular chemistry.13 Mass spectrometric methods with connection to soft ionization methods (such as electrospray ionization, ESI) allow us to: (a) detect a charged supramolecular assembly with a given m/z value in the mass spectrum, (b) analyse the binding properties in solution by employing a mass spectrometer as a detector for in-solution occurring processes, and (c) study the binding properties and strength of noncovalent interactions in receptor complexes by induced dissociation processes (i.e. collision induced dissociation, CID). Traditional mass spectrometric methods separate ions however only on the m/z scale. If more detailed structural information or separation of ions with an identical m/z value (isobaric ions, structural isomers, and conformers) is required, then the hybrid method, ion mobility mass spectrometry (IM-MS), needs to be employed.
IM-MS enables separation of ions based on their interactions with neutral gas molecules under the influence of an electric field in a drift tube.14,15 Ions of different sizes, shapes or structures (e.g. different protonation sites) experience different resistance when migrating along the drift chamber and as a consequence they differ in arrival time distribution. Based on the IM-MS experimental conditions and ion's arrival time distribution, the mobility of an ion (K) and a derived property – the ion-neutral collision cross section (CCS) can be determined. Structural analysis is derived from comparing the experimental CCS values with those theoretically calculated for 3D models.
During the past years, IM-MS has been applied in studies of various supramolecular systems from coordination compounds to self-assembled systems and receptor complexes.16 As commercial IM-MS instrumentation is becoming increasingly available, comprehensive and systematic analytical protocols are required for reproducible, reliable and accurate use of this analytical tool.
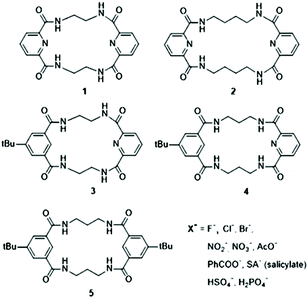
In this manuscript, we discuss the application of IM-MS to the structural analysis of anion-macrocycle complexes (Scheme 1). In this methodological work, we primarily focus on the correlation between experimentally determined collision cross sections (CCS) and theoretically derived values based on structural models. The calibration strategy is an important factor determining the accuracy of experimentally obtained CCS values and we additionally evaluate accuracy in indirect CCS measurements.
The tetralactam macrocycles with varying flexibility, (1 and 3 rigid and 2 flexible) and different structural properties (i.e., 4 and 5 adopt a specific U-shape folded structure upon anion complexation) are studied in this work. These macrocycles have earlier been confirmed to operate as neutral receptors for various anions.17,18 Their structural analysis supported by theoretical calculations allows us to provide the best analytical and theoretical approach to study them by IM-MS. In the light of the extensive scientific activity in the field of anion recognition, the evaluation of the IM-MS approach for screening new receptors is valuable, particularly for organic chemists.
Results and discussion
IM-MS analysis of macrocycles and their complexes
Macrocyclic compounds belong to a structurally rich family of compounds. They represent from rigid to highly flexible molecular species, whose properties depend on the functionality and stereochemical diversity implemented in the different sizes of the cyclic rings. The conformational change upon complexation and deformation energy of the macrocyclic receptor associated with this process influence its overall binding properties.19 A wide range of potential conformational changes, from close to insignificant to large conformational rearrangements which the receptor uses to ensure effective complexation, require high-accuracy IM data.Two essential parameters for IM-MS measurements, the mobility of an ion (K0) and collision cross section (CCS) derived from it, may be determined in a direct or indirect manner, depending on the available instrument hardware. While in the direct methods (primary methods) CCS values may be obtained from first principles based on well-defined experimental conditions and parameters (as accessible in time-dispersive drift tube ion mobility spectrometry, DTIM-MS), the indirect, secondary methods require a calibration procedure. For traveling wave ion mobility spectrometry (TWIM-MS), or trapped ion mobility mass spectrometry (TIM-MS), the calibration is a more common approach for providing estimates of K0 and CCS values20,21 than the direct determination of these values.22,23
Accuracy of the experimental mobility values estimated based on the calibration approach is related to the structural and physicochemical similarity of the reference compounds with the analysed ions. Although the larger errors are usually associated with the charge state mismatching than with structural dissimilarity,24,25 CCS calibration with the reference ions of the same chemical class and charge state ensures the highest accuracy and the good correlation of the determined mobility values with the values obtained by the primary methods. The common reference compounds used for calibration represent different classes of chemical compounds such as peptides and proteins (polyalanines,26,27 tryptic peptides,28 denaturated or native proteins29–31), lipids (phosphatidylcholine and phosphatidyl-ethanolamines),25 and carbohydrates.32 Other reference compounds and calibration mixtures are also available.33–39 So far, the collision cross sections of macrocycles and their complexes have been measured mainly using direct methods40 or the experimentally derived values have not been discussed in terms of defined values due to the lack of a calibration database containing similar compounds.41–43
Here, we discuss and compare calibration approaches to the analysis of macrocycles and their complexes: (a) calibration with polyalanine standard anions, and (b) calibration using bare macrocycle ions and their complexes with Cl−, whose CCS values were measured using a primary method (DTIM) as a part of this work. The polyalanine standard ions are widely used for the calibration, mainly due to their long-term stability, good distribution over a wide range of m/z and CCS values, different charge state accessibility, and their potential application in the analysis in both positive and negative ion modes. Despite the structural mismatch, polyalanine standards are often used to evaluate the different calibration approaches and the influence of the molecular identity between calibrant and analyte ions on the accuracy of the IM analysis.24,25 The strategy (b) represents the most appropriate and rational approach, in which the same molecular identity of calibration ions is used. Finally, we show how these calibration strategies can be employed to describe structural features and different binding modes on rigid and flexible macrocycle complexes with other mono- and polyatomic anions.
Direct mobility measurements
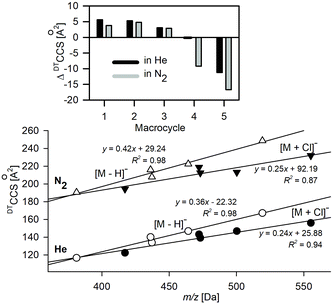
The ion mobility (K0) and DTCCS values for deprotonated anions of 1–5 and their complexes with Cl− were measured directly using the DTIM-MS method with He and N2 as buffer gases (see Table 1 and Table S1.1†). The relationships between m/z and DTCCSN2/He values of deprotonated macrocycles and complexes with Cl− are shown in Fig. 1. The smaller slope in the linear plots of chloride complexes implies the conformational change upon Cl− complexation. The DTCCS values either increase or decrease upon complexation, depending on the macrocycle structure (top, Fig. 1). Macrocycles 4 and 5 show decreased DTCCS upon complexation with Cl−, whereas rigid macrocycles 1–3 show an increase in their DTCCS values. i.e., a more compact structure is formed for flexible macrocycles in Cl− complexes as compared to the deprotonated ions.| Ion | m/z [Da] | DTCCSHe [Å2] | TW(PA)CCSHe(N2) [Å2] | TMCCSHe [Å2] | DTCCSN2 [Å2] | TW(PA)CCSN2 [Å2] | TMCCSN2 (SD) |
|---|---|---|---|---|---|---|---|
| a Two distinguished conformational representations were identified: a flat conformation that represents a neutral macrocycle – like conformation (TMCCSHe = 166.2 and TMCCSN2 = 244.9 Å2) and a folded structure (TMCCSHe = 149.9 and TMCCSN2 = 229.7 Å2). | |||||||
| [1 − H]− | 381.1317 | 116.7 ± 0.3 | 119 ± 1 | 115.2 ± 1.5 | 190.5 ± 0.1 | 182.4 ± 0.8 | 192.9 ± 1.8 (1.0) |
| [2 − H]− | 437.1943 | 133.9 ± 0.3 | 135 ± 1 | 133.4 ± 1.4 | 207.7 ± 0.3 | 200.6 ± 1.2 | 211.9 ± 2.0 (2.6) |
| [3 − H]− | 436.1990 | 140.1 ± 0.2 | 140 ± 1 | 136.3 ± 1.7 | 215.9 ± 0.3 | 207.5 ± 1.8 | 214.9 ± 1.7 (1.1) |
| [4 − H]− | 464.2303 | 146.8 ± 0.2 | 149 ± 2 | 144.0 ± 1.4 | 222.4 ± 0.3 | 217.6 ± 2.1 | 222.8 ± 1.8 (1.8) |
| [5 − H]− | 519.2977 | 167.2 ± 0.2 | 170 ± 1 | 162 ± 1.7 | 248.6 ± 0.3 | 243.3 ± 1.9 | 240.9 ± 2.6 (6.9) |
| [5 − H]−a | 166.2 ± 1.1 | 244.9 ± 1.0 | |||||
| [1 + Cl]− | 417.1099 | 122.3 ± 0.2 | 123 ± 1 | 120.5 ± 1.1 | 194.3 ± 0.2 | 187.0 ± 0.5 | 200.6 ± 1.0 (0.8) |
| [2 + Cl]− | 473.1710 | 139.2 ± 0.2 | 138 ± 1 | 138.5 ± 1.6 | 212.5 ± 0.3 | 205.0 ± 1.6 | 220.1 ± 2.3 (1.9) |
| [3 + Cl]− | 472.1757 | 143.2 ± 0.2 | 145 ± 2 | 141.7 ± 1.7 | 218.8 ± 0.3 | 212.7 ± 1.9 | 220.2 ± 2.3 (0.6) |
| [4 + Cl]− | 500.2077 | 138.9 ± 0.2 | 142 ± 2 | 133.2 ± 1.3 | 213.2 ± 0.2 | 209.0 ± 2.0 | 212.0 ± 1.9 (0.9) |
| [5 + Cl]− | 555.2744 | 156.0 ± 0.2 | 160 ± 1 | 149.9 ± 1.4 | 231.9 ± 0.3 | 229.8 ± 2.4 | 227.3 ± 2.2 (0.5) |
Experimental vs. theoretical CCS values
The structural changes macrocycles experience upon Cl− complexation are presented for the lowest energy conformers in Fig. 2. The deprotonated ions represent the structures similar to their neutral counterparts and have more planar conformations compared to the chloride adducts. Macrocycles 1 and 3, with short C–C linkers (n = 2, where n is the number of carbon atoms in the macrocyclic linker) of the amide groups, have very limited conformational freedom, which is expressed by the two available conformations associated with the mutual arrangement of the two C–C linkers: in parallel or perpendicular orientations.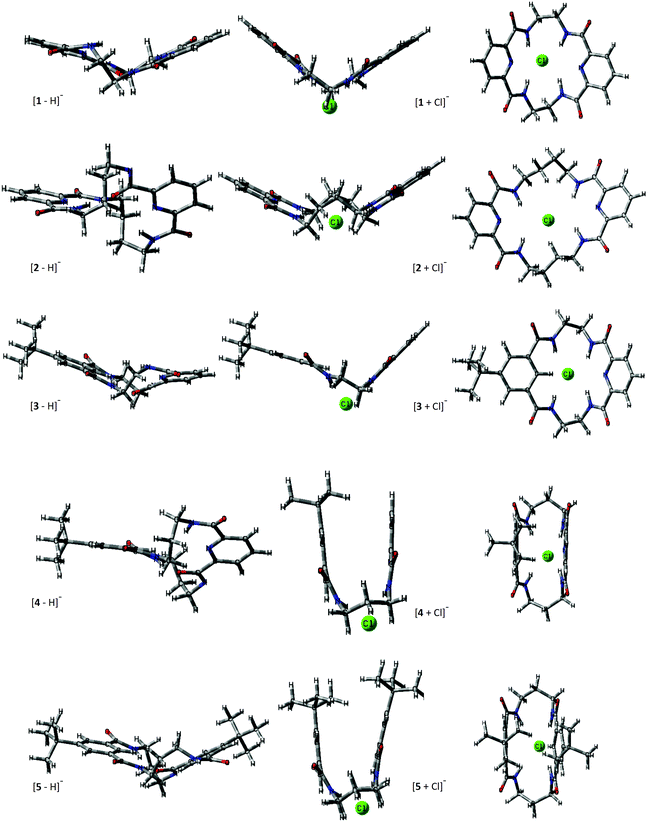 | ||
| Fig. 2 Lateral view and view on a mean plane ([M + Cl]−) of theoretical structures. The lowest-energy conformers for deprotonated and chloride adducts of macrocycles are shown. View on a mean plane of the macrocyclic ring is additionally presented in the ESI (Fig. S3.1†). | ||
The macrocycles 2, 4, and 5 (n > 2) express more flexibility because of the greater conformational freedom of the tetralactam linkers. Nevertheless, these additional macrocyclic conformations represent a similar overall molecular spatial size as may be concluded from the standard deviation (SD) of the computed mean values of CCS through all the relevant conformers at 298 K (Table 1) for a given macrocycle. A similar narrow spatial size is characteristic of chloride complexes. In this case, for flexible macrocycles (2, 4, and 5) the Cl− coordination makes the complexes more rigid compared to bare macrocycles.
The theoretical TMCCS values were calculated using the trajectory method with Lennard–Jones potential. Interestingly, the substantially high CCS dispersion in the case of deprotonated 5 is associated with its two almost energetically equal (ΔG = 0.1 kJ mol−1) conformational representations: roughly planar as expressed in Fig. 2 and folded, similar to that corresponding to its Cl− complex. The elongated structure that resembles the neutral crystal structure of 544 results in a TMCCSHe of 166.2 and TMCCSN2 of 244.9 Å,2 and this conformer dominates in the gas phase over its folded form, which has significantly lower TMCCS values (TMCCSHe = 149.9 Å2 and TMCCSN2 = 229.7 Å2). It implies that during ESI and in the experimental time- and energy scale any conformational changes are hindered; thus, the structure of [5 − H]− is similar to the native conformation of its neutral counterpart. This observation may stay in line with the general conclusion on evaporation cooling during ESI that leads to gaseous freeze-dried states, which are energetically stabilized upon solvent removal. For this reason, mass spectrometry often shows properties of the native state. Although this conclusion has been drawn from observations of large biomolecules and complexes,29,45 in which due to the multi-interactivity, the native conformation is preserved upon transfer from a solution to the gas phase, the solution phase structure postulated for deprotonated 5 clearly indicates that it may also operate in macrocyclic structures with partially restricted conformational freedom.
The CCS values of deprotonated macrocycles computed for collisions with both He and N2 (Table 1) using the trajectory method (TM) implemented in MobCal-MPI software are within reasonable accuracy with the experimental values (ΔCCSHe < 2.7% and ΔCCSN2 < 2%).46 A lower accuracy was obtained for chloride complexes of macrocycles. For both He and N2, the two different complexes express ΔCCS > 3%; thus it appears unlikely that this results from the poor conformational search or missed global minima. The TMCCSHe values are underestimated compared to the variable trend for values predicted in N2.
MobCal-MPI was tuned with the B3LYP-D3/6-31++G(d,p) optimized calibration set; hence following the recommendations, the same level of theory was used to generate the structure candidates and compute the TMCCS values presented in Table 1. The impact of the computational method on the CCS accuracy using MobCal-MPI, and the comparison with the results obtained with IMoS ion mobility software computations are presented in Fig. 3.
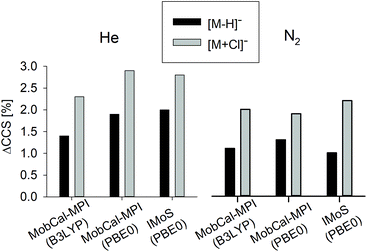 | ||
| Fig. 3 Comparison between different methods to obtain theoretical TMCCS values. Comparison of the average differences (across five macrocyclic systems) between theoretical and experimental CCSHe and CCSN2 (ΔCCS) values in % depending on the computational approach. The exact values for all considered ions are reported in Table S3.1 in the ESI.† | ||
Similarly to the original MobCal and its refined suite MobCal-MPI, the IMoS approach arises from a kinetic theory of gas collisions. Although there are some differences in the treatment of collision integrals between MobCal and IMoS, both of these ion mobility programs show comparable accuracy.47 The trajectory method Lennard–Jones (TMLJ), which uses a 4-6-12 potential additionally supplemented with ion quadrupole potential for calculations based on N2, was invoked using IMoS software to enable the comparison with a more general computational approach (for a detailed description of IMOS parameters please see the ESI†). Similarly, the electrostatic potential derived atomic charges (ESP) were used along with IMoS computations.
Although the MobCal-MPI was tuned with a positively charged ion set, a very good correlation between theoretical and experimental CCSN2 indicates the effective vdW and electrostatic potential description of deprotonated macrocycles. A substantial increase of the total ΔCCS for [M + Cl]− is related to the fact that two out of five complexes express the ΔCCS > 3%. For the values predicted for He, the difference is even more prominent (ΔCCS > 4%).
It is difficult to identify the source of this greater discrepancy in particular for chloride complexes. For example, macrocycles 1 and 3, both possessing short C–C linkers, are quite rigid molecules, with similar conformation landscapes of both deprotonated and chloride adducts. Despite these similarities, the accuracy of CCSN2 prediction is surprisingly different and may indicate the fact that still the theory does not quite well describe the buffer gas interactions with highly negative charge atoms as for Cl−.
Changing the computational method from B3LYP to PBE0, which was used before to compute the complexation energy of [1 + X]−,19 results in a slight increase in the total ΔCCS for [M − H]− ions, while for [M + Cl]− in N2 this value is slightly lower. Although both methods express similarly the potential energy surface of anions under study, the detailed bond lengths, for example the intermolecular hydrogen bonds between Cl− and amide hydrogens of the macrocycle, are shorter, when computed with PBE0 (Fig. S3.2†). Therefore, the CCS values computed using PBE0 express systematically lower values compared to those predicted for B3LYP optimized structures. Furthermore, a change in the bond length affects the partial charge values causing additional shifts in the predicted CCS values.
The CCS values computed using IMoS followed the overall trends, i.e., the computations performed in He express lower accuracy than those computed in N2. The accuracy of CCSN2 computed for [M − H]− is greater than that obtained for MobCal-MPI, whereas for [M + Cl]− it is slightly lower. The recalculation of the TMCCS values by applying Mulliken atomic partial charges using IMoS clearly improves the accuracy of the TMCCSHe (Table S3.1†). It is worth underlining here that the trajectory method implemented in IMoS includes optimized Lennard–Jones (L–J) parameters only for C, H, O, N, and F atoms; hence the lower accuracy for chloride complexes may be associated with the lack of the well optimized L–J parameters for this crucial element. Admittedly, IMoS software gives the opportunity to optimize these parameters. However this action requires additional experimental and advanced computational studies and therefore will be the subject of a separate project.
TWIM indirect ion mobility measurements
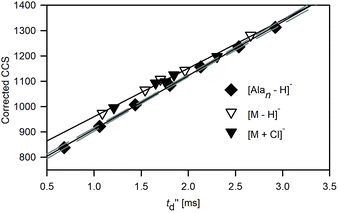
In TWIM-MS measurements, collision cross sections are commonly defined by a calibration approach due to the difficulty in description of ion motion in varying spatially and temporary separating fields in the TWIM drift tube. The relationship between the experimentally derived drift time (t′′d) and corrected collision cross sections of reference ions (by taking into account the reduced mass and charge state) allows us to calculate the proportionality constants arising from the combined effects of the experimental parameters such as temperature, electric field parameters, pressure, and other nonlinear effects of the T-wave device, and subsequently leads to determination of TWCCS values.48The calibration curve for polyalanine anions [Alan − H]− is shifted with respect to that obtained for macrocyclic ions: [M − H]− and [M + Cl]− (Fig. 4). The compound-class calibration shifts are supposed to be mainly attributed to the difference in velocity relaxation experienced by ions belonging to different classes of compounds in the perpetually changing electric field in the traveling wave device.49 This discrepancy is more pronounced for the lower regions of the calibration range and becomes blurred at its upper end. Therefore, the CCS values of macrocyclic anions estimated by applying polyalanine anions [Alan − H]− as reference ions (TW(PA)CCSN2 values) are reduced with respect to the DTCCSN2 values (Fig. S2.1 and Table S2.2†) in the following decreasing order 1 > 2 > 3 > 4 > 5.
The differences between polyalanine- and macrocyclic-based calibration plots recorded for CCSHe values for TWIM operated in N2 (Fig. S2.2 and Table S2.2†) are less pronounced. This approach in which the TWCCSHe(N2) values are obtained instead of TWCCSHe was widely used before the reference CCS values in nitrogen along with the computational support for mobility prediction in N2 were available. The discrepancies introduced by applying He reference values to calibrate N2 measurements may result in an average deviation of <2% between TWCCSHe(N2) and DTCCS,27 due to the different nature of the interactions between molecules of different gases and ions. Apparently, the errors associated with the effects of drift gas and compound class mismatch cancel each other out and the final bias between polyalanine- and macrocycle-based calibration plots is significantly reduced.
Conformational folding of 1 upon anion complexation
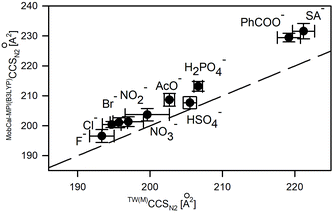
Macrocycle 1 represents a highly constrained molecular structure due to the presence of two short ethylene linkers in the tetralactam macrocycle in which two aromatic pyridine subunits are symmetrically woven.17 In its neutral and anion-complexed forms four of its amide hydrogen atoms are directed into its cavity to readily stabilize an anion (X−) via formation of N–H⋯X− hydrogen bonds. The presence of a basic pyridine moiety as a hydrogen bond acceptor may additionally increase the interactions with hydrogenated anions.19 Any flexibility imparted to the macrocyclic ring refers to its two possible arrangements of C–C linkers: in a parallel or perpendicular manner with respect to each other.The TW(M)CCS and TW(PA)CCS values of [1 + X]− complexes were obtained using macrocyclic and polyalanine sets of calibrants, respectively (Table S2.5†). The TW(PA)CCSN2 values are shifted towards lower values compared to TW(M)CCSN2, according to the earlier observed trends. The average differences between these two sets of calibrant ions are 3.6% and 0.9% for CCSN2 and CCSHe(N2) values, respectively. The accuracy of CCS prediction of [1 + X]− using MobCal-MPI(B3LYP) correlates with that reported for [1 + Cl]−, i.e. the mean CCS values are overestimated about 3% for CCSN2 and 1% for CCSHe(N2) values with respect to the values determined from measurements (Fig. 5, Table S3.2†). The effects associated with the change of the computation method from B3LYP to PBE0 follow the overall trends shown in Fig. 3 (for details please see Table S3.2†).
The good correlation between the anionic radius (rsteric) of monoatomic spherical anions50,51 or computed collision cross sections of polyatomic anions (Table S3.3†) and experimental CCS values of [1 + X]− complexes (Fig. 6) suggests the similar conformational folding of 1 upon complexation of anions. Indeed, the careful analysis of the overlapped complex structures indicates the low conformational deviation of 1 depending on the anion type (Fig. S3.3†); hence the increase in CCS values for complexes correlates with the increase of the anion size.
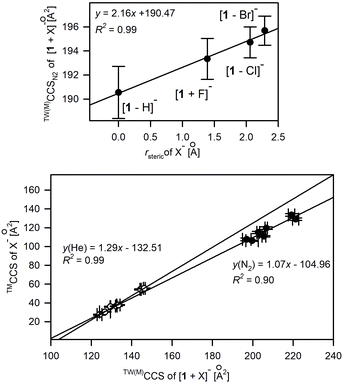 | ||
| Fig. 6 Influence of X− anionic radius, rsteric (upper plot) and TMCCS values of polyatomic anions on the experimental CCS values of [1 + X]−. | ||
Only in the case of the complex with fluoride anions, the significant conformational change of 1 was revealed by crystallography and further supplemented by computation studies.19 This conformational change is due to a good match between the size of F− anions and the size of the macrocyclic cavity. Thus F− is placed directly in the central position of the macrocyclic cavity, instead of being located outside the macrocyclic ring. Hence, 1 in the [1 + F]− complex adopts a near flat position of the N–H bond system, which enables the effective solvation of a centrally located F− while tetragonal pyramidal N–H arrangement dominates for other complexes. Nevertheless, this significant conformational change was not recognized by analyzing solely the CCS shifts upon anion complexation (Fig. 6) but was revealed in computation studies accompanying ion mobility measurements. It is worth mentioning that the structures of [1 + X]− revealed by IM-MS studies well correlate with X-ray structures.17
U-shaped folding of 5
While a C–C linker connecting amide units within a tetralactam structure becomes longer, i.e., n = 3 (in macrocycles 4 and 5), the macrocyclic scaffold collapses into a U-shaped conformation upon Cl− binding (Fig. 2). This specific folding was examined for various anions coordinated by macrocycle 5.Isophthalic acid-based macrocyclic tetraamide (5) possesses an increased binding cavity compared to macrocycle 1. Moreover, pyridine units were replaced by benzene rings to eliminate unfavorable interactions between the electron lone pairs of the pyridine nitrogen atoms and an anion.52 In such a constructed anion binding system, the main anion association mode occurs by incorporation of the amide hydrogens into the binding system, similarly to that observed for 1. Due to the increased binding cavity of this 20-membered ring, associated with the elongation of the C–C linker, the specific U-shaped folding of the macrocycle was observed upon anion complexation (Cl−, Br−, AcO−, HSO4−, and H2PO4−) while the anion center remains outside the cavity.44
The conformational shifts of 5 from a near planar arrangement, similarly to this reported for both neutral and deprotonated forms, to highly folded structures were examined by IM-MS measurements. The CCS values were determined by the calibration approach using macrocyclic and polyalanine reference ions (Tables S2.6 and S2.7†). The average differences of experimental CCS values associated with this change are 1.7% and 2.3% for CCSN2 and CCSHe(N2) values, respectively, and follow the overall relationships between TW(M)CCS and TW(PA)CCS shown in Fig. 4 and Fig. S2.2.† The conformational diversity of 5 upon anion binding was evaluated by comparing the changes in the experimental CCS values of [5 + X]− while increasing the CCS of anions (Fig. 7). This relationship is proportional and linear for polyatomic anions (lower panel in Fig. 7) and implies a similar conformation for 5 within its complexes with the studied polyatomic anions. The experimental CCS values for the majority of [5 + X]− complexes are substantially lower compared to the bare deprotonated macrocycle which definitively indicates a conformational contraction of 5 upon the anion-binding process.
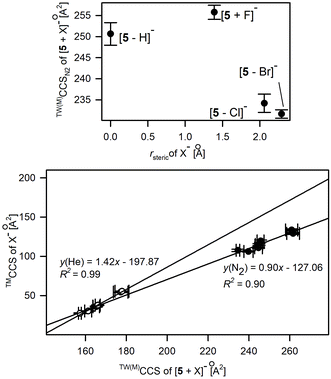 | ||
| Fig. 7 Relationship between X− anionic radius, rsteric (upper panel) or TMCCSs of polyatomic X− and the experimental CCS values of [5 + X]−. | ||
In the case of monoatomic anions, there is no such direct relationship between the anion radius and the experimentally derived CCS values as was described for 1. The upper part of Fig. 7 clearly indicates the two conformational representations of 5, clearly distinguished with CCS values. The first one, with TW(M)CCSN2 > 248 Å2, corresponds to the elongated, roughly planar conformation of 5, which is representative of the deprotonated macrocycle and of the complex with F−. The second conformational form, which is relevant for complexes with Cl− and Br−, is consistent with the U-shape folded conformation proposed for complexes with polyatomic anions.
The abovementioned conclusions about the conformational folding of 5 upon anion binding are supported by the computational studies. The preferential binding mode of anions by 5 includes its conformational switch between the approximately planar conformation of the free macrocycle and U-shaped folded structure of its complexes. The elongated conformation constitutes a negligible contribution to the anion population due to its significantly high energy (ΔG > 20 kJ mol−1, data not shown). Only for the [5 + F]− complex is the energy of the near flat conformation substantially lower than that for the U-shaped structure, which is in accordance with the experimental results.
The theoretically determined CCS values of the model complex structure correlate well with the experimental values (Table S3.4†). The theoretical values are underestimated about 3% on average compared to experimentally estimated values. The lowest energy conformations (ΔG < 20 kJ mol−1) differing in both the mutual arrangement of C–C linkers in the macrocycle and the orientation of tert-butyl groups to each other show a rather small dispersion of CCS values, less than 2%. Further CCS differences among various conformers are related to a certain conformational freedom of polyatomic anions within complexes. Nevertheless this type of conformational change is rather small on the CCS-axis (total shift about 3%) compared to the CCS shift upon U-shape folding of 5. Taking into account the anticipated ion heating under ion mobility experiments in TWIM,53 any decrease of accuracy of computed TMCCS may be associated with the different ion distribution conditions to that in which calibration ions were measured. This may be the case for complexes with some polyatomic anions, for which the higher differences between experimental and computed CCS values may be associated with the shift of conformational distribution of complexes toward the higher energy conformers. These conformers still represent U-shape folded structures but have unfavourable positions for anions within the complex. The CCS shift associated with the calibration is <1%, as estimated by comparison of the DTCCSN2/He and TW(M)CCSN2/He values of [5 + Cl]−.
Interestingly, IM-MS studies allowed us to reveal the hindered conformational change of 5 upon complexation with F− into the U-shaped structure, which in turn was observed for other anions. This observation was possible due to the significant change of CCS values between elongated planar and U-shape folded conformations. Hence, the role of the tert-butyl groups is not only limited to enhancing the solubility of 5 in organic solvents44 but they also induce substantial differences in ion mobilities between different complex conformations leading finally to their differentiation using IM-MS.
Conclusion
Binding properties of macrocyclic receptors depend i.a. on the size complementarity between the anion and macroring. Even more important is the conformational change of the macrocycle upon anion complexation. These particularly crucial binding features may be successfully studied using IM-MS supported with theoretical calculations. The correlation between the CCS of polyatomic anions or anion radius in the case of monoatomic anions and experimentally derived CCS values is a good approach to be used to distinguish between conceivable complex conformations.The compound class matching in indirect ion mobility measurements (TWIM-MS) is an important factor that determines the accuracy of the measured TWCCS values. In the light of very recent studies on improving TWIM calibration,54 the data presented in the manuscript may be valuable for further considerations of calibration issues in terms of determination of high-precision CCS values.
The theoretical TMCCS values computed for model structures by available ion mobility software MobCal-MPI correlate well with the experimental values. A small increase of discrepancy between theoretical and experimental CCS values is reported for macrocycle complexes in comparison with bare deprotonated macrocycles. Therefore, further optimization of the L-J or scaling parameters is required to obtain the comparable accuracy as for deprotonated macrocycles.
In the light of the conducted research, it can be concluded that IM-MS supported by computational studies is a suitable analytical tool to structurally study the anion complexation by macrocyclic compounds. It offers many advantages over the classical analytical approaches to the complexation process, particularly in the early stage of the anion-binding studies during screening of appropriate receptor molecules.
Experimental
Materials
Macrocycles 1,17 2,55 3, 4![[thin space (1/6-em)]](https://www.rsc.org/images/entities/char_2009.gif) 56 and 5
56 and 5![[thin space (1/6-em)]](https://www.rsc.org/images/entities/char_2009.gif) 44 were synthesized according to the literature procedures. Tetrabutylammonium salts and a poly-DL-alanine calibrant compound were purchased from Sigma-Aldrich (Germany). All solvents were of HPLC grade.
44 were synthesized according to the literature procedures. Tetrabutylammonium salts and a poly-DL-alanine calibrant compound were purchased from Sigma-Aldrich (Germany). All solvents were of HPLC grade.
IM-MS direct mobility measurements
Direct, drift tube ion mobility mass spectrometry (DTIM-MS) experiments were performed on an Agilent 6560 Ion mobility Q-TOF mass spectrometer, which was equipped with a dualESI ion source. The macrocycles and tetrabutylammonium chloride were dissolved in DMSO (1 mM) and samples were prepared with 5 μM concentration and 1![[thin space (1/6-em)]](https://www.rsc.org/images/entities/char_2009.gif) :
:![[thin space (1/6-em)]](https://www.rsc.org/images/entities/char_2009.gif) 1 host
1 host![[thin space (1/6-em)]](https://www.rsc.org/images/entities/char_2009.gif) :
:![[thin space (1/6-em)]](https://www.rsc.org/images/entities/char_2009.gif) guest ratio in methanol. The ion mobility mass spectrometry experiments were performed in both N2 and He drift gases. The detailed experimental description and results of direct mobility measurements are available in the ESI – section 1.†
guest ratio in methanol. The ion mobility mass spectrometry experiments were performed in both N2 and He drift gases. The detailed experimental description and results of direct mobility measurements are available in the ESI – section 1.†
IM-MS indirect mobility measurements on TWIMS
Indirect traveling-wave ion mobility mass spectrometry (TWIM-MS) measurements were performed on a Synapt G2-S HDMS (Waters) quadrupole traveling-wave ion mobility time-of-flight mass spectrometer equipped with a standard ESI source. Mixtures of macrocycles (initially dissolved in DMSO at 0.5 mM) and anions (the initial aqueous solution of nBu4NX at a concentration of 2–4 mM) were prepared in methanol at a final concentration of 0.02–0.1 mM.The poly-DL-alanine reference anions (Table S2.1†)26 and the mixture of macrocycles, whose mobility and CCS values were determined by direct IM-MS measurements within this work, were applied in the calibration procedures to convert the arrival times of ions (in scans) to CCS values. Data processing was carried out with DriftScope 2.0 mobility environment software, and the experimental collision cross section values were calculated using the available spreadsheet from the arrival time values.57 The experimental details, parameters and calibration data regarding the IM-MS measurements are described in section 2 of the ESI.†
Computational details
The initial gas-phase conformations of deprotonated macrocycles 1–5 [M − H]− and anion complexes [M + X]− were obtained via comprehensive molecular mechanics simulations with MMFF force field utilizing systematic conformational search, implemented in the molecular modelling package Spartan,58 followed by the semiempirical PM7 calculations using the semiempirical molecular orbital package MOPAC2016.59 The structures were next optimized by DFT methods in Gaussian 16.60The theoretical collision cross sections (TMCCSN2/He) were calculated for conformers with a population of higher than 0.2% according to the Boltzmann distribution. The trajectory method (TM) was used to calculate CCS values. Two software tools, which are generally available and easy to implement in the local working environment, have been used and discussed to assess the agreement between experimental and theoretical CCS values comprising: MobCal-MPI46 and IMoS47 ion mobility software. In the case of MobCal-MPI, the additional final optimization using B3LYP-D3 and 6-31++G(d,p) basis sets was performed, to evaluate the influence of the theoretical method on the computed CCS values. In the CCS calculations the electrostatic potential (ESP) derived atomic charges were used. The additional computational details are available in ESI – section 3.†
Author contributions
Magdalena Zimnicka – conceptualization, formal analysis, investigation (TWIMS measurements and theoretical calculations), writing – original draft, and writing – review & editing; Janusz Jurczak – resources (supervision of the synthesis of the model compounds); Elina Kalenius – investigation (DTIM measurements); Witold Danikiewicz – funding acquisition, supervision, and editing.Conflicts of interest
There are no conflicts to declare.Acknowledgements
The support of this research by the Polish National Science Centre (grant OPUS 2016/21/B/ST4/03876) is gratefully acknowledged. This research was supported in part by PLGrid Infrastructure.Notes and references
- J. L. Sessler, P. A. Gale and W.-S. Cho, Anion Receptor Chemistry, The Royal Society of Chemistry, 2006 Search PubMed.
- N. H. Evans and P. D. Beer, Angew. Chem., Int. Ed., 2014, 53, 11716–11754 CrossRef CAS PubMed.
- X. Wu, A. M. Gilchrist and P. A. Gale, Chem, 2020, 6, 1296–1309 CAS.
- P. D. Beer and P. A. Gale, Angew. Chem., Int. Ed., 2001, 40, 486–516 CrossRef CAS.
- N. Busschaert, C. Caltagirone, W. Van Rossom and P. A. Gale, Chem. Rev., 2015, 115, 8038–8155 CrossRef CAS PubMed.
- M. J. Langton, C. J. Serpell and P. D. Beer, Angew. Chem., Int. Ed., 2016, 55, 1974–1987 CrossRef CAS PubMed.
- P. Molina, F. Zapata and A. Caballero, Chem. Rev., 2017, 117, 9907–9972 CrossRef CAS PubMed.
- S. Kubik, Acc. Chem. Res., 2017, 50, 2870–2878 CrossRef CAS PubMed.
- Y. Chen, G. Wu, L. Chen, L. Tong, Y. Lei, L. Shen, T. Jiao and H. Li, Org. Lett., 2020, 22, 4878–4882 CrossRef CAS PubMed.
- H. Xie, T. J. Finnegan, V. W. Liyana Gunawardana, R. Z. Pavlović, C. E. Moore and J. D. Badjić, J. Am. Chem. Soc., 2021, 143, 3874–3880 CrossRef CAS PubMed.
- A. Rawal, J. M. Hook, R. N. Robson, D. Gunzelmann, F. M. Pfeffer and L. A. O'Dell, Phys. Chem. Chem. Phys., 2015, 17, 22195–22203 RSC.
- C. A. Schalley, Analytical Methods in Supramolecular Chemistry, 2nd edn, 2012, vol. 1 & 2 Search PubMed.
- C. A. Schalley and A. Springer, Mass Spectrometry of Non-Covalent Complexes: Supramolecular Chemistry in the Gas Phase, Wiley, New York, 2009, pp. 205–231 Search PubMed.
- M. J. Cohen and F. W. Karasek, J. Chromatogr. Sci., 1970, 8, 330–337 CrossRef CAS.
- F. Lanucara, S. W. Holman, C. J. Gray and C. E. Eyers, Nat. Chem., 2014, 6, 281–294 CrossRef CAS PubMed.
- E. Kalenius, M. Groessl and K. Rissanen, Nat. Rev. Chem., 2019, 3, 4–14 CrossRef CAS.
- A. Szumna and J. Jurczak, Eur. J. Org. Chem., 2001, 4031–4039 CrossRef CAS.
- K. Dabrowa, F. Ulatowski, D. Lichosyt and J. Jurczak, Org. Biomol. Chem., 2017, 15, 5927–5943 RSC.
- M. Zimnicka, K. Kozłowska and W. Danikiewicz, J. Org. Chem., 2020, 85, 8990–9000 CrossRef CAS PubMed.
- A. A. Shvartsburg and R. D. Smith, Anal. Chem., 2008, 80, 9689–9699 CrossRef CAS PubMed.
- C. N. Naylor, T. Reinecke, M. E. Ridgeway, M. A. Park and B. H. Clowers, J. Am. Soc. Mass Spectrom., 2019, 30, 2152–2162 CrossRef CAS PubMed.
- K. Giles, J. L. Wildgoose, D. J. Langridge and I. Campuzano, Int. J. Mass Spectrom., 2010, 298, 10–16 CrossRef CAS.
- C. Bleiholder, Int. J. Mass Spectrom., 2016, 399–400, 1–9 CAS.
- A. S. Gelb, R. E. Jarratt, Y. Huang and E. D. Dodds, Anal. Chem., 2014, 86, 11396–11402 CrossRef CAS PubMed.
- K. M. Hines, J. C. May, J. A. McLean and L. Xu, Anal. Chem., 2016, 88, 7329–7336 CrossRef CAS PubMed.
- J. G. Forsythe, A. S. Petrov, C. A. Walker, S. J. Allen, J. S. Pellissier, M. F. Bush, N. V. Hud and F. M. Fernández, Analyst, 2015, 140, 6853–6861 RSC.
- M. F. Bush, I. D. G. Campuzano and C. V. Robinson, Anal. Chem., 2012, 84, 7124–7130 CrossRef CAS PubMed.
- W. B. Ridenour, M. Kliman, J. A. McLean and R. M. Caprioli, Anal. Chem., 2010, 82, 1881–1889 CrossRef CAS PubMed.
- C. A. Scarff, K. Thalassinos, G. R. Hilton and J. H. Scrivens, Rapid Commun. Mass Spectrom., 2008, 22, 3297–3304 CrossRef CAS PubMed.
- B. T. Ruotolo, J. L. P. Benesch, A. M. Sandercock, S.-J. Hyung and C. V. Robinson, Nat. Protoc., 2008, 3, 1139–1152 CrossRef CAS PubMed.
- M. F. Bush, Z. Hall, K. Giles, J. Hoyes, C. V. Robinson and B. T. Ruotolo, Anal. Chem., 2010, 82, 9557–9565 CrossRef CAS PubMed.
- L. S. Fenn and J. A. McLean, Phys. Chem. Chem. Phys., 2011, 13, 2196–2205 RSC.
- X. Zheng, N. A. Aly, Y. Zhou, K. T. Dupuis, A. Bilbao, V. L. Paurus, D. J. Orton, R. Wilson, S. H. Payne, R. D. Smith and E. S. Baker, Chem. Sci., 2017, 8, 7724–7736 RSC.
- J. V. Hamilton, J. B. Renaud and P. M. Mayer, Rapid Commun. Mass Spectrom., 2012, 26, 1591–1595 CrossRef CAS.
- J. A. Picache, B. S. Rose, A. Balinski, K. L. Leaptrot, S. D. Sherrod, J. C. May and J. A. McLean, Chem. Sci., 2019, 10, 983–993 RSC.
- https://www.vanderbilt.edu/AnS/chemistry/groups/mcleanlab/ccs.html .
- https://mcleanresearchgroup.shinyapps.io/CCS-Compendium/ .
- https://depts.washington.edu/bushlab/ccsdatabase/ .
- https://clemlab.sitehost.iu.edu/Research/Cross%20Section%20Database/cs_database.php .
- I. W. Haynes, G. Wu, M. A. Haque, H. Li and T. D. Do, Anal. Chem., 2019, 91, 13439–13447 CrossRef CAS PubMed.
- W. Zhang, A. Abdulkarim, F. E. Golling, H. J. Räder and K. Müllen, Angew. Chem., Int. Ed., 2017, 56, 2645–2648 CrossRef CAS PubMed.
- Y.-T. Chan, X. Li, M. Soler, J.-L. Wang, C. Wesdemiotis and G. R. Newkome, J. Am. Chem. Soc., 2009, 131, 16395–16397 CrossRef CAS PubMed.
- C. S. Mallis, M. L. Saha, P. J. Stang and D. H. Russell, J. Am. Soc. Mass Spectrom., 2019, 30, 1654–1662 CrossRef CAS PubMed.
- M. J. Chmielewski, A. Szumna and J. Jurczak, Tetrahedron Lett., 2004, 45, 8699–8703 CrossRef CAS.
- T. Wyttenbach and M. T. Bowers, J. Phys. Chem. B, 2011, 115, 12266–12275 CrossRef CAS PubMed.
- C. Ieritano, J. Crouse, J. L. Campbell and W. S. Hopkins, Analyst, 2019, 144, 1660–1670 RSC.
- V. Shrivastav, M. Nahin, C. J. Hogan and C. Larriba-Andaluz, J. Am. Soc. Mass Spectrom., 2017, 28, 1540–1551 CrossRef CAS PubMed.
- V. Gabelica, A. A. Shvartsburg, C. Afonso, P. Barran, J. L. P. Benesch, C. Bleiholder, M. T. Bowers, A. Bilbao, M. F. Bush, J. L. Campbell, I. D. G. Campuzano, T. Causon, B. H. Clowers, C. S. Creaser, E. De Pauw, J. Far, F. Fernandez-Lima, J. C. Fjeldsted, K. Giles, M. Groessl, C. J. Hogan Jr., S. Hann, H. I. Kim, R. T. Kurulugama, J. C. May, J. A. McLean, K. Pagel, K. Richardson, M. E. Ridgeway, F. Rosu, F. Sobott, K. Thalassinos, S. J. Valentine and T. Wyttenbach, Mass Spectrom. Rev., 2019, 38, 291–320 CrossRef CAS PubMed.
- K. Richardson, D. Langridge and K. Giles, Int. J. Mass Spectrom., 2018, 428, 71–80 CrossRef CAS.
- J. K. Badenhoop and F. Weinhold, J. Chem. Phys., 1997, 107, 5422–5432 CrossRef CAS.
- R. H. Stokes, J. Am. Chem. Soc., 1964, 86, 979–982 CrossRef CAS.
- K. Kavallieratos, C. M. Bertao and R. H. Crabtree, J. Org. Chem., 1999, 64, 1675–1683 CrossRef CAS PubMed.
- S. Merenbloom, T. Flick and E. Williams, J. Am. Soc. Mass Spectrom., 2012, 23, 553–562 CrossRef CAS PubMed.
- K. Richardson, D. Langridge, S. M. Dixit and B. T. Ruotolo, Anal. Chem., 2021, 93, 3542–3550 CrossRef CAS PubMed.
- M. Chmielewski and J. Jurczak, Tetrahedron Lett., 2004, 45, 6007–6010 CrossRef CAS.
- M. J. Chmielewski and J. Jurczak, Tetrahedron Lett., 2005, 46, 3085–3088 CrossRef CAS.
- K. Thalassinos, M. Grabenauer, S. E. Slade, G. R. Hilton, M. T. Bowers and J. H. Scrivens, Anal. Chem., 2009, 81, 248–254 CrossRef CAS PubMed.
- Spartan 16, Wavefunction Inc., Irvine (CA), 2016 Search PubMed.
- J. J. P. Stewart, MOPAC2016, http://OpenMOPAC.net Search PubMed.
- M. J. Frisch, G. W. Trucks, H. B. Schlegel, G. E. Scuseria, M. A. Robb, J. R. Cheeseman, G. Scalmani, V. Barone, G. A. Petersson, H. Nakatsuji, X. Li, M. Caricato, A. V. Marenich, J. Bloino, B. G. Janesko, R. Gomperts, B. Mennucci, H. P. Hratchian, J. V. Ortiz, A. F. Izmaylov, J. L. Sonnenberg, D. Williams-Young, F. Ding, F. Lipparini, F. Egidi, J. Goings, B. Peng, A. Petrone, T. Henderson, D. Ranasinghe, V. G. Zakrzewski, J. Gao, N. Rega, G. Zheng, W. Liang, M. Hada, M. Ehara, K. Toyota, R. Fukuda, J. Hasegawa, M. Ishida, T. Nakajima, Y. Honda, O. Kitao, H. Nakai, T. Vreven, K. Throssell, J. A. Montgomery Jr., J. E. Peralta, F. Ogliaro, M. J. Bearpark, J. J. Heyd, E. N. Brothers, K. N. Kudin, V. N. Staroverov, T. A. Keith, R. Kobayashi, J. Normand, K. Raghavachari, A. P. Rendell, J. C. Burant, S. S. Iyengar, J. Tomasi, M. Cossi, J. M. Millam, M. Klene, C. Adamo, R. Cammi, J. W. Ochterski, R. L. Martin, K. Morokuma, O. Farkas, J. B. Foresman and D. J. Fox, Gaussian 16, Revision C.01, Gaussian, Inc., Wallingford CT, 2016 Search PubMed.
Footnote |
| † Electronic supplementary information (ESI) available. See DOI: 10.1039/d1an00958c |
| This journal is © The Royal Society of Chemistry 2021 |

