 Open Access Article
Energy transfer mechanisms and color-tunable luminescence of Tm3+/Tb3+/Eu3+ co-doped Sr4Nb2O9 phosphors for high-quality white light-emitting diodes
Ravina a,
Kanishk Poria
 b,
Mukesh K. Sahuc,
A. Kumara,
Anud,
Sajjan Dahiyae,
Nisha Deopa
 *a and
A. S. Raod
aDepartment of Physics, Chaudhary Ranbir Singh University, Rohtak Bypass Road, Jind-126102, Haryana, India. E-mail: nispectro999@gmail.com; Tel: +918860551723
bDepartment of Physics, Panjab University, Chandigarh-160014, India
cSchool of Computing, Graphic Era Hill University, Haldwani, Uttarakhand-263136, India
dDepartment of Applied Physics, Delhi Technological University, Bawana Road, New Delhi-110 042, India
eDepartment of Physics, Maharshi Dayanand University, Rohtak-124001, Haryana, India
First published on 16th November 2023
Abstract
This paper investigates the synthesis and luminescence characteristics of Tm3+/Tb3+/Eu3+ co-doped Sr4Nb2O9 (SNB) phosphors as potential candidates for white light-emitting diodes (WLEDs). The study explores the energy transfer mechanisms and color-tunable characteristics of these phosphors. The SNB phosphors were prepared using a solid-state reaction method, and their structural and morphological properties were characterized using X-ray diffraction (XRD), scanning electron microscopy (SEM), energy-dispersive X-ray spectroscopy (EDS), and Fourier-transform infrared (FT-IR) spectroscopy. The diffuse reflectance, photoluminescence (PL) and time resolved photoluminescence (TRPL) properties were investigated, revealing efficient energy transfer processes from Tm3+ to Tb3+ and Eu3+ ions. The energy transfer mechanisms were determined through critical distance calculations and analysis of multipolar interactions. The co-doped phosphors exhibited tunable emission colors ranging from blue to white light, with controllable correlated color temperatures (CCTs) and high color rendering indices (CRIs). The CIE chromaticity coordinates were optimized to approach neutral white light. The PL intensity is maintained at 81.19% at 150 °C of that of room temperature which showcases the remarkable thermal stability of the as-prepared phosphors. The results highlight the potential of Tm3+/Tb3+/Eu3+ co-doped SNB phosphors for generating high-quality, color-tunable white light for advanced lighting applications.
1 Introduction
With technological advancements, especially the widespread utilization of rare earth ion-doped phosphors, white light-emitting diodes (WLEDs) have progressively emerged as the optimal choice for next-generation lighting solutions. This preference arises from their inherent advantages, including cost-effectiveness, high efficiency, and environmental friendliness.1–3 Currently, white light can be achieved through two approaches. The first involves integrating a blue InGaN chip with YAG:Ce3+ yellow phosphors. However, this approach lacks the red segment of the spectrum, leading to a diminished color rendering index (CRI) and an elevated correlated color temperature (CCT). This deviation from the natural white light region poses a challenge to achieving high-quality white light illumination. Another approach involves using a near-ultraviolet chip combined with three-color phosphors. This method is capable of meeting the requirements for a high color rendering index (CRI) and achieving a suitable correlated color temperature (CCT).4 By employing this approach, it becomes possible to produce white light that closely resembles natural lighting conditions. Therefore, the development of color-tunable phosphors on a single-phase substrate is a highly significant research direction within the field of white light-emitting diodes (WLEDs). This approach aims to create phosphors that can be adjusted to produce a wide range of colors, enabling versatile and customizable lighting solutions.Rare-earth ions exhibit a remarkably diverse electronic structure, rendering them capable of emitting photoluminescence across a wide range of wavelengths, including visible and infrared light. Particularly in the visible light region, their emission ability and vivid colors stand out, making rare-earth ions highly desirable for various applications, such as lighting and display technologies.5 The fusion of three primary colors—red, green, and blue—is well-known to yield white light. In this context, different phosphors utilize Tm3+, Eu3+, and Tb3+ ions as blue, red, and green emitters, respectively. These ions are chosen for their abundant electron transitions, contributing to the emission properties of the phosphors. For instance, Tm3+ doping in inorganic compounds often yields excellent blue-emitting performance due to the blue transition from 1D2 → 3F4.6,7 Eu3+ ions emit in the orange-red region of the spectrum through the 5D0 → 7FJ (J = 0–4) transitions,8,9 while Tb3+ ions are commonly used as blue-green emitters with the 5D4 → 7FJ (J = 6–3) transitions.10 Co-doping Tm3+, Eu3+, and Tb3+ ions into a single host material allows for the potential generation of a single-phased phosphor emitting white light.11 This approach permits the generation of white light by combining emissions from these different ions. Furthermore, the selection of an appropriate host material is vital for synthesizing phosphors with high performance. The host material plays a crucial role by providing suitable crystal fields for the activator ions. The crystal structure and properties of the host material significantly influence the luminescent properties and efficiency of the phosphor. Hence, careful consideration and optimization of the host material are essential to achieve phosphors with desirable performance characteristics.
The extensive study of niobate group materials is driven by their remarkable electro-optic, dielectric, ferroelectric, pyroelectric, and piezoelectric properties.12,13 Niobate serves as a highly favorable host matrix for doping rare-earth ions due to its exceptional luminescent properties, excellent chemical stability, and good thermal stability. Concerning characteristics related to light emission, the optical absorption observed in niobates is attributed to charge transfer occurring within the NbO6 complex.14 This absorption behavior significantly influences their luminescent properties. While certain pure niobates may not exhibit luminescence, substantial research has been conducted on rare-earth-doped niobates due to their potential as light-emitting materials. The incorporation of rare-earth ions into niobate structures allows for the creation of luminescent centers, expanding the range of applications in areas such as lighting, displays, and optoelectronics.
2 Experimental procedure and instrumentations
Through the solid-state reaction method, we synthesized samples of strontium niobate phosphor Sr4Nb2O9 (SNB) doped with Tm3+, Tb3+, and Eu3+. The precursor materials SrCO3 (98%), Nb2O5 (99.9%), Tm2O3 (99.9%), Tb4O7 (99.9%), Eu2O3 (99.99%) were of analytical grade. Following their precise stoichiometric ratio, we weighed and thoroughly mixed the precursors using an agate mortar until achieving uniformity. These homogeneous mixtures were then poured in an alumina crucible and sintered at 1350 °C for 7 hours, followed by gradual cooling to ambient temperature. We labeled the resulting phosphors as follows: SNB:xTm3+ (x = 0.01, 0.03, 0.05, 0.07, 0.10 mol), SNB:0.03Tm3+, yTb3+ (y = 0.01, 0.02, 0.03, 0.04, 0.05, 0.06, 0.08, 0.10 mol) denoted as TT1-TT10, SNB:0.03Tm3+, 0.06Tb3+, zEu3+ (z = 0.01, 0.03, 0.05 and 0.07 mol) labeled as TTE1-TTE7. Finally, we finely powdered the prepared samples for subsequent characterization.Structural analysis of the samples was conducted using X-ray diffraction (XRD). A Bruker D8 Advance diffractometer equipped with a nickel filter and a Cu Kα radiation source (wavelength λ = 1.5406 Å) was utilized within the 2θ range of 20° to 80°. For examination of sample morphology and elemental composition, scanning electron microscopy (SEM) and energy-dispersive X-ray spectroscopy (EDS) were performed using a Zeiss Gemini 300 instrument. Additionally, Fourier-transform infrared (FT-IR) spectra of the as-synthesized samples were recorded using a Nicolet IS50 FT-IR apparatus. UV spectrum analysis was conducted using a Jasco V-770 spectrophotometer with light sources of deuterium and halogen and a resolution of 1.0 nm. For validation of PL excitation and emission spectra, a Jasco 8300 FP spectrofluorophotometer employing 300 W xenon lamp acts as excitation source and a resolution of 1.0 nm was used. PL decay measurements were performed using the Hitachi F 7000 spectrofluorometer in conjunction with a 450 watts microsecond xenon flash lamp. The time-resolved photoluminescence (TDPL) was performed using the FLAME-S-XR1-ES Ocean Optics spectrometer along with a sample holder along with a heating assembly.
3 Results and discussion
3.1. Study of XRD pattern
Fig. 1 presents the XRD patterns of SNB phosphors doped with 3 mol% Tm3+, 3 mol% Tm3+ and 6 mol% Tb3+. The diffraction patterns demonstrate consistency with standard data (Card No. 048-0558), confirming the successful incorporation of Tm3+, Tb3+ and Eu3+ions into the host lattice. The XRD patterns confirm that the as-prepared phosphor possesses a crystalline cubic structure within the Fm3m space group, showing no structural alterations.15 The impurities at 28° and 50° in the XRD is because of the difference between both ionic radius and charge numbers between the Ln3+ ions and Sr2+ ions. The average crystallite sizes (D) were calculated using Debye–Scherer equation (eqn (1)) from the literature,16
 | (1) |
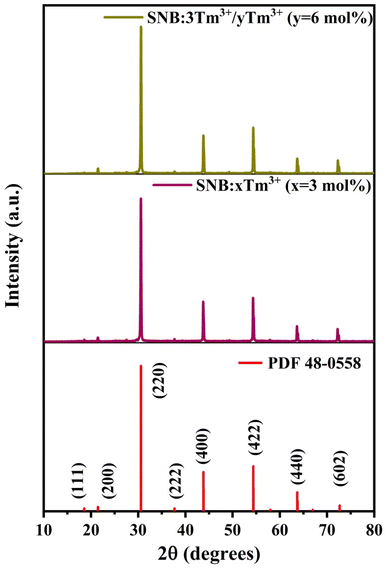 | ||
| Fig. 1 XRD patterns of SNB:xTm3+ (x = 3 mol%), SNB:3Tm3+/yTb3+ (y = 6 mol%) samples and compared with standard data. | ||
Fig. 2 demonstrates the XRD patterns of the SNB:3Tm3+/6Tb3+/zEu3+ (z = 1, 3, 5 and 7 mol%) samples which are consistent with the standard data. The average crystallite size were evaluated and found to be 42.26, 41.88, 41.07 and 42.12 nm, respectively.
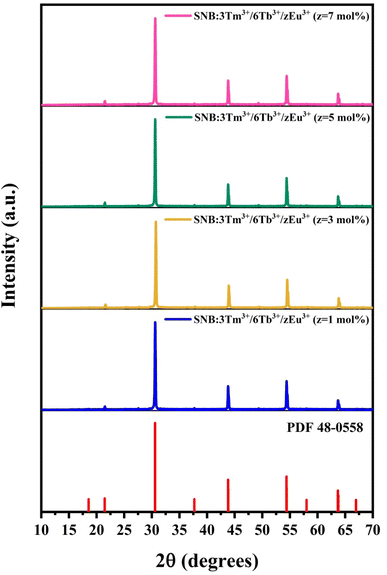 | ||
| Fig. 2 XRD patterns of SNB:3Tm3+/6Tb3+/zEu3+ (z = 1, 3, 5 and 7 mol%) samples and compared with standard data. | ||
3.2. SEM and EDS studies
SEM imaging, SEM-EDS mapping, and EDS spectrum analysis were employed to investigate the morphology and elemental composition of the SNB sample doped with 3 mol% Tm3+ and 1 mol% Tb3+, as illustrated in Fig. 3. In Fig. 3(a), the SEM image unveils the presence of regular and smooth micron-sized particles within the SNB sample. Elemental mapping results in Fig. 3(b–f) exhibit a uniform distribution of Sr, Nb, O, Tm, and Tb elements across the grains. The EDS spectrum depicted in Fig. 3(g) displays distinct peaks corresponding to Nb, O, and Sr, along with smaller peaks representing Tm and Tb. No indications of impurity elemental peaks are evident, indicating the successful integration of Tm3+ and Tb3+ ions into the SNB host matrix. The inset within Fig. 3(g) illustrates the elemental compositions. | ||
| Fig. 3 (a) SEM images. (b–f) SEM-EDS mapping. (g) EDS spectrum of SNB:3 mol% Tm3+, 6 mol% Tb3+ phosphor [inset shows the elements weight and atomic percent]. | ||
3.3. FTIR studies
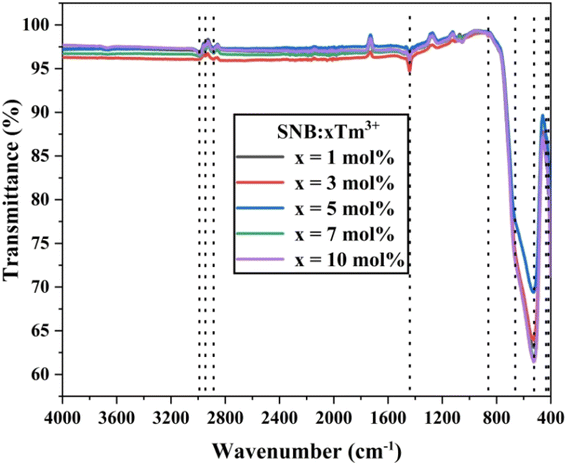
The structural components and functional groups present in the as-synthesized SNB:xTm3+ (x = 1, 3, 5, 7, and 10 mol%) phosphor were analyzed by recording FT-IR spectra in the wavenumber range of 4000–400 cm−1. Fig. 4 illustrates the FT-IR spectra of the synthesized phosphor. FT-IR spectroscopy was employed in the initial stage of material analysis to ensure the quality of the product. The shift in peak positions indicated the presence of contaminants. The spectra exhibited analogous positions of shoulder, as shown in Fig. 4. The FT-IR spectra revealed the presence of nine peaks at approximately 418, 435, 525, 651, 861, 1442, 2885, 2948, and 2989 cm−1. These peaks were assigned based on previous reported papers. The peak observed near 418 and 525 cm−1 corresponds to the Sr–O stretching modes.17 The peaks around 435 and 861 cm−1 are attributed to the coupling between Nb–O stretching mode.18 The peak at approximately 651 cm−1 is due to Tm–O stretching vibrations.19 The peaks observed in the range of 1442 and 2989 cm−1 are associated with water molecules.20 The disturbances in the form of peaks between 1000 to 3000 cm−1 may indicate the presence of residual organic compounds.21 Furthermore, the absence of significant evidence of carbonates or carboxyl groups in the FT-IR spectra confirms the synthesis of phosphor materials from their precursor carbonates.3.4. Diffuse reflectance study
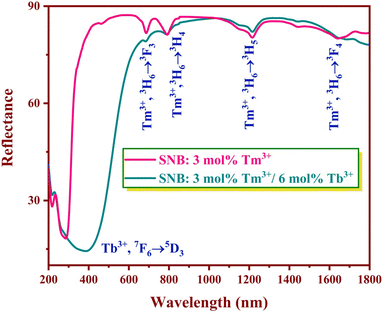
Diffuse reflectance spectra were collected for the SNB samples doped with 3 mol% Tm3+ and SNB:3 mol% Tm3+, 6 mol% Tb3+ over the wavelength range of 200–1800 nm, spanning the UV-visible and near-IR regions at room temperature, as depicted in Fig. 5.In the phosphors doped solely with Tm3+, the absorption bands located at approximately 684, 788, 1216, and 1644 nm correspond to transitions from the ground level 3H6 to 3F3, 3H4, 3H5 and 3F4 levels, respectively.22 In phosphors co-doped with both Tm3+ and Tb3+, a captivating interplay of energy level transitions is observable. Tm3+ ions exhibit transitions at 684, 788, 1216, and 1644 nm, while Tb3+ ions exhibits the 7F6 → 5D3 energy level transition at 386 nm.23
3.5. Photoluminescence properties
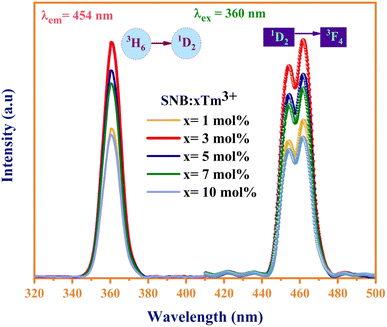
Fig. 6 displays the photoluminescence excitation and emission spectra of the synthesized SNB:xTm3+ (x = 1, 3, 5, 7, 10 mol%) phosphors. The dominant excitation peak at 360 nm can be attributed to the distinctive 3H6 → 1D2 transitions of Tm3+ ions, effectively stimulated by near-ultraviolet (NUV) light. In the emission spectra, a broad peak ranging from 440 to 480 nm under the 360 nm excitation for SNB:xTm3+ (x = 1, 3, 5, 7, 10) phosphors is associated with the 1D2 → 3F4 transition.24Interestingly, the peak intensity of the samples initially increases and then diminishes as the Tm3+ doping concentration rises. This intensity attains its peak at x = 3 mol%, which is attributed to concentration quenching, as depicted in Fig. 6. This phenomenon arises from the cross relaxation mechanism due to variations in the spacing between luminescence centers. At lower concentrations of Tm3+ ions, the spacing between them is sufficiently small to effectively neglect fluorescence quenching.25 However, with an increasing concentration of Tm3+ ions, the gap between the ions diminishes, falling below the critical transfer distance. This results in a higher utilization of Tm3+ ions at the 1D2 level, consequently leading to a decrease in luminous efficiency.
3.6. Energy transfer from Tm3+ to Tb3+
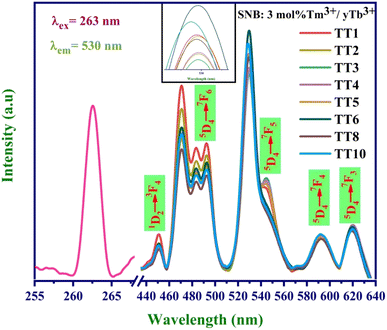
To explore the energy transfer mechanism from Tm3+ to Tb3+ ions, we prepared SNB phosphors doped with 3 mol% Tm3+ and varying concentrations of Tb3+ (denoted as y mol%, where y = 1, 2, 3, 4, 5, 6, 8, and 10 mol%). Fig. 7 illustrates the emission spectra under 263 nm UV light excitation, and a spectral comparison reveals that the emission peak positions remain nearly consistent across the 8 samples, appearing at approximately 450, 492, 530, 591, and 620 nm.26Analysis of the emission spectra indicates that as the concentration of Tb3+ ions increases, the luminescent intensity of the distinct blue emission peak at 450 nm decreases. Meanwhile, the emission peaks attributed to Eu3+ ions at 530 nm initially experience an increase, reaching a maximum for Tm-3 mol% and Tb-6 mol%, followed by a gradual decrease. This observation suggests the occurrence of a concentration quenching phenomenon, signifying the energy transfer from Tm3+ to Tb3+ ions.
The efficiency of energy transfer from Tm3+ to Tb3+ ions can be quantified using the formula:27
 | (2) |
The calculated efficiency values for the TT1, TT2, TT3, TT4, TT5, TT6, TT8, and TT10 phosphors are 86.1%, 88.5%, 89.7%, 90.2%, 90%, 91.3%, 90.3%, and 90.4%, respectively. These results underscore a significant improvement in energy transfer efficiency with increasing concentration, reaching its peak value in the TT6 phosphor sample. The higher concentration of Tb3+ ions surrounding the Tm3+ ions promotes a greater likelihood of cross relaxation between the transitions of Tm3+ (1D2 → 3F4) and Tb3+ (5D4 → 7F5).28 This phenomenon elucidates the concentration quenching and the reduction in emission intensity at 450 nm. The quantum yield for the TT6 phosphor was evaluated using the equations mentioned in literature and comes out to be 41% which is higher than the other reported works.29,30
Fig. 8 graphically portrays the energy transfer efficiency between Tm3+ and Tb3+ ions, alongside the emission intensities corresponding to the 1D2 → 3F4 transition of Tm3+ and the 5D4 → 7F5 transition of Tb3+. As the concentration of Tb3+ ions increases, the emission intensity of Tm3+ decline, while conversely, the emission intensity of Tb3+ and the energy transfer efficiency increases.
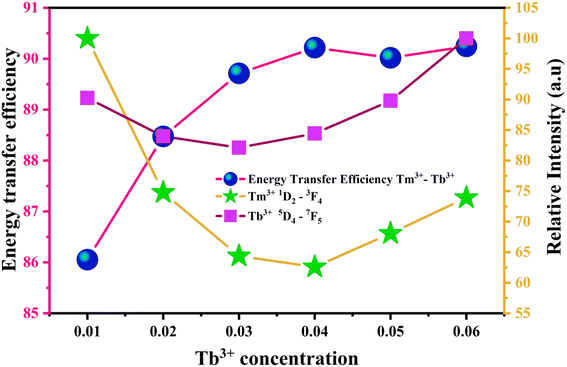 | ||
| Fig. 8 Energy transfer efficiency of Tm3+ → Tb3+ and the luminous intensity curve of the monitoring wavelength were 450 nm (Tm3+) and 530 nm (Tb3+). | ||
The emission spectra of SNB:3 mol% Tm3+, 6 mol% Tb3+, and z mol% Eu3+ phosphors illuminated by 264 nm UV light are depicted in Fig. 9. These spectra reveal distinct emission peaks associated with Tm3+, Tb3+, and Eu3+ ions at 450, 493, 528, 593, and 618 nm.31,32 Notably, the positions of these characteristic peaks remain largely consistent across varying Eu3+ concentrations. Specifically, the emission intensity at 528 nm initially increases until the TTE5 phosphor, after which it diminishes with higher Eu3+ ion concentrations.
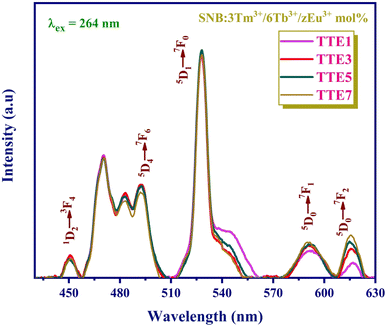 | ||
| Fig. 9 PL spectra of SNB:3 mol% Tm3+/6 mol% Tb3+/z mol% Eu3+ phosphors under 264 nm excitation wavelength. | ||
Fig. 10 provides further insight, illustrating changes in emission intensity. The emission intensity from Tm3+ ions at 450 nm and Tb3+ ions at 493 nm declines, while the emission intensity attributed to Eu3+ ions at 618 nm rises as the Eu3+ concentration increases. This observation strongly implies a dual energy transfer mechanism, occurring from both Tm3+ and Tb3+ ions to Eu3+ ions.
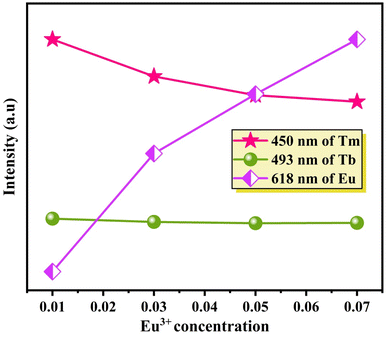 | ||
| Fig. 10 Variation of the emission intensity of Tm3+/Tb3+/Eu3+ ions with the concentration of Eu3+ ions. | ||
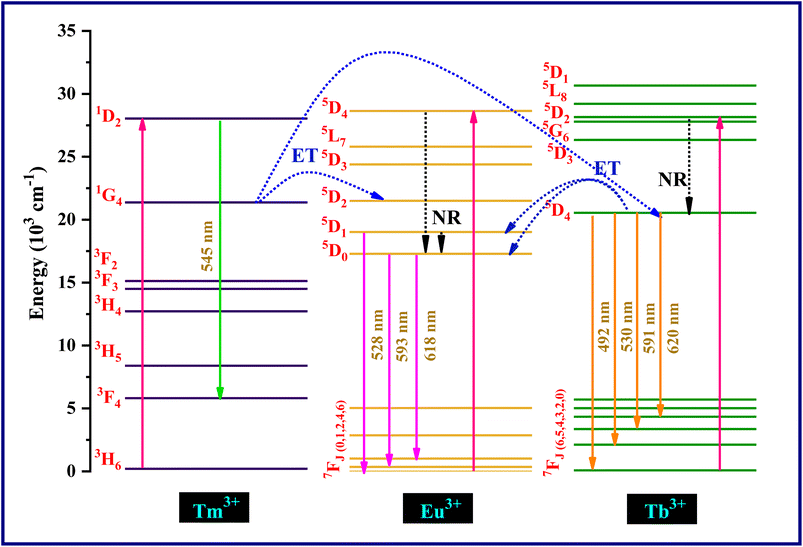
Energy transfer mechanism of Tm3+, Tb3+ and Eu3+ ions is illustrated in the schematic diagram presented in Fig. 11. The ions at ground state get excited to the higher energy levels of Tm3+, Tb3+ and Eu3+ by the 264 nm UV excitation. After that ions gets de-excited to lower energy states 5D1,0 of Eu3+ and 5D4 of Tb3+ through non-radiative emission aided by phonons and relaxed to the ground state. In the case of Tm3+ ions, the blue photons emitted at 545 nm associated with 1D2 → 3F4 transition. In the case of Tb3+ ions, the cyan and green photons emitted at 492 nm and 530 nm associated with 5D4 → 7F6 transition and 5D4 → 7F5 transition, respectively and for Eu3+ ions transitions at 593 nm (5D0 → 7F1) and 618 nm (5D0 → 7F2) emit orange and red photons, respectively. As the energy gap between the excited state 1G4 of Tm3+ ions and 5D4 of Tb3+ ions is smaller so they can bridge with the phonons of host lattice which results in non-radiative relaxation in Tm3+. Some part of the energy is migrated to Tb3+ which results in transition from 7F6 to 5D4.33 The non-radiative resonant energy transfer from Tm3+ (1G4) to Eu3+ ions (5D2) is because of lesser energy difference between these two states. This result in the Eu3+ ions transition from 7F1 level to 5D2 state and then return to 5D0 state through non-radiatively which accompanied further radiative emission from this excited state to 7F1 and 7F2 state.
The energy transfer interactions between sensitizers and activators can be broadly categorized into two primary types: exchange interaction and electric multipolar interaction. The characterization of these interactions hinges on a critical parameter known as the critical distance (Rc) between the sensitizers and activators. If the value of Rc remains below 5 Å, exchange interaction is likely; however, if Rc surpasses this threshold, electric multipolar interaction becomes more probable.34
In order to determine the nature of the interaction between Tm3+ (sensitizer) and Tb3+ (activator), the critical distance Rc can be quantified using an equation outlined in existing literature.35
 | (3) |
The computed Rc value is found to be 18.04 Å, which significantly exceeds the 5 Å threshold. This outcome strongly suggests that the energy transfer mechanism is primarily driven by electric multipolar interactions.
Utilizing Dexter's energy transfer formula for multipolar interaction and applying Reisfeld's approximation, the relationship can be presented as follows:36,37
 | (4) |
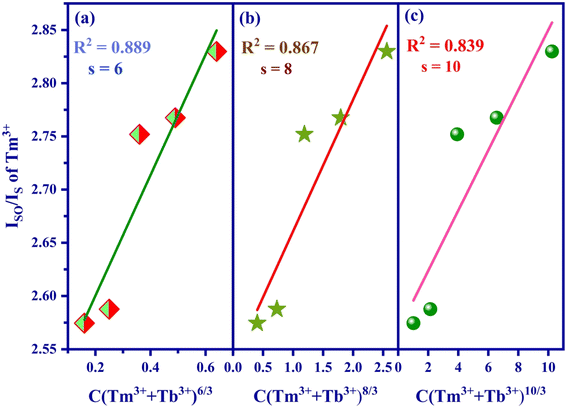 | ||
| Fig. 12 Fitting relationship of Iso/Is of Tm3+ on (a) C (Tm3+ + Tb3+)6/3, (b) C (Tm3+ + Tb3+)8/3 and (c) C (Tm3+ + Tb3+)10/3. | ||
To provide additional evidence for Tm3+ → Tb3+ energy transfer in SNB phosphor. Theoretically, it is known that when 3 mol% Tm3+ 6 mol% Tb3+ → z Eu3+ energy transfers, the time attenuation of Tb3+ ions will be accelerated energy transfer process 3 mol% Tm3+ 6 mol% Tb3+→ z Eu3+. If 3 mol% Tm3+ 6 mol% Tb3+ and Eu3+ ions work independently without occurrence of 3 mol% Tm3+ 6 mol% Tb3+ → z Eu3+ energy transfers, the fluorescence lifetime of both remain equivalent to that observed in the single-doped sample. The experimental analysis of fluorescence lifetime of Eu3+ ions in SNB:3 mol% Tm3+, 6 mol% Tb3+, z Eu3+ phosphor was tested and the double exponential decay function was used to fit well:39,40
 | (5) |
 | (6) |
The fluorescence lifetime decay curve of SNB:3 mol% Tm3+, SNB:3 mol% Tm3+, 6 mol% Tb3+ and SNB:3 mol% Tm3+, 6 mol% Tb3+, z Eu3+ phosphors is shown in Fig. 13 and the calculated τav value are 2.11, 1.90 and 1.64 ms, respectively. From the result it is evident that the decrement in the average life time of co doping sample SNB:3 mol% Tm3+, 6 mol% Tb3 is due to energy transfer between Tm3+ to Tb3+. Further, the average lifetime decreased further when it is doped with Eu3+, thus powerfully confirming the existence of 3 mol% Tm3+ 6 mol% Tb3+ → z Eu3+.
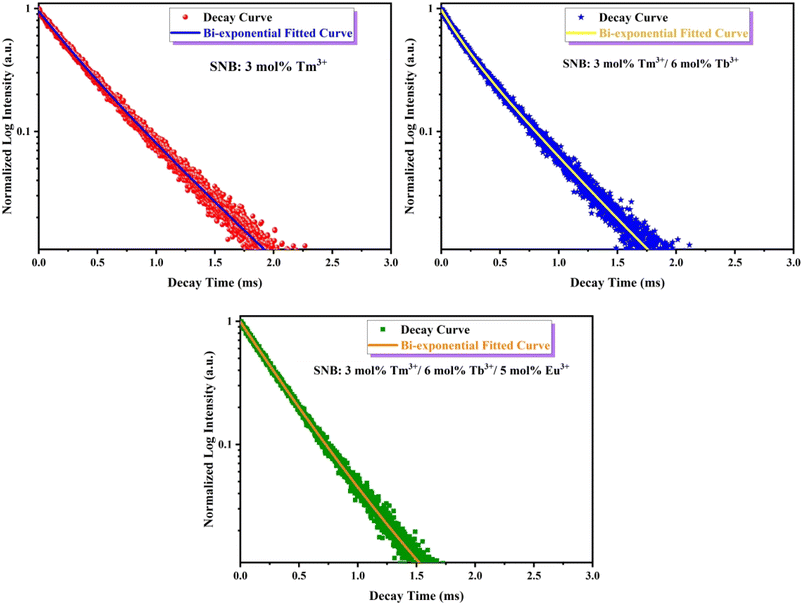 | ||
| Fig. 13 PL decay curve for SNB:3 mol% Tm3+, SNB:3 mol% Tm3+/6 mol% Tb3+ and SNB:3 mol% Tm3+/6 mol% Tb3+/5 mol% Eu3+ phosphors. | ||
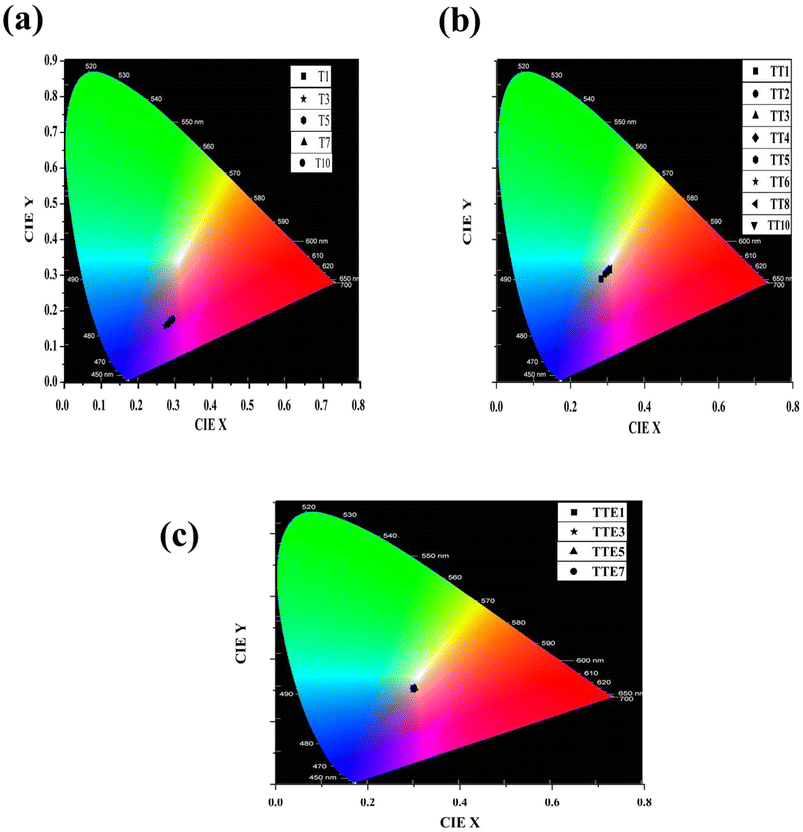
The CIE chromaticity coordinates of SNB:xTm3+, SNB:3 mol% Tm3+, yTb3+ and SNB:3 mol% Tm3+, 6 mol% Tb3+, zEu3+ phosphors are evaluated using formulation from the reported work in literature42,43
| CCT = −449n3 + 3525n2 − 6823.3n + 5520.33 | (7) |
| Sample | Color co-ordinates | CRI | CCT (K) | |
|---|---|---|---|---|
| X | Y | |||
| T1 | 0.288 | 0.172 | — | 6500 |
| T3 | 0.271 | 0.157 | — | 3032 |
| T5 | 0.279 | 0.163 | — | 3616 |
| T7 | 0.280 | 0.165 | — | 4337 |
| T10 | 0.293 | 0.176 | — | 7858 |
| TT1 | 0.282 | 0.289 | 88.82 | 9677 |
| TT2 | 0.293 | 0.303 | 89.41 | 8163 |
| TT3 | 0.303 | 0.313 | 89.51 | 7256 |
| TT4 | 0.302 | 0.314 | 89.52 | 7309 |
| TT5 | 0.304 | 0.315 | 89.53 | 7165 |
| TT6 | 0.298 | 0.309 | 89.48 | 7622 |
| TT8 | 0.306 | 0.316 | 89.55 | 6984 |
| TT10 | 0.302 | 0.312 | 89.45 | 7291 |
| TTE1 | 0.299 | 0.307 | 89.34 | 7623 |
| TTE3 | 0.298 | 0.303 | 88.87 | 7815 |
| TTE5 | 0.301 | 0.307 | 89.11 | 7467 |
| TTE7 | 0.299 | 0.303 | 88.64 | 7662 |
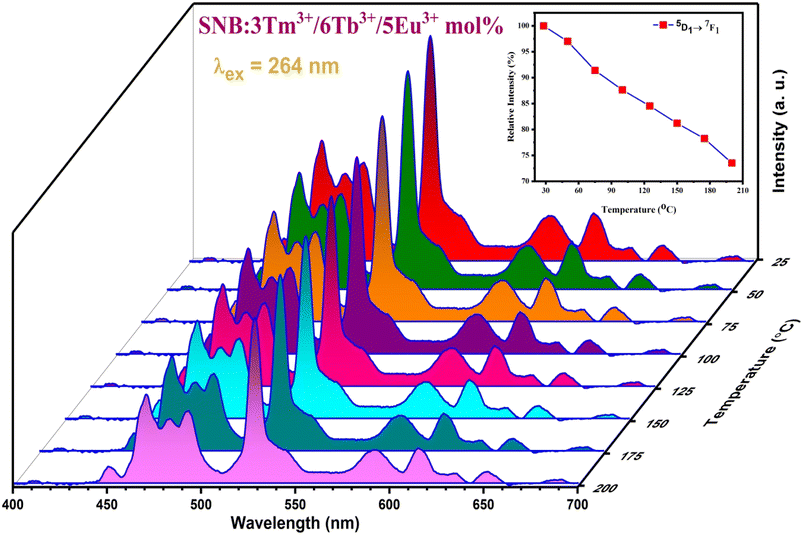
The thermal stability of as-prepared phosphors is crucial parameter in the application of W-LEDs device as operating temperature may increase significantly after the constant working of device at high temperature. The temperature dependent photoluminescence of SNB:3 mol% Tm3+, 6 mol% Tb3+, 5 mol% Eu3+ phosphor under 263 nm excitation was conducted in the range spanning from room temperature (28 °C) to 200 °C is shown in Fig. 15. The results indicate that the emission intensities of the as-prepared sample decreases with the rise in temperature because of thermal quenching but position remains unaltered. This decrement is attributed to the non-radiative transitions, therefore rate of intensity reduction changes over different emission peaks. This characteristic maintains the color stability of the as-prepared phosphors which indicates their reliable performance. Thermal stability was determined through the ratio of emission intensity at particular temperature to that at room temperature. The emission trend of the transition 5D1 → 7F1 is depicted in the inset of Fig. 15. The strength of intensity at 150 °C and 200 °C relative to that at room temperature comes out to be 81.19% and 73.51%, respectively which is higher than reported work in the literature.28 The results indicate the excellent thermal stability of the as-prepared phosphor.
3.7. Conclusions
We have synthesized a series of single-phase SNB phosphors co-doped with Tm3+, Tb3+, and Eu3+ ions. XRD analysis of the SNB phosphor confirms the formation of cubic structure within the Fm3m space group and its match with standard data from the JCPDS file. The quantum efficiency of TT6 phosphor found to be 91.3%. The TDPL spectra reveal that the PL intensity persists to 81.19% at 150 °C in compare to room temperature. Under an excitation wavelength of 360 nm, Tm3+ single-doped SNB samples exhibit blue luminescence, characterized by an initial increase followed by a subsequent decrease in luminescence intensity. The maximum intensity is reached at a 3 mol% doping concentration. Additionally, the photoluminescence emission spectra of SNB phosphors co-doped with Tm3+ and Tb3+ ions, excited at 263 nm, reveal a declining intensity of Tm3+ emissions alongside an increasing intensity of Tb3+ emissions. This shift in the behavior of Tm3+ and Tb3+ ion intensities signifies the occurrence of energy transfer from Tm3+ to Tb3+ ions. Upon doping Eu3+ ions into the optimized co-doped sample (3 mol% Tm3+ and 6 mol% Tb3+), both Tb3+ and Tm3+ ion intensities decrease as the concentration of Eu3+ ions increases. This variation in intensity is attributed to the energy transfer process from the optimized co-doped sample to Eu3+ ions. By carefully adjusting the doping concentrations of Tm3+, Tb3+, and Eu3+ ions to approximately 3 mol%, 6 mol%, and 5 mol%, respectively, the emission color can be fine-tuned to achieve white light emission.Author contribution
Ravina: conceptualization, methodology, writing – original draft. Kanishk Poria: conceptualization, methodology, writing – original draft. Mukesh K Sahu: data curation, writing – review & editing. A. Kumar: formal analysis. Anu: formal analysis. Sajjan Dahiya: resources, formal analysis. Nisha Deopa: supervision, methodology, software, validation, writing – review & editing formal analysis. A. S. Rao: writing – review & editing.Conflicts of interest
There are no conflicts to declare.Acknowledgements
One of the authors, Ms Anu is very much thankful to CSIR/UGC for the award of a Junior Research Fellowship (JRF) (UGC Ref. 1352: CSIR-UGC NET DEC. 2018) to her.References
- J. Zheng, X. Wu, Q. Ren, W. Bai, Y. Ren, M. Wang and O. u. Hai, Investigation of luminescence properties and energy transfer in Sm3+ and Eu3+ co-doped Sr3Y (BO3)3 red phosphors, Opt. Laser Technol., 2020, 122, 105857 CrossRef CAS
.
- W. Zhang, H. Shen, X. Hu, Y. Wang, J. Li, Z. J. Zhu, Z. You and C. Tu, Solid-state synthesis, structure and spectroscopic analysis of Dy:CaYAl3O7 phosphors, J. Alloys Compd., 2019, 781, 255–260 CrossRef CAS
.
- Q. Ren, Y. Zhao, X. Wu and O. Hai, Tb3+/Eu3+/Tm3+ co-doped single-phase phosphors emitting close to standard white light, Opt. Laser Technol., 2021, 136, 106774 CrossRef CAS
.
- H. Patnam, S. K. Hussain, L. K. Bharat and J. S. Yu, Synthesis and luminescence properties of Eu3+ and Dy3+ ions single and co-doped Ba2LaV3O11 phosphors for white-light applications, Dyes Pigm., 2019, 162, 583–589 CrossRef CAS
.
- D. Rajesh, K. Brahmachary, Y. C. Ratnakaram, N. Kiran, A. P. Baker and G.-G. Wang, Energy transfer based emission analysis of Dy 3+/Eu 3+ co-doped ZANP glasses for white LED applications, J. Alloys Compd., 2015, 646, 1096–1103 CrossRef CAS
.
- J. Li, H. Yan and F. Yan, A novel high color purity blue-emitting phosphor: CaBi2B2O7: Tm3+, Mater. Sci. Eng., B, 2016, 209, 56–59 CrossRef CAS
.
- T. S. Atabaev, H. H. Thi Vu, H. K. Kim and Y. H. Hwang, The optical properties of Eu3+ and Tm3+ codoped Y2O3 submicron particles, J. Alloys Compd., 2012, 525, 8–13 CrossRef CAS
.
- G. Zhu, Z. P. Ci, Y. R. Shi, M. D. Que, Q. Wang and Y. H Wang, Synthesis, Crystal Structure and Luminescence Characteristics of a Novel Red Phosphor Ca19Mg2(PO4)14:Eu3+ for Light Emitting Diodes and Field Emission Displays, J. Mater. Chem. C, 2013, 1, 5960–5969 RSC
.
- A. G. Bispo Jr, S. A. M. Lima and A. M. Pires, Energy transfer between terbium and europium ions in barium orthosilicate phosphors obtained from sol-gel route, J. Lumin., 2018, 199, 372–378 CrossRef CAS
.
- P. C. Ricci, M. Salis, R. Corpino, C. M. Carbonaro, E. Fortin and A. Anedda, A Kinetics Model for Tb3+ Recombinations in Low Doped Tb:Lu1.8Y0.2SiO5 Crystals, J. Appl. Phys., 2010, 108, 043512 CrossRef
.
- W. Zhao, X. Feng and B. Fan, Novel color tunable phosphors NaYGeO4: Tm3+,Tb3+,Eu3+ for ultraviolet excited white LEDs with good thermal stability, J. Mater. Sci.: Mater. Electron., 2020, 31, 14434–14442 CrossRef CAS
.
- V. V. Atuchin, B. I. Kidyarov and N. V. Pervukhina, Shortest chemical bond length as a criterion for searching new noncentrosymmetric niobate and tantalite crystals with high optical nonlinearity, J. Cryst. Growth, 2005, 275, 1941–1946 CrossRef
.
- V. V. Atuchin, J. C. Grivel, A. S. Korotkov and Z. Zhang, Electronic parameters of Sr2Nb2O7 and chemical bonding, J. Solid State Chem., 2008, 181, 1285–1291 CrossRef CAS
.
- A. K. Vishwakarma, K. Jha, M. Jayasimhadri, A. S. Rao, K. Jang, B. Sivaiah and D. Haranath, Red light emitting BaNb2O6:Eu3+ phosphor for solid state lighting applications, J. Alloys Compd., 2015, 622, 97–101 CrossRef CAS
.
- R. Lohan, A. Kumar, M. K. Sahu, A. Mor, V. Kumar, N. Deopa and A. S. Rao, Structural, thermal, and luminescence kinetics of Sr4Nb2O9 phosphor doped with Dy3+ ions for cool w-LED applications, J. Mater. Sci.: Mater. Electron., 2023, 34, 694 CrossRef CAS
.
- L. Alexander and H. P. Klug, Determination of crystallite size with the x-ray spectrometer, J. Appl. Phys., 1950, 21, 137–142 CrossRef CAS
.
- M. Sharma, D. Kumar, J. P. Gewali and A. Thakur, Yttrium doped strontium nano hexaferrites: Influence of yttrium on the structural and magnetic properties of sol-gel synthesized nanocrystalline strontium hexaferrite, Int. J. Mod. Phys.: Conf. Ser., 2022, 2267, 012024 Search PubMed
.
- K. Poria, R. Lohan, S. Bhatia, A. Kumar, R. Singh, N. Deopa, R. Punia, J. S. Shahi and A. S. Rao, Lumino-structural properties of Dy3+ activated Na3Ba2LaNb10O30 phosphors with enhanced internal quantum yield for w-LEDs, RSC Adv., 2023, 13(17), 11557–11568 RSC
.
- F. A. Kerim, H. F. Aly and A. Agramy, Infrared absorption spectra of some lanthanide acetylacetonate complexes, Proc. Indian Acad. Sci., 1977, 85, 559–566 CrossRef
.
- M. Afqir, A. Tachafine, D. Fasquelle, M. Elaatmani, J. C. Carru, A. Zegzouti, M. Daoud, S. Sayouri, T. D. Lamcharfi and M. Zouhairi, Structural, electric and dielectric properties of Eu-doped SrBi2Nb2O9 ceramics obtained by co-precipitation route, Process, Appl. Ceram., 2012, 12, 72–77 CrossRef
.
- I. P. Sahu, D. P. Bisen, N. Brahme and R. K. Tamrakar, Generation of white light from dysprosium-doped strontium aluminate phosphor by a solid-state reaction method, J. Mater. Sci.: Mater. Electron., 2016, 45, 2222–2232 CAS
.
- W. T. Carnall, P. R. Fields and K. Rajnak, Electronic Energy Levels in the Trivalent Lanthanide Aquo Ions. I. Pr3+, Nd3+, Pm3+, Sm3+, Dy3+, Ho3+, Er3+, and Tm3+, J. Chem. Phys., 1968, 49, 4424 CrossRef CAS
.
- W. T. Carnall, P. R. Fields and K. Rajnak, Electronic Energy Levels of the Trivalent Lanthanide Aquo Ions. III. Tb3+, J. Chem. Phys., 1968, 49, 4447 CrossRef CAS
.
- M. Wang, Y. Zhang, Z. Hu and J. Zhang, A single-phased Ca4 (PO4)2O: Tm3+, Tb3+, Eu2+ white light-emitting phosphor with tunable emission color, J. Lumin., 2020, 224, 117301 CrossRef CAS
.
- W. Xiulan, D. Liang, Y. Zheng, M. Pei, Q. Ren and O. Hai, Tm3+→Tb3+ energy transfer induced color-tunable in double-doped LiLaSiO4 phosphors, J. Lumin., 2021, 235, 118027 CrossRef
.
- N. Deopa and A. S. Rao, Spectroscopic studies of single near ultraviolet pumped Tb3+ doped Lithium Lead Alumino Borate glasses for green lasers and tricolour w-LEDs, J. Lumin., 2018, 194, 56–63 CrossRef CAS
.
- R. Pillania, A. Prasad, P. Rohilla, A. Shandilya and A. S. Rao, Photoluminescence and energy transfer studies on Tm3+/Dy3+/Eu3+doped borosilicate glasses for color tunability and warm white light generation, J. Non-Cryst. Solids, 2023, 606, 122192 CrossRef
.
- X. Wu, W. Bai, O. Hai, Q. Ren, J. Zheng and Y. Ren, Tunable color of Tb3+/Eu3+/Tm3+-coactivated K3La(PO4)2 via energy transfer: A single-phase white-emitting phosphor, Opt. Laser Technol., 2019, 115, 176–185 CrossRef CAS
.
- X. Wu, L. Du, Y. Zheng, M. Pei, Q. Ren and O. Hai, Tm3+→ Tb3+ energy transfer induced color-tunable in double-doped LiLaSiO4 phosphors, J. Lumin., 2021, 235, 118027 CrossRef CAS
.
- X. Liu, C. Chen, S. Li, Y. Dai, H. Guo, X. Tang, Y. Xie and L. Yan, Host-sensitized and tunable luminescence of GdNbO4: Ln3+ (Ln3+= Eu3+/Tb3+/Tm3+) nanocrystalline phosphors with abundant color, Inorg. Chem., 2016, 55, 10383–10396 CrossRef CAS PubMed
.
- Y. Chen, X. Liu, G. Chen, T. Yang and C. Yuan, Luminescent characteristics of Tm3+/Tb3+/Eu3+ tri-doped borophosphate glasses for LED applications, J. Mater. Sci.: Mater. Electron., 2017, 28, 5592–5596 CrossRef CAS
.
- Z. Wang, H. Tang, J. Xie, X. Zhang, X. Liu, X. Mi, Q. Liu, L. Lu and Z. Bai, Tunable color and energy transfer of Y2Mg3Ge3O12: Tb3+, Tm3+, Eu3+ phosphors with excellent thermal stability, J. Solid State Chem., 2022, 314, 123371 CrossRef CAS
.
- H. Thakur, A. K. Gathania, I. Kumar and R. K. Singh, Tunable white light photoluminescence of a single phase Tm3+/Tb3+/Eu3+ codoped GdPO4 phosphor, Mater. Today Commun., 2023, 36, 106458 CrossRef CAS
.
- G. Blasse and B. C. Grabmaier, Energy Transfer in Luminescent Materials, Springer Berlin Heidelberg, Berlin, Heidelberg, 1994, pp. 91–107 Search PubMed
.
- G. Blasse, Energy transfer in oxidic phosphors, Philips Res. Rep., 1969, 24, 131–144 CAS
.
- K. Li, M. Shang, H. Lian and J. Lin, Recent development in phosphors with different emitting colors via energy transfer, J. Mater. Chem. C, 2016, 24, 5507–5530 RSC
.
- J. Xiong, Q. Meng and W. Sun, Luminescent properties and energy transfer mechanism from Tb3+ to Eu3+ in CaMoO4:Tb3+,Eu3+ phosphors, J. Rare Earths, 2016, 34, 251–258 CrossRef CAS
.
- D. L. Dexter, A theory of sensitized luminescence in solids, J. Chem. Phys., 1953, 21, 836–850 CrossRef CAS
.
- C. H. Huang, T.-W. Kuo and T.-M. Chen, Novel Red-Emitting Phosphor Ca9Y(PO4)7:Ce3+,Mn2+ with Energy Transfer for Fluorescent Lamp Application, ACS Appl. Mater. Interfaces, 2010, 2, 1395–1399 CrossRef CAS PubMed
.
- N. Deopa, M. K. Sahu, P. R. Rani, R. Punia and A. S. Rao, Realization of warm white light and energy transfer studies of Dy3+/Eu3+ co-doped Li2O-PbO-Al2O3-B2O3 glasses for lighting applications, J. Lumin., 2020, 222, 117166 CrossRef CAS
.
- Y. Zhu, Q. Meng, W. Sun and S. Lü, NaLa(MoO4)2: Sm3+, Tb3+ phosphor: optical temperature sensing material with a wide change range of luminescence color, J. Lumin., 2020, 218, 116854 CrossRef CAS
.
- A. Kumar, A. Mor, M. K. Sahu, R. Pillania, S. Dahiya, N. Deopa, A. Malik, R. Punia and A. S. Rao, Spectral characteristics of Tb3+ doped ZnF2–K2O–Al2O3–B2O3 glasses for epoxy free tricolor w-LEDs and visible green laser applications, J. Lumin., 2022, 244, 118676 CrossRef CAS
.
- C. S. McCamy, Correlated color temperature as an explicit function of chromaticity coordinates, Color Res. Appl., 1992, 17, 142–144 CrossRef
.
| This journal is © The Royal Society of Chemistry 2023 |

