DOI:
10.1039/D4AN00356J
(Paper)
Analyst, 2024,
149, 4213-4221
Study of a microwave induced plasma as a universal ion source for inorganic and organic mass spectrometry†
Received
5th March 2024
, Accepted 29th May 2024
First published on 30th May 2024
Abstract
A proof-of-concept study of the utilization of a single mass spectrometer for qualitative molecular analysis as well as for quantitative metal determination is described. This was performed with an argon microwave plasma as the ion source coupled to an ion trap mass spectrometer. A microwave induced plasma with tuneable power and gas flow rate was loaded with dried nebulized sample solutions. The commercially available plasma torch was slightly modified to allow the introduction of the sample in different regions of the plasma. Using soft settings, organic compounds introduced in the plasma plume could be detected as protonated molecular ions. Under harsher conditions, elemental analysis was demonstrated for several metals. Lead could be determined with a limit of detection of 150 nM. Minor on-the-fly adjustments of the power, flow rate and sampling distance allowed a mild fragmentation of organic compounds. Ionization differences observed were rationalized by emission spectroscopy, and excitation and rotational temperatures were determined. Simultaneous determination of elemental and molecular information was demonstrated for a rubidium–crown-ether complex. The maximum argon gas consumption for these tasks was below 2 L min−1 and the maximal power used was 90 W.
Introduction
In analytical chemistry, ionization for mass spectrometry (MS) is commonly carried out by very different means: inductively coupled plasmas (ICPs)1,2 for the determination of metals, electrospray ionization (ESI)3 and atmospheric-pressure chemical ionization (APCI) for soft molecular analysis, and electron ionization (EI)4 for the fragmentation and structure analysis of organic compounds.5 In analytical laboratories two types of instrument are often employed, ICP-MS instruments for inorganic analysis and instruments fitted with one of the other ionizers for the analysis of organic compounds. Different ion sources for the molecular analysis may be used with a particular instrument, but this requires a mechanical exchange of the ionizer unit and therefore interruption of the analysis. As a mass-spectrometer is a highly complex and therefore expensive instrument it would, first of all, be desirable to be able to carry out the different analytical tasks on a single instrument, and secondly, achieve this with a single ion source which is adaptable on-the-fly. Furthermore, such an ion source hopefully might also be less expensive to run for metal analysis than an ICP-MS, which has a very high argon consumption of about 15 L min−1 and runs on electrical power at about 1–2 kW. The development of universal MS instruments has been relatively little pursued, but for example, Hieftje and coworkers6 reported an instrument which combines ESI and ICP ionization. Yu et al.7 demonstrated different degrees of fragmentation of organometallic compounds for laser ablation when the pressure of the surrounding helium gas was altered. Forbes and Sisco8 showed that different degrees of CID (collision induced dissociation) implemented behind the skimmer of an MS instrument could be employed to obtain molecular as well as elemental information on some explosives.
Microwave induced plasmas (MIPs) are attractive as potential flexible ion sources as they can be sustained over a wide range of power and gas flow rates.9 Generally they are operated at significantly lower power and gas consumption than analytical ICPs. This leads to lower operating costs and reduced cooling and shielding needs, as well as smaller size.9,10 MIPs were created at reduced pressure until the development by Beenakker in 1976 of the TM010 resonator which was stable under atmospheric conditions.11 At around the same time, Moisan described a surfatron which is based on surface wave propagation.12,13
The first use of an MIP as an ionization source for MS was reported by Douglas and French in 1981.14 Nebulized solutions of metal salts were introduced into a Beenakker cavity with 200 W of forward power. As this MIP is less tolerant to water than the high power ICP, the aerosol was desolvated before introduction into the plasma. More often the analysis of organic compounds with MIP-MS has been studied. Pioneer work was carried out by Poussel and Mermet15 who studied fragmentation of various aliphatic and aromatic hydrocarbons with a surfatron based on Ar, Kr, or Xe at reduced pressure and demonstrated that changing the forward plasma power from 25 to 45 W had an effect on the fragmentation pattern of perfluorobutylamine as a model compound. A similar effect was reported by Olson et al.16 for hexane when using a He Beenakker cavity at reduced pressure with 20 W and 50 W power. It was also shown that the fragmentation pattern for chlorobenzene depended on how it was introduced into the plasma. When introduced into the plasma plume it yielded spectra comparable to EI whereas an increase of the monoatomic ions was found when the organic analyte had to pass through the whole plasma column. Other designs of MIPs, which are operated at normal pressure, have been investigated as ions sources and are often referred to simply as MPTs (from Microwave Plasma Torches). Shen and Satzger17 demonstrated fragmentation of organic model compounds with a low power (10–30 W) atmospheric He plasma. The potential of a He MIP for different degrees of soft ionization for perfluorobutylamine and tetramethyltin was also demonstrated by Vela et al. for plasma powers between 20 and 30 W.18 Elemental tin isotopes could be observed among the fragments for tetramethyltin. Zapata and Robbat demonstrated the determination of pesticides in gas-chromatography by mass-spectrometric detection of chloride and sulfide ions obtained from an atmospheric He MIP operated with 60 W of power.19 More recently, Evans-Nguyen et al.20 described the use of an MPT operated with Ar for ambient ionization of metals and molecules (i.e. from the surface of solids and liquids) with mass spectrometry. With a 300 W torch run with 2 L min−1 of argon the detection of organic explosives was achieved with modest fragmentation. Metals were detected while using the in-built fragmentation feature of the mass spectrometer.
Herein we report an investigation into the use of a microwave induced plasma torch with relatively little power consumption for the flexible analysis of nebulized solutions of both metals and organic compounds using a single mass spectrometer. Ar was employed rather than He as the plasma gas due to its lower cost and ready availability. While He MIPs have more often been employed, and the underlying ionization mechanisms show differences for the two gases,21 the literature survey above showed that Ar MIPs also have potential. A commercially available torch based on a surfatron was employed.
Experimental
Chemicals and preparation of standards
Caffeine, buspirone hydrochloride, norfloxacin, reserpine and 18-crown-6 (18C6) were obtained from Sigma-Aldrich (Buchs, Switzerland). Aqueous solutions of these compounds were prepared at 50 μM. Metal salt solutions with a concentration of 50 μM were prepared from AgNO3 (VWR, Dietikon, Switzerland), RbCl (Merck, Buchs, Switzerland), Pb(NO3)2 (Acros Organics, Geel, Belgium) and BaCl2·6H2O (Fluka, Buchs, Switzerland). For the calibration curve, a 5 mM stock solution was diluted to standards with concentrations between 0.25 and 2.0 μM. All solutions were prepared using water with a resistivity of 18.2 MΩ cm (MilliQ, Merck Millipore, Schaffhausen, Switzerland).
Microwave plasma ion source
A schematic drawing of the overall set-up is given in Fig. 1. Microwaves with a frequency of 2.45 GHz were produced by a solid-state microwave generator (GMS450W, Sairem, Décines-Charpieu, France) capable of a maximum power of 450 W. The microwaves were applied with variable power to an S-WAVE surfatron plasma torch (Sairem) equipped with a 6 mm outer diameter (O. D.) and 4 mm inner diameter (I. D.) quartz discharge tube. Argon 5.0 (Pangas, Pratteln, Switzerland) was passed through this discharge tube with a flow rate controlled by a mass flow controller (Bronkhorst, Aesch, Switzerland). The microwave generator and the torch were water-cooled using a recirculating chiller (Huber Unichiller P010-H OLÉ, Huberlab, Aesch, Switzerland). The plasma was ignited with a dielectric barrier discharge (DBD) ignition system available as an option (Sairem) installed on the torch. After ignition, the reflected power was minimized by automatically scanning for the optimal frequency. Subsequently, the microwave generator tune mode was activated resulting in a reflected power of around 1 W. To prevent the emission of microwave radiation an aluminium tube acting as a Faraday shield was placed at the torch outlet to cover the plasma column.
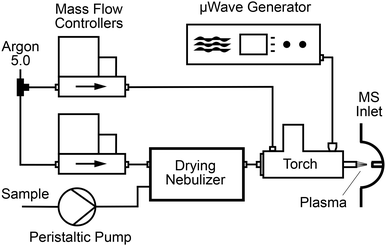 |
| | Fig. 1 Schematic diagram of the microwave induced plasma ion source. | |
The sample solution was transported by a peristaltic pump (Minipuls 3, Gilson, Villiers-le-Bel, France) and was introduced with an uptake rate of 2.0 mL min−1 into a drying ultrasonic nebulizer (U5000AT+, Teledyne Cetac Technologies, Omaha, NE). The respective temperatures of the desolvation system and the electrothermal cooler of the nebulizer were 140 and 3 °C. Argon was used as the nebulizing gas and its flow rate was set by a second mass flow controller. The dried aerosol was conducted to a second quartz tube with 2.0 mm O. D. and 1.0 mm I. D. (Wisag, Effretikon, Switzerland). This sample tube was 25 cm long and was placed coaxially inside the discharge tube with the help of centring bushings. Its position relative to the outlet of the discharge tube could be modified during an experiment by loosening a securing nut. To allow precise positioning, the entire surfatron plasma torch was mounted on a 3-axis linear translation stage (XR series, Thorlabs, Newton, NJ), which in turn was placed on a 3′′ dovetail rail (Thorlabs) fixed in front of the MS inlet.
Mass spectrometer
Mass spectra were obtained with a Thermo Finnigan LCQ Deca quadrupole ion trap mass spectrometer with the original ion source removed. Prior to acquisition, the mass spectrometer ion optics were automatically tuned to the mass of the analyte of interest. The spectrometer has an inlet capillary which is normally heated electrically. This feature was not used, but the capillary was heated due to the presence of the plasma. Its temperature could be read out with the software used to run the spectrometer as it is fitted with a thermocouple. The inlet voltage was not found to affect the plasma and was optimized automatically.
Spectroscopic characterization
Emission spectra were acquired with an Oriel Cornerstone 260i monochromator (Newport Corporation, Irvine, CA) equipped with an Andor CCD 010 camera (Oxford Instruments, Abingdon, UK). For this purpose, an optical fibre (QP400-2-SR-BX, OceanOptics, Ostfildern, Germany) was placed axially at 50 mm from the outlet of the discharge tube. Low resolution emission spectra between 650 and 1000 nm were recorded with a Flame miniature spectrometer (OceanOptics). The excitation temperature Texc was calculated with the help of the Boltzmann plot method. Emission lines were compared to the NIST reference database (https://physics.nist.gov/) from which the numbers required for the construction of the Boltzmann plots were extracted. For this purpose, the relative intensities I of the Ar I lines were extracted from the emission spectrum.22,23 The wavelengths, λ, of the considered transitions were: 425.9, 426.6, 427.2, 430.0, and 433.4 nm. The excitation temperature, Texc, was determined from the gradient of the regression of ln(Iλ/gA) against the energy of the upper transition state, Ek, where g is its degeneracy and A is the Einstein coefficient for spontaneous emission. The gradient corresponds to (−kBTexc)−1 with kB being the Boltzmann constant. The rotational temperature was determined by fitting the molecular OH emission band at 310 nm with the dedicated software Specair (https://www.specair-radiation.net). The slit function was determined in the software from the Ar I line at 416 nm. The electron density was calculated based on the procedure described by Belostotskiy.24 The Stark broadening of the Hβ line at 486.1 nm was investigated using a Voigt fit (Origin Pro, OriginLab, Northampton, MA) and under consideration of Doppler and pressure broadenings.
Safety
Experiments involving microwaves should be performed by trained personnel and precautions should be taken to prevent and detect any microwave leaks.9 The laboratory was monitored with a microwave survey meter (DFM M24DC 2450 MHz, Sairem). Each change on the experimental setup was followed by a test with a leakage meter (IFP 2450 D, Sairem). Finally, all modifications of the plasma torch did not affect parts responsible for the resonance of the microwave cavity.
Results and discussion
Torch configuration
Sample introduction into small microwave plasmas is known to be challenging and the plasma used in this study was expected to be poorly tolerant to aqueous sample loading as a large fraction of the plasma power would be used up by the evaporation of the solvent. Preliminary tests with direct mixing of nebulized samples with the primary Ar flow confirmed this as it adversely affected the ability to ignite the plasma and its stability. However, the amount of solvent introduced into the plasma can be limited by desolvating the wet aerosols prior to their introduction.10 Therefore, an ultrasonic nebulizer equipped with a desolvation system and electrothermal vapour condenser was employed. Based on reported observations made concerning the location of the sample injection into an MIP,15–17,20 the sample introduction was also separated from the main plasma Ar supply. Minor modifications were made to the torch to allow the insertion of a second quartz tube coaxially to the discharge tube as shown in Fig. 2. This inner sample tube could be moved on bushings so that its outlet relative to the end of the discharge tube could be changed. The analyte-containing aerosol could therefore be introduced either directly into the plasma plume extending from the torch when the end of the sample tube was flush with the discharge tube, or be mixed into the main gas in the plasma generating region when the inner tube was retracted. With these modifications the plasma could be ignited easily, and lower power and gas flow rate settings could be used without causing instability (as evidenced by reading the ion current of the mass spectrometer) or quenching of the plasma.
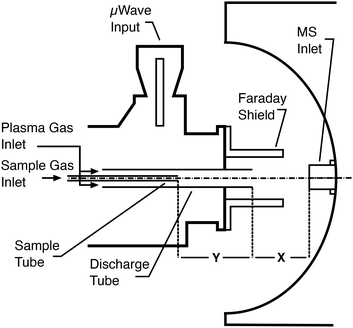 |
| | Fig. 2 Arrangement of the microwave induced plasma torch in front of the inlet of the mass spectrometer. | |
Soft ionization of organic molecules: caffeine and buspirone
To study the soft ionization capability of the modified torch operated with low power, the experimental setup was tested with caffeine as a model compound. The end of the discharge tube of the plasma torch was placed as close as possible to the MS inlet, i.e. at a distance of 9 mm (distance x in Fig. 2). By monitoring the ion count corresponding to protonated caffeine at m/z = 195.1, the microwave power and primary argon flow rate were optimized. These two main parameters were found to depend on each other and were thus adapted together in an iterative fashion. The highest ion current was obtained at a power of 50 W and a flow rate of 1.0 L min−1. Lower power values down to 10 W were manageable but required an increasingly high argon flow (≥5 L min−1) without improvement of the signal. Use of a lower power caused instability of the ion current that required a higher argon flow. A nebulized aqueous solution of caffeine was introduced with an additional 1.0 L min−1 through the sample tube first retracted by 25 mm from the end of the discharge tube. Under these conditions, as shown in Fig. 3A, aside from the protonated molecular ion [M + H]+, masses corresponding to [M + HO]+ (210.9), [M + H3O]+ (213.0) and [M + H3O2]+ (228.9) could be identified with relative intensities ranging from 31 to 14%. Such adducts were also observed when attempting the soft ionization of buspirone. Even though [M + H]+ at m/z = 386.5 was the base peak, masses of protonated buspirone with additional 14N, 16O and NO were also detected in various percentages up to 75% as shown in Fig. 4A. These peaks provide hints towards the main reactive species present in the plasma after transfer from Ar+, namely H3O+, H3O2+ and NO+. These species must be due to air and remaining water entrained into the plasma. Nevertheless, the oxides and other clusters complicated the interpretation of the spectra. Thus, the end of the sample tube was shifted towards the end of the discharge tube (distance y in Fig. 2). This led to an intensity decrease of the unwanted signals and the plasma plume shape changed to a hollow cylinder. When the sample tube end was positioned flush with the discharge tube, the cleanest spectrum was observed with a single [M + H]+ peak both for caffeine and buspirone as shown in Fig. 3B and 4B respectively.
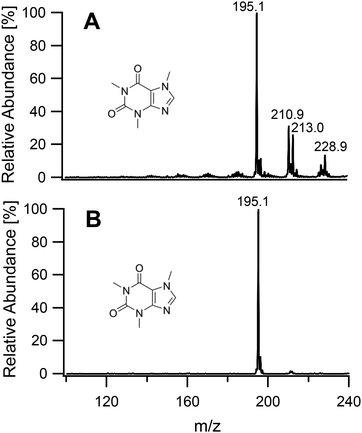 |
| | Fig. 3 Mass spectra of caffeine introduced into the plasma generating region with the sample tube retracted by 25 mm (A), and into the plasma plume with the end of the sample tube aligned flush with the end of the discharge tube (B). | |
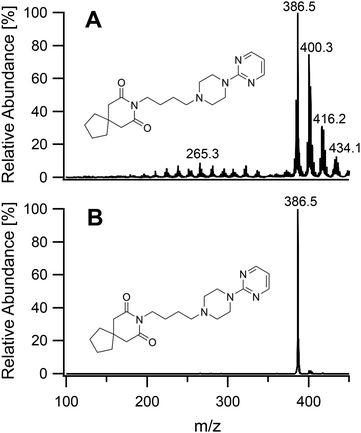 |
| | Fig. 4 Mass spectra of buspirone introduced into the plasma generating region with the sample tube retracted by 25 mm (A), and into the plasma plume with the end of the sample tube aligned flush with the end of the discharge tube (B). | |
Early on, it was hypothesized that the distance of the end of the discharge tube from the inlet of the mass spectrometer would influence the abundance of oxides. The first experiments were thus conducted with the end of the discharge tube placed at 9 mm from the MS inlet (distance x in Fig. 2). When the torch was moved away to 19 mm from the MS inlet, the relative abundance of oxides indeed increased. The adducts of the protonated molecular ions with 16O and 16O2 were found with 8.3% and 2.6% abundance, respectively, in the case of caffeine. On the other hand, it was not possible to further reduce the sampling depth to less than 9 mm due to the bulkiness of the torch body and the microwave input connector. The metallic Faraday shield was also found to reduce the abundance of oxygen-based clusters. Besides its primary RF shielding function, it is thought to help build an argon cloud around the inlet of the mass spectrometer. Thus, better results could presumably be obtained with an inlet kept completely under an inert atmosphere.20,25 The exposure of plasmas to the surrounding atmosphere was also reported to reduce their ionization potential.26,27 However, a further improvement of the shielding was not undertaken. The mass spectrometer available for this project had a concave spray shield which would have made an efficient arrangement difficult to achieve. The final conditions adopted for the soft ionization of molecules are summarized in Table 1.
Table 1 Operating parameters of the MIP torch and ultrasonic nebulizer
| Operating parameters |
Soft (organics) |
Hard (metals) |
Fragmenting (organics) |
| MW power (W) |
50 |
90 |
50 |
| Torch gas flow rate (L min−1) |
1.0 |
0.20 |
0.20 |
| Nebulizer gas flow rate (L min−1) |
1.0 |
0.50 |
0.50 |
| Sample uptake (mL min−1) |
2.0 |
2.0 |
2.0 |
| Tube-inlet distance, X (mm) |
9.0 |
19 |
19 |
| Inner tube position, Y (mm) |
0 |
25 |
0 |
| Inlet capillary temperature (°C) |
80–100 |
140–150 |
90–100 |
Determination of metal ions
In pursuit of our aim to investigate the possibility of developing a universal ion source, metallic inorganic ions were introduced into the plasma. In this case, it was found that the total ion count could be greatly improved by increasing the power to 90 W and reducing the main Ar flow rate. It was set to 0.20 L min−1, which was the lowest rate able to sustain a stable plasma. The plasma source is capable to be operated with higher powers but the inlet of our available mass spectrometer was not designed to withstand highly elevated temperatures. The sample tube could also have suffered from the high plasma temperature, and it was pulled back by 25 mm from the end of the discharge tube (distance y in Fig. 2). This also led to an increased signal intensity. The flow rate of the sample carrier gas through the nebulizer was set to the minimum recommended value of 0.50 L min−1 to adapt the loading to the smaller plasma size. These settings caused a higher gas temperature at the discharge tube exit which led to excess heating of the MS inlet. The distance of the end of the discharge tube from the inlet of the mass spectrometer (distance x) was therefore increased to 19 mm to avoid an uncontrolled heating of the inlet capillary that could have damaged the underlying thermoplastic components. The conditions adopted for the determination of metals are also summarized in Table 1. Four metal salt solutions were analysed at a concentration of 50 μM. The resulting mass spectra are given in Fig. 5. Barium and lead were mainly detected as hydroxides at an m/z of 154.9 and 225.1, respectively, corresponding to the highest abundance isotopes 138Ba(OH)+ and 208Pb(OH)+. Non-fully desolvated species such as Ba(OH)(H2O)+ and Pb(OH)(H2O)+ could also be identified. In the case of barium, an oxide was observed. For silver, cations of the two isotopes 109Ag and 107Ag formed the main signals. Hydrated ions Ag(H2O)+ were present at m/z 124.9 and 126.9. The fourth metal analysed was rubidium. It was detected exclusively as Rb+, with the characteristic isotope pattern for 85Rb and 87Rb. A calibration curve was acquired for lead and is given in Fig. S1.† Seven standards were measured and the coefficient of determination R2 was found to be 0.994 (n = 4). The limit of detection (LOD) (3σ) was determined as 150 nM. One should note that the LOD greatly depends on the mass spectrometer and its settings. Ion trap instruments also suffer from a limited sensitivity at low m/z and lighter metals than the ones chosen as examples were difficult to detect. The dynamic range was also found to be limited by the spectrometer and could be shifted by changing the injection time and modifying the automatic gain control.
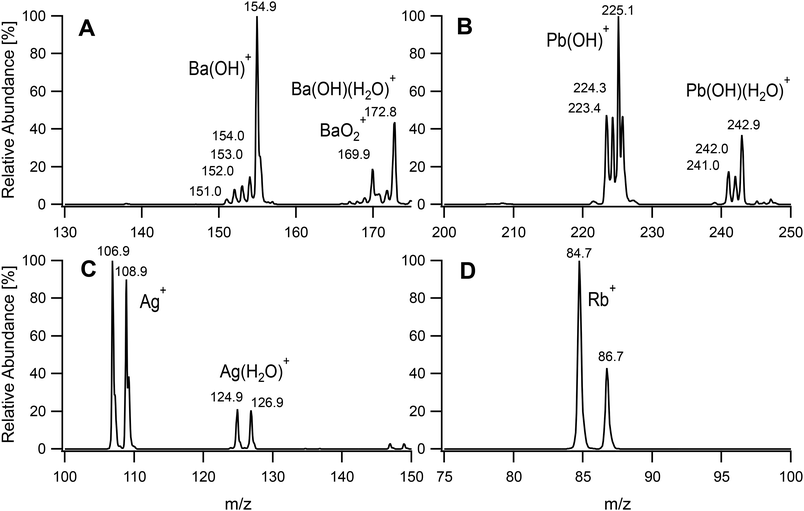 |
| | Fig. 5 Mass spectra of selected metal salt solutions at 50 μM. BaCl2 (A), Pb(NO3)2 (B), AgNO3 (C) and RbCl (D). | |
Fragmentation of organic compounds
On having gained an understanding of the parameters influencing the ionization capabilities of the plasma under soft and hard conditions, the fragmentation of organic compounds was investigated. Plasma conditions for this task were adapted from the ones used for metal analysis. The power was reduced to 50 W. The sample tube was positioned flush to the end of the discharge tube as for the soft ionization settings, to minimize the formation of oxides. For demonstration purposes, caffeine, buspirone, norfloxacin and reserpine were firstly ionized under the soft conditions used above for caffeine and buspirone. The plasma was then switched to fragmenting conditions within a few seconds without extinguishing it. The spectra for the 4 compounds are shown in Fig. 6–9, respectively. As can be seen in Fig. 6, for the small molecule of caffeine, the fragmentation was limited with only very weak signals. However, buspirone (see Fig. 7) showed a number of identifiable known fragments with m/z values of 122.0, 222.2, 251.3 and 265.3,28 while maintaining the protonated molecular ion at 386.5 as the base peak. For norfloxacin, shown in Fig. 8, [M + H]+ at 320.2 was produced by the soft plasma. Fragmentation yielded decarboxylated norfloxacin as the base peak (m/z = 276.3) and other minor fragments. The largest molecule, reserpine, shown in Fig. 9, was detected as [M + H]+ at 609.5 under the soft conditions. An oxide was identified at 625.4 with an abundance of nearly 30%. A fragment corresponding to reserpine was found at m/z 397.4. Other signals could not be clearly assigned to the molecule of interest.
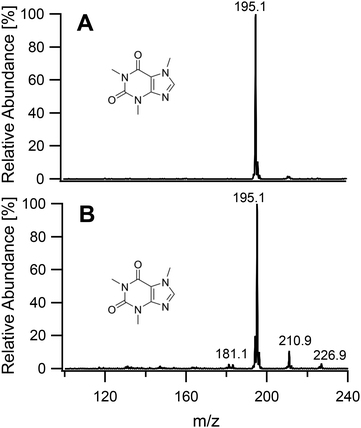 |
| | Fig. 6 Mass spectra of caffeine acquired under soft conditions (A) and under fragmenting conditions (B). | |
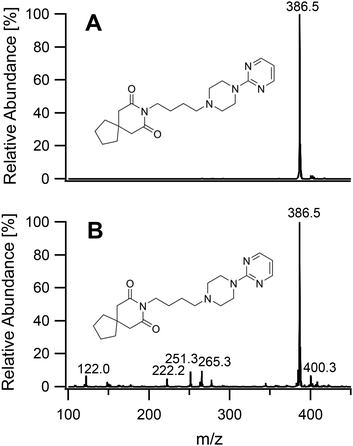 |
| | Fig. 7 Mass spectra of buspirone acquired under soft conditions (A) and under fragmenting conditions (B). | |
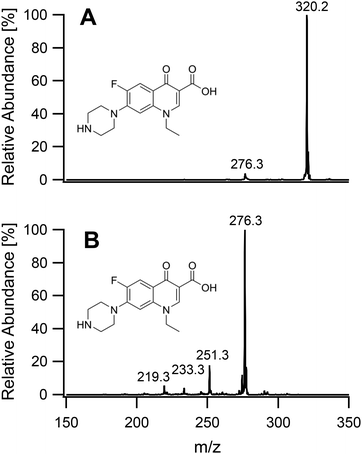 |
| | Fig. 8 Mass spectra of norfloxacin acquired under soft conditions (A) and under fragmenting conditions (B). | |
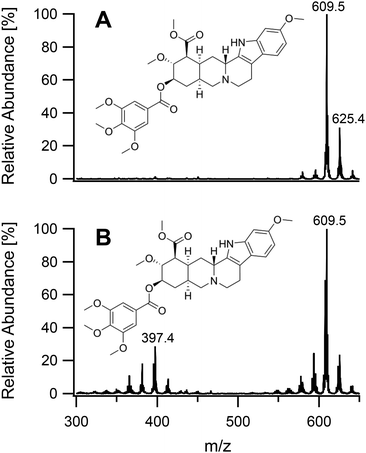 |
| | Fig. 9 Mass spectra of reserpine acquired under soft conditions (A) and under fragmenting conditions (B). | |
Spectroscopic characterization of the plasma
To better understand the characteristics of the plasma under the different conditions used, the plasma was investigated spectroscopically. Spectra with a resolution of 0.10 nm were acquired in an axial position in front of the torch. Because of the hot gas generated by the plasma, the fibre optic cable had to be cooled down by a flow of air to avoid damaging it. The excitation temperature was calculated using the common technique of the Boltzmann plot using five Ar I transitions. Lines at 425.1 and 434.5 nm were not considered for the construction of the Boltzmann plot because of their low signal-to-noise ratio. The excitation temperature Texc as determined from the slope of the regression was 4623 K for the softest and 4832 K for the hardest plasma settings (Fig. S6 and S7†). The R2 coefficients were 0.92 and 0.89, respectively. In the low-resolution spectrum in the range 650–1000 nm (Fig. S3†), aside from the Ar I lines, transitions corresponding to O at 777 nm and Hα at 656.3 nm could be identified. These lines had a stronger intensity for the hard inorganic conditions and could be explained by the large amount of oxides observed when introducing the aerosol in the plasma gas rather than in the plasma plume, as discussed above. The intensity of Hα at 656.3 nm could be explained by the higher ionization potential of the plasma under hard conditions at 90 W. Due to the absence of the N2 system, the strong OH molecular rotational band at 310 nm was selected to determine the rotational temperature. For both the hard and soft conditions, the calculated spectra fit the experimental ones very well (Fig. S4 and S5†). The rotational temperature for the soft conditions was 1222 K, and it was 1747 K for the hard conditions. This difference of more than 500 K could explain the observed ionization behaviour since this is related to the gas temperature and the ionization capabilities. It also supports the temperature difference measured at the mass spectrometer inlet. The rotational temperatures obtained were slightly lower than the one reported for a surfatron viewed radially since the temperature in the discharge tube is expected to be lower.29 One should note that since the light was sampled axially in the middle of the discharge tube, the temperature is an average value along the plasma column. The electron density was determined for the hard plasma settings based on the Stark broadening of the Balmer line Hβ at 486.1 nm. A value of 1.8 × 1014 cm−3 was obtained, which is slightly lower than the reported values of 3–4 × 1014 cm−3 for a radial viewing.30 The electron density was also shown to vary along the plasma column.31
Acquisition of elemental and molecular information
To further investigate the usefulness of the tunability of the plasma ion source a mixture of RbCl and 18-crown-6 was analyzed with the three sets of conditions. This crown-ether is known to complex first group alkali metals with various stability constants.32 Among these, rubidium was chosen due to the low sensitivity of the available spectrometer to low masses, as discussed above, and for its lack of interference from argon. A mixture of RbCl and 18-crown-6 was analysed under the three sets of conditions given in Table 1. As seen in Fig. 10, using a soft plasma, the only detected species was 18-crown-6 with a complexed hydronium ion. The conditions used to fragment organic molecules revealed the presence of complexed rubidium at m/z = 348.9. Free Rb+ and hydrated ligand were also identified. When the plasma was set up for metal analysis, Rb+ was detected as the base peak. 18-Crown-6 could not be observed and is expected to be totally fragmented. Other peaks were related to species with two rubidium atoms as deduced from the isotope pattern.
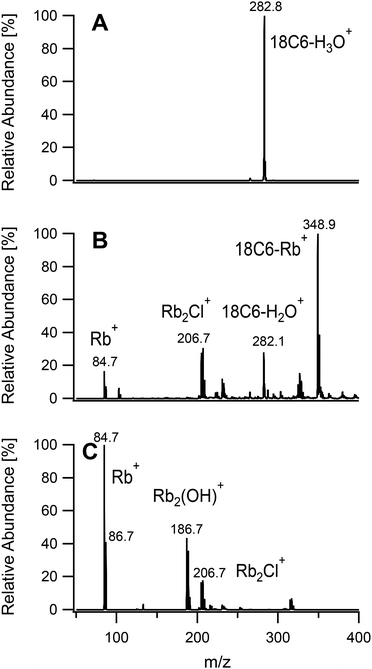 |
| | Fig. 10 Mass spectra of a mixture of 18-crown-6 and RbCl acquired under soft conditions (A), fragmenting conditions (B) and hard conditions (C). | |
Conclusions
Soft ionization of organic compounds as well as the determination of metal ions was demonstrated using the same commercially available microwave plasma torch operated at relatively low power (≤90 W) and low argon gas consumption (≤2 L min−1). This was coupled to an ion trap mass spectrometer usually employed only for the analysis of organic compounds. The introduction of nebulized samples through a tube placed coaxially in the main discharge tube of the plasma torch allowed the use of a broad range of experimental conditions. Modifications of the plasma power and gas flow rate led to a significant change in the identity of the ions detected and organic molecules could be fragmented. Quantitative metal analysis was possible using harsher settings.
The results indicate the possibility of implementing both organic and inorganic analysis on a single mass spectrometer coupled to microwave plasma ion source; however, further study and optimization is required. With the exception of Ag the metals investigated have relatively low ionization energies and the full scope with regard to metal determination is not yet clear. The study in this regard was hampered in that the mass spectrometer which was available is not optimized for the detection of metal ions of low mass. Its inlet is also not suitable for direct exposure to hot plasmas. While the plasma generator employed can be used with powers of up to 200 W it was therefore not possible to employ the full range. For the analysis of trace metals, the mass spectrometer should also have a wide dynamic range. Thus, while the results indicate that a flexible combination mass spectrometer should be possible, they also indicate that such an instrument will have to be newly designed for such a purpose. Compromises may still have to be made as it is deemed that such an instrument cannot match the performance of the highly specialist instruments dedicated to specific tasks.
Author contributions
Marc-Aurèle Boillat: investigation, writing – original draft, formal analysis, visualization, methodology. Peter C. Hauser: conceptualization, supervision, writing – review and editing.
Conflicts of interest
There are no conflicts to declare.
Acknowledgements
The authors thank Grischa Martin and Philipp Knöpfel from the mechanical workshop of the Department of Chemistry of the University of Basel for the modifications of the torch and help with the overall experimental setup.
References
- A. A. Ammann, J. Mass Spectrom., 2007, 42, 419 CrossRef CAS PubMed
 .
.
- S. C. Wilschefski and M. R. Baxter, Clin. Biochem. Rev., 2019, 40, 115 Search PubMed
 .
.
- N. B. Cech and C. G. Enke, Mass Spectrom. Rev., 2001, 20, 362 CrossRef CAS PubMed
 .
.
- G. Famiglini, P. Palma, V. Termopoli and A. Cappiello, Anal. Chim. Acta, 2021, 1167, 338350 CrossRef CAS PubMed
 .
.
-
J. H. Gross, Mass Spectrometry, A Textbook, Springer, 2 edn, 2011 Search PubMed
 .
.
- D. A. Rogers, S. J. Ray and G. M. Hieftje, Metallomics, 2009, 1, 67 CrossRef CAS
 .
.
- Q. A. Yu, L. F. Li, W. Hang, J. A. He and B. L. Huang, Anal. Chem., 2011, 83, 2403 CrossRef CAS PubMed
 .
.
- T. P. Forbes and E. Sisco, Anal. Chem., 2014, 86, 7788 CrossRef CAS PubMed
 .
.
-
K. J. Jankowski and E. Reszke, Microwave Induced Plasma Analytical Spectrometry, The Royal Society of Chemistry, 2010 Search PubMed
 .
.
- Q. Jin, Y. Duan and J. A. Olivares, Spectrochim. Acta, Part B, 1997, 52, 131 CrossRef
 .
.
- C. I. M. Beenakker, Spectrochim. Acta, Part B, 1976, 31, 483 CrossRef
 .
.
- M. Moisan, C. Beaudry and P. Leprince, IEEE Trans. Plasma Sci., 1975, 3, 55 Search PubMed
 .
.
- M. Selby and G. M. Hieftje, Spectrochim. Acta, Part B, 1987, 42, 285 CrossRef
 .
.
- D. J. Douglas and J. B. French, Anal. Chem., 1981, 53, 37 CrossRef CAS
 .
.
- E. Poussel, J. M. Mermet, D. Deruaz and C. Beaugrand, Anal. Chem., 1988, 60, 923 CrossRef CAS
 .
.
- L. K. Olson, W. C. Story, J. T. Creed, W.-L. Shen and J. A. Caruso, J. Anal. At. Spectrom., 1990, 5, 471 RSC
 .
.
- W. L. Shen and R. D. Satzger, Anal. Chem., 1991, 63, 1960 CrossRef CAS
 .
.
- N. P. Vela, J. A. Caruso and R. D. Satzger, Appl. Spectrosc., 1997, 51, 1500 CrossRef CAS
 .
.
- A. M. Zapata and A. Robbat, Anal. Chem., 2000, 72, 3102 CrossRef CAS PubMed
 .
.
- K. M. Evans-Nguyen, J. Gerling, H. Brown, M. Miranda, A. Windom and J. Speer, Analyst, 2016, 141, 3811 RSC
 .
.
-
B. M. Smirnov, Fundamentals of Ionized Gases, Wiley-VCH, 2012 Search PubMed
 .
.
- J. Cotrino, M. Saez, M. C. Quintero, A. Menendez, E. S. Uria and A. S. Medel, Spectrochim. Acta, Part B, 1992, 47, 425 CrossRef
 .
.
- J. Jarosz, J. M. Mermet and J. P. Robin, Spectrochim. Acta, Part B, 1978, 33, 55 CrossRef
 .
.
- S. G. Belostotskiy, T. Ouk, V. M. Donnelly, D. J. Economou and N. Sadeghi, J. Appl. Phys., 2010, 107, 053305 CrossRef
 .
.
- R. K. Marcus, E. H. Evans and J. A. Caruso, J. Anal. At. Spectrom., 2000, 15, 1 RSC
 .
.
- L. K. Olson and J. A. Caruso, Spectrochim. Acta, Part B, 1994, 49, 7 CrossRef
 .
.
- B. W. Pack, J. A. C. Broekaert, J. P. Guzowski, J. Poehlman and G. M. Hieftje, Anal. Chem., 1998, 70, 3957 CrossRef CAS PubMed
 .
.
- P. Joshi, S. Rao, M. Singh, N. Vig, A. K. Singh, N. S. Rajawat and A. Gupta, Anal. Methods, 2013, 5, 7014 RSC
 .
.
- L. Potočňáková, J. Hnilica and V. Kudrle, Open Chem., 2015, 13, 541 Search PubMed
 .
.
- A. Besner, M. Moisan and J. Hubert, J. Anal. At. Spectrom., 1988, 3, 863 RSC
 .
.
- M. D. Calzada, M. Moisan, A. Gamero and A. Sola, J. Appl. Phys., 1996, 80, 46 CrossRef CAS
 .
.
- K. Ohtsu and K. Ozutsumi, J. Inclusion Phenom. Macrocyclic Chem., 2003, 45, 217 CrossRef CAS
 .
.
|
| This journal is © The Royal Society of Chemistry 2024 |
Click here to see how this site uses Cookies. View our privacy policy here.  Open Access Article
 *
*


.
.
.
.
.
.
.
.
.
.
.
.
.
.
.
.
.
.
.
.
.
.
.
.
.
.
.
.
.
.
.
.


