Engineering a hollow bowl-like porous carbon-confined Ru–MgO hetero-structured nanopair as a high-performance catalyst for ammonia borane hydrolysis†
Jialei
Yang‡
a,
Zhenyu
Yang‡
b,
Jiafu
Li
a,
Hao
Gang
a,
Donghai
Mei
 c,
Dongming
Yin
d,
Ruiping
Deng
d,
Yifeng
Zhu
e,
Xingyun
Li
 *a,
Ning
Wang
*a,
Sameh M.
Osman
*a,
Ning
Wang
*a,
Sameh M.
Osman
 f and
Yusuke
Yamauchi
 ghi
ghi
aInstitute of Materials for Energy and Environment, College of Materials Science and Engineering, College of Chemistry and Chemical Engineering, Qingdao University, Qingdao 266071, China. E-mail: xingyun_2008@sina.cn; wangning2021@qdu.edu.cn
bCollege of Electronics and Information, Qingdao University, Qingdao 266071, China
cTianjin Key Laboratory of Green Chemical Engineering Process Engineering, Tiangong University, Tianjin 300387, China
dState Key Laboratory of Rare Earth Resources Utilization, Changchun Institute of Applied Chemistry, Chinese Academy of Sciences, Changchun 130022, China
eShanghai Key Laboratory of Molecular Catalysis and Innovative Materials, Fudan University, Shanghai 200433, China
fChemistry Department, College of Science, King Saud University, P. O. Box 2455, Riyadh 11451, Saudi Arabia
gDepartment of Materials Process Engineering, Graduate School of Engineering, Nagoya University, 464-8603 Nagoya, Japan
hDepartment of Chemical and Biomolecular Engineering, Yonsei University, 50 Yonsei-ro, Seodaemun-gu, Seoul 03722, South Korea
iAustralian Institute for Bioengineering and Nanotechnology (AIBN), The University of Queensland, Brisbane, QLD 4072, Australia
First published on 30th January 2024
Abstract
Exploration of high-performance catalysts holds great importance for on-demand H2 production from ammonia borane (AB) hydrolysis. In this work, a hollow bowl-like porous carbon-anchored Ru–MgO hetero-structured nano-pair with high-intensity interfaces is made, using a tailored design approach. Consequently, the optimized catalyst shows AB hydrolysis activity with a turnover frequency value of 784 min−1 in aqueous media and 1971 min−1 in alkaline solvent. Robust durability is also achieved, with slight deactivation after a ten-cycle test. Combined experimental and theoretical calculations validate the positive function of the interface between Ru and MgO for facilitating H transfer and boosting water activation, thus leading to improved AB hydrolysis performance. This study could be valuable in guiding the upgradation of Ru catalytic systems, to advance their practical applications.
New conceptsAmmonia borane (AB) with high hydrogen density and convenient transportability is a promising chemical for on-demand H2 production via the hydrolysis process. Development of an efficient catalyst is pivotal to addressing the sluggish kinetics of AB hydrolysis. Traditional catalysts still face the challenge of poor intrinsic activity. Herein, a novel sub-nano interfacial catalytic structure is engineered by tailor-designing a hollow bowl-like porous carbon confined Ru–MgO hetero-structured nanopair as a high-performance catalyst for AB hydrolysis. The new conceptual insights include: (1) ultra-small Ru clusters were preferentially grasped and dispersed on the junction of carbon and MgO quantum dots (QDs); (2) an intensified interfacial confinement was built between Ru and MgO nanoparticles to exert enhanced electronic modulation of the Ru catalyst; (3) the MgO QDs played an important role in facilitating H atom transfer, leading to lowering of the H2O activation barrier; and (4) the hollow bowl-like porous carbon material provided a robust framework to stabilize the Ru–MgO nano-pairs, thus ensuring stable catalytic performance. Excellent activity, with an AB turnover frequency of 1971 min−1 was achieved along with remarkable durability. This study provides a general material platform to modulate a wide range of metal catalysts (such as Pt, Pd, etc.) to boost H2 generation from AB hydrolysis. |
Introduction
The development of renewable and clean energy has become an essential task to deal with the problems of energy crisis and environmental pollution.1,2 Hydrogen (H2), possessing high energy density (142 kJ g−1) and the property of non-carbon emission, has been recognized as a promising source of green energy.3–5 Reliable hydrogen production is imperative to lay the basis for a potential hydrogen future. Environmentally benign ammonia borane (NH3BH3, AB), with superior features of high hydrogen content (19.6 wt%), convenient transportability, and excellent stability under ambient conditions, appears to be a decent hydrogen storage chemical hydride.6–8 The hydrolysis reaction (NH3BH3 + 2H2O → NH4+ + BO2− + 3H2↑) can efficiently release high-purity H2 from AB at room temperature, but relies on the assistance of a catalyst to lower the reactant activation energy and guarantee a fast kinetic process.9,10Among the catalysts developed, noble metal nanoparticles (such as Pt and Rh) have proven to be the most active candidates.11–14 Nevertheless, surging prices and growing resource depletion have seriously constrained their widespread application.15,16 As an alternative, the Ru catalyst attracts tremendous attention owing to its moderate price and competitive catalytic performance.17–19 However, improvement of the intrinsic activity and stability, as well as cost reduction, are still critical tasks for advancing the practical application of Ru catalysts in AB hydrolysis. To this end, engineering an optimal catalyst support to disperse the Ru catalyst on a (sub-) nano, or even single-atom, scale provides an effective way to facilitate active-site exposure and build interfacial confinement, ensuring a “less is more” efficacy. Metal oxides, such as TiO2,20,21 CeO2,22 Co3O4,23etc., having abundant surface defects and strong electronic interaction with metal catalysts, have been proven to be excellent catalyst supports. Zhang et al. have reported a defective structured and morphologically engineered Co3O4-supported Ru catalyst for high-performance AB hydrolysis.23 Its enhanced activity can be attributed to the strengthened metal–support interaction. Shen et al. have used TiO2 with rich oxygen vacancies (Ov) as a support to fabricate small Ru nanoparticles, affording a high turnover frequency (TOF) value of 1350 min−1 under alkaline conditions.24 The defective structure has been proved to be not only important for electronic confinement of the Ru catalyst, but also vital for enhancing cleavage of the O–H bond in water, which is deemed to be the rate-determining step in AB hydrolysis.6,24,25 Therefore, the defect-implanted metal oxide can act as an “active support” to participate positively in the reaction. To upgrade the catalytic function, study of the size effect of the metal oxide is of great scientific significance, but is rarely discussed. There is a strong incentive to tailor ultrafine metal oxides to maximize the surface defect exposure and to form high-density interfaces with the metal catalyst. Nevertheless, the sub-nano-sized particles possess a high surface energy, and tend to agglomerate in the reaction atmosphere. To address this challenge, a tempting tactic relies on highly porous materials, such as MOFs,26,27 zeolites,25 and porous carbons,28,29 to bind the small granules. Therefore, precise design of confined metal oxide nanoparticles can blaze a promising trail to elevate the catalytic performance of Ru catalysts in AB hydrolysis.
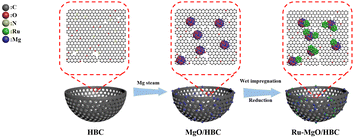
Herein, novel hollow bowl-like porous carbon (HBC) confined MgO quantum dots (QDs) (with a size of ∼2 nm) are facilely constructed and serve as an advanced catalyst support (Scheme 1 and Fig. 1). The resulting HBC with high surface area can provide a porous framework for MgO dispersion and serve as an effective nanoreactor to facilitate mass transfer. Meanwhile, ultra-small Ru nanocatalysts can be preferentially anchored at the interfaces of the MgO QDs and HBC, leading to enhanced high-density interfacial electronic confinement. Systematic characterization as well as theoretical calculations are carried out to unveil the reaction mechanism and establish the structure–function relationship. This study shows an important paradigm for upgrading the Ru catalyst by engineering the carbon–metal oxide composite as a multi-functional catalyst support, which will guide further development of high-performance catalytic systems for the AB hydrolysis reaction.
Results and discussion
A hard template method was used to prepare HBC possessing a hollow bowl-like morphology with a diameter of 200–300 nm, which was proved by TEM and SEM characterizations, as shown in Fig. S1 (ESI†). The specific surface area for the HBC was determined to be 678.6 m2 g−1 (Table S1, ESI†) and the mean pore size, calculated by the NL-DFT method, is centered at 4.5 nm (Fig. 2(a)), indicating a mesoporous structure, which can provide the benefit of a porous nanoreactor to promote the mass transfer for AB hydrolysis reaction. XPS analysis demonstrates that there are abundant N atoms incorporated on the surface of the HBC, with an N amount of 2.40 at% (Fig. S2, ESI†), which can be further proved by the uniform distribution of N atoms over the whole framework, as shown by the SEM–EDS elemental mapping analysis in Fig. S3 (ESI†).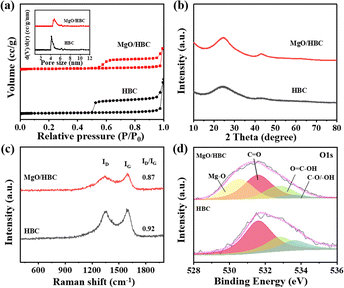 | ||
| Fig. 2 (a) N2 adsorption–desorption isotherms (inset is NL-DFT pore size distribution), (b) XRD patterns, (c) Raman spectra and (d) deconvolution of O 1s XPS spectra for HBC and MgO/HBC. | ||
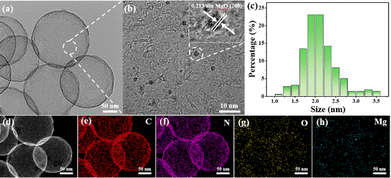
Mg species were subsequently loaded to the surface of the HBC using chemical vapor deposition to prepare MgO/HBC, using the process depicted in Scheme 1. The TEM characterization is shown in Fig. 1(b). Plenty of sesame-like particles are evenly dispersed on the HBC to give the MgO/HBC sample. The HRTEM image in Fig. 1(b) clearly shows the presence of ultra-small particles, and the measured crystal plane spacing is 0.213 nm (inset in Fig. 1(b)), which agrees with the (200) crystal plane of MgO. This suggests that the Mg atoms could bind the O atoms of HBC to exist in the form of MgO. By statistically calculating 200 MgO particles, it is found that the mean size of the MgO is around 2.0 nm. The STEM image and corresponding EDS elemental mapping analysis in Fig. 1(d)–(h) further prove the homogeneous dispersion of MgO quantum dots on the surface of HBC. Interestingly, the N 1s XPS spectrum of MgO/HBC (Fig. S4, ESI†) shows that the N atom is removed. This suggests that the N-doped carbon surface can offer plenty of defect sites for anchoring of MgO particles.
As depicted in Fig. 2(a), the isotherm for MgO/HBC is similar to that of HBC. Both the samples possess mesopores.30,31 However, the mean pore size for MgO/HBC is shifted to 4.95 nm, which is larger than that of HBC. This may be due to the filling of smaller pores by the introduction of MgO, which can explain the lower specific surface area of MgO/HBC (377.9 m2 g−1). The XRD data in Fig. 2(b) show a higher intensity of the carbon peak at 23.8° for MgO/HBC compared to HBC. This indicates that incorporation of MgO increases graphitization of the carbon. Meanwhile, negligible MgO crystal peaks are detected in the XRD pattern for MgO/HBC, which may be due to the ultra-small nanoparticles of MgO. In comparison, commercially available bulk MgO, with a low specific surface area of 20.4 m2 g−1 (Fig. S5, ESI†), is also used as a support for the Ru catalyst. It exhibits distinct XRD peaks at 38.49° and 44.13°, corresponding to the Ru nanoparticles (Fig. S6, ESI†), indicating that the deposited Ru on the bulk MgO has much larger particles than that deposited on the porous MgO/HBC.
Raman spectra in Fig. 2(c) show two typical peaks for the D band at 1338 cm−1, representing the defective carbon, and the G band at 1589 cm−1, which corresponds to the graphitized carbon.30 The higher ID/IG ratio for MgO/HBC further proves the increased graphitization of HBC aided by MgO, which is in line with the XRD data (Fig. 2(a)). As shown in Fig. S7 (ESI†), obvious EPR signals at g = 2.003 prove the existence of oxygen vacancies (Ov).32 There is a significantly higher Ov density for MgO/HBC than for HBC and MgO, which adequately verifies the important Ov-rich features of the MgO/HBC composite. To dig into the origin of the Ov, MgO/HBC was further treated with hydrochloric acid solution (2 M) to remove the MgO quantum dots. The MgO/HBC-etching product obtained shows a similar EPR peak at g of 2.003 compared to that of MgO/HBC, verifying that the Ov in MgO/HBC are mainly derived from HBC. This could be explained by O on HBC being captured by the Mg atom during the preparation procedure, which may lead to O deficiency for the HBC. The O atoms on HBC may serve as a binding site to stabilize and disperse the Mg stream in the form of MgO quantum dots, even at a preparation temperature of 1000 °C. XPS analysis suggests that 2.67 at% of Mg atom is present on the surface of MgO/HBC. By deconvolution of the O 1s XPS spectrum, a peak at 530.5 eV can be detected, which is in accordance with the Mg–O structure, proving that Mg is chemically bonded with an O atom.33
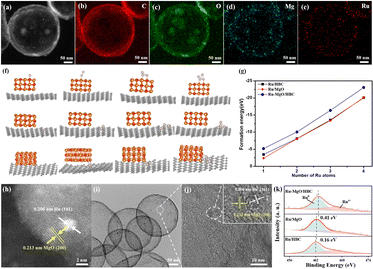
A wet impregnation method was applied to carry the Ru catalyst on the support. The actual content of Ru was calculated to be 2.2 wt% by ICP characterization (Table S2, ESI†). XRD characterization in Fig. S8 (ESI†) shows no peak of Ru on Ru/HBC and Ru–MgO/HBC, which indicates that the Ru is well dispersed in the material. From the STEM image and corresponding EDS elemental mapping analysis in Fig. 3(a)–(e), it is found that Ru follows a similar distribution to that of the Mg atom. To shed light on the preferential location site of the Ru catalyst, DFT calculations were carried out by evaluating the formation energy for Ru (with different sizes) at different sites of MgO/HBC. From the results shown in Fig. 3(f) and (g), the interface of HBC and MgO is determined to be the optimal site for stabilization of Ru catalyst. This suggests that Ru exists adjacent to, rather than on top of, the MgO quantum dot. Direct contact of Ru with MgO to form the Ru–MgO hetero-structured nano-pair was further verified by HR-STEM analysis (Fig. 3(h)), which shows two adjacent crystals with lattice spacings of 0.213 nm and 0.206 nm, corresponding to the (200) crystal plane of MgO and the (101) crystal plane of Ru, respectively. The Ru nanoparticles in MgO/HBC are calculated to be around 1.7 nm (Fig. 3(i) and (j)), which is smaller than the Ru nano-particles (∼3.6 nm) dispersed on HBC (Fig. S9, ESI†) and Ru nano-particles (∼5.5 nm) on commercial MgO (Fig. S10, ESI†). This is sufficient to highlight the importance of the defective interface between HBC and MgO quantum dots for promotion of Ru catalyst dispersion aided by the interfacial confinement. As depicted in Fig. 3(k), the Ru 3p spectrum contains two peaks, at 463.1 eV and 485.1 eV, corresponding to Ru 3p3/2 and Ru 3p1/2, respectively.34 The Ru 3p3/2 XPS peak can be further deconvoluted into peaks at 462.4 and 465.0 eV, attributed to metallic Ru and oxidized Rux+ species, respectively. The content of Rux+ accounts for 40.7% of Ru–MgO/HBC, which is higher than that of Ru/MgO (36.7%) and Ru/HBC (22.5%). It is interesting to note that the main Ru 3p3/2 XPS peak for Ru/MgO is shifted to a higher binding value compared to that of Ru/HBC, suggesting that electrons are transferred from Ru to MgO. Notably, the Ru 3p3/2 XPS peak shift is enhanced for Ru–MgO/HBC, which results in an electron-deficient state for the Ru catalyst. On the one hand this could be due to the intensified interfacial electronic interaction between the small Ru nanoparticle and the MgO quantum dots, and on the other hand to electron transfer facilitated by the carbon substrate.35
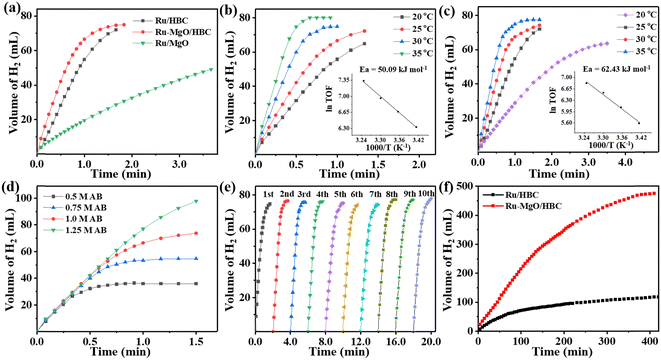
The control experiment using HBC and MgO/HBC as the catalyst for AB hydrolysis was carried out first, which showed negligible H2 production (Fig. S11, ESI†). When Ru/HBC was applied as a catalyst, 73 mL of H2 could be generated within 1.5 min at 298 K, giving a TOF value of 439 min−1 (Fig. 4(a)). According to gas chromatographic analysis and 1H NMR and 11B NMR measurements, gaseous H2, NH4+, and BO2− in solution are the final products of the AB hydrolysis (Fig. S12 and S13, ESI†). With the introduction of MgO on the HBC support, the TOF value of Ru–MgO/HBC increases markedly, from 439 min−1 to 784 min−1, indicating the activity-promoting function of the MgO quantum dots. To obtain the optimal amount of Ru loading, catalysts with different Ru loadings were evaluated, demonstrating that 2 wt% Ru–MgO/HBC catalyst is the most active (Fig. S14, ESI†). For comparison, commercial MgO was also adapted as a support. However, Ru/MgO delivers poor activity with a lower TOF value of 173 min−1. This may be due to the low specific surface area of MgO and the larger Ru particles. The significance of the porous HBC support in promoting dispersion of MgO nanoparticles is underlined, which further helps in binding of ultra-small Ru clusters to form the Ru–MgO nano-pair. Meanwhile, the hollow bowl-like mesoporous structure could serve as an advanced nanoreactor to facilitate mass transfer and kinetic processes compared to the bulk MgO support, thus enhancing the catalytic activity for ammonia borane hydrolysis. The Ov structure in metal oxides as catalyst support has been reported to help activation of H2O.24 However, the Ov is shown to be derived from HBC rather than from MgO in the MgO/HBC composite, and so may play a different role in tuning of AB hydrolysis. To determine the function of the Ov, MgO/HBC was treated in air at 250 °C for 3 h to purposely annihilate the Ov, as indicated by the EPR characterization in Fig. S15a (ESI†). The corresponding Ru–MgO/HBC-Air showed a very slight deterioration in activity for AB hydrolysis compared to Ru–MgO/HBC (Fig. S15b, ESI†). This suggests that the presence of Ov in HBC may not be the main reason for the promotion of the activity.
As shown in Fig. 4(b) and (c), the hydrogen generation rate is positively related to the reaction temperature. With a rise in temperature to 308 K, a high TOF value of 1544 min−1 is reached for the Ru–MgO/HBC catalyst. According to the Arrhenius plot, the apparent activation energy (Ea) is calculated as 50.09 kJ mol−1 (Fig. 4(b)), while the Ru/HBC catalyst gives a higher Ea value of 62.43 kJ mol−1 (Fig. 4(c)). The lower Ea value for the Ru–MgO/HBC catalyst indicates that the synergetic effect between Ru and MgO could accelerate the rate-determining step, thus enhancing the catalytic activity. The influence of AB concentration on the catalytic activity was also studied for Ru–MgO/HBC (Fig. 4(d)). With increase in AB concentration, from 0.5 to 1.25 M, the hydrogen generation rate for AB hydrolysis catalyzed by Ru–MgO/HBC remains unchanged, indicating a kinetic order of zero for the AB concentration.
Catalytic stability is also critical for assessing the catalyst performance. In the cycling stability test, Ru–MgO/HBC was regenerated without any treatment, and the catalyst maintains excellent catalytic activity (Fig. 4(e)). After ten cycles, the catalytic activity for ammonia borane hydrolysis remains at a high TOF value of 705 min−1, which is similar to the fresh TOF value of 784 min−1. The minor decrease in catalytic activity might be attributed to residual NH4+ and BO2− covering the catalyst surface. XRD patterns and TEM images show that the size of the Ru nanoparticles and the structure of the support remain unchanged, further indicating the superior robustness of the catalyst (Fig. S16 and S17, ESI†). To prove the stability of MgO quantum dots on HBC during the reaction, MgO/HBC was treated with AB solution. The recycled MgO/HBC shows a similar XRD pattern and TEM images to those of fresh samples, as shown in Fig. S18 and S19 (ESI†). This demonstrates that MgO nanoparticles are stabilized on the carbon surface without hydrolysis, which could be attributed to interfacial confinement of the HBC support. The long-term performance in Fig. 4(f) also demonstrates that Ru–MgO/HBC outperforms Ru/HBC. A total 474 mL of H2 can be generated over the Ru–MgO/HBC catalyst within 400 min, affording a high TON value of 19![[thin space (1/6-em)]](https://www.rsc.org/images/entities/char_2009.gif) 540, which is among the highest TON values reported for heterogeneous Ru-based catalysts. To verify the purity of the gaseous product for AB hydrolysis over Ru–MgO/HBC catalyst, the product was examined using gas chromatography. As shown in Fig. S20 (ESI†), H2 is the sole product in the released gas, with little N2 or O2 detected from air in the reactor. Therefore, the mesoporous HBC could effectively stabilize the supported metal nanoparticles during the reaction, and the synergistic effect between MgO and Ru further enhances the long-acting activity.
540, which is among the highest TON values reported for heterogeneous Ru-based catalysts. To verify the purity of the gaseous product for AB hydrolysis over Ru–MgO/HBC catalyst, the product was examined using gas chromatography. As shown in Fig. S20 (ESI†), H2 is the sole product in the released gas, with little N2 or O2 detected from air in the reactor. Therefore, the mesoporous HBC could effectively stabilize the supported metal nanoparticles during the reaction, and the synergistic effect between MgO and Ru further enhances the long-acting activity.
To further investigate the synergistic effect of the Ru–MgO system, isotope experiments using D2O instead of H2O as the solvent were also performed. As shown in Fig. 5(a) and (b), the catalytic activity decreases sharply using D2O, due to the higher binding energy of the O–D bond. The kinetic isotope effect (KIE) values were calculated at higher than 2.0 for both Ru–MgO/HBC and Ru/HBC catalysts, which indicates that the O–H bond breaking of water is the rate-determining step. Moreover, the KIE value of the Ru–MgO/HBC catalyst (2.24) is lower than that of the Ru/HBC catalyst (2.72). These results indicate that the synergistic effect between MgO and Ru can significantly contribute to the activation of water molecules, thus improving the hydrogen generation rate for AB hydrolysis.
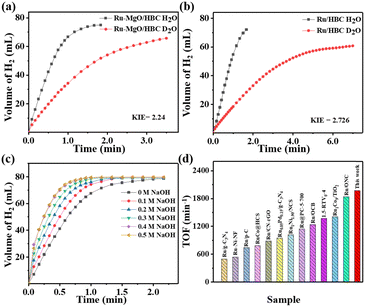 | ||
| Fig. 5 Kinetic isotope measurements and catalytic activity of H2 generation from AB hydrolysis over (a) Ru–MgO/HBC and (b) Ru/HBC. (c) Time dependence of H2 evolution from NH3BH3 over Ru–MgO/HBC at various NaOH concentrations. (d) Catalytic performance of various catalysts in alkaline solvent, as reported in the literature.35–44 | ||
To explore the effect of OH− on hydrogen production from AB hydrolysis catalyzed by Ru–MgO/HBC, controlled experiments were performed at different concentrations of NaOH solution (Fig. 5(c)). As expected, catalytic activity is promoted as the NaOH concentration increases. When the NaOH concentration is 0.4 M, an extremely high TOF value of 1971 min−1 is obtained over the Ru–MgO/HBC catalyst, which is far higher than for most state-of-the-art catalysts, as shown in Fig. 5(d) and Fig. S21 (ESI†).36–45 This large activity enhancement of Ru–MgO/HBC may result from the effect of good coordination of OH− with the active metal component, establishing an electron-deficient surface for reactant activation.46,47 Meanwhile, OH− also plays an auxiliary role in lowering the dehydrogenation energy barrier of the B–distal and B–N bond.48,49 As the NaOH concentration increases to 0.5 M, further enhancement of the hydrogen release rate is not observed. Thus, the optimal NaOH concentration is set at 0.4 M. According to 1H NMR and 11B NMR measurements, gaseous H2, NH4+, and BO2− in solution are the final products of the AB hydrolysis (Fig. S22 and S23, ESI†), with the chemical shift of BO2− shifting to 7.4 ppm due to the higher pH.50,51 To verify the purity of H2, the released gas was tested using mass spectrometry, which demonstrated that pure H2 without any NH3 is produced in the alkaline environment, as shown in Fig. S24 (ESI†).
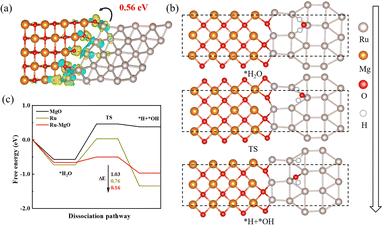
To comprehensively explain the differences between Ru/HBC and Ru–MgO/HBC in the hydrolysis of AB, DFT calculations were performed. The heterojunction model of MgO (200) and Ru (101) was constructed, as the model viewed from different directions in Fig. S25 (ESI†). To further confirm the stability of the Ru–MgO heterostructure, ab initio molecular dynamics (AIMD) was investigated. As shown in Fig. S26 (ESI†), the energy and temperature oscillate slightly. This indicates that there is no significant structure distortion, verifying that the heterojunction maintains a high stability. By calculating the charge density of the junction between Ru and MgO, it could be determined that the charge of Ru at the interface will be transferred to the O of MgO by about 0.56 electrons, as shown by the charge density differences in Fig. 6(a). In Fig. S27 (ESI†), the d-band center of Ru was calculated, showing a negative shift for the Ru–MgO heterostructure compared to that of pure Ru. This further proves that electrons transfer from Ru to MgO, resulting in an electron-rich MgO surface. Considering that H2O dissociation was reported to restrict the whole ammonia borane hydrolysis process,25,52 subsequently, the H2O adsorption intermediates and transition state over Ru–MgO, Ru, and MgO were evaluated (Fig. 6(b) and Fig. S28, ESI†). The H2O molecule is first adsorbed onto the Ru site at the interface of Ru–MgO with lowered adsorption energy compared to MgO. Then, an interesting H transfer from Ru to the adjacent O site in MgO is evidenced, which is facilitated by formation of the O–H⋯O hydrogen bond. This phenomenon can play a vital role in benefiting the splitting of *H and *OH, thus facilitating H2 formation. As the adsorption potential energy diagrams shown in Fig. 6(c), the transient (TS) adsorption is the rate-determining step. The TS energy barrier is calculated to be only 0.16 eV for Ru–MgO, which is far lower than that of Ru (0.76 eV) and MgO (1.03 eV). This result sufficiently proves the synergistic function of the interface between Ru and MgO for enhancing the dissociation of H2O.
Conclusions
In conclusion, a novel MgO quantum dot on a hollow bowl-like porous carbon system is first designed using a tailored approach, to boost the catalytic performance of the Ru catalyst for AB hydrolysis. High-density geometric and electronic confinement is built successfully for the Ru catalyst, resulting in an ultra-dispersed Ru–MgO hetero-structured nano-pair. The intrinsic activity improvement is principally driven by lowering of the H2O activation energy, facilitated by H transfer from Ru to the adjacent MgO at the maximized interface. Meanwhile, the mesoporous bowl carbon is vital to afford a robust framework to anchor the Ru–MgO composite and offer a nanoreactor to facilitate mass transfer. Consequently, Ru–MgO/HBC exhibits a remarkable H2 production activity, with a TOF value of 1971 min−1 in alkaline solvent, as well as remarkable cycling durability. This study offers a general paradigm for fine regulation of many kinds of metal catalyst (such as Pt, Rh, Pd, etc.) structures to further advance H2 generation from the AB hydrolysis reaction.Experimental
Materials
Ethanol, ammonia water, tetraethyl orthosilicate, resorcinol, formaldehyde, hydrofluoric acid, ammonia borane, magnesium oxide, and magnesium powder were supplied by Sinopharm Chemical Reagent Co., Ltd (Shanghai, China). Ruthenium chloride hydrate was purchased from Sigma-Aldrich (Shanghai, China). All reagents used in this study are analytical grade.Preparation of HBC
According to our previous method,53 a modified method was applied to prepare HBC. Specifically, 140 mL of ethanol, 20 mL of deionized (DI) water, 6 mL of ammonia, and 7 mL of tetraethyl orthosilicate were mixed and stirred at room temperature for 30 min, followed by addition of 0.8 g resorcinol and 1.12 mL formaldehyde. After stirring for 24 h, RF@SiO2 was produced by centrifugation. Then, the precursor was calcined in a N2 atmosphere at 800 °C for 2 h to obtain C@SiO2. Finally, SiO2 was washed away with 20 wt% hydrofluoric acid solution to produce HBC.Preparation of MgO/HBC
100 mg of HBC was added downstream of the furnace, while 1.0 g of magnesium powder was placed upstream of the furnace. An Ar atmosphere (50 mL min−1) was introduced at a temperature of 1000 °C to bring Mg species onto the surface of HBC. After cooling to room temperature, MgO/HBC was produced. MgO/HBC was further treated with a hydrochloric acid solution (2 M) to remove the MgO quantum dots to produce MgO/HBC-etching. To annihilate the Ov, MgO/HBC was treated at 250 °C in an air atmosphere for 3 h to obtain MgO/HBC-Air.Preparation of supported Ru catalyst
The incipient wetness impregnation method was applied to load 2 wt% Ru on the support of MgO/HBC, MgO, HBC, and MgO/HBC-Air separately, which was followed by reduction with 10% H2/Ar atmosphere at 500 °C for 2 h to obtain the final Ru–MgO/HBC, Ru/MgO, Ru/HBC, and Ru–MgO/HBC-Air catalyst.Catalyst characterization
The surface topography and EDS mapping images of the samples were obtained on a Nippon Electron JSM-7800F field-emission scanning electron microscope (SEM). Transmission electron microscope (TEM) images were acquired on a JEOL JEM-2100. The HRTEM (JEOL-2011) was operated at an accelerating voltage of 200 kV. The high-angle annular dark-field scanning transmission electron microscopy (HAADF-STEM) and corresponding energy dispersive spectroscopy (EDS) mapping analyses were executed on a JEOL JEMARF200F TEM/STEM with a spherical aberration corrector. N2 adsorption–desorption was carried out using a Quantachrome Autosorb iQ3. Powder X-ray diffraction (XRD) patterns were recorded on a Rigaku Ultima IV with CuKα radiation (λ = 0.15418). Raman characterization was performed on a Raman spectrometer (Renishaw inVia) with a laser wavelength (λ) of 532 nm. The specific surface area was calculated using the Brunauer–Emmett–Teller (BET) method and the pore size distribution was estimated with the non-localized density functional theory (NL-DFT) method. Electron paramagnetic resonance (EPR) was tested using an FA-200 (JES) electron paramagnetic resonance spectrometer. Inductively coupled plasma (ICP) spectra were obtained using an Agilent ICP-OES/730 spectrometer. X-ray photoelectron spectroscopy (XPS) was performed using a Thermo Fisher ESCALAB 250Xi spectrometer with an AlKα X-ray source (1486.6 eV). Mass spectrometry was carried out with a Hiden HPR-20 EGA.Catalytic performance evaluation
In a typical procedure, 25.5 mg of catalyst was added into 0.5 mL H2O in a two-neck flask. The mixture was evenly dispersed by ultrasonic treatment for 1 minute. Then, 0.5 mL of 2M AB solution was injected into the reactor under stirring to initiate the hydrolysis reaction at 298 K. The H2 produced was measured with drainage and gas collection systems. The released gas was analyzed by a Fuli 9790 plus gas chromatograph. The product in solution was analyzed by 11B and 1H nuclear magnetic resonance (NMR) spectra on a Bruker Advance NEO 400 M NMR spectrometer. The TOF values were calculated by the equation in the Appendix. To evaluate the long-term stability of AB hydrolysis, a reaction was performed using 5 mg of catalyst mixed with 10 mL of DI water under stirring, followed by addition of 10 mL of 2 M AB solution at 298 K. The TON (turnover number) value was calculated by equation.The apparent activation energy (Ea) was measured at temperatures from 293 to 308 K. For kinetic isotope experiments, D2O was used instead of H2O as the solvent. The effect of OH− on the catalytic activity was studied by using different concentrations of NaOH solution instead of H2O. To evaluate the cycling stability, the reacted catalyst was centrifuged, washed with DI water, and dried in a vacuum oven at 333 K. Then, the AB hydrolysis was performed at 298 K, and this was repeated for ten cycles.
Density functional theory (DFT) simulations
All the DFT calculations were performed using the Vienna ab initio simulation package (VASP)54 code with the method of projector augmented wave (PAW).55 The generalized gradient approximation (GGA)56 with Perdew–Burke–Ernzerhof (PBE)57 functional was utilized to describe the exchange-correlation potential. To investigate the growth position of Ru on MgO(200)/HBC, we simulated the growth process of Ru at the interface between MgO(200) and MgO(200)/HBC. By comparing the formation energy of Ru nanoparticles, we confirmed that Ru(101) nanoparticles grow at the interface of MgO(200)/HBC and built an Ru(101)/MgO(200) heterojunctions model to analyze the influence of MgO on Ru. The Grimme method (DFT-D3 correction)58 was adopted to accurately describe the van der Waals interactions. A 15 Å vacuum space was used along the z direction to avoid spurious interaction among the periodic images. An energy cut-off of 500 eV for the plane-wave expansion and Monkhorst–Pack k-point meshes of 3 × 5 × 1 and 5 × 7 × 1 in the 2D Brillouin zone were used for the geometry optimization and electronic structure of nanoparticle heterojunctions in our work. During the geometry optimization, the atomic position and lattice vectors were fully relaxed until energy and force converged to 10−4 eV and 0.01 eV Å−1, respectively. The Gibbs free energy (ΔG) for each electrochemical process was calculated as ΔG = ΔE + ΔEZPE − TΔS, where the value of ΔE, ΔEZPE, and ΔS denote the changes of DFT energy, the zero-point energy, and the entropy at 298 K, respectively. The climbing image nudged elastic band (CI-NEB)59 method was used to find saddle points and minimum energy paths, and the transition state was confirmed by frequency analysis, where there is only one imaginary frequency in a transition state.Author contributions
Jialei Yang: investigation, validation, writing – original draft. Zhenyu Yang: investigation, writing – original draft. Jiafu Li: investigation, validation. Hao Gang: methodology. Donghai Me: software, conceptualization, writing – original draft. Dongming Yin: investigation. Ruiping Deng: resources. Yifeng Zhu: funding acquisition. Xingyun Li: conceptualization, writing – review & editing, resources, supervision, funding acquisition. Ning Wang: resources, validation, software, formal analysis. Sameh M. Osman: investigation, formal analysis. Yusuke Yamauchi: project administration, writing – review & editing.Conflicts of interest
There are no conflicts to declare.Appendix
Equations used for the calculation of turnover frequency (TOF)
| TOF = (Vgas·Patm)/(R·T·nRu·t) |
V
gas = the volume of released gas; Patm = the atmospheric pressure of 101![[thin space (1/6-em)]](https://www.rsc.org/images/entities/char_2009.gif) 325 Pa; R = the universal gas constant of 8.3145 m3 Pa mol−1 K−1; T = the room temperature of 298 K; nRu = the total molar amount of Ru; t = the reaction time in minutes at the AB conversion of 20%.
325 Pa; R = the universal gas constant of 8.3145 m3 Pa mol−1 K−1; T = the room temperature of 298 K; nRu = the total molar amount of Ru; t = the reaction time in minutes at the AB conversion of 20%.
Equations used for the calculation of turnover number (TON)
| TON = TOF·t |
TOF = turnover frequency; t = the reaction time.
Acknowledgements
This research work was supported by the National Natural Science Foundation of China (22072069, 22105110), the Open Funds of the State Key Laboratory of Rare Earth Resource Utilization (RERU2022022), the Shanghai Science and Technology Committee (2021MCIMKF01), the funds by Tianjin Key Laboratory of Green Chemical Engineering Process Engineering (no. GCEPE 20190105). The authors also express their gratitude to the Deputyship for Research and Innovation, Ministry of Education, Saudi Arabia, for funding this research (IFKSUOR3–615–3). This work used the Queensland node of the NCRIS-enabled Australian National Fabrication Facility (ANFF).References
- H. Li, Z. Yao, X. Wang, Y. Zhu and Y. Chen, Energy Fuels, 2022, 36, 11745–11759 CrossRef CAS.
- S. Guan, Y. Liu, H. Zhang, R. Shen, H. Wen, N. Kang, J. Zhou, B. Liu, Y. Fan, J. Jiang and B. Li, Adv. Sci., 2023, 10, 2198–3844 Search PubMed.
- L. Zhou, J. Meng, P. Li, Z. Tao, L. Mai and J. Chen, Mater. Horiz., 2017, 4, 268–273 RSC.
- W. Li, Y. Zhao, Y. Liu, M. Sun, G. I. N. Waterhouse, B. Huang, K. Zhang, T. Zhang and S. Lu, Angew. Chem., Int. Ed., 2021, 60, 3290–3298 CrossRef CAS PubMed.
- C. Wang and D. Astruc, Chem. Soc. Rev., 2021, 50, 3437–3484 RSC.
- Q. Sun, N. Wang, Q. Xu and J. Yu, Adv. Mater., 2020, 32, 2001818 CrossRef CAS PubMed.
- J. Long, Q. Yao, X. Zhang, H. Wu and Z.-H. Lu, Appl. Catal., B, 2023, 320, 121989 CrossRef CAS.
- W.-W. Zhan, Q.-L. Zhu and Q. Xu, ACS Catal., 2016, 6, 6892–6905 CrossRef CAS.
- Y. Meng, Q. Sun, T. Zhang, J. Zhang, Z. Dong, Y. Ma, Z. Wu, H. Wang, X. Bao, Q. Sun and J. Yu, J. Am. Chem. Soc., 2023, 145, 5486–5495 CrossRef CAS PubMed.
- P. Li, R. Chen, Y. Huang, W. Li, S. Zhao and S. Tian, Appl. Catal., B, 2022, 300, 120725 CrossRef CAS.
- D. A. Bulushev, M. Zacharska, A. S. Lisitsyn, O. Y. Podyacheva, F. S. Hage, Q. M. Ramasse, U. Bangert and L. G. Bulusheva, ACS Catal., 2016, 6, 3442–3451 CrossRef CAS.
- C. D. Mboyi, D. Poinsot, J. Roger, K. Fajerwerg, M. L. Kahn and J.-C. Hierso, Small, 2021, 17, 2102759 CrossRef CAS PubMed.
- S. Akbayrak, Y. Tonbul and S. Özkar, Appl. Catal., B, 2016, 198, 162–170 CrossRef CAS.
- Z. Li, T. He, D. Matsumura, S. Miao, A. Wu, L. Liu, G. Wu and P. Chen, ACS Catal., 2017, 7, 6762–6769 CrossRef CAS.
- Z.-L. Wang, K. Sun, J. Henzie, X. Hao, Y. Ide, T. Takei, Y. Bando and Y. Yamauchi, Mater. Horiz., 2018, 5, 1194–1203 RSC.
- Q. Yao, Z.-H. Lu, R. Zhang, S. Zhang, X. Chen and H.-L. Jiang, J. Mater. Chem. A, 2018, 6, 4386–4393 RSC.
- Y.-Z. Chen, L. Liang, Q. Yang, M. Hong, Q. Xu, S.-H. Yu and H.-L. Jiang, Mater. Horiz., 2015, 2, 606–612 RSC.
- C. Lang, Y. Jia and X. Yao, Energy Storage Mater., 2020, 26, 290–312 CrossRef.
- X. Li, Q. Yao, Z. Li, H. Li, Q.-L. Zhu and Z.-H. Lu, J. Mater. Chem. A, 2022, 10, 326–336 RSC.
- J. Zhang, W. Yu, D. Feng, H. Xu and Y. Qin, Appl. Catal., B, 2022, 312, 121405 CrossRef CAS.
- K. Mori, K. Miyawaki and H. Yamashita, ACS Catal., 2016, 6, 3128–3135 CrossRef CAS.
- Y. Xu, S. S. Mofarah, R. Mehmood, C. Cazorla, P. Koshy and C. C. Sorrell, Mater. Horiz., 2021, 8, 102–123 RSC.
- X. Zhang, Q. Zhang, Y. Peng, X. Ma and G. Fan, Int. J. Hydrogen Energy, 2022, 47, 7793–7801 CrossRef CAS.
- R. Shen, Y. Liu, H. Wen, T. Liu, Z. Peng, X. Wu, X. Ge, S. Mehdi, H. Cao, E. Liang, J. Jiang and B. Li, Appl. Catal., B, 2022, 306, 121100 CrossRef CAS.
- N. Wang, Q. Sun, R. Bai, X. Li, G. Guo and J. Yu, J. Am. Chem. Soc., 2016, 138, 7484–7487 CrossRef CAS PubMed.
- S.-L. Li and Q. Xu, Energy Environ. Sci., 2013, 6, 1656–1683 RSC.
- R. K. Sharma, P. Yadav, M. Yadav, R. Gupta, P. Rana, A. Srivastava, R. Zbořil, R. S. Varma, M. Antonietti and M. B. Gawande, Mater. Horiz., 2020, 7, 411–454 RSC.
- L. Guo, X. Gu, K. Kang, Y. Wu, J. Cheng, P. Liu, T. Wang and H. Su, J. Mater. Chem. A, 2015, 3, 22807–22815 RSC.
- Y. Guo, J. Tang, J. Henzie, B. Jiang, H. Qian, Z. Wang, H. Tan, Y. Bando and Y. Yamauchi, Mater. Horiz., 2017, 4, 1171–1177 RSC.
- B. Cui, G. Wu, S. Qiu, Y. Zou, E. Yan, F. Xu, L. Sun and H. Chu, Adv. Sustainable Syst., 2021, 5, 2100209 CrossRef CAS.
- X. Sun, G. Zhang, Q. Yao, H. Li, G. Feng and Z.-H. Lu, Inorg. Chem., 2022, 61, 18102–18111 CrossRef CAS PubMed.
- Y. Yang, S. Zhao, F. Bi, J. Chen, Y. Li, L. Cui, J. Xu and X. Zhang, Cell Rep. Phys. Sci., 2022, 3, 101011 CrossRef CAS.
- Y. Pan, H. Xu, M. Chen, K. Wu, Y. Zhang and D. Long, ACS Catal., 2021, 11, 5974–5983 CrossRef CAS.
- P. Su, W. Pei, X. Wang, Y. Ma, Q. Jiang, J. Liang, S. Zhou, J. Zhao, J. Liu and G. Q. Lu, Angew. Chem., Int. Ed., 2021, 60, 16044–16050 CrossRef CAS PubMed.
- Q.-C. Xu, J.-D. Lin, J. Li, X.-Z. Fu, Z.-W. Yang, W.-M. Guo and D.-W. Liao, J. Mol. Catal. A: Chem., 2006, 259, 218–222 CrossRef CAS.
- Y. Li, J. Meng, Y. Zhu, Y. Yang, X. Zhang and X. Zheng, Colloids Surf., A, 2022, 649, 129513 CrossRef CAS.
- Y.-T. Li, S.-H. Zhang, G.-P. Zheng, P. Liu, Z.-K. Peng and X.-C. Zheng, Appl. Catal., A, 2020, 595, 117511 CrossRef CAS.
- T. Sun, Y. Wang, Y. Long, Q. Li and G. Fan, Fuel, 2022, 309, 122203 CrossRef CAS.
- A. Guo, Y. Peng, M. Mao, Y. Wang, Y. Long, Q. Li and G. Fan, Fuel, 2021, 306, 121722 CrossRef CAS.
- H. Wang, C. Gao, R. Li, Z. Peng, J. Yang, J. Gao, Y. Yang, S. Li, B. Li and Z. Liu, ACS Sustainable Chem. Eng., 2019, 7, 18744–18752 CrossRef CAS.
- R. Jiang, J. Meng, S. Yang, Z. Peng, P. Liu and X. Zheng, Appl. Surf. Sci., 2022, 606, 154795 CrossRef CAS.
- Y.-T. Li, X.-L. Zhang, Z.-K. Peng, P. Liu and X.-C. Zheng, Fuel, 2020, 277, 118243 CrossRef CAS.
- S.-H. Li, X.-R. Song, Y.-T. Li, Y.-Q. Zhao and X.-C. Zheng, Int. J. Hydrogen Energy, 2021, 46, 27555–27566 CrossRef CAS.
- J. Zhang, J. Li, L. Yang, R. Li, F. Zhang and H. Dong, Int. J. Hydrogen Energy, 2021, 46, 3964–3973 CrossRef CAS.
- Y. He, Y. Peng, Y. Wang, Y. Long and G. Fan, Fuel, 2021, 297, 120750 CrossRef CAS.
- Q. Yao, K. Yang, X. Hong, X. Chen and Z.-H. Lu, Catal. Sci. Technol., 2018, 8, 870–877 RSC.
- Y. Ge, X. Qin, A. Li, Y. Deng, L. Lin, M. Zhang, Q. Yu, S. Li, M. Peng, Y. Xu, X. Zhao, M. Xu, W. Zhou, S. Yao and D. Ma, J. Am. Chem. Soc., 2021, 143, 628–633 CrossRef CAS PubMed.
- H. Li, Z. Yao, Y. Zhu and X. Wang, Fuel, 2022, 325, 124849 CrossRef CAS.
- Q. Zhang, C. He and J. Huo, Comput. Mater. Sci., 2022, 207, 111306 CrossRef CAS.
- M. Chandra and Q. Xu, J. Power Sources, 2006, 156, 190–194 CrossRef CAS.
- Y. Luo, Y. Tian, S. Yang, J. Jiang, A. Liu, H. Gao and L. Ai, Int. J. Hydrogen Energy, 2022, 47, 35184–35194 CrossRef CAS.
- N. Wang, Q. Sun, T. Zhang, A. Mayoral, L. Li, X. Zhou, J. Xu, P. Zhang and J. Yu, J. Am. Chem. Soc., 2021, 143, 6905–6914 CrossRef CAS PubMed.
- Y. Hao, Z. Leng, C. Yu, P. Xie, S. Meng, L. Zhou, Y. Li, G. Liang, X. Li and C. Liu, Carbon, 2023, 212, 118156 CrossRef CAS.
- G. Kresse and J. Furthmüller, Phys. Rev. B: Condens. Matter Mater. Phys., 1996, 54, 11169–11186 CrossRef CAS PubMed.
- J. P. Perdew and Y. Wang, Phys. Rev. B: Condens. Matter Mater. Phys., 1992, 45, 13244–13249 CrossRef PubMed.
- J. P. Perdew, J. A. Chevary, S. H. Vosko, K. A. Jackson, M. R. Pederson, D. J. Singh and C. Fiolhais, Phys. Rev. B: Condens. Matter Mater. Phys., 1992, 46, 6671–6687 CrossRef CAS PubMed.
- P. E. Blöchl, Phys. Rev. B: Condens. Matter Mater. Phys., 1994, 50, 17953–17979 CrossRef PubMed.
- S. Grimme, J. Comput. Chem., 2006, 27, 1787–1799 CrossRef CAS PubMed.
- G. Henkelman, B. P. Uberuaga and H. Jónsson, J. Chem. Phys., 2000, 113, 9901–9904 CrossRef CAS.
Footnotes |
| † Electronic supplementary information (ESI) available. See DOI: https://doi.org/10.1039/d3mh01909h |
| ‡ These authors contributed equally to this work. |
| This journal is © The Royal Society of Chemistry 2024 |

