 Open Access Article
Creative Commons Attribution 3.0 Unported Licence
Intermetallics with sp–d orbital hybridisation: morphologies, stabilities and work functions of In–Pd particles at the nanoscale†
Alexis
Front
*abc,
Clovis
Lapointe
ad and
Émilie
Gaudry
 *a
*a
aUniversité de Lorraine, CNRS, Institut Jean Lamour, UMR 7198, Campus Artem, 2 allée André Guinier, F-54011, Nancy, France. E-mail: alexis.front@aalto.fi; emilie.gaudry@univ-lorraine.fr
bDepartment of Chemistry and Materials Science, Aalto University, 02150 Espoo, Finland
cDepartment of Applied physics, Aalto university, P.O. Box 11000, FI-00076 Aalto, Finland
dUniversité Paris-Saclay, CEA, Service de Recherche en Corrosion et Comportement des Matériaux, SRMP, 91191 Gif-sur-Yvette, France
First published on 29th May 2024
Abstract
The field of intermetallic catalysts, alloying a p-block and a transition metal to form a pM–TM bimetallic alloy, is experiencing robust growth, emerging as a vibrant frontier in catalysis research. Although such materials are increasingly used in the form of nanoparticles, a precise description of their atomic arrangements at the nanoscale remains scarce. Based on the In–Pd binary as a typical pM–TM system, we performed density functional theory calculations to investigate the morphologies, relative stabilities and electronic properties of 24 Å and 36 Å nanoparticles built from the In3Pd2, InPd and InPd3 compounds. Wulff equilibrium structures are compared to other ordered and disordered structures. Surface energies are computed to discuss their thermodynamic stability, while work functions are calculated to examine their electronic structures. For any compound, increasing the size leads to the stabilisation of Wulff polyhedra, which are found to offer smaller surface energies than non-crystalline and chemically disordered structures. Disordered In3Pd2 and InPd nanoparticles show a tendency towards amorphisation, owing to repulsive short In–In bonds. Tuning nanoparticles’ work functions can be achieved through the control of the surface structure and composition, by virtue of the roughly linear correlation found between the surface composition and the work function which nevertheless includes a certain number of outliers. This work paves the way to rationalisation of both structural and electronic properties of pM–TM nanoparticles.
New conceptsIntermetallic nanoparticles, combining p-block and transition metals to form pM–TM binary alloys, are of paramount importance across a broad spectrum of applications, underscoring the crucial significance of studying their nanoscale structures. Through the In–Pd system, novel insights have been uncovered, shedding new light on the structure–property relationships within this type of pM–TM intermetallic nanoparticles. Based on density functional theory calculations, regarding structures of In3Pd2, InPd and InPd3 nanoparticles, within sizes ranging from 25 Å to 34 Å, we show that non-crystalline morphologies are not likely. Wulff-type morphologies are found thermodynamically more stable in these ordered systems, the larger the size, the better. Moreover, our computations reveal that disordered In-rich nanoparticles tend to undergo amorphisation, driven by destabilising In–In interactions, while the crystalline character of nanoparticles with a large Pd content is kept. Concerning nanoparticle properties, using an original computational method, we bring to light a roughly linear correlation between the surface composition and the work function, although it nonetheless incorporates a certain number of outliers. Amorphous particles have a lower work function compared to crystalline particles, attributable to their surface composition enriched in indium. This study establishes a foundation for systematically understanding the structural and electronic characteristics of pM–TM nanoparticles. |
1. Introduction
The development of technologically relevant nanoparticles (NPs) has seen unprecedented growth in recent years. Initially used by artisans, mainly for their optical properties, albeit without the knowledge of their nature,1–3 they are nowadays used to develop many different applications, in biomedicine,4–6 energy,7–9 and information technologies,10,11 with the most widespread applications likely being in catalysis. In the latter case, mono-metallic precious and transition metal NPs have played a major role,12–15 demonstrated, among others, by the relevance of gold NPs in CO oxidation,16 of copper-based NPs in methanol production from syngas (CO + H2),17 of silver NPs in solar-driven photocatalytic water splitting, CO2 reduction and degradation of organic pollutants,18 and also of platinum, iridium and ruthenium based NPs in the hydrogen evolution reaction (HER), oxygen reduction reaction (ORR) and oxygen evolution reaction (OER).19 This is attributed to the ability of metals to activate chemical bonds through d-electrons or d-empty orbitals,20 and also to the quantitative understanding that has been established in transition-metal catalysis over recent years.21,22Elemental transition metals however struggle to satisfy the numerous and sometimes contradictory needs of high-performance catalysts, i.e. high activity, tractable selectivity, low cost and good stability. Tailoring atomic arrangements and chemical compositions are key approaches to circumvent previous limitations, generally achieved by alloying, faceting, and nano-structuring, as well as selecting crystal structures and surface orientations.23–25 Thus, many bimetallic NPs have been developed over the last few years, generally by associating two precious metals or a noble metal and a first-row transition metal. The so-called “synergistic” effects between the two metals are known to greatly enhance the catalyst efficiency in many cases. Hence, Pd–Au alloys are likely among the most widely used solid-solution alloys in all fields of catalysis (ref. 25 and references therein), while Pt-based nanoalloys, especially, in the Pt–Ni system, are considered to be one of the most promising catalysts for the oxygen reduction reaction (ORR) – bottleneck restricting the large-scale commercialisation of fuel cell vehicles26 – able to improve by a factor of 4 to 10 the catalytic performance of the ORR in comparison to commercial Pt/C.27,28
The specific performances of bimetallic catalysts are typically attributed to electronic and geometric effects, including orbital hybridisation and active site isolation. Up to now, most theoretical investigations have relied on infinite slabs, while experimental catalysts are generally synthesised in the form of nanoparticles. At the nanoscale, mixing two late transition metals leads to a large variety of configurations, including core–shell, segregated, multi-shell, ordered or solid-solution alloys.29 The atomic arrangements can greatly differ from the ones resulting from bulk truncation, especially, when the composition range of a given phase is large and its formation enthalpy is low. It is for instance the case of Pt–Ni nanoalloys (|ΔHf| < 0.1 eV per at.),30 for which icosahedral core–shell and multishell morphologies have been predicted to be likely for 147–923 atom NPs.31
Compared to conventional d–d bimetallic NPs, the knowledge of systems combining transition and p-block metals – e.g. Al, Zn, Ga, Cd, In and Sn within the first periods of the periodic table – is little and is currently quickly developing. Among them, In–Pd phases have been identified as relevant catalysts for several reactions. This is especially the case (i) for methanol steam reforming, for which InxPdy/In2O3 aerogels exhibit excellent CO2 selectivities (99%),32 (ii) for methanol synthesis, for which In–Pd NPs show higher CH3 OH rates (70%) and selectivities (80% at 270 °C) compared to conventional Cu/ZnO/Al2O3,33,34 and (iii) for hydrogenation/dehydrogenation reactions, for which the addition of In to Pd improves the catalytic performances, likely attributed to site isolation.35–39 The formation of In–Pd intermetallics can also reduce the catalyst coking37,38 and poisoning.40 Such performances strongly depend on the catalyst's chemical composition and surface structure. Indeed, recent studies highlight the better catalytic performances in acetylene hydrogenation of bimetallic In–Pd at an In![[thin space (1/6-em)]](https://www.rsc.org/images/entities/char_2009.gif) :
:![[thin space (1/6-em)]](https://www.rsc.org/images/entities/char_2009.gif) Pd ratio of 0.8,37 and a higher selectivity (92% vs. 21% at 90 °C)41 of 1
Pd ratio of 0.8,37 and a higher selectivity (92% vs. 21% at 90 °C)41 of 1![[thin space (1/6-em)]](https://www.rsc.org/images/entities/char_2009.gif) :
:![[thin space (1/6-em)]](https://www.rsc.org/images/entities/char_2009.gif) 1 InPd NPs than that of InPd3 NPs, attributed to the different types of mainly exposed facets – (110) and (111) for 1
1 InPd NPs than that of InPd3 NPs, attributed to the different types of mainly exposed facets – (110) and (111) for 1![[thin space (1/6-em)]](https://www.rsc.org/images/entities/char_2009.gif) :
:![[thin space (1/6-em)]](https://www.rsc.org/images/entities/char_2009.gif) 1 InPd and InPd3, respectively. Thus, the controlled synthesis of pM–TM (p-block metal–transition metal) NPs is crucial to design catalysts with optimal performances.
1 InPd and InPd3, respectively. Thus, the controlled synthesis of pM–TM (p-block metal–transition metal) NPs is crucial to design catalysts with optimal performances.
The rich structural chemistry of pM–TM systems, typically attributed to the large formation enthalpy of 1![[thin space (1/6-em)]](https://www.rsc.org/images/entities/char_2009.gif) :
:![[thin space (1/6-em)]](https://www.rsc.org/images/entities/char_2009.gif) 1 bulk compounds (|ΔHf| > 0.1 eV per at. in many cases),30,42 yields too many intermetallics in the bulk phase diagram,43 and thus is expected to lead to a substantial variety of atomic arrangements at the nanoscale. Within the In–Pd system, the large compositional range of the 1
1 bulk compounds (|ΔHf| > 0.1 eV per at. in many cases),30,42 yields too many intermetallics in the bulk phase diagram,43 and thus is expected to lead to a substantial variety of atomic arrangements at the nanoscale. Within the In–Pd system, the large compositional range of the 1![[thin space (1/6-em)]](https://www.rsc.org/images/entities/char_2009.gif) :
:![[thin space (1/6-em)]](https://www.rsc.org/images/entities/char_2009.gif) 1 InPd phase, extending from 45 at%Pd to 61.5 at%Pd, i.e. much larger than other that of In–Pd binaries,44 likely eases the experimental synthesis of InPd NPs, with sizes down to 10 nm. Other single-phase NPs have however recently been synthesised, like InPd3 (size 5 nm),39 In3Pd2 (size 90 nm),45 and In7Pd3 (sizes in the range of 60–90 nm).39,45 Moreover, for particle sizes below 3 nm, core–shell structures have been identified, with a Pd core and a 1
1 InPd phase, extending from 45 at%Pd to 61.5 at%Pd, i.e. much larger than other that of In–Pd binaries,44 likely eases the experimental synthesis of InPd NPs, with sizes down to 10 nm. Other single-phase NPs have however recently been synthesised, like InPd3 (size 5 nm),39 In3Pd2 (size 90 nm),45 and In7Pd3 (sizes in the range of 60–90 nm).39,45 Moreover, for particle sizes below 3 nm, core–shell structures have been identified, with a Pd core and a 1![[thin space (1/6-em)]](https://www.rsc.org/images/entities/char_2009.gif) :
:![[thin space (1/6-em)]](https://www.rsc.org/images/entities/char_2009.gif) 1 InPd shell, when the In
1 InPd shell, when the In![[thin space (1/6-em)]](https://www.rsc.org/images/entities/char_2009.gif) :
:![[thin space (1/6-em)]](https://www.rsc.org/images/entities/char_2009.gif) Pd atomic ratio is 0.8.35 Ordered 1
Pd atomic ratio is 0.8.35 Ordered 1![[thin space (1/6-em)]](https://www.rsc.org/images/entities/char_2009.gif) :
:![[thin space (1/6-em)]](https://www.rsc.org/images/entities/char_2009.gif) 1 InPd particles, with an unalloyed In shell, have also been formed, with a rather high In
1 InPd particles, with an unalloyed In shell, have also been formed, with a rather high In![[thin space (1/6-em)]](https://www.rsc.org/images/entities/char_2009.gif) :
:![[thin space (1/6-em)]](https://www.rsc.org/images/entities/char_2009.gif) Pd ratio (value = 2).35 However, no disordered crystalline structure has ever been observed, nor any non-crystalline structures, in contrast to the literature on d–d nanocrystals.46–48
Pd ratio (value = 2).35 However, no disordered crystalline structure has ever been observed, nor any non-crystalline structures, in contrast to the literature on d–d nanocrystals.46–48
Overall, the development of a synthetic approach for ordered intermetallic nanocrystals is challenging.49 Thus, numerical methods are crucial to understand, explain and predict nanoalloys’ morphologies, structures and properties.50,51 Current computational resources combined with density functional theory (DFT) are now able to calculate key quantities, like the nanoparticles’ surface energy, one of the most important quantities to discuss their thermodynamic stability,31,52,53 which can be compared to experimental measurements.54 Because chemisorption typically involves the Fermi level of the catalysts and the HOMOs/LUMOs (highest occupied/lowest unoccupied molecular orbitals) of the reactants, the work function is one important feature for catalysis.55–57 In this work, by focusing on NPs with the 1![[thin space (1/6-em)]](https://www.rsc.org/images/entities/char_2009.gif) :
:![[thin space (1/6-em)]](https://www.rsc.org/images/entities/char_2009.gif) 1 InPd composition, as well as on one composition in the Pd-rich side (InPd3) and on one composition in the In-rich side (In3Pd2), we show that ordered structures are stable, at least when compared to non-crystalline structures. We also highlight the amorphisation of disordered structures, driven by destabilising In–In interactions. Finally, trends between the NPs’ work functions and their morphologies, sizes and chemical compositions are examined, thus opening a way to design NPs with specific properties.
1 InPd composition, as well as on one composition in the Pd-rich side (InPd3) and on one composition in the In-rich side (In3Pd2), we show that ordered structures are stable, at least when compared to non-crystalline structures. We also highlight the amorphisation of disordered structures, driven by destabilising In–In interactions. Finally, trends between the NPs’ work functions and their morphologies, sizes and chemical compositions are examined, thus opening a way to design NPs with specific properties.
2 Results and discussion
2.1 The In–Pd system
The bulk In–Pd system presents a rich phase diagram, with six intermetallic compounds at room temperature44: In7Pd3 (Im![[3 with combining macron]](https://www.rsc.org/images/entities/char_0033_0304.gif) m space group, cI40), In3Pd2 (P
m space group, cI40), In3Pd2 (P![[3 with combining macron]](https://www.rsc.org/images/entities/char_0033_0304.gif) m1 space group, hP5), α-InPd3 (I4/mmm space group, tI8), α-InPd2 (Pnma space group, oP12), In3Pd5 (Pbam space group, oP16), and InPd (Pm
m1 space group, hP5), α-InPd3 (I4/mmm space group, tI8), α-InPd2 (Pnma space group, oP12), In3Pd5 (Pbam space group, oP16), and InPd (Pm![[3 with combining macron]](https://www.rsc.org/images/entities/char_0033_0304.gif) m space group, cP2). Beside the 1
m space group, cP2). Beside the 1![[thin space (1/6-em)]](https://www.rsc.org/images/entities/char_2009.gif) :
:![[thin space (1/6-em)]](https://www.rsc.org/images/entities/char_2009.gif) 1 InPd compound, we have considered in this work one In-rich compound (In3Pd2) and one Pd-rich compound (InPd3). Depending on the experimental conditions, the InPd3 compound can be synthesised with several crystal structures, including AuCu3-type (cubic, Pm
1 InPd compound, we have considered in this work one In-rich compound (In3Pd2) and one Pd-rich compound (InPd3). Depending on the experimental conditions, the InPd3 compound can be synthesised with several crystal structures, including AuCu3-type (cubic, Pm![[3 with combining macron]](https://www.rsc.org/images/entities/char_0033_0304.gif) m space group, cP4),58 ZrAl3-type (tetragonal, I4/mmm space group, tl16),58 and CuInPt2-type (tetragonal, I4/mmm space group, tP4).59 In this work, we focus on three In–Pd compounds (Table 1): cubic InPd of CsCl-type and cubic InPd3 of AuCu3-type, in connection with the extensive investigations of nanoalloys with cubic structures.60–62 We also consider the In3Pd2 phase that crystallises in the trigonal system, for which investigations at the nanoscale are nonexistent, as far as we know.
m space group, cP4),58 ZrAl3-type (tetragonal, I4/mmm space group, tl16),58 and CuInPt2-type (tetragonal, I4/mmm space group, tP4).59 In this work, we focus on three In–Pd compounds (Table 1): cubic InPd of CsCl-type and cubic InPd3 of AuCu3-type, in connection with the extensive investigations of nanoalloys with cubic structures.60–62 We also consider the In3Pd2 phase that crystallises in the trigonal system, for which investigations at the nanoscale are nonexistent, as far as we know.
| Compound | Space group | a (Å) | c (Å) | ΔHf (eV per at.) | |
|---|---|---|---|---|---|
| In3Pd2 |
P![[3 with combining macron]](https://www.rsc.org/images/entities/char_0033_0304.gif) m1 m1 |
4.642 | 5.586 | −0.476 | PBE (our work) |
| 4.642 | 5.586 | −0.464 | PBE30 | ||
| 4.535 | 5.512 | −0.59 | Exp.59,63 | ||
| InPd |
Pm![[3 with combining macron]](https://www.rsc.org/images/entities/char_0033_0304.gif) m m |
3.31 | −0.489 | PBE (our work) | |
| 3.31 | −0.497 | PBE30 | |||
| 3.250 | −0.72 | Exp.59,63 | |||
| InPd3 |
Pm![[3 with combining macron]](https://www.rsc.org/images/entities/char_0033_0304.gif) m m |
4.045 | −0.4396 | PBE (our work) | |
| 4.045 | −0.438 | PBE30 | |||
| 4.027 | −0.554 | Exp.58,64 |
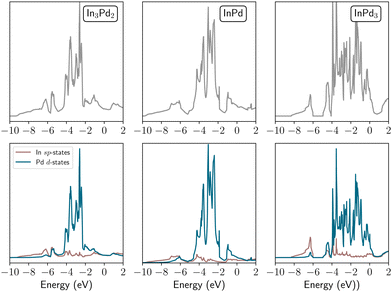
The calculated electronic density of states of the three compounds is represented in Fig. 1. The low energy range (−10 eV to −5 eV) is mainly formed by In-states, with a contribution of Pd-states. As previously mentioned in ref. 65 and 66 on GaPd2 and In3Pd5, this region reflects the chemical binding in the compounds. The remaining part shows one strong contribution from Pd d-states, in a form of a band, located above 4 eV, whose bandwidth increases with the Pd content. Indeed, the isolation of Pd sites in In3Pd2 and InPd, more pronounced as the In concentration increases, results in a narrow d-band, the hybridisation between Pd-d states being weak. In contrast, the d–d hybridisation in InPd3 leads to a large d-band (roughly two times as large as in In3Pd2 and InPd). Such differences in the electronic structure may be at the origin of the distinct behaviour of In3Pd2 and InPd NPs, in comparison to InPd3 NPs.
2.2 Surface energies and morphologies of NPs based on the Wulff construction
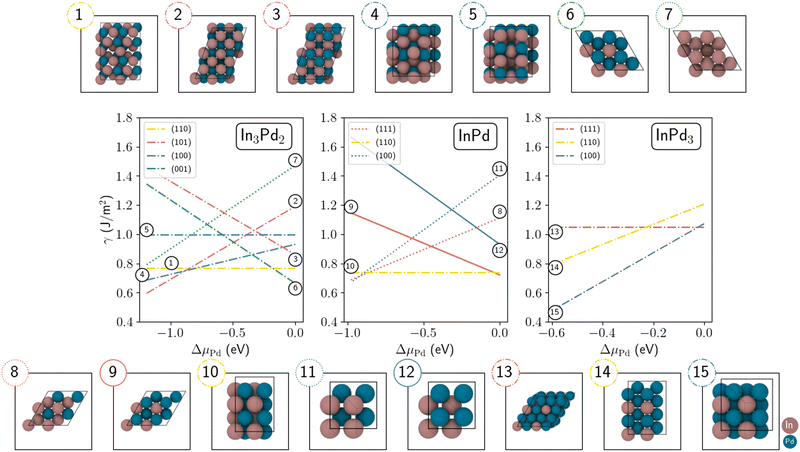
Overall, the equilibrium shape of free nanoparticles is known to be given by the Wulff construction, assuming the bulk crystal structure, and based on the ratios between the compound's surface energies.67 Energies of several low-index surfaces have been computed as a function of the Pd's chemical potential (Tables S1 and S2, ESI†) and are shown in Fig. 2. The three sub-figures correspond to energies of In3Pd2 (left), InPd (middle) and InPd3 (right) low-index surfaces. A few additional orientations have been considered, but are not presented in Fig. 2 (In3Pd2 (2![[1 with combining macron]](https://www.rsc.org/images/entities/char_0031_0304.gif) 0), InPd (102) and InPd3 (112)). In the following, we define the In- and the Pd-rich limit by the situations with ΔμPd = 0 eV and ΔμIn = 0 eV, respectively. This is valid for the three compositions. Nevertheless, it should be mentioned that the value of ΔμPd at the In-rich limit (ΔμIn = 0 eV) depends on the considered compound. It is ΔμPd = −0.978 eV, ΔμPd = −0.586 eV and ΔμPd = −1.190 eV in the case of InPd, InPd3 and In3Pd2, respectively.
0), InPd (102) and InPd3 (112)). In the following, we define the In- and the Pd-rich limit by the situations with ΔμPd = 0 eV and ΔμIn = 0 eV, respectively. This is valid for the three compositions. Nevertheless, it should be mentioned that the value of ΔμPd at the In-rich limit (ΔμIn = 0 eV) depends on the considered compound. It is ΔμPd = −0.978 eV, ΔμPd = −0.586 eV and ΔμPd = −1.190 eV in the case of InPd, InPd3 and In3Pd2, respectively.
On the whole, pure Pd-terminated surfaces are calculated to present a rather high surface energy, (label 12 for InPd in Fig. 2, not represented for InPd3), while stable surfaces are found among mixed terminations. It is the case for InPd3 (100) (label 15 in Fig. 2), with a particularly low surface energy at the In-rich limit (γ = 0.491 J m−2) that increases at the Pd-rich limit (γ = 1.072 J m−2). The latter value is similar to the one found for InPd3 (111) (1.046 J m−2) for ΔμPd = 0. Indeed, both InPd3 (111) and InPd3 (100) terminations contain In and Pd atoms. The InPd3 (111) topmost plane is stoichiometric and shows a higher atomic density than the mixed termination of InPd3 (100) – 0.15 at per Å2vs. 0.12 at per Å2. But the In content of the mixed InPd3 (100) termination is larger (0.06 In at. per Å2, vs. 0.04 In at. per Å2 for the stoichiometric surface), thus leading to a stabilising effect. Indeed, the presence of In atoms on the surface is less unfavourable than that of Pd. Similar surface energies are also calculated for InPd(100), InPd(110) and InPd(111) at the In-rich limit, and for InPd(111) and InPd(110) at the Pd-rich limit. The situation is rather complex for In3Pd2, with relative stabilities calculated to rank as γ(101) < γ(100) < γ(110) < γ(001) in the In-rich and γ(001) < γ(100) < γ(110) < γ(101) in the Pd-rich side.
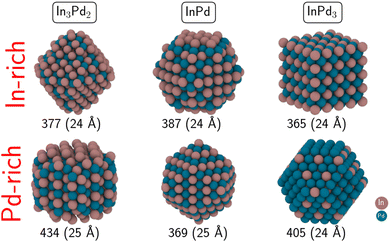
Based on the surface energies at the In- and Pd-rich limits, and using the Wulff approach, two types of NPs are built (Fig. 3). Their morphologies strongly depend on the chemical potentials. The InPd3 NP exhibits a cubic shape in the In-rich side and a truncated octahedral (TOh) morphology – typically the Wulff polyhedra of TM alloys – in the Pd-rich side. Because the stoichiometric InPd(110) surface presents a low energy, independent of the chemical potentials, the InPd NP morphology is similar at both In- and Pd-rich limits, characterised by large (110) facets. The main difference between the two cases lies in small (100) facets observed at the In-rich side, due to the low InPd(100) surface energy at ΔμIn = 0. The In3Pd2 NP displays a cylindrical shape at the Pd-rich limit, mainly due to the stability of the In3Pd2(001) surface for ΔμPd = 0. In the In-rich side, the stability of the In3Pd2(110) surface leads to a shape with steeper facets. In the following, Wulff polyhedra, built using most stable facets at the In-rich and Pd-rich limits (Fig. 2 and Table S2, Section S2, ESI†), are labelled WPIn and WPPd, respectively.
2.3 Stability of bimetallic In–Pd nanoparticles
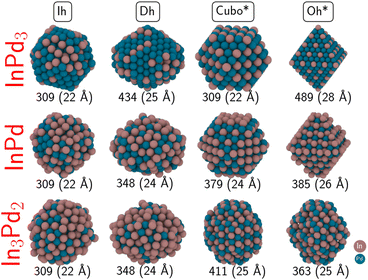
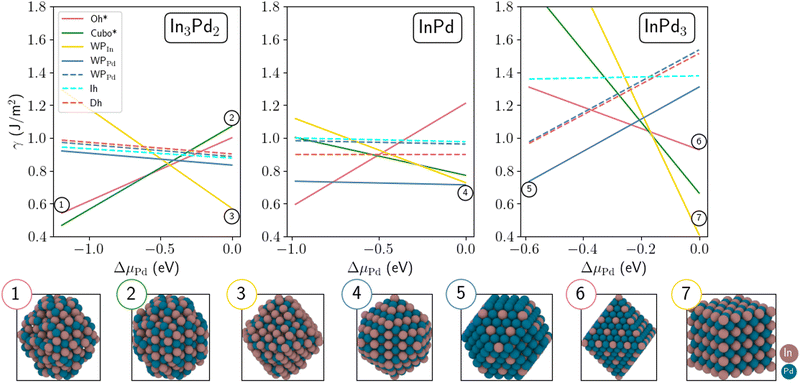
The calculation of surface energies requires an infinite reservoir of particles, which becomes questionable when the size of the NPs is not large enough. Therefore, we build two types of NPs: on the one hand, NPs with a diameter between 22 Å and 28 Å (300 to 500 atoms, called “small” NPs in the following), and on the other hand, NPs with a diameter larger than 36 Å (made of around 1000 to 1200 atoms, called “large” NPs in the following).Moreover, we also consider in this work other geometries, that can offer dense fcc{111} and fcc{100} facets when dealing with fcc metals, but whose relevance to the case of non-fcc In–Pd NPs mostly relies on their spherical shape. We focused on icosahedron (Ih), decahedron (Dh), octahedron (Oh) and cuboctahedron (Cubo) shapes (Fig. 4). These morphologies have been chosen because, for metal NPs, (i) non-crystalline Ih and Dh geometries are typically the ones of small to intermediate sized NPs,68,69 while crystalline Oh and Cubo geometries are commonly in competition with the Wulff polyhedron for large size NPs. Below, not to be confused with the conventional Cubo and Oh shapes of L12 bimetallic NPs (as is InPd3), we rename Oh by Oh* and Cubo by Cubo*, to indicate that * corresponds to In3Pd2 or InPd. Both ordered and chemically disordered NPs are generated. Eleven structures have been relaxed. Total energies of chemically disordered WPs result from an average of over nine or ten configurations, generated by random shuffling of atoms in the structure. While energy differences between the different configurations can be rather high – it reaches more than 60 meV per at. for Wulff shaped In3Pd2 NPs, the dispersion of energies after structural relaxation is less than a few meV per at. (20 meV per at. for Wulff shaped In3Pd2 NPs). The NP stabilities have been evaluated through their surface energies, calculated as a function of the Pd's chemical potential. They are shown in Fig. 5. The three sub-figures correspond to NPs built from In3Pd2 (left), InPd (middle) and InPd3 (right).
In the following, we first discuss the case of small NPs (Fig. 5). At the Pd-rich limit (ΔμPd = 0), the most stable configuration of InPd3 NP is WPIn, which exhibits only low energy mixed (100) facets, i.e. faces composed of both In and Pd. At lower ΔμPd, this structure is progressively destabilised and the WPPd configuration, characterised by (100) and (111) facets, becomes the most stable one in the region −0.59 eV < ΔμPd < −0.21 eV. Interestingly, at the crossover between WPIn and WPPd (i.e. −0.21 eV < ΔμPd < −0.19 eV), the most stable configuration is the Oh structure with only mixed (111) facets. Increasing the indium concentration to InPd leads to a situation, where WPPd, characterised by only mixed (110) facets, thus forming a quasi-spherical NP, is the most stable configuration on almost the whole range of Pd's chemical potentials. At the Pd-rich limit, there is a competition between WPPd and WPIn, which mainly exhibits (100) facets. At the In-rich limit, Oh* is the most stable morphology. Focusing on In3Pd2 NPs, the most stable configurations are WPIn at the Pd-rich side, and Cubo* and Oh* at the In-rich side. The surface energies of Cubo* and Oh* are close to each other, Cubo* becoming more favourable than Oh* at the In-rich side. Overall non-crystalline and disordered structures are not favoured on the whole range of ΔμPd, a consequence of the large formation enthalpy of the In–Pd compounds (|ΔHf|), which acts as a driving force to stabilise chemical order and crystalline structures (see Section 2.4). This is rather different from the observations on transition metal nanoalloys (|ΔHf| < 0.1eV per at. in many cases), in which many morphologies distinct from polyhedral shapes might occur.70–73
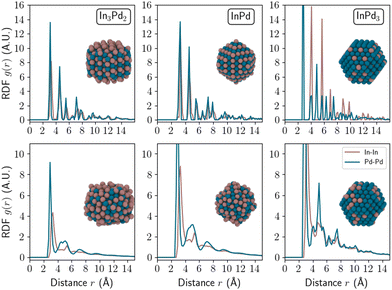
To deepen our analysis, we computed the radial distribution function (RDF) along the radius of the NP as displayed in Fig. 6. In the ordered state, NP RDFs are characterised by alternating sharp peaks, for any considered In–Pd compound, i.e. In3Pd2, InPd and InPd3. The computed first neighbour distances for In–Pd (2.78 Å) in InPd NPs are found to be in excellent agreement with experimental data: according to X-ray diffraction and X-ray absorption spectroscopy, the values are 2.81 Å and 2.79 Å, respectively, for small InPd NPs (27 Å, label Pd–In 2.0 in ref. 35). In addition, our computed value for the first neighbour Pd–Pd distance (3.22 Å) is also in good agreement with the same distance in bulk InPd (3.25 Å).
In the case of disordered InPd3, the RDF exhibits wider peaks than in the ordered state. For disordered compounds with larger In concentrations, i.e. for disordered InPd and In3Pd2, only one sharp peak is still present, corresponding to the closest neighbours. It suggests an amorphisation of the nanoparticles. This is in agreement with recent observations of amorphous disordered NP structures in the pM–TM system.74 This is however quite different from the observations on transition metal nanoalloys with crystalline disordered structures, which do not present any amorphisation.75
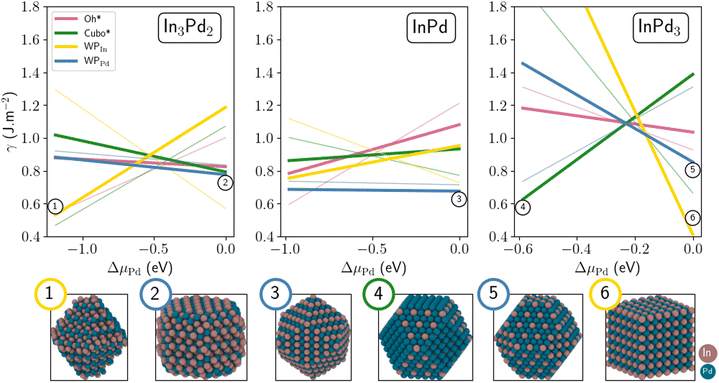
The size of NPs is known to have a strong impact on their stability. Indeed, increasing the size might change the NP terminations and thus their Pd contents, leading to a drastic modification of their surface energies. Size effects are investigated here by comparing small (300–500 atoms) and large NPs (≃1000 to 1200 atoms, Fig. 7). In the case of InPd3, in the Pd-rich side, the most stable configuration is WPIn (thick yellow line, Fig. 7), i.e. the same configuration as that identified for small sizes. As μPd decreases, this structure is progressively destabilised in favour of the Cubo morphology (thick green line, Fig. 7). The latter morphology is then the most stable one, in the range −0.59 eV < ΔμPd < −0.21 eV. This is consistent with the result found for smaller NPs, for which the WPPd structure has been found to be the most stable one (thin yellow line, Fig. 5). Indeed, both Cubo and WPPd exhibit (100) and (111) facets, the core being the same in both cases. The only difference between Cubo and WPPd NP is their facet sizes. In the case of InPd, the most stable morphology is WPPd for both small and large NPs (thick and thin blue lines, Fig. 7), the surface energy decreases by around 0.05 J m−2 when the number of atoms in the NP is multiplied by three, approximately. In the case of In3Pd2, the Wulff polyhedra is the most stable structure for large NPs, i.e. WPPd at ΔμPd = 0 (thick blue line, Fig. 7) and WPIn at ΔμPd = −1.19 eV with a crossover around ΔμPd= −0.6 eV. This is a direct signature of the size effect. The Oh* and Cubo* morphologies that are typical for fcc metals are not favoured in InPd3 NPs, at least when ΔμPd = 0, even if bulk InPd3 presents some similarities with fcc metals.
2.4. In–In short range interactions drive possible amorphisations of NPs
We now quantitatively investigate the amorphisation induced by chemical disorder in small In–Pd NPs. Our discussion is based on the pseudo-pairwise electrostatic interaction (Ṽij(r)) defined as: | (1) |
![[r with combining circumflex]](https://www.rsc.org/images/entities/i_char_0072_0302.gif) ij is the distance operator between atom i and atom j and
ij is the distance operator between atom i and atom j and  values are ad-hoc localised electronic wave function basis vectors for electrons of atom i. The effective electrostatic potential (Ṽij(r)) for a given pair of atoms (ij) separated by a distance r is positive and negative when the ij interaction is repulsive and attractive, respectively. To estimate
  , we have performed a crystal orbital overlap population (COOP) analysis76 using the Lobster package77 which is coupled to the VASP software.78–80 All bonds with lengths below 5.5 Å have been considered. Then, we have computed the following quantity:
 | (2) |
 is the indicator function, which is equal to 1 if |rb − r| ≤ δr and 0 otherwise (δr is set to 0.55 Å). The radial 〈Ṽij〉 quantity defined in eqn (2) is an average of the Ṽij(r) electrostatic bond energies for ij atom pairs in the bond distance range of [rb − δr,rb + δr].
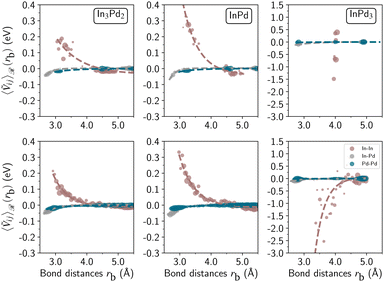
In Fig. 8 and in Table S3 (ESI†), we systematically compare, for a given composition, averaged Ṽij energies for chemically ordered and chemically disordered nanoparticles. The top row displays ordered WPPd whereas the bottom row represents disordered WPPd. Dots are brute data, their sizes are proportional to the number of bonds at a bond length equal to rb and dashed lines are fitted Pauling functions.81 For all compositions (In3Pd2, InPd, and InPd3), the magnitudes of electrostatic pair energies for In–In bonds are much larger than the ones of In–Pd and Pd–Pd. Therefore, we focus in the following on In–In bonds to investigate the stability. In InPd3 WPPd NPs, most In–In bonds are attractive, suggesting that In–In interactions tend to stabilise NPs. In InPd and In3Pd2 WPPd NPs, the In–In electrostatic pair energy is a monotonically decreasing function, with a high positive maximum close to rc = 3.0 Å (Fig. 8). Since positive values indicate repulsive interactions, the short In–In bonds in InPd and InPd2 WPPd NPs are destabilising. To avoid such non-favourable interactions, the structure is modified and as a consequence it induces amorphisation in the corresponding NP structures. It is also evidenced by Table S3 (ESI†), where differences appear between panel A (non-relaxed structures) and panel B (relaxed structures for InPd and In3Pd2 WPPd NPs (bottom line, left and middle columns), with a minimum appearing for r close to 3 Å.
Looking more precisely at the region, called ![[scr S, script letter S]](https://www.rsc.org/images/entities/char_e532.gif) , localised between 3 Å and 4 Å, relevant for the shortest In–In bonds and then meaningful for the stability, we found that
, localised between 3 Å and 4 Å, relevant for the shortest In–In bonds and then meaningful for the stability, we found that ![[scr S, script letter S]](https://www.rsc.org/images/entities/char_e532.gif) is an attractive (respectively, repulsive) domain for In–In bonds in InPd3 NPs (respectively, in InPd and In3Pd2 NPs). Based on the analysis performed in Section 2.3 (Fig. 6), we have recalculated the radial distribution functions, focusing on the
is an attractive (respectively, repulsive) domain for In–In bonds in InPd3 NPs (respectively, in InPd and In3Pd2 NPs). Based on the analysis performed in Section 2.3 (Fig. 6), we have recalculated the radial distribution functions, focusing on the ![[scr S, script letter S]](https://www.rsc.org/images/entities/char_e532.gif) domain (Fig. 9). We have plotted RDFs before and after the structural optimisation, i.e. we considered both non-relaxed (Fig. 9A) and relaxed (Fig. 9B) NPs. In each panel (A and B), the top and bottom rows display ordered and disordered WPPd NPs, respectively. In each sub-figure, the
domain (Fig. 9). We have plotted RDFs before and after the structural optimisation, i.e. we considered both non-relaxed (Fig. 9A) and relaxed (Fig. 9B) NPs. In each panel (A and B), the top and bottom rows display ordered and disordered WPPd NPs, respectively. In each sub-figure, the ![[scr S, script letter S]](https://www.rsc.org/images/entities/char_e532.gif) domain is highlighted in colour. The blue filled area represents the attractive In–In interactions in InPd3 NPs, while the red filled areas represent the repulsive In–In interactions in In3Pd2 and InPd NPs.
domain is highlighted in colour. The blue filled area represents the attractive In–In interactions in InPd3 NPs, while the red filled areas represent the repulsive In–In interactions in In3Pd2 and InPd NPs.
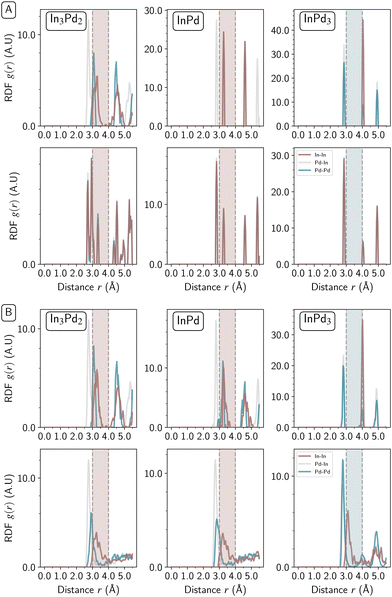 | ||
Fig. 9 Radial distribution function of In–In (brown), Pd–Pd (blue) and In–Pd (grey) bonds for small Pd-rich Wulff polyhedra nanoparticles (diameter 24 Å) of In3Pd2 (left), InPd (middle), and InPd3 (right) compounds. The top row displays ordered WPPd, whereas the bottom row represents disordered WPPd. Radial function distributions for non-relaxed and relaxed nanoparticles are shown in Fig. 9A (top) and B (bottom), respectively. Blue filled area represents the attractive domain of In–In interactions in InPd3 NPs. Red filled areas represent the repulsive domain of In–In interactions in In3Pd2 and InPd NPs. (![[scr S, script letter S]](https://www.rsc.org/images/entities/char_e532.gif) = [3.0 Å, 4.0 Å]). = [3.0 Å, 4.0 Å]). | ||
InPd3 NPs exhibit sharp In–In peaks within the stability domain ![[scr S, script letter S]](https://www.rsc.org/images/entities/char_e532.gif) , at r ≃ 3.0 Å and r ≃ 4.0 Å for both chemically ordered and disordered structures. After relaxation, peaks remain sharp notably for chemically disordered NPs. Such NPs are crystalline (Fig. 6, right), the crystalline character resulting from the attractive In–In interactions Fig. 6, right, plotted in brown). Both InPd and In3Pd2 NPs show similar behaviours, distinct from the one observed for InPd3, with sharp and large In–In RDF peaks in the
, at r ≃ 3.0 Å and r ≃ 4.0 Å for both chemically ordered and disordered structures. After relaxation, peaks remain sharp notably for chemically disordered NPs. Such NPs are crystalline (Fig. 6, right), the crystalline character resulting from the attractive In–In interactions Fig. 6, right, plotted in brown). Both InPd and In3Pd2 NPs show similar behaviours, distinct from the one observed for InPd3, with sharp and large In–In RDF peaks in the ![[scr S, script letter S]](https://www.rsc.org/images/entities/char_e532.gif) region for chemically ordered and disordered NPs, respectively. Upon relaxation, the RDF plots do not change much for ordered NPs, and at most there is a slight broadening of peaks for In–Pd NPs, while the RDF features are strongly modified in the case of disordered NPs. Based on the previous pair interaction analysis (Fig. 8), short In–In bonds (<3 Å) are highly repulsive, i.e. much more repulsive than in the
region for chemically ordered and disordered NPs, respectively. Upon relaxation, the RDF plots do not change much for ordered NPs, and at most there is a slight broadening of peaks for In–Pd NPs, while the RDF features are strongly modified in the case of disordered NPs. Based on the previous pair interaction analysis (Fig. 8), short In–In bonds (<3 Å) are highly repulsive, i.e. much more repulsive than in the ![[scr S, script letter S]](https://www.rsc.org/images/entities/char_e532.gif) region. Thus, bond lengths should increase to reduce energetically destabilising In–In interactions. Indeed, after relaxation, In–In RDF peaks disappeared at r < 3 Å, and the shortest In–In peak here lay at r = 3.3 Å. Hence, the combination of chemical disorder and In–In bond length increase is demonstrated to drive the tendency towards amorphisation of chemically disordered InPd and In3Pd2 NPs. To summarise, In–In interactions destabilise the chemically disordered In3Pd2 and InPd NPs, leading to amorphisation. In contrast, the favourable In–In interactions observed for InPd3 nanoparticles contribute to their stabilisation, and support their crystalline character.
region. Thus, bond lengths should increase to reduce energetically destabilising In–In interactions. Indeed, after relaxation, In–In RDF peaks disappeared at r < 3 Å, and the shortest In–In peak here lay at r = 3.3 Å. Hence, the combination of chemical disorder and In–In bond length increase is demonstrated to drive the tendency towards amorphisation of chemically disordered InPd and In3Pd2 NPs. To summarise, In–In interactions destabilise the chemically disordered In3Pd2 and InPd NPs, leading to amorphisation. In contrast, the favourable In–In interactions observed for InPd3 nanoparticles contribute to their stabilisation, and support their crystalline character.
2.5 NP work functions, impact of the surface composition and structure
The work function (WF), i.e. the energy barrier of an electron escaping from the surface, is a fundamental material property, with many applications, especially, those involving electron exchanges at the material's surface, such as adsorption. Thus, it is directly linked to catalytic properties, as illustrated in the literature.82,83 Although it lacks direct structural and chemical information, it can be a powerful tool to design optimised catalyst materials.57,84–90The first successful calculations of WFs for simple metal surfaces have been achieved on the basis of a jellium model and a slab method by Lang and Kohn91:
 | (3) |
![[Doublestruck R]](https://www.rsc.org/images/entities/char_e175.gif) 3N shows the system coordinates, εF is the Fermi level, VLP is the potential energy and 〈VLP〉(r,n) is its averaged value in a plane defined by n (normal surface vector). The computation of 〈VLP〉(r,n) is rather easy using slabs, but can be influenced by quantum-size effects, as discussed in the literature.92–94 Nevertheless, over the years, WFs have been computed for a wide range of materials, using this approach.95–99
3N shows the system coordinates, εF is the Fermi level, VLP is the potential energy and 〈VLP〉(r,n) is its averaged value in a plane defined by n (normal surface vector). The computation of 〈VLP〉(r,n) is rather easy using slabs, but can be influenced by quantum-size effects, as discussed in the literature.92–94 Nevertheless, over the years, WFs have been computed for a wide range of materials, using this approach.95–99
In the case of NPs, the previous pseudo one-dimension scheme cannot be used. Thus, we propose to introduce a new methodology to compute NP WFs, based on the Lang and Kohn's work91:
 | (4) |
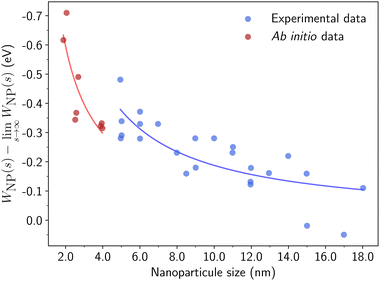 | ||
| Fig. 10 Direct comparison between computed and measured work functions for gold NPs. Experimental data (in blue) are extracted from ref. 100 and ab initio work functions (in red) are calculated based on our methodology. | ||
The WFs computed for crystalline and amorphous In–Pd NPs are presented in Fig. 11 (values in Table S4, and DOS in Fig. S2, ESI†). They are found to be of the same order of magnitude as infinite slabs, and rather different from the ones of pure In and pure Pd surfaces, thus highlighting an alloy effect, as frequently reported in the literature (for instance, see ref. 102,103). Our results suggest tiny size effects, since the work functions of larger NPs are larger than those of smaller particles with similar surface compositions. According to the jellium model, the difference in work functions is expected to be of the order of 0.07 eV.101,104 But we observed a smaller difference (0.03 eV) between the WFs of the 369 and 1105 atoms-InPd WPPd NPs with similar surface Pd contents (0.48 and 0.49 at%, respectively). The chemical potential drastically impacts NP WFs: for instance, the WFs of the small In3Pd2 WPPd and WPIn differ by roughly 0.15 eV, and reaches approximately 0.5 eV for InPd NPs. Moreover, the correlation of the WFs with the Pd surface content is clearly observed (Fig. 11), the correlation being roughly linear.
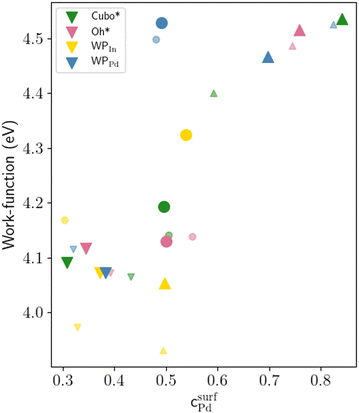 | ||
| Fig. 11 Work function (in eV) as a function of the surface Pd concentration (in at%). Small and large symbols correspond to small and large nanoparticles, respectively. Colours give the NP morphologies, while symbols give the compounds (∇In3Pd2, ○InPd, and ΔInPd3) from which they have been built. Data are gathered in Table S4 (ESI†). | ||
Finally, we quantitatively compare the WF difference between small ordered NPs described in Fig. 6 (top row) and small chemically disordered NPs, with same size and composition, generated randomly. Work functions of disordered NPs are gathered in Table 2, along with 〈ΔWNP〉, a parameter introduced to quantify the changes in WFs induced by disorder/amorphisation and defined by:
 | (5) |
 of 〈ΔWNP〉 is calculated based on its standard deviation σ(WNPdis). In all cases, the computed standard error is small in comparison to 〈ΔWNP〉, which means that values of 〈ΔWNP〉 are statistically significant.
On the one hand, the change in WFs (〈ΔWNP〉) for InPd3 WPPd NPs is tiny and slightly negative with a rather large – larger than in the other cases – standard error value. This is consistent with the previous structural analysis. Only small structural differences have been observed between ordered and disordered NPs in this case, the crystalline character of the InPd3 WPPd NP being kept when disorder is introduced. Thus, the WF modification (〈ΔWNP〉) only comes from a surface Pd content that may slightly differ from the one in the ordered NP.
On the other hand, the change in WFs (〈ΔWNP〉) for InPd and In3Pd2 WPPd NPs is positive and rather large, of the order of 0.2 eV. This result is quite different from the one for InPd3 WPPd NPs, and may be induced by the structural changes investigated above, especially, the tendency towards amorphisation observed for disordered WPPd InPd and In3Pd2 NPs. Here, the change in WFs mainly comes from the modification of the NP surface structure.
3 Conclusions
This study contributes to a better understanding of structure-properties in NPs, through the investigation of In–Pd NPs built from bulk In3Pd2, InPd and InPd3 intermetallics. According to surface energies, ordered NPs likely present crystalline forms, the Wulff polyhedron being the most stable NP shape in the range of 300–1200 atoms. A noticeable tendency towards amorphisation is observed when disorder is introduced in NPs built from In3Pd2 and InPd, driven by non-favourable In–In interactions. Tuning the NP surface structure and composition modifies the NP work function, with variations of the order of 0.5 eV. Non-crystalline morphologies, such as Ih or Dh, are not likely. This original behaviour compared to that observed in metals and TM–TM alloys, likely stems from the rather elevated formation enthalpy of pM–TM intermetallics.The current study is limited to three In–Pd phases with rather small crystal cells, and already gives important insights. More complex phases do exist in the phase diagram of In–Pd, thus challenging the interplay between bulk structures and 3-dimensional NP morphologies built from them. Indeed, in addition to the selection of the termination plane discussed in the present paper, several questions arise when considering more complex compounds. Actually, the approach based on the Wulff construction should be adapted in the case of facets whose structure is only a fraction of the periodic surface. More generally, when the crystal cell is much larger than the NP size, one may expect that the different parts of the crystal are not equivalent towards nanoparticle formation, as, for instance, the clusters generally used to represent the structure of such complex intermetallics.105 Finally, because most heterogeneous reactions catalysed by nanoparticles occur at relatively high temperatures, molecular dynamic simulations could be useful to identify dynamical modulations of NP morphologies during reactions.106
4 Computational details
Electronic structure spin polarised calculations have been performed for static NPs with the plane wave Vienna ab initio simulation package (VASP),78–80 using the projector augmented wave (PAW) method,107,108 the generalised gradient approximation (GGA-PBE),109,110 and an energy cutoff set to 450 eV. Ten valence electrons have been explicitly treated for Pd (5s1 4d9) and three for In (5s2 5p1).Total energies have been minimised until the energy differences became less than 10−5 eV between two electronic cycles. Atomic structures have been relaxed till the Hellmann–Feynman forces are as low as 0.01 eV Å−1. Structures were plotted using the OVITO software.111
For each composition, bulk-, slab- and nanoparticle-type calculations have been performed. The different systems have been built with ASE112 combined to MPInterfaces113 and pymatgen.114 The Brillouin zones of the different systems have been sampled with Γ-centred Monkhorst–Pack k-point meshes. Infinite surfaces have been modelled with symmetric slabs (Table S1, ESI†), separated by a void thickness larger than 20 Å. Nanoparticles have been computed in large cubic simulation boxes (parameter equal to 50 Å). Only one k-point has been used for the calculations with nanoparticles. The stabilities of the considered systems have been computed using formation enthalpies for bulk and NP stems (Table 1 and Table S5, ESI†) and surface energies as a function of the Pd's chemical potential for slabs (see the ESI,† Section S2).115 For NPs, historically, stabilities are evaluated through the Δ descriptor:
 | (6) |
 , which is not accurate for small NPs. In this work, stabilities of NPs are evaluated through surface energies (γNP):
 | (7) |
| (x + y)ΔHf(InxPdy) = x(μPd − μPdb) + y(μIn − μInb) | (8) |
Assuming an equilibrium between the surface and the underlying NP core (assimilated to bulk), the chemical potentials are confined in a given range, i.e.
 | (9) |
Conflicts of interest
There are no conflicts to declare.Acknowledgements
This work was granted access to the high performance computing (HPC) resources of IDRIS and TGCC under the allocation 99642 attributed by GENCI. HPC resources were also partially provided by the EXPLOR centre hosted by the Université de Lorraine (project 2017M4XXX0108). One of us thanks Dr David Loffreda for fruitful discussions. This work is supported by the European Integrated Centre for the Development of New Metallic Alloys and Compounds. Some of us acknowledge financial support through the COMETE project (COnception in silico de Matériaux pour l’EnvironnemenT et l’énergie) cofunded by the European Union under the program FEDER-FSE Lorraine et Massif des Vosges 2014-2020. One of us thanks financial support from “Lorraine Université d’Excellence”.References
- I. Freestone, N. Meeks, M. Sax and C. Higgitt, Gold Bull., 2007, 40, 270 CrossRef CAS.
- J. Jeevanandam, A. Barhoum, Y. Chan, A. Dufresne and M. Danquah, Beilstein J. Nanotechnol., 2018, 9, 1050 CrossRef CAS PubMed.
- Fundamentals and Applications of Nano Silicon in Plasmonics and Fullerines, ed. M. Nayfeh, Elsevier, 2018, pp. 497–518 Search PubMed.
- E. C. Dreaden, A. M. Alkilany, X. Huang, C. J. Murphy and M. A. El-Sayed, Chem. Soc. Rev., 2012, 41, 2740 RSC.
- C. Shasha and K. Krishnan, Adv. Mater., 2021, 33, 1904131 CrossRef CAS PubMed.
- S. Campora and G. Ghersi, Nanotechnol. Rev., 2022, 11, 2595 CrossRef CAS.
- H. You, S. Yang, B. Ding and H. Yang, Chem. Soc. Rev., 2013, 42, 2880 RSC.
- D. J. de Aberasturi, A. B. Serrano-Montes and L. M. Liz-Marzan, Adv. Opt. Mater., 2015, 3, 602 CrossRef.
- A. Kumar, P. Choudhary, A. Kumar, P. H. C. Camargo and V. Krishn, Small, 2022, 18, 2101638 CrossRef CAS PubMed.
- J. A. Darr, J. Zhang, N. M. Makwana and X. Weng, Chem. Rev., 2017, 117, 11125 CrossRef CAS PubMed.
- L. Wang, M. H. Kafshgari and M. Meunier, Adv. Funct. Mater., 2020, 30, 2005400 CrossRef CAS.
- J. Grunes, J. Zhu and G. Somorjai, Chem. Commun., 2003, 2257 RSC.
- T. Bligaard and J. Norskov, in Chemical Bonding at Surfaces and Interfaces, ed. A. Nilsson, L. G. Pettersson and J. K. Norskov, Elsevier, 2008, Chapter 4 – Heterogeneous Catalysis, p. 255 Search PubMed.
- J. R. Ludwig and C. S. Schindler, Chem, 2017, 2, 313 CAS.
- D. Wang and D. Astruc, Chem. Soc. Rev., 2017, 46, 816 RSC.
- M. Haruta, T. Kobayashi, H. Sano and N. Yamada, Chem. Lett., 1987, 405 CrossRef CAS.
- S. Vukojevic, O. Trapp, J.-D. Grunwaldt, C. Kiener and F. Schüth, Angew. Chem., 2005, 117, 8192 CrossRef.
- X. Liu, J. Iocozzia, Y. Wang, X. Cui, Y. Chen, S. Zhao and Z. Li, Energy Environ. Sci., 2017, 10, 402 RSC.
- Z. W. Seh, J. Kibsgaard, C. F. Dickens, I. Chorkendorff, J. K. Norskov and T. F. Jaramillo, Science, 2017, 355, eaad4998 CrossRef.
- L. Liu and A. Corma, Chem. Rev., 2018, 118, 4981 CrossRef CAS PubMed.
- A. Medford, A. Vojvodic, J. S. Hummelshoj, J. Voss, F. Abild-Pedersen, F. Studt, T. Bligaard, A. Nilsson and J. K. Norskov, J. Catal., 2015, 328, 36 CrossRef CAS.
- J. Norskov, F. Studt, F. Abild-Pedersen and T. Bligaard, Fundamental Concepts in Heterogeneous Catalysis, John Wiley & Sons Inc., 2014 Search PubMed.
- A. Vojvodic and J. K. Nørskov, Natl. Sci. Rev., 2015, 2, 140 CrossRef CAS.
- M. Armbruester, Sci. Technol. Adv. Mater., 2020, 21, 303 CrossRef CAS.
- Y. Nakaya and S. Furukawa, Chem. Rev., 2023, 123, 5859 CrossRef CAS PubMed.
- B. G. Pollet, S. S. Kocha and I. Staffell, Curr. Opin. Electrochem., 2019, 16, 90 CrossRef CAS.
- V. Stamenkovic, T. Schmidt, P. Ross and N. Markovic, J. Electroanal. Chem., 2003, 554, 191 CrossRef.
- V. R. Stamenkovic, B. Fowler, B. S. Mun, G. Wang, P. N. Ross, C. A. Lucas and N. M. Markovic, Science, 2007, 315, 493 CrossRef CAS PubMed.
- R. Ferrando, J. Jellinek and R. L. Johnston, Chem. Rev., 2008, 108, 845 CrossRef CAS PubMed.
- A. Jain, S. P. O. G. Hautier, W. Chen, W. D. Richards, W. Dacek, S. Cholia, D. Gunter, D. Skinner, G. Ceder and K. A. Persson, APL Mater., 2013, 1, 011002 CrossRef.
- J. E. Montoya-Cardona, A. Salichon, N. Tarrat, E. Gaudry and D. Loffreda, J. Phys. Chem. C, 2023, 127, 18043 CrossRef.
- N. Köwitsch, L. Thoni, B. Klemmed, A. Benad, P. Paciok, M. Heggen, I. Köwitsch, M. Mehring, A. Eychmüller and M. Armbrüster, ACS Catal., 2021, 11, 304–312 CrossRef.
- A. Garcia-Trenco, A. Regoutz, E. R. White, D. J. Payne, M. S. Shaffer and C. K. Williams, Appl. Catal., B, 2018, 220, 9 CrossRef CAS.
- P. Wu and B. Yang, Catal. Sci. Technol., 2019, 9, 6102 RSC.
- Z. Wu, E. Wegener, H.-T. Tseng, J. R. Gallagher, J. W. Harris, R. E. Diaz, Y. Ren, F. H. Ribeiro and J. T. Miller, Catal. Sci. Technol., 2016, 6, 6965 RSC.
- Y. Luo, S. Alarcón Villaseca, M. Friedrich, D. Teschner, A. Knop-Gericke and M. Armbrüster, J. Catal., 2016, 338, 265–272 CrossRef CAS.
- Y. Cao, Z. Sui, Y. Zhu, X. Zhou and D. Chen, ACS Catal., 2017, 7, 7835–7846 CrossRef CAS.
- P. Markov, A. Bukhtiyarov, I. Mashkovsky, N. S. Smirnova, I. P. Prosvirin, Z. S. Vinokurov, M. A. Panafidin, G. N. Baeva, Y. V. Zubavichus, V. I. Bukhtiyarov and A. Y. Stakheev, Kinet. Catal., 2019, 60, 842 CrossRef CAS.
- S. Chen, X. Huang, D. Schild, D. Wang, C. Kübel and S. Behrens, Nanoscale, 2022, 14, 17661 RSC.
- D. Pavesi, F. S. M. Ali, D. Anastasiadou, T. K. M. Figueiredo, G.-J. M. Gruter, M. T. M. Koper and K. J. P. Schouten, Catal. Sci. Technol., 2020, 10, 4264 RSC.
- Q. Feng, S. Zhao, Y. Wang, J. Dong, W. Chen, D. He, D. Wang, J. Yang, Y. Zhu, H. Zhu, L. Gu, Z. Li, Y. Liu, R. Yu, J. Li and Y. Li, J. Am. Chem. Soc., 2017, 139, 7294–7301 CrossRef CAS PubMed.
- C. Wolverton and V. Ozolins, Phys. Rev. B: Condens. Matter Mater. Phys., 2006, 73, 144104 CrossRef.
- R. Ferro and A. Saccone, Intermetallic Chemistry, Pergamon Elsevier, Oxford, UK, 2008 Search PubMed.
- C. White and H. Okamoto, Phase Diagrams of Indium Alloys and their Engineering Applications, 1992 Search PubMed.
- M. Neumann, D. Teschner, A. Knop-Gericke, W. Reschetilowski and M. Armbruester, J. Catal., 2016, 340, 49 CrossRef CAS.
- J. Pirart, A. Front, D. Rapetti, C. Andreazza-Vignolle, P. Andreazza, C. Mottet and R. Ferrando, Nat. Commun., 2019, 10, 1982 CrossRef CAS PubMed.
- F. Tournus, K. Sato, T. Epicier, T. J. Konno and V. Dupuis, Phys. Rev. Lett., 2013, 110, 055501 CrossRef CAS PubMed.
- J. Penuelas, P. Andreazza, C. Andreazza-Vignolle, H. C. N. Tolentino, M. De Santis and C. Mottet, Phys. Rev. Lett., 2008, 100, 115502 CrossRef CAS PubMed.
- M. Zhou, C. Li and J. Fang, Chem. Rev., 2021, 121, 736 CrossRef CAS PubMed.
- P. Makkar and N. N. Ghosh, RSC Adv., 2021, 11, 27897 RSC.
- H. Demir and L. C. Grabow, ACS Appl. Nano Mater., 2020, 3, 6127 CrossRef CAS.
- D. Vollath, F. Fischer and D. Holec, Beilstein J. Nanotechnol., 2018, 9, 2265 CrossRef CAS PubMed.
- H. Amara, J. Nelayah, J. Creuze, A. Chmielewski, D. Alloyeau, C. Ricolleau and B. Legrand, Phys. Rev. B, 2022, 105, 165403 CrossRef CAS.
- A. Chmielewski, J. Nelayah, H. Amara, J. Creuze, D. Alloyeau, G. Wang and C. Ricolleau, Phys. Rev. Lett., 2018, 120, 025901 CrossRef CAS PubMed.
- L. Lin, R. Jacobs, T. Ma, D. Chen, J. Booske and D. Morgan, Phys. Rev. Appl., 2023, 19, 037001 CrossRef CAS.
- F. Calle-Vallejo, M. T. M. Koper and A. S. Bandarenka, Chem. Soc. Rev., 2013, 42, 5210 RSC.
- S. Trasatti, J. Electroanal. Chem., 1972, 39, 163 CrossRef CAS.
- H. Kohlmann, J. Solid State Chem., 2010, 183, 367 CrossRef CAS.
- I. Harris, M. Norman and A. W. Bryant, J. Less-Common Met., 1968, 16, 427 CrossRef CAS.
- C. Garnero, M. Lepesant, C. Garcia-Marcelot, Y. Shin, C. Meny, P. Farger, B. Warot-Fonrose, R. Arenal, G. Viau, K. Soulantica, P. Fau, P. Poveda, L.-M. Lacroix and B. Chaudret, Nano Lett., 2019, 19, 1379–1386 CrossRef CAS PubMed.
- A. Front and C. Mottet, J. Phys. Chem. C, 2021, 125, 16358–16365 CrossRef CAS.
- Y. Yang, C.-C. Chen, M. C. Scott, C. Ophus, R. Xu, A. Pryor, L. Wu, F. Sun, W. Theis, J. Zhou, M. Eisenbach, P. R. C. Kent, R. F. Sabirianov, H. Zeng, P. Ercius and J. Miao, Nature, 2017, 542, 75–79 CrossRef CAS PubMed.
- S. Amore, S. Delsante, N. Parodi and G. Borzone, Thermochim. Acta, 2009, 481, 1 CrossRef CAS.
- A. Ciccioli, G. Balducci, G. Gigli, L. Perring and F. Bussy, Intermetallics, 2000, 8, 195 CrossRef CAS.
- A. Ormeci, E. Gaudry, M. Armbrüster and Y. Grin, ChemistryOpen, 2022, 11 Search PubMed.
- N. Roy, A. Chakrabarty, B. Koley, T. Saha-Dasgupta and P. P. Jana, J. Solid State Chem., 2020, 290, 121567 CrossRef CAS.
- G. Wulff, Z. Kristallogr. - Cryst. Mater., 1901, 34, 449–530 CrossRef CAS.
- H. Wang, S. Zhou, K. D. Gilroy, Z. Cai and Y. Xia, Nano Today, 2017, 15, 121–144 CrossRef CAS.
- G. Casillas, J. J. Velazquez-Salazar and M. Jose-Yacaman, J. Phys. Chem. C, 2012, 116, 8844 CrossRef CAS PubMed.
- A. Front and C. Mottet, J. Phys. Chem. C, 2021, 125, 16358–16365 CrossRef CAS.
- A. Front and C. Mottet, Theor. Chem. Acc., 2022, 141, 2 Search PubMed.
- K. Loza, M. Heggen and M. Epple, Adv. Funct. Mater., 2020, 30, 1909260 CrossRef CAS.
- B. Farkas and N. H. de Leeuw, Nanotechnology, 2020, 31, 195711 CrossRef CAS PubMed.
- H. Yang, K. Wang, Z. Tang, Z. Liu and S. Chen, J. Catal., 2020, 382, 181–191 CrossRef CAS.
- D. Alloyeau, C. Ricolleau, C. Mottet, T. Oikawa, C. Langlois, Y. Le Bouar, N. Braidy and A. Loiseau, Nat. Mater., 2009, 8, 940 CrossRef CAS PubMed.
- R. Dronskowski and P. E. Bloechl, J. Phys. Chem., 1993, 97, 8617–8624 CrossRef CAS.
- S. Maintz, V. L. Deringer, A. L. Tchougréeff and R. Dronskowski, J. Comput. Chem., 2016, 37, 1030–1035 CrossRef CAS PubMed.
- G. Kresse and J. Hafner, Phys. Rev. B: Condens. Matter Mater. Phys., 1993, 47, 558–561 CrossRef CAS PubMed.
- G. Kresse and J. Furthmüller, Comput. Mater. Sci., 1996, 6, 15–50 CrossRef CAS.
- G. Kresse and J. Furthmüller, Phys. Rev. B: Condens. Matter Mater. Phys., 1996, 54, 11169–11186 CrossRef CAS PubMed.
- L. Pauling, The Nature of the Chemical Bond—An Introduction to Modern Structural Chemistry, Cornell University Press, New-York, 1960 Search PubMed.
- T. Liu, C. Xi, C. Dong, C. Cheng, J. Qin, S. Hu, H. Liu and X.-W. Du, J. Phys. Chem. C, 2019, 123, 28319–28326 CrossRef CAS.
- A. M. Ismail, E. Csapó and C. Janáky, Electrochim. Acta, 2019, 313, 171–178 CrossRef CAS.
- X. Luo, R. Jiang, Z. Ma, T. Yang, H. Liu, W. Wu, C. Dong and X.-W. Du, Phys. Chem. Chem. Phys., 2022, 24, 9188 RSC.
- C. Vayenas, S. Bebelis and S. Ladas, Nature, 1990, 343, 625 CrossRef CAS.
- B. Caglar, A. C. Kizilkaya, J. W. Niemantsverdriet and C. J. Weststrate, Catal., Struct. React., 2018, 4, 1 CAS.
- C. Beasley, M. K. Gnanamani, E. Santillan-Jimenez, M. Martinelli, W. D. Shafer, S. D. Hopps, N. Wanninayake and D.-Y. Kim, ChemistrySelect, 2020, 5, 1013 CrossRef CAS.
- X. Wang, G. Zhang, L. Yang, E. Sharman and J. Jiang, WIREs Comput. Mol. Sci., 2018, 8, e1369 CrossRef.
- A. Zeradjanin, A. Vimalanandan, G. Polymeros, A. A. Topalov, K. J. J. Mayrhofer and M. Rohwerder, Phys. Chem. Chem. Phys., 2017, 19, 17019 RSC.
- Y. Zhou, G. Zhang, Q. Ji, W. Zhang, J. Zhang and H. Liu, Environ. Sci. Technol., 2019, 53, 11383 CrossRef CAS PubMed.
- N. D. Lang and W. Kohn, Phys. Rev. B: Solid State, 1971, 3, 1215–1223 CrossRef.
- N. E. Singh-Miller and N. Marzari, Phys. Rev. B: Condens. Matter Mater. Phys., 2009, 80, 235407 CrossRef.
- S. De Waele, K. Lejaeghere, M. Sluydts and S. Cottenier, Phys. Rev. B, 2016, 94, 235418 CrossRef.
- J. C. Boettger, Phys. Rev. B: Condens. Matter Mater. Phys., 1996, 53, 13133 CrossRef CAS PubMed.
- J. Wang and S.-Q. Wang, Surf. Sci., 2014, 630, 216–224 CrossRef CAS.
- D.-P. Ji, Q. Zhu and S.-Q. Wang, Surf. Sci., 2016, 651, 137–146 CrossRef CAS.
- S.-H. Yoo, N. Siemer, M. Todorova, D. Marx and J. Neugebauer, J. Phys. Chem. C, 2019, 123, 5495–5506 CrossRef CAS.
- R. Tran, X.-G. Li, J. H. Montoya, D. Winston, K. A. Persson and S. P. Ong, Surf. Sci., 2019, 687, 48–55 CrossRef CAS.
- T. T. Dorini, F. Brix, C. Chatelier, A. Kokalj and E. Gaudry, Nanoscale, 2021, 13, 10771–10779 RSC.
- Y. Zhang, O. Pluchery, L. Caillard, A.-F. Lamic-Humblot, S. Casale, Y. J. Chabal and M. Salmeron, Nano Lett., 2015, 15, 51 CrossRef CAS PubMed.
- E. Kalered, N. Brenning, I. Pilch, L. Caillault, T. Minea and L. Ojamae, Phys. Plasmas, 2017, 24 Search PubMed.
- S. C. Fain and J. M. McDavid, Phys. Rev. B: Solid State, 1974, 9, 5099 CrossRef CAS.
- P. D. Swartzentruber, M. J. Detisch and T. J. Balk, J. Vac. Sci. Technol., 2015, 33, 021405 CrossRef.
- K. F. Wojciechowski, Phys. Rev. B: Condens. Matter Mater. Phys., 1999, 60, 9202 CrossRef CAS.
- T. G. Akhmetshina, V. A. Blatov, D. M. Proserpio and A. P. Shevchenko, Acc. Chem. Res., 2018, 51, 21 CrossRef CAS PubMed.
- X. Liu, X. Wen and R. Hoffmann, ACS Catal., 2018, 8, 3365 CrossRef CAS.
- P. E. Blöchl, Phys. Rev. B: Condens. Matter Mater. Phys., 1994, 50, 17953–17979 CrossRef PubMed.
- G. Kresse and D. Joubert, Phys. Rev. B: Condens. Matter Mater. Phys., 1999, 59, 1758–1775 CrossRef CAS.
- J. P. Perdew, K. Burke and M. Ernzerhof, Phys. Rev. Lett., 1996, 77, 3865 CrossRef CAS PubMed.
- J. P. Perdew, K. Burke and M. Ernzerhof, Phys. Rev. Lett., 1997, 78, 1396 CrossRef CAS.
- A. Stukowski, Modell. Simul. Mater. Sci. Eng., 2009, 18, 015012 CrossRef.
- A. H. Larsen, J. J. Mortensen, J. Blomqvist, I. E. Castelli, R. Christensen, M. Dulak, J. Friis, M. N. Groves, B. Hammer, C. Hargus, E. D. Hermes, P. C. Jennings, P. B. Jensen, J. Kermode, J. R. Kitchin, E. L. Kolsbjerg, J. Kubal, K. Kaasbjerg, S. Lysgaard, J. B. Maronsson, T. Maxson, T. Olsen, L. Pastewka, A. Peterson, C. Rostgaard, J. Schiøtz, O. Schütt, M. Strange, K. S. Thygesen, T. Vegge, L. Vilhelmsen, M. Walter, Z. Zeng and K. W. Jacobsen, J. Phys.: Condens.Matter, 2017, 29, 273002 CrossRef PubMed.
- K. Mathew, A. K. Singh, J. J. Gabriel, K. Choudhary, S. B. Sinnott, A. V. Davydov, F. Tavazza and R. G. Hennig, Comput. Mater. Sci., 2016, 122, 183–190 CrossRef CAS.
- S. P. Ong, W. D. Richards, A. Jain, G. Hautier, M. Kocher, S. Cholia, D. Gunter, V. L. Chevrier, K. A. Persson and G. Ceder, Comput. Mater. Sci., 2013, 68, 314–319 CrossRef CAS.
- Émilie Gaudry, in Comprehensive Inorganic Chemistry III, ed. J. Reedijk and K. R. Poeppelmeier, Elsevier, Oxford, 3rd edn, 2023, pp. 74–104 Search PubMed.
- M. Krone, J. Stone, T. Ertl and K. Schulten, EuroVis - Short Papers, 2012.
Footnote |
| † Electronic supplementary information (ESI) available. See DOI: https://doi.org/10.1039/d3nh00594a |
| This journal is © The Royal Society of Chemistry 2024 |

