 Open Access Article
Role of additive size in the segmental dynamics and mechanical properties of cross-linked polymers†
Xiangrui
Zheng
a,
Lan
Xu
b,
Jack F.
Douglas
 *c and
Wenjie
Xia
 *b
*b
aDepartment of Mechanics, School of Aerospace Engineering, Huazhong University of Science and Technology, Wuhan, 430074, China
bDepartment of Aerospace Engineering, Iowa State University, Ames, Iowa 50011, USA. E-mail: wxia@iastate.edu
cMaterials Science and Engineering Division, National Institute of Standards and Technology, Gaithersburg, Maryland 20899, USA. E-mail: jack.douglas@nist.gov
First published on 27th August 2024
Abstract
Thermoset materials often involve the addition of molecular and nanoparticle additives to alter various chemo-physical properties of importance in their ultimate applications. The resulting compositional heterogeneities can lead to either enhancement or degradation of thermoset properties, depending on the additive chemical structure and concentration. We tentatively explore this complex physical phenomenon through the consideration of a model polymeric additive to our coarse-grained (CG) thermoset investigated in previous works by simply varying the size of additive segments compared to those of polymer melt. We find that the additive modified thermoset material becomes chemically heterogeneous from additive aggregation when the additive segments become much smaller than those of the thermoset molecules, and a clear evidence is observed in the spatial distribution of local molecular stiffness estimated from Debye–Waller factor 〈u2〉. Despite the non-monotonic variation trends observed in dynamical and mechanical properties with decreasing additive segmental size, both the structural relaxation time and moduli (i.e., shear modulus and bulk modulus) exhibit scaling laws with 〈u2〉. The present work highlights the complex role of additive size played in the dynamical and mechanical properties of thermoset polymers, which should provide a better understanding for the glass formation process of cross-linked polymer composites.
1. Introduction
Cross-linked polymers have been widely used in various applications due to their light weight, superior mechanical properties, and thermal and chemical stability.1,2 However, for some cross-linked polymers, their normally highly cross-linked nature results in some inherent disadvantages, such as brittleness, poor fatigue resistance and low impact resistance, which severely impedes their further applications.3 The introduction of additives provides a promising strategy to tune the dynamics and mechanical properties of cross-linked polymers.4–7 For example, plasticizers reduce the glass transition temperature (Tg) and improve the flexibility and ductility of polymers,8–10 while anti-plasticizer additives normally result in a decrease in Tg and the fragility of glass formation, but an increase in the stiffness of polymer material to which they are added in the glassy state.11,12Numerous previous studies have indicated the addition of additives provides a promising strategy to tune the mechanical properties of polymers based on the additive distribution in the polymer matrix. In particular, the introduction of additives into epoxy resins could efficiently improve the fracture toughness, impact resistance and heat stability of cross-linked polymers by the phase separation occurred at the micro and nanoscale.13–19 As an specific example, Zhang and coworkers systematically investigated the influence of frequently used thermoplastics, such as hydroxyl terminated polyethersulfone (PES),3 polysulfone (PSF)14 and polyetherketone cardo (PEK-C),20 on the phase morphology and mechanical properties of epoxy resin. With the increasing content of thermoplastics, the phase structure of blends presented uniformly dispersed particles, bi-continuous and phase inverted structures, where the greatest enhancement effect in the fracture toughness and impact strength were obtained in epoxy/thermoplastic blends with a bi-continuous phase structure. Apart from the toughening effect, the additives also showed potential for tuning the microstructure of epoxy resin. Recently, Zhao et al.21 introduced fumed silica into epoxy resin to fine control the microstructure of polymer blends by phase separation, where the structure of epoxy resin was improved to form a porous material with smaller pore size as the content of fumed silica increased, and at the same time, the fumed silica could be removed without affecting the matrix and skeleton structure of the porous material.
Even if there is no phase separation between polymer matrix and additives, varying the additive chemical structure,9,22,23 concentration,24–26 size,27–29 stiffness30–32 and the polymer–additive interaction strength,24,33,34 can also influence the relaxation dynamics and mechanical properties of thermoset materials. In particular, additive size can exert a complex influence on the performances of glass-forming polymers. Cheng et al.35 systematically compared the effect of nanoparticle size on the structural dynamics of poly(2-vinylpyridine) where the Tg and fragility of glass formation were found to exhibit dramatic changes with the increasing concentration of attractive nanoparticles having a size on the order of the polymer segments, while only small property changes were found when SiO2 additive particles having a diameter of 25 nm were added. Ash and coworkers36 investigated how the size of alumina nanoparticles influenced the mechanical properties of poly(methyl methacrylate), where the introduction of relatively large 38 nm alumina nanoparticles resulted in a brittle-to-ductile transition of the composite thermoset material in uniaxial tension, along with an increase in the strain of failure. On the other hand, 17 nm additives showed similar brittle behavior as neat poly(methyl methacrylate). It is notable that the smaller 17 nm additives tended to aggregate, so that these particles could not be uniformly dispersed. Finally, experiments performed by Serenko et al.37 indicated that the aggregation of rigid polyphenylene dendrimers caused degraded polymer properties in comparison to the pure polymer material.38,39 It is evidently important to better understand the relationship between additive size and additive–polymer matrix interaction on phase separation and the influence of additive phase separation on the thermodynamical, dynamical and mechanical properties of polymers in order to improve the functional performance of cross-linked polymer materials.
Compared to experiments, computational simulations provide details at a molecular scale that can be helpful in developing and understanding structure–property relationships of complex polymer materials, although the inherent limited simulation timescale can be a serious drawback in practice. For example, the increased local shear modulus in the vicinity of nanoparticle surface indicated that there was a glassy layer surrounding the nanoparticle, and the shear modulus of the glassy layer gradually decreased as the particle size got smaller.27 Recent molecular dynamics (MD) simulations performed by Starr and coworkers40,41 also demonstrated that the length scale of interfacial zone describing the range of altered dynamics around model nanoparticle additives decreased with the decreasing nanoparticle size at a strong interfacial interaction. Apart from nanoparticle additives, Zirdehi et al.28,29 found that altering the segment size of model polymeric additive molecules over a wide range had a significant effect on the relaxation dynamics of polymeric and other model glass-forming materials, in which the relaxation time at low temperatures and characteristic temperatures of glass formation both exhibited a non-monotonic dependence on the additive segment size at a fixed additive concentration. They speculated that the non-monotonic size-effect might be attributed to the local packing efficiency and coupling of the dynamics between the polymer matrix and additives. A similar non-monotonic variation in relaxation time of coarse-grained (CG) polymer melts with spherical particle additives having a range of sizes was observed recently by McKenzie-Smith and coworkers,42 where the relaxation time of polymer melts was well-described by the localization model (LM) emphasizing average molecular displacements on a picosecond timescale, i.e., “dynamic free volume”. In addition, MD simulations on binary mixtures of particles having different sizes have previously indicated that a large size ratio of particles promoted a tendency towards phase separation.43,44 In view of these observations on how varying particle or additive segment size affects the performances of polymer matrix,36,37,45,46 we infer that varying the segment size of molecular additives could induce significant alterations in mechanical and dynamical properties even when the polymer-matrix interaction strength is relatively attractive as consequence of the normally low entropy of mixing of polymer materials. Such an effect can be expected to be particularly large when there is a large asymmetry in the additive and matrix bead sizes. We thus arrive at a simple CG model for exploring the influence of additive size on the glass-forming properties of thermoset materials with additives.
In our pervious works,47–49 we systematically investigated the influence of cross-link density, cohesive interaction strength and chain stiffness on the relaxation dynamics and mechanical properties of pure cross-linked polymers using CG-MD simulation, where qualitative trends were found to accord rather well with experiments on thermoset materials.50–52 Recent MD simulations on the glass formation of cross-linked polymer/additive mixtures having a wide range of cross-link densities indicated that introduction of additives can lead to a decrease in the characteristic temperatures and fragility of glass formation, and these changes are often accompanied by significant changes in the material moduli.53
Considering the practical significance of additives on the mechanical properties of thermoset materials, we systematically explore the structure, structural relaxation dynamics and mechanical properties for glass-forming cross-linked polymers with polymeric additives having variable additive segment size, but a fixed concentration to keep the simulations within manageable proportions. The findings of our exploratory study provide key physical insights into how additive segment size affects the segmental dynamics and mechanical properties of cross-linked polymer materials. This knowledge should be helpful in arriving at a better control of molecular parameters of real thermoset materials.
2. Model and simulation details
2.1 Coarse-grained (CG) model
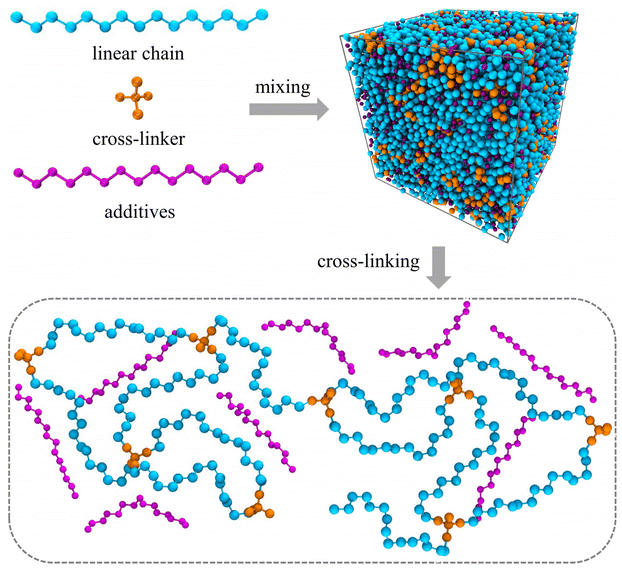
The molecular models of cross-linked polymer and additives are represented by a widely used bead-spring model in the CG-MD simulations on glass-forming polymers.54 The cross-linked polymer is composed of 686 linear chains with a chain length of 15 beads and 343 tetra-functional star cross-linkers. In addition, 200 linear additive molecules consisting of 15 beads with varying bead size are introduced into the system, i.e., the mass fraction of additive particles defined as the ratio of the mass of additive particles to the total mass of particles in the polymer/additives mixture is kept constant at ∼20%. The linear chains, cross-linkers and additives are initially randomly mixed in a large simulation box with periodic boundary conditions in all directions (Fig. 1).The non-bonded interactions are represented by the standard truncated and shifted Lennard-Jones (LJ) potential,
 | (1) |
| Uharm(r) = ½kb(r − r0)2 | (2) |
Ubend(θ) = kθ[1 + cos![[thin space (1/6-em)]](https://www.rsc.org/images/entities/char_2009.gif) (θ)] (θ)] | (3) |
2.2 Simulation details
All the MD simulations were performed in large scale atomic/molecular massively parallel simulator (LAMMPS) software.59 The mixture of linear chains, cross-linkers and additives were first relaxed in a constant-pressure and constant-temperature (NPT) ensemble at a high temperature T = 1.5ε/kB and a pressure P = 0.0ε/σ3 for t = 104τLJ to ensure that the linear chains, cross-linkers and additives were homogenously mixed. Then, the mixture was progressively cooled down to T = 1.0ε/kB over a period of t = 104τLJ. Finally, the system was equilibrated at T = 1.0ε/kB in NPT ensemble for t = 2 × 10⁴τLJ, following a canonical (NVT) ensemble for t = 104τLJ. Subsequently, a cross-linking and multiple relaxation algorithm proposed by Varshney et al.60 was utilized to cross-link the linear chains and cross-linkers into a polymer network, which has successfully captured the thermodynamics and mechanical properties of highly cross-linked polymers.60–62 The end beads in linear chains and cross-linkers were set as the reactive beads, which could form new chemical bonds, where the stoichiometric ratio of reactive beads in linear chains and cross-linkers was 1![[thin space (1/6-em)]](https://www.rsc.org/images/entities/char_2009.gif) :
:![[thin space (1/6-em)]](https://www.rsc.org/images/entities/char_2009.gif) 1. When the distance of two end beads located in linear chains and cross-linkers respectively was less than 1.3σ, a new covalent bond was introduced between the two beads. Then a NPT relaxation was performed at T = 1.0ε/kB over a period of t = 5 × 10³τLJ to reduce the energy fluctuations resulted by the new formed covalent bonds. The cross-link density defined as the ratio of reacted end beads to the total number of ends beads of linear chains was 94% for the final cross-linked polymers.
1. When the distance of two end beads located in linear chains and cross-linkers respectively was less than 1.3σ, a new covalent bond was introduced between the two beads. Then a NPT relaxation was performed at T = 1.0ε/kB over a period of t = 5 × 10³τLJ to reduce the energy fluctuations resulted by the new formed covalent bonds. The cross-link density defined as the ratio of reacted end beads to the total number of ends beads of linear chains was 94% for the final cross-linked polymers.
Three models were independently established and cross-linked to get rid of the effect of configuration and cross-linked structure. After cross-linking the polymer, we systematically modified the additives size in the cross-linked polymer/additive mixtures varying from 0.3σ to 1.0σ in order to investigate the effect of additive size, while the additives mass fraction, polymer–additives interaction strength parameter εap and cross-link density of cross-linked polymer were all fixed. The mixtures were first relaxed using NPT ensemble at a high temperature T = 2.0ε/kB, while the pressure varied in the range from 10.0ε/σ3 to 0.0ε/σ3 for two cycles over a period of 104τLJ. Then, the cross-linked polymer/additive mixtures with varying additive size were sufficiently relaxed at a constant pressure P = 0.0ε/σ3 for t = 2 × 10⁴τLJ in NPT ensemble, followed by a NVT relaxation over a period of 104τLJ. For the equilibrated systems, a quenching process from a high temperature T = 2.0ε/kB to a low temperature T = 0.1ε/kB in a stepwise fashion with a temperature step size of ΔT = 0.05ε/kB was performed. At each temperature, the polymers were successively relaxed in NPT ensemble for t = 2 × 10⁴τLJ and in NVT ensemble for 104τLJ, then the configurations were collected at the end of each run. The mixture systems with different additive bead size are denoted as σa = x, which means that the bead size of additives is x in the corresponding cross-linked polymer/additive mixture model.
3. Results and discussion
3.1 Thermodynamical properties
We first analyze the influence of additive size on the fundamental thermodynamical properties, including density ρ, reduced thermal expansion coefficient and dimensionless isothermal compressibility
  , which are summarized in Fig. S1 in the ESI.† Compared to pure cross-linked polymer without any additives, the introduction of additives leads to an increase in ρ and a slight decrease in
  and
and  . Additives with smaller bead size result in a remarkably large ρ but a similar
  and
and  as the pure polymer.
Besides the basic thermodynamical properties, the static structure factor characterizing the material “structure” in terms of local density variations is measured at T = 1.0ε/kB for cross-linked polymer/additive mixtures with a wide range of additive bead size. The static structure factor S(q), which describes the mean correlations in the positions of segments, is defined as,
 | (4) |
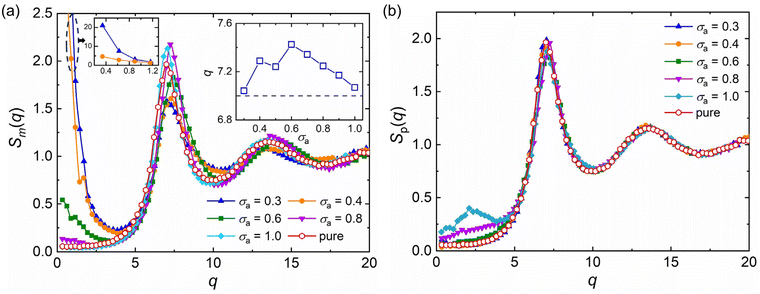
 , q = |q| is the wavenumber, rj is the coordinate of particle j, and 〈…〉 denotes the usual thermal average. The additive segment size exhibits an obvious influence on the position and amplitude of the first peak of Sm(q) for cross-linked polymer/additives mixtures (Fig. 2a). The wavenumber at which Sm(q) reaches its first peak shows a non-monotonic variation with the decreasing additive size, where the wavenumber decreases gradually with the increasing bead size for bead size larger than 0.6σ, while a reasonably opposed trend is observed for smaller bead size (see right inset of Fig. 2a). The additive having a similar relative bead size leads to an increase in the amplitude of first peak of Sm(q), while smaller bead size reduces the amplitude of Sm(q) obviously. In addition, the introduction of additives with bead size σa = 0.3σ results in a large increase in Sm(q) at the limit of q close to 0 (see the left inset of Fig. 2a), which may be related to additive aggregation resulted from the large asymmetry between the cross-linked polymer and additive bead sizes. Sanz et al.63 investigated the impact of fullerene on the structure of polystyrene–fullerene mixtures using small angle neutron scattering experiments, where the scattering intensity at low wavenumber remarkably increased as the fullerene agglomeration increasing with increasing fullerene concentration. Similarly, Banerjee et al.64 observed large composition fluctuations in the region of sufficiently small q at low temperatures in Kob–Andersen mixtures consistent with phase separation. The time-resolved light scattering and X-ray scattering experiments also indicated that the scattering intensity increased continuously from the beginning of phase separation.65–67
The partial static structure factor curves of polymer–polymer in polymer/additives mixtures, Sp(q), with a wide range of additive segment size is reasonably consistent with the pure polymer melt, and only a small difference in Sp(q) at small q for mixtures with additive bead size larger than 0.8σ is observed (Fig. 2b). The similar Sp(q) curves indicate that the additive aggregation induced by altering bead size of additive would not remarkably affect the local density fluctuations of polymer–polymer part in polymer/additives mixtures.42 Similarly, Zirdehi et al.28 analyzed the partial radial pair distribution functions for glass-forming polymer materials in the presence of additives with various bead sizes, which was directly related to the static structure factor. They found that the additive size had a negligible influence on the monomer–monomer pair distribution functions, but an obvious effect on the monomer–additive and additive–additive pair distribution functions, in accord with Fig. 2.
3.2 Dynamical properties
Next, we explore the influence of additive size on the relaxation dynamics based on the structural relaxation time τα. τα is determined from the time at which the self-part of intermediate scattering function Fs(q, t) measuring the correlation of positions of polymer segments with time evolution decays to 0.2, | (5) |
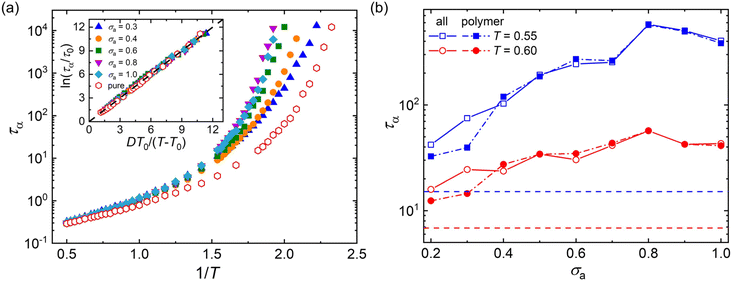
Fig. 3a summarizes the τα as a function of 1/T for mixtures with a wide range of additive segment size, where τα increases significantly upon cooling as observed in various glass-forming liquids.68–71 The introduction of polymer additives having a segment size that is no larger than those of polymer particles results in a remarkable slowing down in the structural relaxation dynamics for cross-linked polymer/additive mixtures, as observed by McKenzie-Smith et al. in the linear polymer melts with nanoparticle additives.42 A strong slowing down in relaxation dynamics was also demonstrated by Cheng et al.35 using broadband dielectric spectroscopy when nanoparticles with nearly equivalent size to the polymer segments were progressively added into the poly(2-vinylpyridine) polymer. Whereas, a faster relaxation dynamic was reported in linear polymer/additive mixtures upon introducing additives with varying bead size, where the additives were represented by single spherical particles and the interaction strength in additive–polymer, additive–additive and polymer–polymer were identical.28
The relaxation time of polymer/additive mixtures shows a non-monotonic dependence on the additive size,28,29 and we further analyze the effect of bead size on the relaxation time of polymer/additive mixtures in Fig. 3b. The polymer/additive mixture with additive bead size σa = 0.8σ exhibits the slowest relaxation dynamics, and the relaxation time of polymer/additive mixtures (open symbols) and the partial relaxation time of cross-linked polymer in mixtures (solid symbols) progressively decrease when the bead size is larger or smaller than the critical size 0.8σ. The difference in the relaxation time between pure polymer without additives and polymer/additive mixtures is substantially reduced with the decreasing additive bead size.40 In addition, there is no obvious difference in the relaxation time of polymer/additive mixtures (open symbols) and the partial relaxation time of cross-linked polymer in mixtures (solid symbols) when additive bead size is larger than 0.4σ, while the cross-linked polymer part in mixtures exhibits obviously faster relaxation dynamics than the whole polymer/additive mixtures for mixtures with additive aggregation (i.e., σa ≤ 0.3σ), indicating a remarkable slowing down of the dynamics arising from the molecular additive. The similar trends are also observed in cross-linked polymer/additive mixtures with lower cross-link densities (Fig. S2 in the ESI†), where decreasing cross-link density of polymer leads to faster relaxation dynamics for the whole mixtures and part of cross-linked polymer. This variability in the segmental dynamics could be altered by varying the intermolecular interaction strength between polymer and additives.42 Hence, we emphasize that the trend observed is only limited for the range of bead size investigated, CG models of cross-linked polymer and additives, and intermolecular interaction strength used in the present work. The effect of a wider range of bead size on the relaxation dynamics for cross-linked polymers with varying intermolecular interaction strength and cross-link density deserves a systematical study in the future.
Numerous experiments and simulation works have previously demonstrated that the structural relaxation time of broadly glass-forming liquids follows Arrhenius law at high temperature, while a non-Arrhenius regime is observed below the onset temperature.34,51,69,70 Here, we examine the validity of non-Arrhenius regime for τα at low T based on the Vogel–Fulcher–Tammann (VFT) relation, ln(τα/τ0) = DT0/(T − T0). In particular, the Vogel temperature T0 at which the relaxation time τα extrapolates to infinity characterizes the end of glass transition process, and the kinetic fragility parameter K = 1/D, describes the steepness of T-dependence of τα near glass transition temperature Tg. The inset of Fig. 3a shows that the T-dependent relaxation time follows the VFT relation for mixtures at their glassy states, which indicates that the VFT relation can describe the segmental relaxation behaviors at low T well for cross-linked polymer/additive mixtures with a wide range of additive bead size.
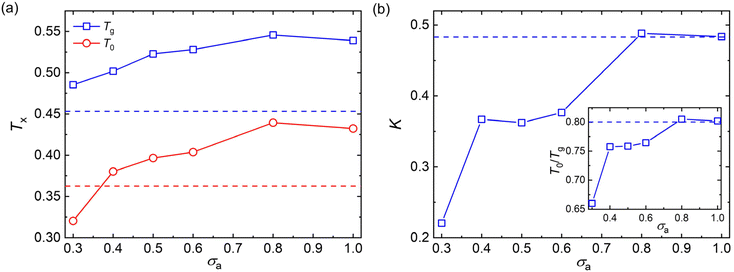
To avoid extrapolation in the simulation estimates of Tg, Tg here is defined by the temperature at which τα reaches to 103τLJ which we refer to as the “computational Tg”.31 This Tg estimation is significantly different in magnitude, but seems to vary nearly proportionately to the Tg determined from the empirical definition often utilized in experiments, i.e., τα(Tg) = 100s or the “kink temperature” in the variation of density with T at a much slower cooling rate than that utilized in our simulations.32,47,50 The results of Fig. 4a indicate that both Tg and T0 show a non-monotonic variation with the decreasing additive size. Additives having a similar size as the polymer segmental size (σa = 0.8σ and σa = 1.0σ) result in significant increases in Tg and T0, while these characteristic temperatures of glass formation gradully decrease for additives having a size smaller than the polymer segments. The slower relaxation dynamics and an increase in Tg were also observed in poly(2-vinylpyridine) with the introduction of oligomeric nanoparticle with a diameter indentical to the polymer segment size, and the increase amplitude of Tg became larger when the additive concentration increased.35
It is notable that the additives having a bead size identical to the polymer segments exhibit a similar fragility parameter K with the pure polymer (Fig. 4b). Similar to the characteristic temperatures, the fragility of mixtures decreases progressively with decreasing bead size of additives for additives with smaller bead size than those of polymer matrix. Thus, compared with the pure polymer without any additives, the introduction of additives having a smaller bead size than the polymer segments leads to an increase in Tg, but a decrease in fragility for polymer/additive mixtures. Apart from the kinetic fragility parameter K, the characteristic temperature ratio, a measure of temperature width of glass transition, is also often used to characterize the degree of T-dependence of τα for polymeric glass-formers.11,24,70 A larger T0/Tg is observed with increasing additive size until σa = 0.8σ (inset of Fig. 4b), indicating a narrower temperature width of glass transition and thus a more fragile glass former. The characteristic temperature ratio T0/Tg exhibits a consistent variation trend with the kinetic fragility parameter K, as observed in a wide range of polymers and their nanocomposites.24,56,70
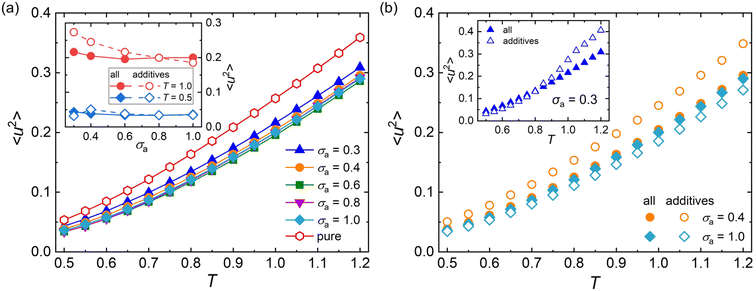
Except for the structural relaxation time τα, the mean-square displacement (MSD) of segments is also calculated to further explore the effect of additive bead size on the dynamics at the timescale of picosecond for polymer/additive mixtures. The Debye–Waller parameter 〈u2〉 is determined from the MSD at t = 1τLJ for pure polymer and polymer/additive mixtures with varying additive bead size (Fig. S3 in the ESI†). As shown in Fig. 5a, the pure polymer exhibits a larger 〈u2〉 over a wide range of temperatures than 〈u2〉 of the polymer/additive mixtures, indicating a faster dynamic for pure cross-linked polymer, qualitatively consistent with the trend observed in τα. Desai et al.72 found that the chain diffusion coefficient, another mobility measure, showed an obvious decrease relative to that in the pure polymer when the polymer–nanoparticle interactions were strongly attractive. We infer that the slower segmental dynamics in polymer/additive mixtures may be ascribed to the strongly attractive interaction between polymer and additives, where an acceleration in dynamics of polymer mixtures was observed for an identical or weaker polymer–additive interaction strength.28,73 In addition, the mobility of mixtures exhibits slight variation with the additive size for additives with size larger than 0.4σ. The inset of Fig. 5a analyzes the effect of additive bead size on the 〈u2〉 of mixtures and the part of additives in detail. The average mobility of additives (open symbols) progressively increases with the decreasing bead size of additives, except an unexpected reduction in additive mobility for σa = 0.3σ at a low temperature (T = 0.5ε/kB). With the additive bead size decreasing, the molecular mobility of additives increases progressively. At the same time, the decreasing additive size also leads to a decrease in the interaction strength between additive and cross-linked polymer (Fig. S4 in the ESI†), which results in the occurrence of additive aggregation for mixtures with sufficiently small additive size (σa = 0.3σ). The additive aggregation further decreases the additive mobility significantly, leading to a reduction in the Debye–Waller factor of additives. Thus, a non-monotonic variation in 〈u2〉 is observed at low temperatures.
The effect of temperature on 〈u2〉 is further explored in Fig. 5b. When the additive bead size is identical to polymer beads (i.e., σa = 1.0σ), the whole mobility of mixtures (solid symbols) is always faster than the part of additives (open symbols), indicating faster dynamics of cross-linked polymer part than the additives in the mixtures. However, an opposing trend is observed in the mixtures with σa = 0.4σ. Consistently, a smaller τα is observed in the part of cross-linked polymer than that of the whole polymer/additive mixtures for σa = 1.0σ, while the cross-linked polymer part exhibits a larger τα for mixtures with σa = 0.4σ (see Fig. 3b). As the additive bead size decreases to 0.3σ, the whole mixture has a slower mobility than the additives for T larger than 0.8ε/kB, consistent with that observed in the mixtures with σa = 0.4σ. And the difference of mobility between cross-linked polymer and additives gets larger with increasing T. When the T is cooled down below 0.8ε/kB, a weakly faster mobility is observed in mixtures, contrary to that observed in high T.
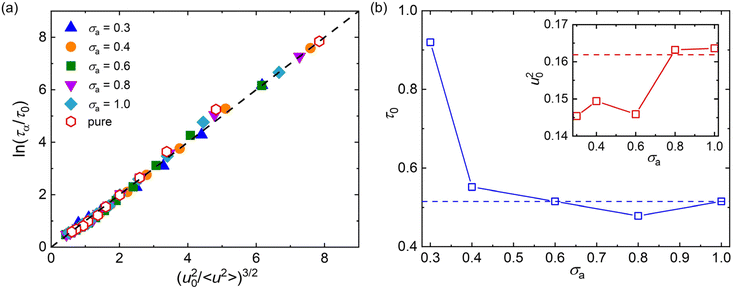
Despite the large timescale difference between segmental relaxation and particle vibration, it has long been recognized that there are correlations between high and low frequency response.74–76 Until now, different theoretical models were developed to understand the correlation of structural relaxation time and rattling amplitude for glass formers in their glassy state.77–79 For example, Simmons and coworkers79 developed a localization model to describe the scaling law between structural relaxation time τα and Debye–Waller factor 〈u2〉 based on a dynamical free volume argument,
τα = τ0![[thin space (1/6-em)]](https://www.rsc.org/images/entities/char_2009.gif) exp[(u20/〈u2〉)α/2] exp[(u20/〈u2〉)α/2] | (6) |
Here, we examine the scaling relationship between 〈u2〉 and τα for polymer/additive mixtures with a wide range of additive bead size using the LM, where the exponent α is fixed as 3 (Fig. 6a). It can be seen that the LM (dashed line) can describe the scaling law between 〈u2〉 and τα well for pure polymer and polymer/additive mixtures with various additive bead sizes, which demonstrates that there are indeed close correlation between fast β relaxation dynamics occuring at the timescale of ps and structural relaxation occurring on a much longer timescale. The fitting parameters τ0 and u20 are summarized in Fig. 6b. Both τ0 and u20 exhibited a non-monotonic variation with the additive bead size, where an extremum value was reasonably observed at σa = 0.8σ. For additives with bead size smaller than 0.8σ, the τ0 gradually decreased while u20 roughly increased with the increasing bead size of additives, consistent with the trends observed in linear polymer melts with variable additive size and polymer–additive interaction strength.42 In addition, Pazmiño Betancourt et al.80 found that the exponent α was approximately equal to 3 for polymer nanocomposites with varying nanoparticle concentrations and for polymer thin films with a wide range of thickness, as in the original computational study of ταversus 〈u2〉 for pure polymer melt by Starr et al.74 Similarly, a series of works on the metallic and polymeric glass formers also indicated that the exponent α might be a constant near 3.42,81,82 However, Simmons et al.83 later found that α was apparently material-dependent due to the presence of caging anisotropy as suggested in the LM79 and the presence of anharmonic intermolecular interactions. Later simulations further seemed to indicate that α depends on chain stiffness,31,49,84 material cooling rate,85 and cross-link density,47 providing additional evidence that the fundamental origin of the relation between τα and 〈u2〉 is uncertain.
3.3 Mechanical properties
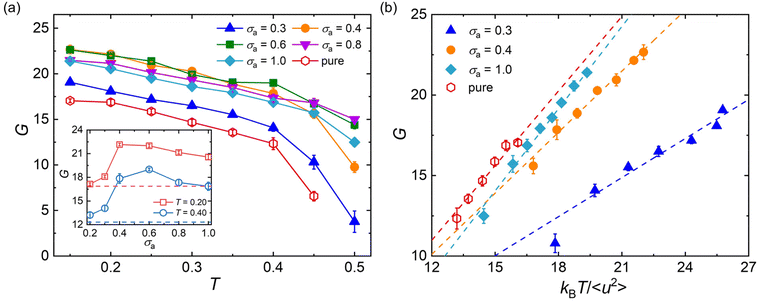
It has long been recognized that the introduction of plasticizers would efficiently increase the flexibility of glassy polymers, while the anti-plasticizers usually increase the stiffness of polymers in their glassy state.12,86 Here, we analyze the effect of additive bead size on the shear modulus over a wide range of temperatures for cross-linked polymer/additive mixtures in their glassy state, which is essential in the engineering applications. The shear deformation tests are performed independently for five times for each system with a strain rate of 5 × 10⁻⁴τLJ−1, and the shear modulus G is calculated from the linear regime of shear stress–strain curves.Compared to pure polymer, the introduction of additives with a wide range of bead size leads to a significant increase in the shear modulus for a strongly attractive interaction between polymer and additives (Fig. 7a), in good agreement with the addition of attractive nanoparticles into linear polymer melts.27 The bead size of additives has a remarkable non-monotonic influence on the shear modulus of polymer/additive mixtures, where the inset of Fig. 7a summarizes the influence of additive bead size on the shear modulus of mixtures at two different temperatures. For the bead size of additives larger than 0.6σ, the shear modulus of mixtures roughly increases with the decreasing additive bead size. Whereas, the shear modulus G suddenly decreases when the bead size decreased to 0.3σ, which may be attributed to the occurence of additive aggregation resulted from the progressively decrease of additive–polymer interaction strength (Fig. S4 in the ESI†). Thus, the shear modulus of mixtures exhibits a non-monotonic trend with the decreasing additive size. A similar variation trend is also observed in the bulk modulus B for mixtures in their glassy state (Fig. S5 in the ESI†), where the bulk modulus is calculated from the reciprocal of isothermal compressibility. Numerous experiments have demonstrated that the phase separation could remarkably enhance the toughness of epoxy, but would reduce the modulus and strength with various degrees at the same time.13–15,18
Apart from the scaling law between 〈u2〉 and τα, the mechanical properties, such as shear modulus, Young's modulus, bulk modulus and Poisson ratio, were all found to have correlation with the Debye–Waller parameter 〈u2〉.87–90 In our previous works,47–49 we have observed the linear scaling relationship between shear modulus and 〈u2〉 for pure cross-linked polymers with a wide range of cross-link densities, cohesive interaction strength and chain stiffness and for polymer/additive mixtures with varying additive mass percentage.53 Here, we examine the validity of the scaling law between shear modulus and 〈u2〉 for polymer/additive mixtures with varying additive bead size in Fig. 7b. It can be seen that a reasonably linear relationship between shear modulus G and kBT/〈u2〉 is again observed for polymer/additive mixtures with a wide range of additive bead size, regardless of whether there is additive aggregation within the mixtures. The scaling law has been observed in a wide range of metallic and polymeric glass formers.89–91 Most recently, Xu et al.92 also reported the same linear relationship between the glassy plateau shear modulus and Debye–Waller parameter for linear polymer melts with variable pressure, chain stiffness and chain length. Except for the shear modulus, the bulk moduli of pure cross-linked polymer and its mixtures also exhibit a scaling law with 〈u2〉 (Fig. S5b in ESI†).93 In view of the close relationship between material moduli and the Debye–Waller parameter, kBT/〈u2〉 is often termed as “local molecular stiffness”.91,93
3.4 Elastic heterogeneity
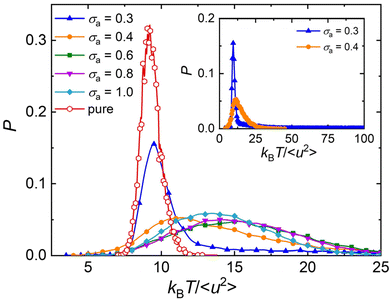
The atomistic MD simulation on the cross-linked poly(dicyclopentadiene) networks demonstrated that the atoms in linear segments exhibited a remarkably higher mobility than those in cross-links.94 Similarly, the simulation work on the glass-forming polymers also indicated that the mobility of particles was heterogeneous, where the particle clusters could be extremely immobile or mobile.11,12,95 Based on the analyses of local molecular stiffness kBT/〈u2〉, an extremely immobile cluster usually corresponds to a stiff region, while the particles with high mobility would lead to a local softness.87,91 Hence, the dynamical heterogeneity resulted from the difference in particle mobility also termed as “elastic heterogeneity”. The shear band formation of Zr–Cu metallic glasses was found to initiate at the local soft regions, where the particles had a larger 〈u2〉 describing the atomic displacement on a caging timescale.91Fig. 8 shows the probability density distribution of local molecular stiffness kBT/〈u2〉 at a low temperature T = 0.5ε/kB, in order to explore the role of additive size played in the elastic heterogeneity for polymer/additive mixtures. The probability density function of kBT/〈u2〉 of pure polymer without any additives (red curves) exhibits a Gaussian form, as observed in cross-linked polymers with and without bending constraints.47–49 The addition of additives leads to an obviously wider distribution than the slender shape observed in pure polymer, indicating a greater degree of elastic heterogeneity in polymer/additive mixtures. With the decreasing bead size of additives, the shape of probability distribution gradually departs from the Gaussian form and exhibits a log–normal distribution, along with the occurrence of a long tail. It is notable that there is an extremely long tail for polymer/additive mixture with additive bead size σa = 0.3σ (inset of Fig. 8), which may be related to the sudden increase in the static strcture factor at low wavenumber. We infer that the additive aggregation results in the occurence of local extremely stiff regions, and thus leads to a long tail in the large kBT/〈u2〉. Consistent with the ditribution of local stiffness in our present work, de Pablo and coworkers also found that the local shear moduli of polymeric glasses were inhomogeneous, and the elastic heterogeneity increased with decreasing nanoparticle size.27 In addition, the width of local stiffness distribution decreases reasonably for the polymer/additive mixtures with smaller additive bead size, corresponding to a stronger glass former. A similar relationship between fragility and width of local stiffness distribution was observed before in our pure cross-linked polymer having the same monomer structure as that used in the present work, but having a variable cross-link density47 and chain bending stiffness.49 However, Xu et al.96 recently reported the opposite trend in star polymer melts with varying number of star arms in which the stronger glass former exhibited a broader local stiffness distribution. This kind of opposed correlation fragility and the breath of the local stiffness distribution has also observed in our pure cross-linked polymer melts with varying cohesive interaction strength.48 Unfortunately, there appears to be no general trend between the breath of local stiffness fluctuations (an attractive and concrete measure of dynamic heterogeneity) and the fragility.
We further analyze the spatial distribution of kBT/〈u2〉 of mixtures and additives in an attempt to obtain a better intuitive understanding of elastic heterogeneity and its physical significance. Fig. 9 shows the spatial distribution of kBT/〈u2〉 at T = 0.5ε/kB, where the red domains in the color map correspond to relatively stiff regions while teal blue domains indicate regions having a relatively low local stiffness. The color bar scale is the same for all the systems in order to make direct comparisons of the local stiffness of materials. The polymer/additive mixtures obviously exhibit more stiff regions (red domains) and more remarkable variation in local stiffness than pure polymer, indicating a stiffer material and a greater degree of local elastic heterogeneity, consistent with the variation of shear modulus and probability distribution of local molecular stiffness. The influence of additives on the local elastic properties is reminiscent of anti-plasticizers, which would lead to an increase in the moduli and a larger amplitude of fluctuations in local elastic constants compared to pure polymer.11,12 As the bead size of additives decreases from 1.0σ to 0.6σ, the average value of local moelcular stiffness and the degree of elastic heterogeneity both increase remarkably. When the bead size of additives further decreased to 0.4σ, the molecular stiffness slightly decreases along with a relatively well-distributed local stiffness. However, a large stiff (red) region is observed, while other regions are relatively soft (teal blue) for mixtures with σa = 0.3σ. We infer that the significant decrease in shear modulus of the entire material may be ascribed to the agglomeration of immobile particles.39
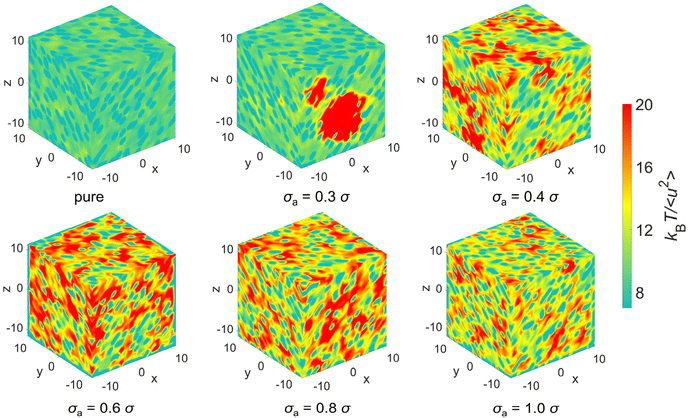 | ||
| Fig. 9 The spatial distribution of local stiffness kBT/〈u2〉 at T = 0.5ε/kB for pure polymer and polymer/additive mixtures with varying additives size σa. | ||
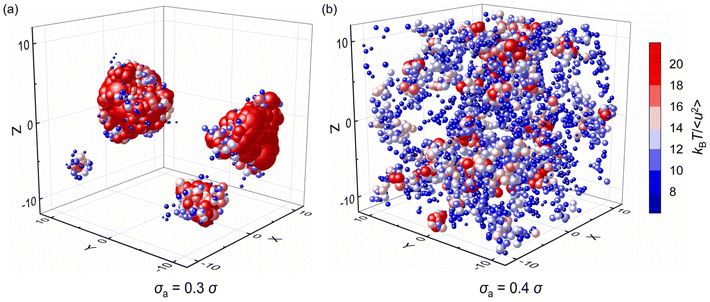
Fig. 10 further explores the spatial distribution of local stiffness of additives for mixtures with σa = 0.3σ and σa = 0.4σ at T = 0.5ε/kB, where the symbol size and color both describe the value of local stiffness indicating important heterogeneity in moelcular stiffness, and the symbol position represents the actual positions of additives in the mixtures. The additives with small bead size (i.e., σa = 0.3σ) exhibit obvious lower molecular mobility than those with bead size σa = 0.4σ. According to the spatial distribution of additives, the additives in the polymer/additive mixture with σa = 0.3σ tend to aggregate in agreement with the huge increment of S(q) at q close to 0, which resulted in significant reduction in the elastic modulus of mixtures. In contrast, the additives are evenly distributed in the mixture with σa = 0.4σ. As the bead size disparity between cross-linked polymer and additives increases, the small size of additives promotes the occurence of aggregation within the polymer.39 Similarly, Nie et al. observed the emergence of phase separation in binary mixtures of soft particles with big size disparity over a wide range of pressure and quench rate.43 Hence, in order to better improve the mechanical properties of cross-linked polymers, it is essential to make a reasonable choice of additive size to aviod additive agglomeration.
4. Conclusions
In the present work, we have systematically explored the effect of additive segmental size on the dynamical and mechanical properties of cross-linked polymers using a bead-spring CG model of thermoset polymer and molecular additive. The introduction of polymer additives having a wide range of bead sizes was found to lead to a significant influence on thermodynamic and dynamic properties of the thermoset material. The comparison of structural relaxation time τα demonstrates that when the additives have higher attraction strength with polymer than the additive–additive and polymer–polymer interaction strength, the relaxation dynamics of polymer/additive mixtures significantly slows down, along with a larger characteristic temperature (i.e., glass transition temperature Tg and Vogel temperature T0) and a smaller fragility of glass formation compared to the pure polymer without additives. The structural relaxation time, characteristic temperatures and fragility of glass formation all exhibit a non-monotonic dependence on the bead size of additives, where they reach their maximum values at the additive bead size σa = 0.8σ. A similar non-monotonic vairation is also observed in the variation of Debye–Waller factor 〈u2〉 and shear modulus G over a wide range of temperatures. It is notable that both τα and G exhibit scaling laws with 〈u2〉 for polymer/additive mixtures with variable additive bead size, consistent with that widely observed in polymeric and metallic glass formers. In addition, the spatial distribution of local moelcular stiffness calculated from 〈u2〉 also indicates that such additives tend to aggregate when the bead size is sufficiently small. The observations of the present work provide physical insights into how the additive size influences the dynamical and mechanical properties of cross-linked polymers, which should be helpful in the rational design of cross-linked polymer materials.Author contributions
Xiangrui Zheng: conceptualization, software, formal analysis, methodology, investigation, writing – original draft and writing – review & editing; Lan Xu: methodology, formal analysis, review & editing; Jack F. Douglas: conceptualization, supervision, and writing – editing & review; Wenjie Xia: conceptualization, supervision, resources, and writing – editing & review.Data availability
All the data that support the findings of this study are included within the article (and the ESI†).Conflicts of interest
There are no conflicts to declare.Acknowledgements
X. Z. acknowledges the support from the Postdoctoral Fellowship Program of CPSF (grant no. GZB20230242). The computation is completed in the HPC Platform of Huazhong University of Science and Technology. L. X. and W. X. acknowledge the support from the Department of Aerospace Engineering at Iowa State University.References
- Y. Gao, K. Peng and S. Mitragotri, Adv. Mater., 2021, 33, 2006362 CrossRef CAS PubMed.
- Y. Tang, W. Xu, S. Niu, Z. Zhang, Y. Zhang and Z. Jiang, J. Mater. Chem. A, 2021, 9, 10000–10011 RSC.
- M. Jiang, Y. Liu, C. Cheng, J. Zhou, B. Liu, M. Yu and H. Zhang, Polym. Test., 2018, 69, 302–309 CrossRef CAS.
- G. D. Vilakati, E. M. V. Hoek and B. B. Mamba, Polym. Test., 2014, 34, 202–210 CrossRef CAS.
- D. Mathew, C. P. Reghunadhan Nair and K. N. Ninan, J. Appl. Polym. Sci., 2000, 77, 75–88 CrossRef CAS.
- T. C. Merkel, B. D. Freeman, R. J. Spontak, Z. He, I. Pinnau, P. Meakin and A. J. Hill, Science, 2002, 296, 519–522 CrossRef CAS PubMed.
- A. L. Andrady, T. C. Merkel and L. G. Toy, Macromolecules, 2004, 37, 4329–4331 CrossRef CAS.
- M. W. Halloran, J. A. Nicell, R. L. Leask and M. Marić, J. Appl. Polym. Sci., 2022, 139, e52778 CrossRef CAS.
- M. H. Baghersad, A. Habibi and A. Heydari, J. Mol. Struct., 2017, 1130, 447–454 CrossRef.
- K. Kawai and Y. Hagura, Carbohydr. Polym., 2012, 89, 836–841 CrossRef PubMed.
- R. A. Riggleman, J. F. Douglas and J. J. de Pablo, J. Chem. Phys., 2007, 126, 234903 CrossRef.
- R. A. Riggleman, J. F. Douglas and J. J. de Pablo, Soft Matter, 2010, 6, 292–304 RSC.
- V. S. Mathew, C. Sinturel, S. C. George and S. Thomas, J. Mater. Sci., 2010, 45, 1769–1781 CrossRef CAS.
- Z. Sun, L. Xu, Z. Chen, Y. Wang, R. Tusiime, C. Cheng, S. Zhou, Y. Liu, M. Yu and H. Zhang, Polymers, 2019, 11, 461 CrossRef.
- Y. Liu, W. Zhang and H. Zhou, Polym. Int., 2005, 54, 1408–1415 CrossRef CAS.
- H. Chen, Z. Zhu, D. Patil, D. Bajaj, N. Verghese, Z. Jiang and H.-J. Sue, Polymer, 2023, 270, 125763 CrossRef CAS.
- M. I. Calafel, E. Calahorra, P. M. Remiro and M. Cortazar, Colloid Polym. Sci., 2010, 288, 1281–1291 CrossRef CAS.
- L. Dong, W. Zhou, X. Sui, Z. Wang, H. Cai, P. Wu, J. Zuo and X. Liu, J. Electron. Mater., 2016, 45, 3776–3785 CrossRef CAS.
- H. Deng, L. Yuan, A. Gu and G. Liang, J. Appl. Polym. Sci., 2020, 137, 48394 CrossRef CAS.
- S. Zhou, Z. Chen, R. Tusiime, C. Cheng, Z. Sun, L. Xu, Y. Liu, M. Jiang, J. Zhou, H. Zhang and M. Yu, Compos. Commun., 2019, 13, 80–84 CrossRef.
- J. Zhao, J. Wang, Z. Liu, Y. Zhang and Y. Mi, ACS Appl. Polym. Mater., 2023, 5, 2859–2866 CrossRef CAS.
- X. H. Flora, M. Ulaganathan and S. Rajendran, Int. J. Polym. Mater., 2013, 62, 737–742 CrossRef CAS.
- A. Taghizadeh, P. Sarazin and B. D. Favis, J. Mater. Sci., 2013, 48, 1799–1811 CrossRef CAS.
- F. W. Starr and J. F. Douglas, Phys. Rev. Lett., 2011, 106, 115702 CrossRef.
- R. A. Riggleman, K. Yoshimoto, J. F. Douglas and J. J. de Pablo, Phys. Rev. Lett., 2006, 97, 045502 CrossRef PubMed.
- R. A. Riggleman, J. F. Douglas and J. J. de Pablo, Phys. Rev. E: Stat., Nonlinear, Soft Matter Phys., 2007, 76, 011504 CrossRef.
- G. J. Papakonstantopoulos, M. Doxastakis, P. F. Nealey, J.-L. Barrat and J. J. de Pablo, Phys. Rev. E: Stat., Nonlinear, Soft Matter Phys., 2007, 75, 031803 CrossRef PubMed.
- E. M. Zirdehi and F. Varnik, J. Chem. Phys., 2019, 150, 024903 CrossRef.
- E. M. Zirdehi, T. Voigtmann and F. Varnik, J. Phys.: Condens. Matter, 2020, 32, 275104 CrossRef PubMed.
- Y. Zhu, A. Giuntoli, W. Zhang, Z. Lin, S. Keten, F. W. Starr and J. F. Douglas, J. Chem. Phys., 2022, 157, 094901 CrossRef PubMed.
- J. H. Mangalara and D. S. Simmons, ACS Macro Lett., 2015, 4, 1134–1138 CrossRef PubMed.
- J. H. Mangalara, M. D. Marvin, N. R. Wiener, M. E. Mackura and D. S. Simmons, J. Chem. Phys., 2017, 146, 104902 CrossRef PubMed.
- B. A. Pazmiño Betancourt, J. F. Douglas and F. W. Starr, Soft Matter, 2013, 9, 241–254 RSC.
- S.-J. Li, H.-J. Qian and Z.-Y. Lu, Soft Matter, 2019, 15, 4476–4485 RSC.
- S. Cheng, S.-J. Xie, J.-M. Y. Carrillo, B. Carroll, H. Martin, P.-F. Cao, M. D. Dadmun, B. G. Sumpter, V. N. Novikov, K. S. Schweizer and A. P. Sokolov, ACS Nano, 2017, 11, 752–759 CrossRef CAS.
- B. J. Ash, R. W. Siegel and L. S. Schadler, Macromolecules, 2004, 37, 1358–1369 CrossRef CAS.
- O. A. Serenko, V. I. Roldughin, A. A. Askadskii, E. S. Serkova, P. V. Strashnov and Z. B. Shifrina, RSC Adv., 2017, 7, 50113–50120 RSC.
- P. Lepcio, F. Ondreas, K. Zarybnicka, M. Zboncak, O. Caha and J. Jancar, Soft Matter, 2018, 14, 2094–2103 RSC.
- W. Xia, X. Qin, Y. Zhang, R. Sinko and S. Keten, Macromolecules, 2018, 51, 10304–10311 CrossRef CAS.
- H. Emamy, S. K. Kumar and F. W. Starr, Phys. Rev. Lett., 2018, 121, 207801 CrossRef.
- W. Zhang, H. Emamy, B. A. Pazmiño Betancourt, F. Vargas-Lara, F. W. Starr and J. F. Douglas, J. Chem. Phys., 2019, 151, 124705 CrossRef PubMed.
- T. Q. McKenzie-Smith, J. F. Douglas and F. W. Starr, Phys. Rev. Lett., 2021, 127, 277802 CrossRef PubMed.
- Y. Nie, J. Liu, J. Guo and N. Xu, Nat. Commun., 2020, 11, 3198 CrossRef PubMed.
- M. Dijkstra, R. van Roij and R. Evans, Phys. Rev. Lett., 1998, 81, 2268–2271 CrossRef.
- P. S. Anbinder, P. J. Peruzzo and J. I. Amalvy, Prog. Org. Coat., 2016, 101, 207–215 CrossRef.
- A. Karuth, S. Szwiec, G. M. Casanola-Martin, A. Khanam, M. Safaripour, D. Boucher, W. Xia, D. C. Webster and B. Rasulev, Prog. Org. Coat., 2024, 193, 108526 CrossRef.
- X. Zheng, Y. Guo, J. F. Douglas and W. Xia, J. Chem. Phys., 2022, 157, 064901 CrossRef.
- X. Zheng, Y. Guo, J. F. Douglas and W. Xia, Macromolecules, 2022, 55, 9990–10004 CrossRef.
- X. Zheng, W. Nie, Y. Guo, J. F. Douglas and W. Xia, Macromolecules, 2023, 56, 7636–7650 CrossRef CAS.
- B. Mei, T.-W. Lin, G. S. Sheridan, C. M. Evans, C. E. Sing and K. S. Schweizer, Macromolecules, 2022, 55, 4159–4173 CrossRef CAS.
- Y. Kashiwagi, O. Urakawa, S. Zhao, Y. Takashima, A. Harada and T. Inoue, Macromolecules, 2021, 54, 3321–3333 CrossRef CAS.
- A. J. Lesser and K. J. Calzia, J. Polym. Sci., Part B: Polym. Phys., 2004, 42, 2050–2056 CrossRef CAS.
- W. Nie, J. F. Douglas and W. Xia, ACS Eng. Au, 2023, 3, 512–526 CrossRef CAS.
- K. Kremer and G. S. Grest, J. Chem. Phys., 1990, 92, 5057–5086 CrossRef CAS.
- W.-S. Xu, J. F. Douglas and K. F. Freed, Macromolecules, 2016, 49, 8341–8354 CrossRef CAS.
- W.-S. Xu, J. F. Douglas and K. F. Freed, Macromolecules, 2016, 49, 8355–8370 CrossRef CAS.
- D. Pan and Z.-Y. Sun, J. Chem. Phys., 2018, 149, 234904 CrossRef PubMed.
- A. Shavit and R. A. Riggleman, Macromolecules, 2013, 46, 5044–5052 CrossRef CAS.
- A. P. Thompson, H. Metin Aktulga, R. Berger, D. S. Bolintineanu, W. Michael Brown, P. S. Crozier, P. J. in‘t Veld, A. Kohlmeyer, S. G. Moore, T. D. Nguyen, R. Shan, M. J. Stevens, J. Tranchida, C. Trott and S. J. Plimpton, Comput. Phys. Commun., 2022, 271, 108171 CrossRef CAS.
- V. Varshney, S. S. Patnaik, A. K. Roy and B. L. Farmer, Macromolecules, 2008, 41, 6837–6842 CrossRef CAS.
- A. Bandyopadhyay, P. K. Valavala, T. C. Clancy, K. E. Wise and G. M. Odegard, Polymer, 2011, 52, 2445–2452 CrossRef CAS.
- A. Shokuhfar and B. Arab, J. Mol. Model., 2013, 19, 3719–3731 CrossRef CAS PubMed.
- A. Sanz, H. C. Wong, A. J. Nedoma, J. F. Douglas and J. T. Cabral, Polymer, 2015, 68, 47–56 CrossRef CAS.
- A. Banerjee, M. Sevilla, J. F. Rudzinski and R. Cortes-Huerto, Soft Matter, 2022, 18, 2373–2382 RSC.
- G. Shen, Z. Hu, Z. Liu, R. Wen, X. Tang and Y. Yu, RSC Adv., 2016, 6, 34120–34130 RSC.
- Z. Xia, W. Li, J. Ding, A. Li and W. Gan, J. Polym. Sci., Part B: Polym. Phys., 2014, 52, 1395–1402 CrossRef.
- G. Li, Z. Huang, C. Xin, P. Li, X. Jia, B. Wang, Y. He, S. Ryu and X. Yang, Mater. Chem. Phys., 2009, 118, 398–404 CrossRef.
- B. Mei, Y. Zhou and K. S. Schweizer, Macromolecules, 2021, 54, 10086–10099 CrossRef.
- D. M. Duarte, W. Tu, A. Dzienia and K. Adrjanowicz, Polymer, 2019, 183, 121860 CrossRef.
- X. Xu, J. F. Douglas and W.-S. Xu, Macromolecules, 2021, 54, 6327–6341 CrossRef CAS.
- Z. Yang, X. Xu, J. F. Douglas and W.-S. Xu, Macromolecules, 2023, 56, 4049–4064 CrossRef CAS.
- T. Desai, P. Keblinski and S. K. Kumar, J. Chem. Phys., 2005, 122, 134910 CrossRef PubMed.
- S. Peter, H. Meyer and J. Baschnagel, Eur. Phys. J. E, 2009, 28, 147–158 CrossRef CAS.
- F. W. Starr, S. Sastry, J. F. Douglas and S. C. Glotzer, Phys. Rev. Lett., 2002, 89, 125501 CrossRef.
- A. Widmer-Cooper and P. Harrowell, Phys. Rev. Lett., 2006, 96, 185701 CrossRef PubMed.
- A. Ottochian and D. Leporini, J. Non-Cryst. Solids, 2011, 357, 298–301 CrossRef CAS.
- L. Larini, A. Ottochian, C. De Michele and D. Leporini, Nat. Phys., 2008, 4, 42–45 Search PubMed.
- F. Puosi and D. Leporini, J. Chem. Phys., 2012, 136, 164901 CrossRef CAS PubMed.
- D. S. Simmons, M. T. Cicerone, Q. Zhong, M. Tyagi and J. F. Douglas, Soft Matter, 2012, 8, 11455–11461 RSC.
- B. A. Pazmiño Betancourt, P. Z. Hanakata, F. W. Starr and J. F. Douglas, Proc. Natl. Acad. Sci. U. S. A., 2015, 112, 2966–2971 CrossRef.
- J. F. Douglas, B. A. Pazmiño Betancourt, X. Tong and H. Zhang, J. Stat. Mech.: Theory Exp., 2016, 2016, 054048 CrossRef.
- G. Mahmud, H. Zhang and J. F. Douglas, Eur. Phys. J. E, 2021, 44, 33 CrossRef CAS PubMed.
- J.-H. Hung, T. K. Patra, V. Meenakshisundaram, J. H. Mangalara and D. S. Simmons, Soft Matter, 2019, 15, 1223–1242 RSC.
- D. Ruan and D. S. Simmons, J. Polym. Sci., Part B: Polym. Phys., 2015, 53, 1458–1469 CrossRef CAS.
- R. M. Elder, A. L. Forster, A. Krishnamurthy, J. M. Dennis, H. Akiba, O. Yamamuro, K. Ito, K. M. Evans, C. Soles and T. W. Sirk, Soft Matter, 2022, 18, 6511–6516 RSC.
- E. B. Stukalin, J. F. Douglas and K. F. Freed, J. Chem. Phys., 2010, 132, 084504 CrossRef PubMed.
- Z. Li and W. Xia, Extreme Mech. Lett., 2020, 40, 100942 CrossRef.
- C. L. Soles, A. B. Burns, K. Ito, E. P. Chan, J. F. Douglas, J. Wu, A. F. Yee, Y.-T. Shih, L. Huang, R. M. Dimeo and M. Tyagi, Macromolecules, 2021, 54, 2518–2528 CrossRef CAS.
- W. Zhang, F. W. Starr and J. F. Douglas, J. Chem. Phys., 2021, 155, 174901 CrossRef CAS PubMed.
- F. Puosi and D. Leporini, Eur. Phys. J. E, 2015, 38, 87 CrossRef CAS PubMed.
- X. Wang, H. Zhang and J. F. Douglas, J. Chem. Phys., 2021, 155, 204504 CrossRef CAS.
- X. Xu, J. F. Douglas and W.-S. Xu, Macromolecules, 2023, 56, 4929–4951 CrossRef CAS.
- C. Jeong, F. W. Starr, K. L. Beers and J. F. Douglas, Macromolecules, 2023, 56, 3873–3883 CrossRef CAS.
- R. M. Elder, J. W. Andzelm and T. W. Sirk, Chem. Phys. Lett., 2015, 637, 103–109 CrossRef.
- X. Wang, W.-S. Xu, H. Zhang and J. F. Douglas, J. Chem. Phys., 2019, 151, 184503 CrossRef.
- Z. Yang, X. Xu, J. F. Douglas and W.-S. Xu, J. Chem. Phys., 2024, 160, 044503 CrossRef.
Footnote |
| † Electronic supplementary information (ESI) available: Thermodynamical properties (Fig. S1), the effect of cross-link density (Fig. S2), the definition of Debye–Waller factor 〈u2〉 (Fig. S3), the polymer–additive interfacial interaction (Fig. S4) and the determination of bulk modulus (Fig. S5). See DOI: https://doi.org/10.1039/d4nr02631d |
| This journal is © The Royal Society of Chemistry 2024 |


