 Open Access Article
Understanding the formation of nitrate from nitrogen at the interface of gas–water microbubbles†
Sandeep
Bose
,
Yu
Xia
* and
Richard N.
Zare
 *
*
Department of Chemistry, Stanford University, CA 94305, USA. E-mail: zare@stanford.edu
First published on 11th November 2024
Abstract
Water microbubbles containing Fe2+ ions have been found to efficiently transform nitrogen (N2) to nitrate (NO3−) by initiating Fenton's reaction at the gas–water interface. Herein, we elucidate the mechanism of the formation of nitrate (NO3−) from nitrogen (N2) at the microbubble interface. Several experimental studies were conducted to identify the intermediates formed during the conversion. Our investigation shows the formation of H2N2O2, NO, NO2, and NO2− intermediates before yielding NO3− as the final product. Density functional theory (DFT) calculations provide additional support to our observation by providing insights into the energy profiles of the reaction intermediates. We believe that this work not only provides valuable insight into the abiotic nitrogen fixation in microbubbles but also helps in suggesting the modification of parameters to create a more reactive interface that leads to the enhanced production of nitric acid (HNO3).
Introduction
Atmospheric nitrogen (N2) fixation is essential for life on Earth because it converts non-reactive N2 into a reactive form that is suitable for crops and supports their growth.1 Nitrate (NO3−) is one of the nitrogen fixation products that is widely used to manufacture fertilizers.2 Additionally, NO3− is employed as a vital source of nitrogen in the food processing industry and the manufacturing of plastic and medicinal products.3 Traditionally, NO3− is prepared from the catalytic oxidation of ammonia (NH3).4 The method suffers from the use of NH3 which is generally prepared from the Haber–Bosch process. The process involves the use of fossil fuel and the release of large quantities of carbon dioxide (CO2).4 Intense research has been directed toward the goal of producing NO3− in a more eco-friendly way.3Recently, reactions in water microdroplets and microbubbles have been explored as an alternative approach owing to a significant enhancement in the reaction rates and formation of unexpected products.5–17 An exceptional electric field strength (∼109 V m−1),18–21 the lack of three-dimensional solvation,22,23 the orientation of molecules at the interface,24–26 evaporation,27 and pH28 are several factors that drive redox reactions at the air–water interface. Taking advantage of these factors, Bose, Mofidfar, and Zare have shown that NO3− can be successfully prepared by passing N2 microbubbles through water in the presence of Fe2+.29 The presence of ferrous ions stimulates OH˙ production at the microbubble interface by initiating Fenton's reaction as follows:30,31
| Fe2+ + H2O2 → Fe3+ + OH˙ + OH− | (1) |
The OH˙ produced from Fenton's reaction activates the N2 molecule which undergoes a series of transformations to form HNO3 as the final product. Surprisingly, the transformations occur at room temperature and ambient pressure. Additionally, the process does not require any external electric field or radiation, and hence opens up the possibility for an eco-friendly production of HNO3.
Experimentally, the authors have confirmed that N2 oxidation takes place at the gas–water interface of a microbubble.29 To ensure the necessity of microbubbles for the transformation, the author simply purged the solution with N2 to create larger bubbles. No NO3− formation was noticed in case of larger bubbles which suggests the requirement of microbubbles for the conversion. Although the final product was analysed and quantified, the exact mechanism for that conversion was not established. The current work involves the understanding of the reaction pathways for the formation of NO3− from N2. We have performed several experiments to recognize the intermediates formed during the process. Based on these identifications, we propose a possible reaction leading to intermediate formation. Finally, we tried to connect all the possible reactions as a sequence of continuous steps that occur to yield the final product. To validate our experimental observations, density functional theory (DFT) calculations were employed. DFT studies unravel the reaction pathways involving the experimentally identified intermediates and show the feasibility of the transformation.
Experimental
The reaction system which was used for NO3− production consists of an air stone submerged in a beaker of aqueous FeSO4 (50 μM) solution. The air stone is a cylindrical porous mineral bubbler used to create microbubbles. The beaker is placed inside an ultrasonic bath along with a temperature controller. The air stone is connected to the N2 gas supply. When N2 gas (50 psi) is allowed to pass through the air stone, it produces microbubbles of N2 in the solution.29 An air stone is a porous material that is used to diffuse gas bubbles into water. The air stones (Guangzhou Zhushi Aquarium Co., Ltd, ASC-999) are manufactured from quartz sand that has been sintered in a fixed mold. The size of the output bubble depends upon the input gas pressure and the porosity of the air stone. The air stone we employed for our experiment has a porosity of 11%. Through the use of a high-speed camera, we found the average diameter of the microbubbles is ∼530 μm and the average flux of the output bubble is ∼120 microbubbles per second for a gas pressure of 50 psi. We employed ultrasonication along with bubbling to further split microbubbles to cause them to have smaller sizes. A temperature controller was used to prevent an increase in temperature. However, evaporation still occurs over time, and water was added to the container to maintain the same level of water. An activated carbon filter was inserted in the gas flow to remove any nitrogen oxide impurities present.Results and discussion
Before identification of intermediates, we detected H2O2 formation as it is important for Fenton's reaction to generate OH˙ for N2 activation. The quantification of H2O2 was done using a potassium titanium oxalate based spectrophotometric method29 which shows a continuous increase in H2O2 production with bubbling (Fig. S1†). The N2 activation leading to NO3− as the final product was confirmed by using the method reported by Bose, Mofidfar, and Zare29 which shows a steady increase in NO3− yield with bubbling time (Fig. S2†).For the identification of intermediates involved in NO3− formation, the 1H-NMR spectrum of the reaction solutions was measured after 30 min of bubbling. The NMR spectrum shows a chemical shift of 2.69 (Fig. 1) which can be attributed to the formation of hyponitrous acid (H2N2O2).32 The generation of H2N2O2 in the solution was confirmed by measuring the NMR of a standard H2N2O2 solution which shows a peak at the same position. Thus, it can be concluded that N2 is activated by the in situ generated OH˙ from Fenton's reaction which oxidizes N2 to yield H2N2O2 in a sequence of steps. The reactions can be shown as follows:
| N2 + H˙ → N2H˙ + OH˙ → HN2OH + OH˙→ ˙N2OH + H2O + OH˙ → H2N2O2 + H2O | (2) |
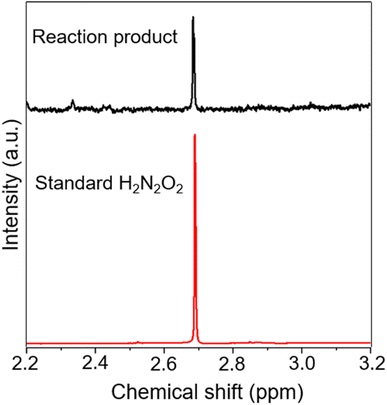 | ||
| Fig. 1 Comparison of the 1H-NMR spectra of the reaction product after 30 min of microbubbling and the standard H2N2O2 solution. | ||
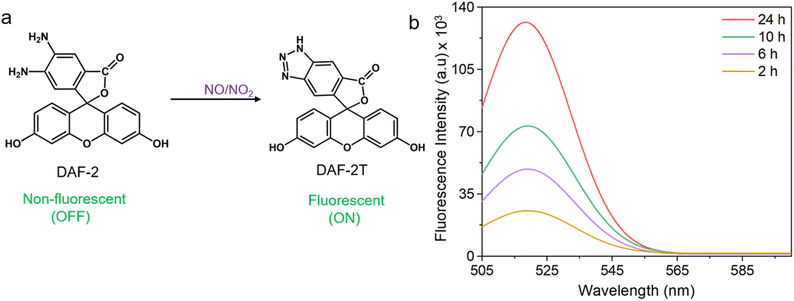
Other important intermediates identified from the microbubbled solution are nitric oxide (NO˙) and nitrogen dioxide  . To obtain direct evidence of NO and NO2 in the solution, we employed diaminofluorescein (DAF-2) as a fluorescent indicator. DAF-2 itself is a weakly fluorescent molecule which in the presence of NO˙ and oxygen undergoes a chemical transformation to yield a highly green fluorescent triazole form known as DAF-2T (Fig. 2a).33 The reaction mechanism is proposed to involve the formation of nitrous anhydride (N2O3) which is produced as follows:34
 | (3) |
 | (4) |
The in situ produced N2O3 reacts with the vicinal diamines of DAF-2 to form the triazole ring compound (DAF-2T).
To check the existence of NO˙ and  in our sample, we added 5 mM DAF-2 in DMSO to the microbubbled solution. As the N2-bubbling time is increased, we observe an increase in the fluorescence intensity (λex = 495 nm, λem = 515 nm). The fluorescence intensity of DAF-2 is weak, and it shows substantial enhancement in fluorescence upon N2-bubbling for 24 h (Fig. S3†). This suggests that N2O3 concentration increases in the solution, and the in situ generated N2O3 reacts with the DAF-2 present in the solution to give DAF-2T which enhances the fluorescence (Fig. 2b).33 Thus, it can be concluded that both NO˙ and
  are generated in the microbubbles during the reaction. From eqn (2) we showed that the first steps of N2 activation occurs via H2N2O2 formation. The H2N2O2 formed possibly reacts with the OH˙ generated in the system, to produce NO˙. The reaction can be written as follow:
| H2N2O2 + 2OH˙ → 2NO˙ + 2H2O | (5) |
In living cells, NO˙ reacts with O2 to form  as shown in eqn (3). However, in our case, the microbubbles were produced using N2 as feed gas and the system lacks oxygen to produce
  . Thus, a possible way by which
  could be produced from NO˙ is shown by the following reaction:
| NO˙ + OH˙ → HNO2 | (6) |
 | (7) |
Additionally, we employed the spin trap, 5,5-dimethyl-1-pyrroline-N-oxide (DMPO), to capture the reactive oxygen species (ROS) and reactive nitrogen species (RNS) as shown previously by Song et al.35 During the microbubbling experiment, DMPO (2 mM) was added to the solution and bubbling was continued for a sufficiently longer time to capture any radical species generated in the solution. Finally, the solution was analyzed using mass spectrometry (Orbitrap MS). DMPO captures ROS such as OH˙ and OOH˙ which were characterized by the formation of DMPO-OH (m/z 130.0875) and DMPO-OOH (m/z 146.0872). The OH˙ captured by DMPO was generated from Fenton's reaction in the presence of Fe2+ in the solution whereas the OOH˙ detected possibly results from the catalytic regeneration of Fe2+ from Fe3+ at the gas–water interface as follows:
 | (8) |
In addition, we observed features at m/z 114.0912 and 136.0715 corresponding to DMPO-H and DMPO-Na, respectively. Apart from ROS, we also observed RNS such as NO˙ and  which were detected as DMPO-NO (m/z 143.0847) and DMPO-NO2 (m/z 159.0835) in the mass spectrum (Fig. 3). As both the NO˙ and
  are radical species, they form a covalent bond at the C(sp2)-2 position of the DMPO resulting in the formation of DMPO-NO and DMPO-NO2. From both the fluorescence measurement and mass spectral interpretation we concluded that NO˙ and
  intermediates are produced during the bubbling.
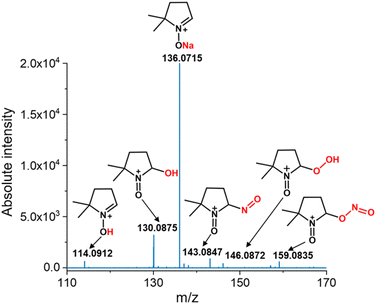 | ||
| Fig. 3 Mass spectrum of the reactive oxygen species (ROS) and reactive nitrogen species (RNS) captured by DMPO in the N2-microbubbled solution. | ||
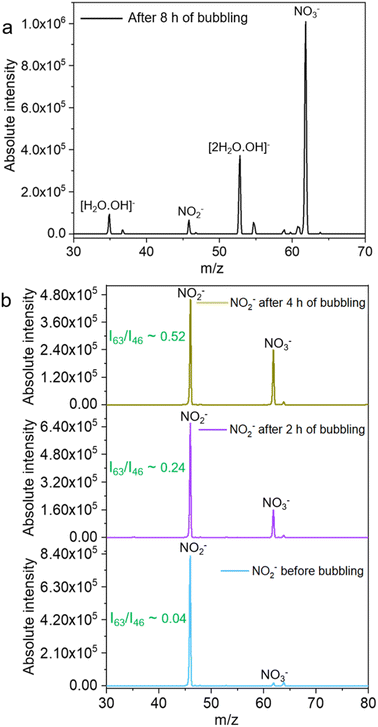
When the mass spectrum of the N2-microbubbled sample was recorded after 4 h, it showed a feature at m/z 46 due to NO2− (negative ion mode) along with the product peak of NO3− at m/z 63. This suggests that NO2− is formed during the reaction and possibly works as an intermediate to obtain NO3− as the final product (Fig. 4a). To confirm NO3− conversion occurs via NO2−, we externally prepare a NO2− solution of known concentration (20 μM) and the solution was microbubbled. When the mass spectra were recorded (LTQ MS), we observed an increase in the NO3− intensity with increasing bubbling time (Fig. 4b). This suggests that the NO2− generated in the microbubble is involved in NO3− formation which possibly occurs via oxidation in the presence of OH˙. Because N2 as a feed gas can cause NO3− formation, we employed argon gas for this particular experiment to create microbubbles. Also, NO2− in aqueous solution when kept for long and exposed to light undergoes slow oxidation to NO3−. To check NO2− oxidation in aqueous solution we kept the solution without bubbling for 2 h and 4 h and measured the mass spectrum. We did not observe any oxidation of the NO2− solution when kept without bubbling (Fig. S4†). This suggests that the NO2− oxidation to NO3− takes place only in microbubbles. As eqn (7) shows that NO2− reacts with OH˙ to form NO2, so we believe the conversion of NO2− to NO3− occurs via NO2 generation in the microbubbles as follows:
 | (9) |
 | (10) |
From all the above experiments we identified that H2N2O2, NO˙,  , and NO2− are the intermediates formed when N2 is converted to NO3− in the microbubbles. Based on our experimental evidence and combining eqn (1)–(9) we suggest the oxidation of N2 to NO3− by OH˙ activation takes place through a series of sequential transformations as follows:
 | (11) |
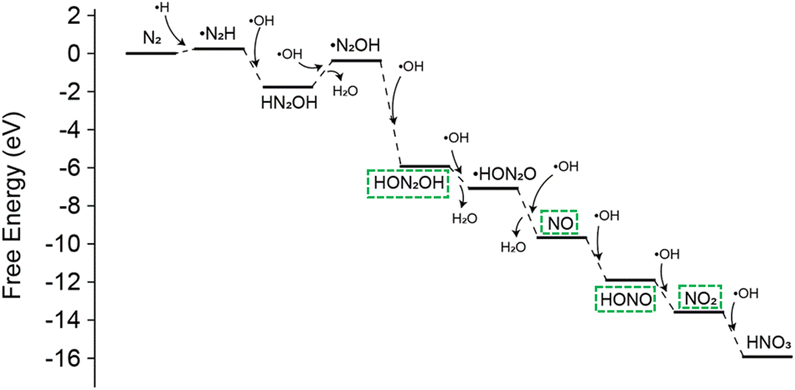
To validate the proposed reaction pathway for the conversion of N2 to NO3−via the gas–water interface, we conducted further investigations into the reaction mechanism using DFT calculations. The designed interfacial reaction system typically includes active radicals, such as hydrogen and hydroxyl radicals. As we previously reported, hydrogen radicals at the gas–water interface can activate nitrogen molecules, allowing them to react with other radicals.36 In subsequent steps, the nitrogen–nitrogen triple bond (N![[triple bond, length as m-dash]](https://www.rsc.org/images/entities/char_e002.gif) N) breaks progressively, eventually leading to the formation of nitrate through oxidation (Fig. 5). Compared to the high activation energy of 0.95 eV for O2 oxidation, the further oxidation of NO˙ by OH˙ to form HNO3 proceeds without an energy barrier.
N) breaks progressively, eventually leading to the formation of nitrate through oxidation (Fig. 5). Compared to the high activation energy of 0.95 eV for O2 oxidation, the further oxidation of NO˙ by OH˙ to form HNO3 proceeds without an energy barrier.
We do not claim this is the only pathway through which NO3− is formed, and it is possible that the reaction might involve some unknown intermediates and reaction pathways that we failed to identify. But the experimental and theoretical evidence we have found points to the reaction pathways we have presented as being operative.
Conclusions
In summary, we have experimentally detected different intermediates namely H2N2O2, NO˙, , and NO2− produced in microbubbles during the conversion of N2 to NO3−. 1H-NMR spectroscopy was utilized to identify H2N2O2. DAF-2 was employed to confirm the existence of NO˙ and
  in the microbubbled solution spectrophotometrically. In addition, DMPO-based spin trap experiments captured the RNS (NO˙ and
  ) in the mass spectrum. The presence of NO2− along with NO3− was observed in the mass spectrum. DFT calculations support our experimental evidence by providing insights into the energy profile of the reaction intermediates.
Data availability
The data supporting this article have been included as part of the ESI.†Author contributions
S. B. performed most of the experiments, analysis, and drafting of the first version of the manuscript. Y. X. helped in the DFT calculation. R. N. Z., the principal investigator, proposed the project, supervised all co-authors, and completely revised the manuscript.Conflicts of interest
There are no conflicts to declare.Acknowledgements
S. B. would like to thank the Nehru-Fulbright program for the fellowship. We thank the Air Force Office of Scientific Research through the Multidisciplinary University Research Initiative (MURI) program (AFOSR FA9550-21-1-0170) for supporting this project.Notes and references
- N. Cherkasov, A. O. Ibhadon and P. Fitzpatrick, Chem. Eng. Process. Process Intensif., 2015, 90, 24–33 CrossRef CAS.
- 2015–2032 Nitric Acid Market Analysis: Industry Market Size, Plant Capacity, Production, Operating Efficiency, Demand & Supply, Type, End-User Industries, Sales Channel, Regional Demand, Foreign Trade, Company Share, Manufacturing Process, Policy and Regulatory Landscape, 2024, https://www.chemanalyst.com/industry-report/nitric-acid-market-615.
- Y. Tang, J. Dai, P. Zhang, G. Niu, Y. Duan and Y.-H. Tian, ACS Sustainable Chem. Eng., 2024, 12, 11319–11326 CrossRef CAS.
- US EPA, AP 42 Chapter 8.8 Nitric acid Production, https://gaftp.epa.gov/ap42/ch08/s08/final/c08s08_feb1998.pdf.
- X. Song, Y. Meng and R. N. Zare, J. Am. Chem. Soc., 2022, 144, 16744–16748 CrossRef CAS.
- S. Jin, H. Chen, X. Yuan, D. Xing, R. Wang, L. Zhao, D. Zhang, C. Gong, C. Zhu, X. Gao, Y. Chen and X. Zhang, JACS Au, 2023, 3, 1563–1571 CrossRef CAS PubMed.
- Y. B. Vogel, C. W. Evans, M. Belotti, L. Xu, I. C. Russell, L.-J. Yu, A. K. K. Fung, N. S. Hill, N. Darwish, V. R. Gonçales, M. L. Coote, K. Swaminathan Iyer and S. Ciampi, Nat. Commun., 2020, 11, 6323 CrossRef CAS.
- J. K. Lee, D. Samanta, H. G. Nam and R. N. Zare, Nat. Commun., 2018, 9, 1562, DOI:10.1038/s41467-018-04023-z.
- A. Nandy, A. Kumar, S. Mondal, D. Koner and S. Banerjee, J. Am. Chem. Soc., 2023, 145, 15674–15679 CrossRef CAS.
- D. Satyabola, T. Ahuja, S. Bose, B. Mondal, P. Srikrishnarka, M. P. Kannan, B. K. Spoorthi and T. Pradeep, J. Phys. Chem. C, 2021, 125, 10998–11006 CrossRef CAS.
- A. Ray Chowdhuri, B. K. Spoorthi, B. Mondal, P. Bose, S. Bose and T. Pradeep, Chem. Sci., 2021, 12, 6370–6377 RSC.
- S. Bose, A. Chatterjee, S. K. Jenifer, B. Mondal, P. Srikrishnarka, D. Ghosh, A. R. Chowdhuri, M. P. Kannan, S. V Elchuri and T. Pradeep, ACS Sustainable Chem. Eng., 2021, 9, 4554–4563 CrossRef CAS.
- J. Ghosh and R. G. Cooks, TrAC, Trends Anal. Chem., 2023, 161, 117010 CrossRef CAS.
- S. Banerjee, E. Gnanamani, X. Yan and R. N. Zare, Analyst, 2017, 142, 1399–1402 RSC.
- X. Yan, R. M. Bain and R. G. Cooks, Angew. Chem., Int. Ed., 2016, 55, 12960–12972 CrossRef CAS PubMed.
- D. Zhang, J. Wang, H. Chen, C. Gong, D. Xing, Z. Liu, I. Gladich, J. S. Francisco and X. Zhang, J. Am. Chem. Soc., 2023, 145, 6462–6470 CrossRef CAS PubMed.
- B. K. Spoorthi, K. Debnath, P. Basuri, A. Nagar, U. V Waghmare and T. Pradeep, Science, 2024, 384, 1012–1017 CrossRef CAS PubMed.
- D. Zhang, X. Yuan, C. Gong and X. Zhang, J. Am. Chem. Soc., 2022, 144, 16184–16190 CrossRef CAS PubMed.
- Z. Song, C. Liang, K. Gong, S. Zhao, X. Yuan, X. Zhang and J. Xie, J. Am. Chem. Soc., 2023, 145, 26003–26008 CrossRef CAS PubMed.
- H. Xiong, J. K. Lee, R. N. Zare and W. Min, J. Phys. Chem. Lett., 2020, 11, 7423–7428 CrossRef CAS.
- C. Zhu, L. N. Pham, X. Yuan, H. Ouyang, M. L. Coote and X. Zhang, J. Am. Chem. Soc., 2023, 145, 21207–21212 CrossRef CAS PubMed.
- L. Qiu, Z. Wei, H. Nie and R. G. Cooks, Chempluschem, 2021, 86, 1362–1365 CrossRef CAS PubMed.
- Z. Wei, Y. Li, R. G. Cooks and X. Yan, Annu. Rev. Phys. Chem., 2020, 71, 31–51 CrossRef CAS PubMed.
- K. Inoue, M. Ahmed, S. Nihonyanagi and T. Tahara, Nat. Commun., 2020, 11, 5344 CrossRef CAS PubMed.
- G. R. Medders and F. Paesani, J. Am. Chem. Soc., 2016, 138, 3912–3919 CrossRef CAS.
- Z. Zhou, X. Yan, Y.-H. Lai and R. N. Zare, J. Phys. Chem. Lett., 2018, 9, 2928–2932 CrossRef CAS PubMed.
- G. Rovelli, M. I. Jacobs, M. D. Willis, R. J. Rapf, A. M. Prophet and K. R. Wilson, Chem. Sci., 2020, 11, 13026–13043 RSC.
- H. Wei, E. P. Vejerano, W. Leng, Q. Huang, M. R. Willner, L. C. Marr and P. J. Vikesland, Proc. Natl. Acad. Sci. U. S. A., 2018, 115, 7272–7277 CrossRef CAS.
- S. Bose, M. Mofidfar and R. N. Zare, J. Am. Chem. Soc., 2024, 146, 27964–27971, DOI:10.1021/jacs.4c11899.
- M. Umar, H. A. Aziz and M. S. Yusoff, Waste Manag., 2010, 30, 2113–2121 CrossRef CAS PubMed.
- S. O. Ganiyu, M. Zhou and C. A. Martínez-Huitle, Appl. Catal., B, 2018, 235, 103–129 CrossRef CAS.
- S. Chen, S. Liang, R. Huang, M. Zhang, Y. Song, Y. Zhang, S. Tao, L. Yu and D. Deng, Nat. Synth., 2024, 3, 76–84 CrossRef.
- H. Kojima, N. Nakatsubo, K. Kikuchi, S. Kawahara, Y. Kirino, H. Nagoshi, Y. Hirata and T. Nagano, Anal. Chem., 1998, 70, 2446–2453 CrossRef CAS PubMed.
- L. J. Ignarro, J. M. Fukuto, J. M. Griscavage, N. E. Rogers and R. E. Byrns, Proc. Natl. Acad. Sci. U. S. A., 1993, 90, 8103–8107 CrossRef CAS PubMed.
- X. Song, C. Basheer, Y. Xia and R. N. Zare, Environ. Sci. Technol., 2024, 58, 16196–16203 CrossRef CAS.
- J. Li, Y. Xia, X. Song, B. Chen and R. N. Zare, Proc. Natl. Acad. Sci. U. S. A., 2024, 121, e2318408121 CrossRef CAS PubMed.
Footnote |
| † Electronic supplementary information (ESI) available. See DOI: https://doi.org/10.1039/d4sc06989g |
| This journal is © The Royal Society of Chemistry 2024 |

