The near field response of molecules coupled with plasmons at atomistic resolution†
Huijie
He
a,
Xueyang
Zhen
a,
Shuang
Li
a,
Sibing
Chen
a and
Xing
Chen
 *ab
*ab
aInstitute of Molecular Plus, School of Chemical Engineering and Technology, Haihe Laboratory of Sustainable Chemical Transformations, Tianjin University, Tianjin 300192, P. R. China
bTianjin Key Laboratory of Low-Dimensional Electronic Materials and Advanced Instrumentation, Tianjin 300192, P. R. China. E-mail: xing_chen@tju.edu.cn
First published on 4th November 2024
Abstract
The interaction between nanoparticles on mirror (NPoM) nanostructures and molecules is of great significance for the development of plasmon-enhanced spectroscopy (PES) techniques. However, the coupling mechanism between resonantly excited molecules and plasmonics has not been fully understood. In this work, we took viologen molecules within an Au plasmonic nanocavity (AuNC) as an example to illustrate how resonant molecules influence the near-field distributions. We found that the near-fields are highly enhanced and the near-field distributions are altered when the monocationic viologen (V+˙) is in resonance. In the AuNC, the near-field enhancement of a molecule is significantly enhanced by the adjacent molecules. However, the average near-field enhancements experienced by each molecule decrease with the increasing coverage of the molecular monolayer. Furthermore, the contributions of molecules to the near-field enhancement initially increase and then decrease as coverage increases. The interactions between the molecules and the nanocavity exhibit negative contributions to near-field enhancement. Overall, this work offers valuable insights into the impact of resonantly excited molecules on near-field enhancements in nanocavities and offers guidance for tuning excitation wavelength. We propose that the resonance state and coverage of molecules are critical to improving the sensitivity and specificity of PES techniques.
New conceptsUnderstanding the mechanism of plasmon–molecule interactions within a plasmonic nanocavity is crucial for enhancing the sensitivity and specificity of plasmon-enhanced spectroscopy (PES). However, established theoretical models often treat molecules as a homogeneous medium, lacking the atomistic details necessary for accurately capturing molecular interactions and their impact on near-field distributions. Our study employed the discrete interaction model to provide an atomistic perspective of molecules interacting with plasmonic nanostructures. We discovered that as molecular coverage increases, the formation of a monolayer reduces the average near-field enhancement experienced by each molecule, although individual molecule contributions initially rise before declining. Resonantly excited molecules were found to diminish the nanocavity's contributions to the total near-field enhancement, while non-resonant molecules led to a slight increase. Furthermore, interactions between the molecules and Au nanocavities resulted in negative contributions to the overall near-field enhancement. These findings offer valuable insights for tuning excitation wavelengths, optimizing molecular coverage, and refining molecule–plasmon interactions to enhance PES performance. |
1 Introduction
Light interacting with noble metals induces a collective coherent oscillation of the free electrons in the nanoscale system. The surface plasmons are confined at a subwavelength scale near the nanostructures and are significantly enhanced.1–4 Utilizing the extremely strong and localized near-field, the plasmon-enhanced spectroscopy (PES) techniques, such as surface-enhanced Raman spectroscopy (SERS) and surface-enhanced fluorescence spectroscopy (SEF), have been developed rapidly.5–12 The highly confined near-fields can map molecular vibrations with sub-nanometric spatial resolution in tip-enhanced Raman scattering (TERS).13,14 Moreover, the localized fields strongly coupled with single-molecule excitations lead to prominent absorption splitting.15–18 The near-field confinement modifies the traditional optical selection rules in far-field spectroscopy and the near-field spacial distributions play a key role in plasmon imaging and molecular recognition techniques.19–22The nanoparticles on mirrors (NPoMs) are a typical plasmonic system leading to strong confinement of gap plasmons.23–27 The near-field distributions in a nanocavity, with respect to a horizontal (xy) plane and a vertical (z) direction, can be tailored by manipulating the morphologies, separations, chemical compositions, and environments.28,29 The large curvature of the nanostructure leads to highly confined field in the nanocavity. The homogeneous field distributions are typically probed by near-field spectroscopies. The fields in the horizontal plane are strongly correlated with TERS images of single molecules lying down in the nanocavity,30 while the fields along the vertical direction heavily rely on molecules in a standing orientation. However, the probing molecules modify the plasmon fields due to mutual interactions between the nanocavity-confined molecules and the localized plasmons. PES relies on molecule–plasmon interactions, and plasmons coupled with molecules in a nanocavity have received rapidly growing interest in recent years.31–35 However, it is challenging to quantify how large near-fields change upon interacting with molecules experimentally.
There are several mature models for theoretically simulating the optical response of plasmons coupled with molecules. For instance, the quantum-corrected electrodynamics (QCE) and generalized nonlocal optical response (GNOR) models treat the molecules as a homogeneous environment. Instead of homogeneous description for molecules, the discrete interaction model (DIM) provides atomistic representation for the plasmonic nanostructure coated with molecules. In this model, all atoms are equally treated as a collection of dipoles in spherical charge distributions.36–39 The discrete interaction model/quantum mechanics (DIM/QM) method treats molecules with QM and nanoparticles with DIM. In this method, molecules are fully described by QM, which does not rely on parameters, compared to classical electromagnetic methods with quantum corrections.40 Based on the quantum chemistry, QM effectively handles electron correlation and naturally captures the quantum effects. This method is successful in calculating the optical responses of molecules on plasmonic nanoparticles.41–44 The interaction of plasmons with non-resonant molecules has been investigated using DIM previously.36 The screening effect from molecules has been shown to drastically modify the near-field distributions. However, little is known about how the resonant molecules affect the near-field distributions in a nanocavity.
This work focuses on the interaction between N-alkyl-N′-(n-thioalkyl)-4,4′-bipyridinium bromide (viologen class) and Au plasmonic nanocavities (AuNCs) using DIM/QM and DIM. These viologens are designated as HS-nV(16-n), with the variable n indicating the count of carbon atoms situated between the terminal thiol group and the bipyridine unit. Specifically, a series of models were constructed to investigate the interaction between monocationic viologen (V+˙) molecules and the AuNC. The bipyridine moiety is used as a probe to measure the near-field enhancement within the AuNC. We found that the near-field distributions in the AuNC are altered by the molecular excitation. In the AuNC, one molecule experiences increasing near fields as the other molecule approaches. Furthermore, the V+˙ monolayer density is precisely controlled to investigate the relationship between the molecular coverage and the near-field enhancement. The contributions of the AuNC to the total near-field enhancements are smaller when the molecules are in a resonant state compared to that when they are in a non-resonant state. However, the negative contribution arising from the interaction between the molecules and the AuNC is also substantially more pronounced under the non-resonant conditions. The understanding of the interactions between plasmons and molecules being (non)-resonance in this work is crucial for regulating the near-field properties of nanocavities by adjusting the excitation wavelength and molecular coverage. This is of great significance for promoting the development of PES techniques.
2 Methods
In this study, the NWCHEM software package45 was used for the structure optimization and frequency analysis of the viologens with the Becke three parameter Lee–Yang–Parr (B3LYP) exchange–correlation functional and the 6-311G** basis set. The static polarizability, vertical excitation energy, and damped frequency-dependent polarizability of the molecule were calculated using the Becke–Perdew 86 (BP86) exchange–correlation functional46,47 and the triple-ζ polarized (TZP) Slater-type basis set in the Amsterdam Density Functional (ADF) package.48,49 The lifetime of excited states was set as Γ = 0.1 eV. The plasmon response of the AuNC coupled with single molecules was simulated by the DIM/QM method. The single molecule was described at the BP86/TZP level of QM, while the AuNC was modeled using the DIM approach. Additionally, multiple molecules embedded within the AuNC were simulated using the DIM method. Molecular dynamics simulations of V+˙ molecular monolayer formation on the Au(111) surface were performed with LAMMPS software.50 All of the modeling systems were equilibrated for 300 ps at a temperature of 300 K using the canonical (NVT) ensemble, where the number of atoms (N), the volume of the simulation box (V), and temperature (T) were kept constant. A velocity Verlet algorithm with a time step of 0.5 fs was employed, and the temperature was maintained using a Nosé–Hoover thermostat with a damping constant of 100 fs.DIM represents the nanocavity and molecule as a collection of interacting atoms, and the principle of DIM is described below. The atomic polarizability (αI) of Au can be written as,
 | (1) |
 | (2) |
The parameterization of RI and ε is taken from our previous work.36 The atomic polarizability of molecules using the Lorentzian model can be written as,
 | (3) |
 | (4) |
 | (5) |
According to the above formula, the optical absorption across section at any frequency (ω) can be written as,
 | (6) |
The near-fields around the nanoparticles were obtained directly from the atomic dipoles by using either the renormalized interaction tensor for the DIM or the bare interaction tensor for discrete-dipole approximation (DDA). The near-field at a grid point is defined by,
 | (7) |
 | (8) |
 | (9) |
3 Results and discussion
3.1 Parameter optimization
The polarizability of the n8 V+˙ viologen from DFT is used as the reference value, and the atomic polarization radius (R) and Lorentz parameter (fn, Γn, Ω0,n) are fitted using the Amoeba algorithm as the calculation parameter of DIM. The optimized parameters are shown in Table 1. The average static near-field of the n8 V+˙ viologen bipyridine site, as calculated by DIM, highly agrees with the results obtained from DFT calculations (Fig. S1a, ESI†). Under vertical excitation, the vertical orientation of V+˙ viologens results in the remarkable polarization along the z-axis, so the zz component of polarizability is the focus of the following discussion. According to Fig. S1b (ESI†), it can be seen that the difference in static polarizability of the V+˙ viologens obtained by DIM and QM in the zz direction is less than 10%. For frequency-dependent polarizability fitting, the Lorentzian model was employed. The absorption values of the n8 V+˙ viologen calculated by DIM and QM are both around 465 nm (Fig. S2, ESI†), suggesting that the DIM predicts a reliable optical response of V+˙ viologens.| Cb | C | H | N | S | |
|---|---|---|---|---|---|
| Cb is the carbon atoms on the bipyridine. | |||||
| R | 0.895505 | 0.830080 | 0.221131 | 0.950183 | 0.898453 |
| f n | 0.001040 | 0.001012 | 0.002319 | 0.002589 | 0.000024 |
| Ω 0,n | 0.099005 | 0.102076 | 0.015817 | 0.567590 | 0.000794 |
| Γ n | 0.006213 | 0.005126 | 4.27 × 10⁻⁷ | 0.059667 | 0.000130 |
3.2 Plasmonic response of the AuNC
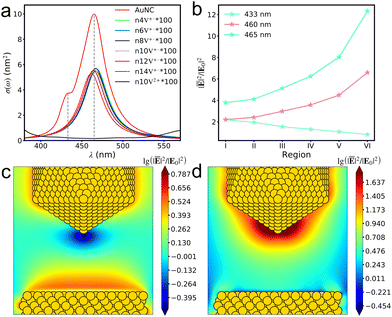
The AuNC with a tip-to-face configuration comprises an Au(111) surface and an Au nanoparticle. The absorption spectrum of AuNC ranges from 390 to 540 nm, with an intense absorption peak at 465 nm, mainly attributed to the plasmon resonance of the Au nanoparticle (Fig. 1a). The weak absorption peak at 433 nm primarily arises from the response of the Au(111) surface. Similarly, the absorption of V+˙ viologens ranges from 390 to 540 nm (Fig. 1a), showing good overlap with the absorption spectrum of the AuNC. However, when the V+˙ viologen is further oxidized to the V2+ viologen species, the optical response at 400–540 nm becomes ambiguous.The near-field enhancements in a 2 × 6 × 18 Å3 (x × y × z) region in the AuNC were investigated. The lower boundary of the region is approximately 8.2 Å away from the Au(111) surface, while the upper boundary is around 5.3 Å from the Au tip. Additionally, the region is divided into six subregions, each with a height of 7 Å with portion overlaps, according to the bipyridine's dimension. The average field enhancements in different regions are plotted in Fig. 1b. It should be noted that the average fields get stronger from the substrate to tip under an excitation wavelength of 465 nm due to the plasmonic response of the Au tip. In contrast, the average field enhancements from the surface plasmon resonance of the Au(111) surface at 433 nm are quite weak and rapidly decay away from the substrate. The asymmetric pattern of the average field variation arises from the asymmetry of the nanocavity. The field longitudinal distributions within the junction are inhomogeneous, in alignment with previous studies.34 The correlation of near-field against excitation wavelength can be intuitively understood by plotting the field distributions in the xz plane (Fig. 1c–d). The different excitation wavelengths give rise to the distinct plasmonic response related to the substrate and tip within the AuNC, respectively.
3.3 Viologens in the plasmonic junction
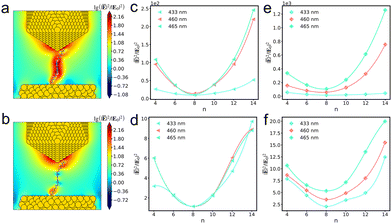
As depicted in Fig. 2, the V+˙ and V2+ viologen molecules are positioned vertically in the plasmonic junction. Taking an n8 viologen in a junction as an example, the changes in the average fields near the bipyridine site were investigated at 465 nm excitation. In comparison with a V2+ viologen, the near fields of AuNC with V+˙ are significantly enhanced due to V+˙ being resonance with plasmon excitation at 465 nm, as illustrated in Fig. 2a. However, for the junction with an n8 V2+ viologen, which is weakly resonance with plasmon excitation, the field enhancements around bipyridine are trivial (Fig. 2b).To quantitatively analyze the field longitudinal distributions of the AuNC with viologens, we calculated the average field enhancements in the vicinity of bipyridine of viologen isomers in/without the presence of the AuNC at different excitation energies (Fig. 2c–f). Overall, the pattern of near-field variations for a viologen molecule in an AuNC resembles that of a free molecule. However, upon closer examination of the variations, the relative field enhancements among the different viologen isomers are quite different. When the V+˙ viologen is in resonance with plasmon excitation, the fields are significantly enhanced compared to that of the bare AuNC (Fig. 1b). The field variations in the free V+˙ viologen basically follow the polynomial function (Fig. 2c). The remarkable variations occur at 460 and 465 nm in free molecules and the field variations from n4 to n14 exhibit an essentially symmetric pattern, where n4 and n6 resemble n12 and n10, respectively. However, the symmetric pattern breaks due to inhomogeneous field distributions in the junction.34 When the bipyridine moiety gets close to the tip, the fields are significantly enhanced, particularly at 465 nm where the near fields are strongly localized on the tip compared to the field distributions at 460 nm (Fig. 2e). Furthermore, the fields rapidly increase from n10 to n14. As a result, the field enhancement ratios of n10 to n6 and n12 to n4 increase to 1.47 and 1.83, respectively. The near-field intensity of the free V2+ viologen is determined by both the real and imaginary components of their polarizability, reflecting the exciton mode properties. Under the closely similar excitation wavelengths of 460 and 465 nm, the exciton modes are nearly identical. However, at a distinctly different excitation wavelength of 433 nm, the exciton mode exhibits different properties (Fig. 2d). As the V2+ viologens are weakly resonant with the plasmon excitation, the average fields are slightly enhanced compared to those of the bare AuNC. At 465 nm excitation, the field enhancements in the junction with n12 and n10 V2+ viologens are stronger than those with n4 and n6 V2+ viologens (Fig. 2f). Generally, the average field variations of the AuNC with viologens, ranging from n4 to n14, are predominantly influenced by the molecular excitation. The near-field enhancements from AuNCs slightly alter the relative field enhancements among the different isomers.
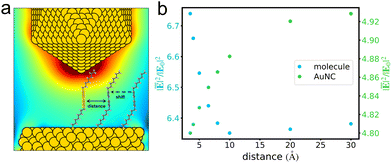
The coupling effects between molecules on the average fields in a junction were investigated by using DIM. Taking a pair of n8 V+˙ viologens as an example, we correlated the pair's separation with the average field enhancement around the bipyridine which is appropriately pointed by the tip (Fig. 3a). As shown in Fig. 3b, when two n8 molecules are well separated from each other, the average field enhancements are not influenced by the other one. However, as the pair's separation decreases, a gradual variation in the average field enhancements is observed. When the separation further shrinks from 10 Å, a drastic rise occurs in the field enhancements. We then explored the AuNC's average field enhancements influenced by the pair's separations. The average field enhancements in the region around bipyridine of n8 under the tip were calculated. It is observed that when the pair of molecules are largely separated, the average field enhancements are stronger, indicating that the screening effect in the presence of molecules is insignificant. With the pair's separation decreasing, the field enhancements drastically drop, indicating that the screening effect has a significant impact on the AuNC's own fields.
3.4 The coverage of V+˙ viologens
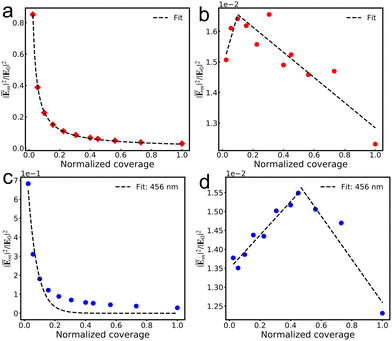
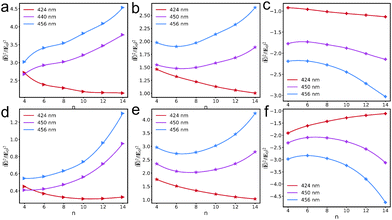
We used an n4 V+˙ viologen as a representative example to further explore the impact of viologen monolayer coverage on the near fields within the AuNC. We tuned the plasmon resonance at 456 nm to align with the excitation of V+˙ aggregation (Fig. S3, ESI†). Additionally, the excitation wavelength aligns with the maximum absorption of each V+˙ aggregation, and the selected region's sizes in the junction to quantify the average field enhancements are identical across all systems.Fig. 4a and c illustrate the gradual decrease in the average fields experienced by each molecule with increasing viologen coverage within the AuNC, indicating that dense coverage results in weaker average fields. This conclusion is consistent with that of previous work on the effect of molecular adsorption concentration on the Raman signal per molecule.51 Moreover, the elimination of background contributions from the bare AuNC allows for the correlations of near field with the molecular own response, as shown in Fig. 4b and d. The contributions from the n4 viologen to the average field enhancements of different coverage remarkably alter the relation between field enhancement and coverage. We use lines to fit the data and find the turnover point where the trend reverses. It is illustrated that an increasing molecular coverage in the AuNC amplifies the individual contribution of each molecule to the average near-field before a critical coverage threshold. However, the individual contributions of each molecule to the average fields undergo a diminishing trend with further increases in coverage, reflecting the effect of the number of molecules on their interactions with the cavity's local field. This suggests that the control of the near-field enhancements in a junction is achievable through precise manipulation of the molecular arrangement and coverage.
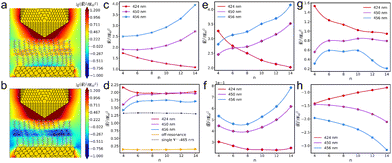
We then focus on the field distributions in the AuNC with a V+˙ monolayer. When the V+˙ molecular aggregation is in resonance with the AuNC excitation, the near fields in the vicinity of excited bipyridine are remarkably enhanced (Fig. 5a), which verifies the self-focusing effect of individual molecules at the atomistic level.34 However, when the V+˙ aggregation is not in resonance with plasmon excitation, a notable screening effect is present in the near fields (Fig. 5b). The near-field variations in the bare AuNC are dependent on the excitation wavelength. When at the tip resonance, the near fields increase as one gets closer to the tip. However, at the substrate resonance, the near fields decrease as the distance to the tip reduces (Fig. 5c). Fig. 5d illustrates the near-field variations of the V+˙ aggregations at different excitation wavelengths. The near fields of the aggregations exhibit stronger enhancements compared to their single-molecule counterparts. For the sake of simplifying data fitting, it is assumed that all parameters for the V+˙ isomers are identical. Accordingly, the near-field enhancements for individual V+˙ isomers are nearly indistinguishable from one another. Comparing the near-field enhancements in the bare AuNC (Fig. 5c) to those in the V+˙ monolayer, we observe that the average field enhancements are stronger at the resonant state of the V+˙ monolayer within the AuNC (Fig. 5e and g), and the trend of near-field variations is similar to that in the bare AuNC. However, the field enhancements are significantly suppressed under the non-resonance condition (Fig. 5f), and the screening effect is prominent in the AuNC (Fig. 5h).
To elucidate the contributions to the near-field distribution, the total near-field enhancements (Fig. 5e and f) can be further partitioned into three components: the contribution of the monolayer (Fig. 6a and d), the contribution of the AuNC (Fig. 6b and e), and the interaction between the AuNC and the monolayer (Fig. 6c and f). As shown in Fig. 6a and d, the contributions of the resonantly excited monolayer are primarily larger than the counterparts of the monolayer being non-resonant inside the AuNC. However, the contributions of the AuNC influenced by the resonantly excited monolayer are weaker than the counterparts influenced by the monolayer being non-resonant, which are even stronger than those in the bare AuNC. Furthermore, the interaction between the AuNC and the monolayer brings the negative contribution to the total near-field enhancement, with a more negative contribution when the monolayer is not in resonance.
4 Conclusions
In this work, we systematically investigated the interactions between viologens and the AuNC at atomic resolution. The near field enhancements of a single resonantly excited V+˙ viologen and the monolayer within the AuNC are larger than their counterparts of the single V2+ viologen and the V+˙ monolayer being non-resonant. In an AuNC, the near-field variations induced by a molecule closely follow the molecule's own near-field variation pattern at different excitation wavelengths. For a molecular dimer, the near-field enhancement of one molecule markedly increases when it is in close proximity to the other. The formation of a monolayer leads to decreasing average fields experienced by molecules within a nanocavity with increasing coverage density. However, the contribution of individual molecules to the near-field enhancement does not increase linearly, which initially rises and then declines with increasing coverage. Additionally, the resonant molecules reduce AuNC's contribution to the total near-field enhancement, while the non-resonant molecules slightly enhance the contribution. The interaction between the molecules and the AuNC leads to negative contributions to the total near-field enhancements. Our findings provide insights into understanding the field interactions between the AuNC and molecules being (non)-resonant, and tuning excitation wavelengths and molecular coverage will preciously control PES technology and sub-nanometer probes.Author contributions
X. C. conceived the basic idea, H. H. did the implementation and ran the simulations, X. C., H. H., X. Z., S. L., and S. C. analysed the results, and H. H. and X.C. wrote the manuscript.Data availability
The data supporting this article have been included as part of the ESI.†Conflicts of interest
There are no conflicts to declare.Acknowledgements
This work is supported financially by the National Natural Science Foundation of China (Grant 22003047, 22473084). X. C. thanks the Haihe Laboratory of Sustainable Chemical Transformations for financial support and Tianjin University for the startup funding. This work was also partially supported by the Graduate Top-notch Innovation Award Plan in Liberal Arts and Science of Tianjin University (B2-2022-011).References
- N. Jiang, X. Zhuo and J. Wang, Chem. Rev., 2018, 118, 3054–3099 CrossRef CAS.
- J.-E. Park, J. Kim and J.-M. Nam, Chem. Sci., 2017, 8, 4696–4704 RSC.
- T. You, Y. Gao, H. Chen and P. Yin, Plasmonics, 2021, 16, 1231–1239 CrossRef CAS.
- X. Wang, S.-C. Huang, S. Hu, S. Yan and B. Ren, Nat. Rev. Phys., 2020, 2, 253–271 CrossRef.
- A. B. Zrimsek, N. Chiang, M. Mattei, S. Zaleski, M. O. McAnally, C. T. Chapman, A.-I. Henry, G. C. Schatz and R. P. Van Duyne, Chem. Rev., 2017, 117, 7583–7613 CrossRef CAS PubMed.
- C. Zhan, X.-J. Chen, J. Yi, J.-F. Li, D.-Y. Wu and Z.-Q. Tian, Nat. Rev. Chem., 2018, 2, 216–230 CrossRef.
- R. D. Rodriguez, C. J. Villagómez, A. Khodadadi, S. Kupfer, A. Averkiev, L. Dedelaite, F. Tang, M. Y. Khaywah, V. Kolchuzhin, A. Ramanavicius, P.-M. Adam, S. Gräfe and E. Sheremet, ACS Photonics, 2021, 8, 2243–2255 CrossRef CAS.
- J. Langer, D. Jimenez De Aberasturi, J. Aizpurua, R. A. Alvarez-Puebla, B. Auguié, J. J. Baumberg, G. C. Bazan, S. E. J. Bell, A. Boisen, A. G. Brolo, J. Choo, D. Cialla-May, V. Deckert, L. Fabris, K. Faulds, F. J. García De Abajo, R. Goodacre, D. Graham, A. J. Haes, C. L. Haynes, C. Huck, T. Itoh, M. Käll, J. Kneipp, N. A. Kotov, H. Kuang, E. C. Le Ru, H. K. Lee, J.-F. Li, X. Y. Ling, S. A. Maier, T. Mayerhöfer, M. Moskovits, K. Murakoshi, J.-M. Nam, S. Nie, Y. Ozaki, I. Pastoriza-Santos, J. Perez-Juste, J. Popp, A. Pucci, S. Reich, B. Ren, G. C. Schatz, T. Shegai, S. Schlücker, L.-L. Tay, K. G. Thomas, Z.-Q. Tian, R. P. Van Duyne, T. Vo-Dinh, Y. Wang, K. A. Willets, C. Xu, H. Xu, Y. Xu, Y. S. Yamamoto, B. Zhao and L. M. Liz-Marzán, ACS Nano, 2020, 14, 28–117 CrossRef CAS PubMed.
- Á. I. López-Lorente, Anal. Chim. Acta, 2021, 1168, 338474 CrossRef.
- M. Usman, J.-W. Tang, F. Li, J.-X. Lai, Q.-H. Liu, W. Liu and L. Wang, J. Adv. Res., 2023, 51, 91–107 CrossRef CAS PubMed.
- J.-F. Li, C.-Y. Li and R. F. Aroca, Chem. Soc. Rev., 2017, 46, 3962–3979 RSC.
- K. Trofymchuk, K. Koł
![[a with combining cedilla]](https://www.rsc.org/images/entities/char_0061_0327.gif) t
t![[a with combining cedilla]](https://www.rsc.org/images/entities/char_0061_0327.gif) j, V. Glembockyte, F. Zhu, G. P. Acuna, T. Liedl and P. Tinnefeld, ACS Nano, 2023, 17, 1327–1334 CrossRef CAS.
j, V. Glembockyte, F. Zhu, G. P. Acuna, T. Liedl and P. Tinnefeld, ACS Nano, 2023, 17, 1327–1334 CrossRef CAS. - S. Duan, G. Tian and Y. Luo, Angew. Chem., Int. Ed., 2016, 55, 1041–1045 CrossRef CAS.
- S. Duan, G. Tian and Y. Luo, Chem. Soc. Rev., 2024, 53, 5083–5117 RSC.
- R. Zhang, Y. Zhang, Z. C. Dong, S. Jiang, C. Zhang, L. G. Chen, L. Zhang, Y. Liao, J. Aizpurua, Y. Luo, J. L. Yang and J. G. Hou, Nature, 2013, 498, 82–86 CrossRef CAS PubMed.
- T. P. Rossi, T. Shegai, P. Erhart and T. J. Antosiewicz, Nat. Commun., 2019, 10, 3336 CrossRef PubMed.
- Y. Zou, G. Song, R. Jiao, G. Duan and L. Yu, Nanoscale Res. Lett., 2019, 14, 74 CrossRef.
- J. Fregoni, T. S. Haugland, S. Pipolo, T. Giovannini, H. Koch and S. Corni, Nano Lett., 2021, 21, 6664–6670 CrossRef CAS PubMed.
- S. Duan, G. Tian, Y. Ji, J. Shao, Z. Dong and Y. Luo, J. Am. Chem. Soc., 2015, 137, 9515–9518 CrossRef CAS.
- J. Lee, K. T. Crampton, N. Tallarida and V. A. Apkarian, Nature, 2019, 568, 78–82 CrossRef CAS.
- Y. Zhang, B. Yang, A. Ghafoor, Y. Zhang, Y.-F. Zhang, R.-P. Wang, J.-L. Yang, Y. Luo, Z.-C. Dong and J. G. Hou, Natl. Sci. Rev., 2019, 6, 1169–1175 CrossRef CAS.
- B. Yang, G. Chen, A. Ghafoor, Y. Zhang, Y. Zhang, Y. Zhang, Y. Luo, J. Yang, V. Sandoghdar, J. Aizpurua, Z. Dong and J. G. Hou, Nat. Photonics, 2020, 14, 693–699 CrossRef CAS.
- R. Chikkaraddy, B. De Nijs, F. Benz, S. J. Barrow, O. A. Scherman, E. Rosta, A. Demetriadou, P. Fox, O. Hess and J. J. Baumberg, Nature, 2016, 535, 127–130 CrossRef CAS.
- J. T. Hugall, A. Singh and N. F. Van Hulst, ACS Photonics, 2018, 5, 43–53 CrossRef CAS.
- O. Bitton, S. N. Gupta and G. Haran, Nanophotonics, 2019, 8, 559–575 CrossRef CAS.
- F.-L. Zhang, J. Yi, W. Lin, E.-M. You, J.-S. Lin, H. Jin, W. Cai, Z.-Q. Tian and J.-F. Li, Nano Today, 2022, 44, 101464 CrossRef CAS.
- S. Chen, P. Li, C. Zhang, W. Wu, G. Zhou, C. Zhang, S. Weng, T. Ding, D.-Y. Wu and L. Yang, Nano Lett., 2023, 23, 5445–5452 CrossRef CAS.
- H. Hu, Y. Xu, Z. Hu, B. Kang, Z. Zhang, J. Sun, Y. Li and H. Xu, Nanophotonics, 2022, 11, 5153–5163 CrossRef CAS.
- W. Peng, J.-W. Zhou, M.-L. Li, L. Sun, Y.-J. Zhang and J.-F. Li, Chem. Sci., 2024, 15, 2697–2711 RSC.
- X. Chen, P. Liu, Z. Hu and L. Jensen, Nat. Commun., 2019, 10, 2567 CrossRef PubMed.
- F. Zhang, J. Yi, W. Peng, P. M. Radjenovic, H. Zhang, Z. Tian and J. Li, Angew. Chem., 2019, 131, 12261–12265 CrossRef.
- X. You, W. Peng, J.-X. He, J.-S. Lin, X.-Q. Zong, N. Zhao, J.-L. Yang, M.-D. Li, Y.-J. Zhang, J. Yi, H. Jin, Z.-Q. Tian and J.-F. Li, Nano Today, 2022, 45, 101548 CrossRef CAS.
- J. Yi, E.-M. You, S.-Y. Ding and Z.-Q. Tian, Natl. Sci. Rev., 2020, 7, 1228–1238 CrossRef CAS PubMed.
- C.-Y. Li, S. Duan, B.-Y. Wen, S.-B. Li, M. Kathiresan, L.-Q. Xie, S. Chen, J. R. Anema, B.-W. Mao, Y. Luo, Z.-Q. Tian and J.-F. Li, Nat. Nanotechnol., 2020, 15, 922–926 CrossRef CAS PubMed.
- B. Yang, G. Chen, A. Ghafoor, Y. Zhang, X. Zhang, H. Li, X. Dong, R. Wang, Y. Zhang, Y. Zhang and Z. Dong, Angew. Chem., Int. Ed., 2023, 62, e202218799 CrossRef CAS PubMed.
- X. Chen, J. E. Moore, M. Zekarias and L. Jensen, Nat. Commun., 2015, 6, 8921 CrossRef CAS.
- X. Chen and L. Jensen, J. Opt., 2016, 18, 074009 CrossRef.
- P. Liu, D. V. Chulhai and L. Jensen, ACS Nano, 2017, 11, 5094–5102 CrossRef CAS PubMed.
- X. Chen and L. Jensen, Nanoscale, 2018, 10, 11410–11417 RSC.
- R. Esteban, A. G. Borisov, P. Nordlander and J. Aizpurua, Nat. Commun., 2012, 3, 825 CrossRef PubMed.
- S. M. Morton and L. Jensen, J. Chem. Phys., 2010, 133, 074103 CrossRef.
- J. L. Payton, S. M. Morton, J. E. Moore and L. Jensen, Acc. Chem. Res., 2014, 47, 88–99 CrossRef CAS.
- D. V. Chulhai and L. Jensen, J. Phys. Chem. A, 2014, 118, 9069–9079 CrossRef CAS.
- H. Ye, J. C. Becca and L. Jensen, J. Chem. Phys., 2024, 160, 014707 CrossRef CAS PubMed.
- M. Valiev, E. Bylaska, N. Govind, K. Kowalski, T. Straatsma, H. Van Dam, D. Wang, J. Nieplocha, E. Apra, T. Windus and W. De Jong, Comput. Phys. Commun., 2010, 181, 1477–1489 CrossRef CAS.
- J. P. Perdew, Phys. Rev. B, 1986, 33, 8822–8824 CrossRef PubMed.
- A. D. Becke, Phys. Rev. A: At., Mol., Opt. Phys., 1988, 38, 3098–3100 CrossRef CAS PubMed.
- C. Fonseca Guerra, J. G. Snijders, G. te Velde and E. J. Baerends, Theor. Chem. Acc., 1998, 99, 391–403 Search PubMed.
- G. Te Velde, F. M. Bickelhaupt, E. J. Baerends, C. Fonseca Guerra, S. J. A. Van Gisbergen, J. G. Snijders and T. Ziegler, J. Comput. Chem., 2001, 22, 931–967 CrossRef CAS.
- H. Aktulga, J. Fogarty, S. Pandit and A. Grama, Parallel Comput., 2012, 38, 245–259 CrossRef.
- Y. Y. Wang, J. Jiang, J. Yin, N. Li, K. Yu, S. F. Quan, X. F. Yue and B. Zhong, J. Appl. Phys., 2019, 125, 244305 CrossRef.
Footnote |
| † Electronic supplementary information (ESI) available. See DOI: https://doi.org/10.1039/d4nh00451e |
| This journal is © The Royal Society of Chemistry 2025 |

